


1. Introduction
Measurements of the area and extent of glaciers in the form of glacier inventories provide crucial input data for quantifying glacier volume (e.g. Bahr and others, Reference Bahr, Meier and Peckham1997, Reference Bahr, Dyurgerov and Meier2009; Farinotti and others, Reference Farinotti, Huss, Bauder, Funk and Truffer2009; Radić and Hock, Reference Radić and Hock2010; Linsbauer and others, Reference Linsbauer, Paul and Haeberli2012; Vaughan and others, Reference Vaughan and Stocker2013) and modelling glacier mass change (e.g. Marzeion and others, Reference Marzeion, Jarosch and Hofer2012; Radić and others, Reference Radić2014), both of which are needed for estimates of the glacier contribution to sea-level rise. Moreover, repeat glacier inventories provide an important way to monitor and measure changes to the cryosphere (e.g. Paul and others, Reference Paul, Andreassen and Winsvold2011a; Nuth and others, Reference Nuth2013; Vaughan and others, Reference Vaughan and Stocker2013; Fischer and others, Reference Fischer, Huss, Barboux and Hoelzle2014; Gardent and others, Reference Gardent, Rabatel, Dedieu and Deline2014), and thereby to the climate system (e.g. IPCC, 2014).
For recent decades, glacier inventories can be compiled with relative ease and at chosen time intervals from satellite images that have been widely available since the 1970s (e.g. Rundquist and others, Reference Rundquist1980; Howarth and Ommanney, Reference Howarth and Ommanney1986; Paul and others, Reference Paul, Frey and Le Bris2011b; Pfeffer and others, Reference Pfeffer2014). Vertical aerial photographs, and topographic maps based on these, provide additional sources for glacier inventories that can also cover a few decades prior to the satellite era (e.g. Liestøl, Reference Liestøl, Hoel and Werenskiold1962; Østrem and Ziegler, Reference Østrem and Ziegler1969; Østrem and others, Reference Østrem, Haakensen and Melander1973; Andreassen and others, Reference Andreassen, Paul, Kääb and Hausberg2008; Paul and Andreassen, Reference Paul and Andreassen2009; Winsvold and others, Reference Winsvold, Andreassen and Kienholz2014). Extending glacier inventories even further back in time typically relies on the availability of 19th- and early-20th-century maps, which can contain valuable information on the historical extent of glaciers and enable glacier change to be assessed on a centennial timescale (e.g. Georges, Reference Georges2004; Andreassen and others, Reference Andreassen, Paul, Kääb and Hausberg2008; Tennant and others, Reference Tennant, Menounos, Wheate and Clague2012; Cullen and others, Reference Cullen2013; Winsvold and others, Reference Winsvold, Andreassen and Kienholz2014; Rastner and others, Reference Rastner, Joerg, Huss and Zemp2016; Tielidze, Reference Tielidze2016; Freudiger and others, Reference Freudiger, Mennekes, Seibert and Weiler2018; Weber and others, Reference Weber, Boston, Lovell and Andreassen2019). This is particularly important for placing the rates of 21st-century glacier decline in a broader context. Inventories produced from old maps might also reveal ‘disappeared’ glaciers that have completely melted away over the course of the last century, which could then be included in improved estimates of 20th-century sea-level rise (cf. Parkes and Marzeion, Reference Parkes and Marzeion2018).
Glacier inventories from historical maps are, in a strict sense, a representation of what the cartographers at the time chose to draw in as glacier ice (this is a noteworthy difference to most satellite-derived inventories, where semi-automatic image classification selects all existing snow and ice bodies, and it is up to the inventory creators to decide which to include/exclude). Their reliability therefore depends on, first, the quality of the historical map source and the precision of the original glacier mapping, and second, how thoroughly map uncertainties were assessed and taken into account by the inventory creators. The latter has been executed to varying degrees in previous work, with the approaches towards establishing glacier inventories from historical maps often being as different and unique as the map series they were derived from (e.g. Tennant and others, Reference Tennant, Menounos, Wheate and Clague2012; Cullen and others, Reference Cullen2013; Freudiger and others, Reference Freudiger, Mennekes, Seibert and Weiler2018). There is a tendency to presume the historical maps and their contents are essentially true, without further assessing the accuracy of the map source and the mapped glaciers beyond previously published material on the original surveys. It is also common for there to be little or no quantitative error assessments of the applied GIS routines, and/or no attempt to convert such error values into an overall inventory uncertainty (i.e. reporting glacier area without error terms). Occasionally, the publication date of the historical maps is confused with the date of the original map surveys, with the former erroneously taken as the timestamp of the reconstructed glacier extent.
In Norway, only a few attempts to produce early- or pre-20th-century glacier outlines from historical maps have been carried out, focusing on individual plateau icefields (Winsvold and others, Reference Winsvold, Andreassen and Kienholz2014; Weber and others, Reference Weber, Boston, Lovell and Andreassen2019). These studies used the 1 : 100 000 scale gradteigskartene (‘quadrangle maps’), which were Norway's main map series from the mid-1890s (Harsson and Aanrud, Reference Harsson and Aanrud2016). Here, this map series is employed to reconstruct the ~1899 (covering the period 1882–1916; hereafter 1899 inventory, using the median of the survey period) extent of glaciers in the county of Nordland, northern Norway. Nordland's glaciers make up a third (34%; 906 km2) of the total ice-covered area in Norway (2693 km2) (Andreassen and others, Reference Andreassen, Winsvold, Paul and Hausberg2012a). They play a central role in the county's hydropower generation (e.g. Kennett and others, Reference Kennett, Rolstad, Elvehøy and Ruud1997) and can cause jökulhlaups from glacier-dammed lakes with both destructive and beneficial consequences (Holmsen, Reference Holmsen1948; Liestøl, Reference Liestøl1956; Knudsen and Theakstone, Reference Knudsen and Theakstone1988; Engeset and others, Reference Engeset, Schuler and Jackson2005; Jackson and Ragulina, Reference Jackson and Ragulina2014). Inventories of glacier change are important for Nordland, as they can be used to help quantify the contribution of glaciers to runoff (cf. Huss, Reference Huss2011), with implications for hydropower supply, as well as helping to monitor the changing risks from glacier-related hazards.
The aims of our research are (1) to examine the history of the Nordland gradteigskartene maps and the accuracy of the mapped glaciers for their suitability as a glacier inventory; (2) to build a digital GIS inventory of the glacier outlines displayed on the old maps; (3) to independently evaluate the accuracy of the historical glacier extents from geomorphological data and early aerial photographs; (4) to compare the new dataset with existing glacier inventories in order to quantify 20th-century glacier change in Nordland and (5) to offer general recommendations for creating glacier inventories from historical map sources.
2. Study area and previous work
Nordland extends for ~500 km from 64° 56′ N to 69° 19.5′ N, with the northern half located within the Arctic Circle (Fig. 1). The county is nearly 38 200 km2 in area, which comprises ~12% of mainland Norway's land area. A significant portion of the glacier area in Nordland is contained within the large plateau icefields Vestre and Østre Svartisen, Blåmannsisen (Ålmåjalosjiegŋa) and Okstindbreen (Fig. 1).
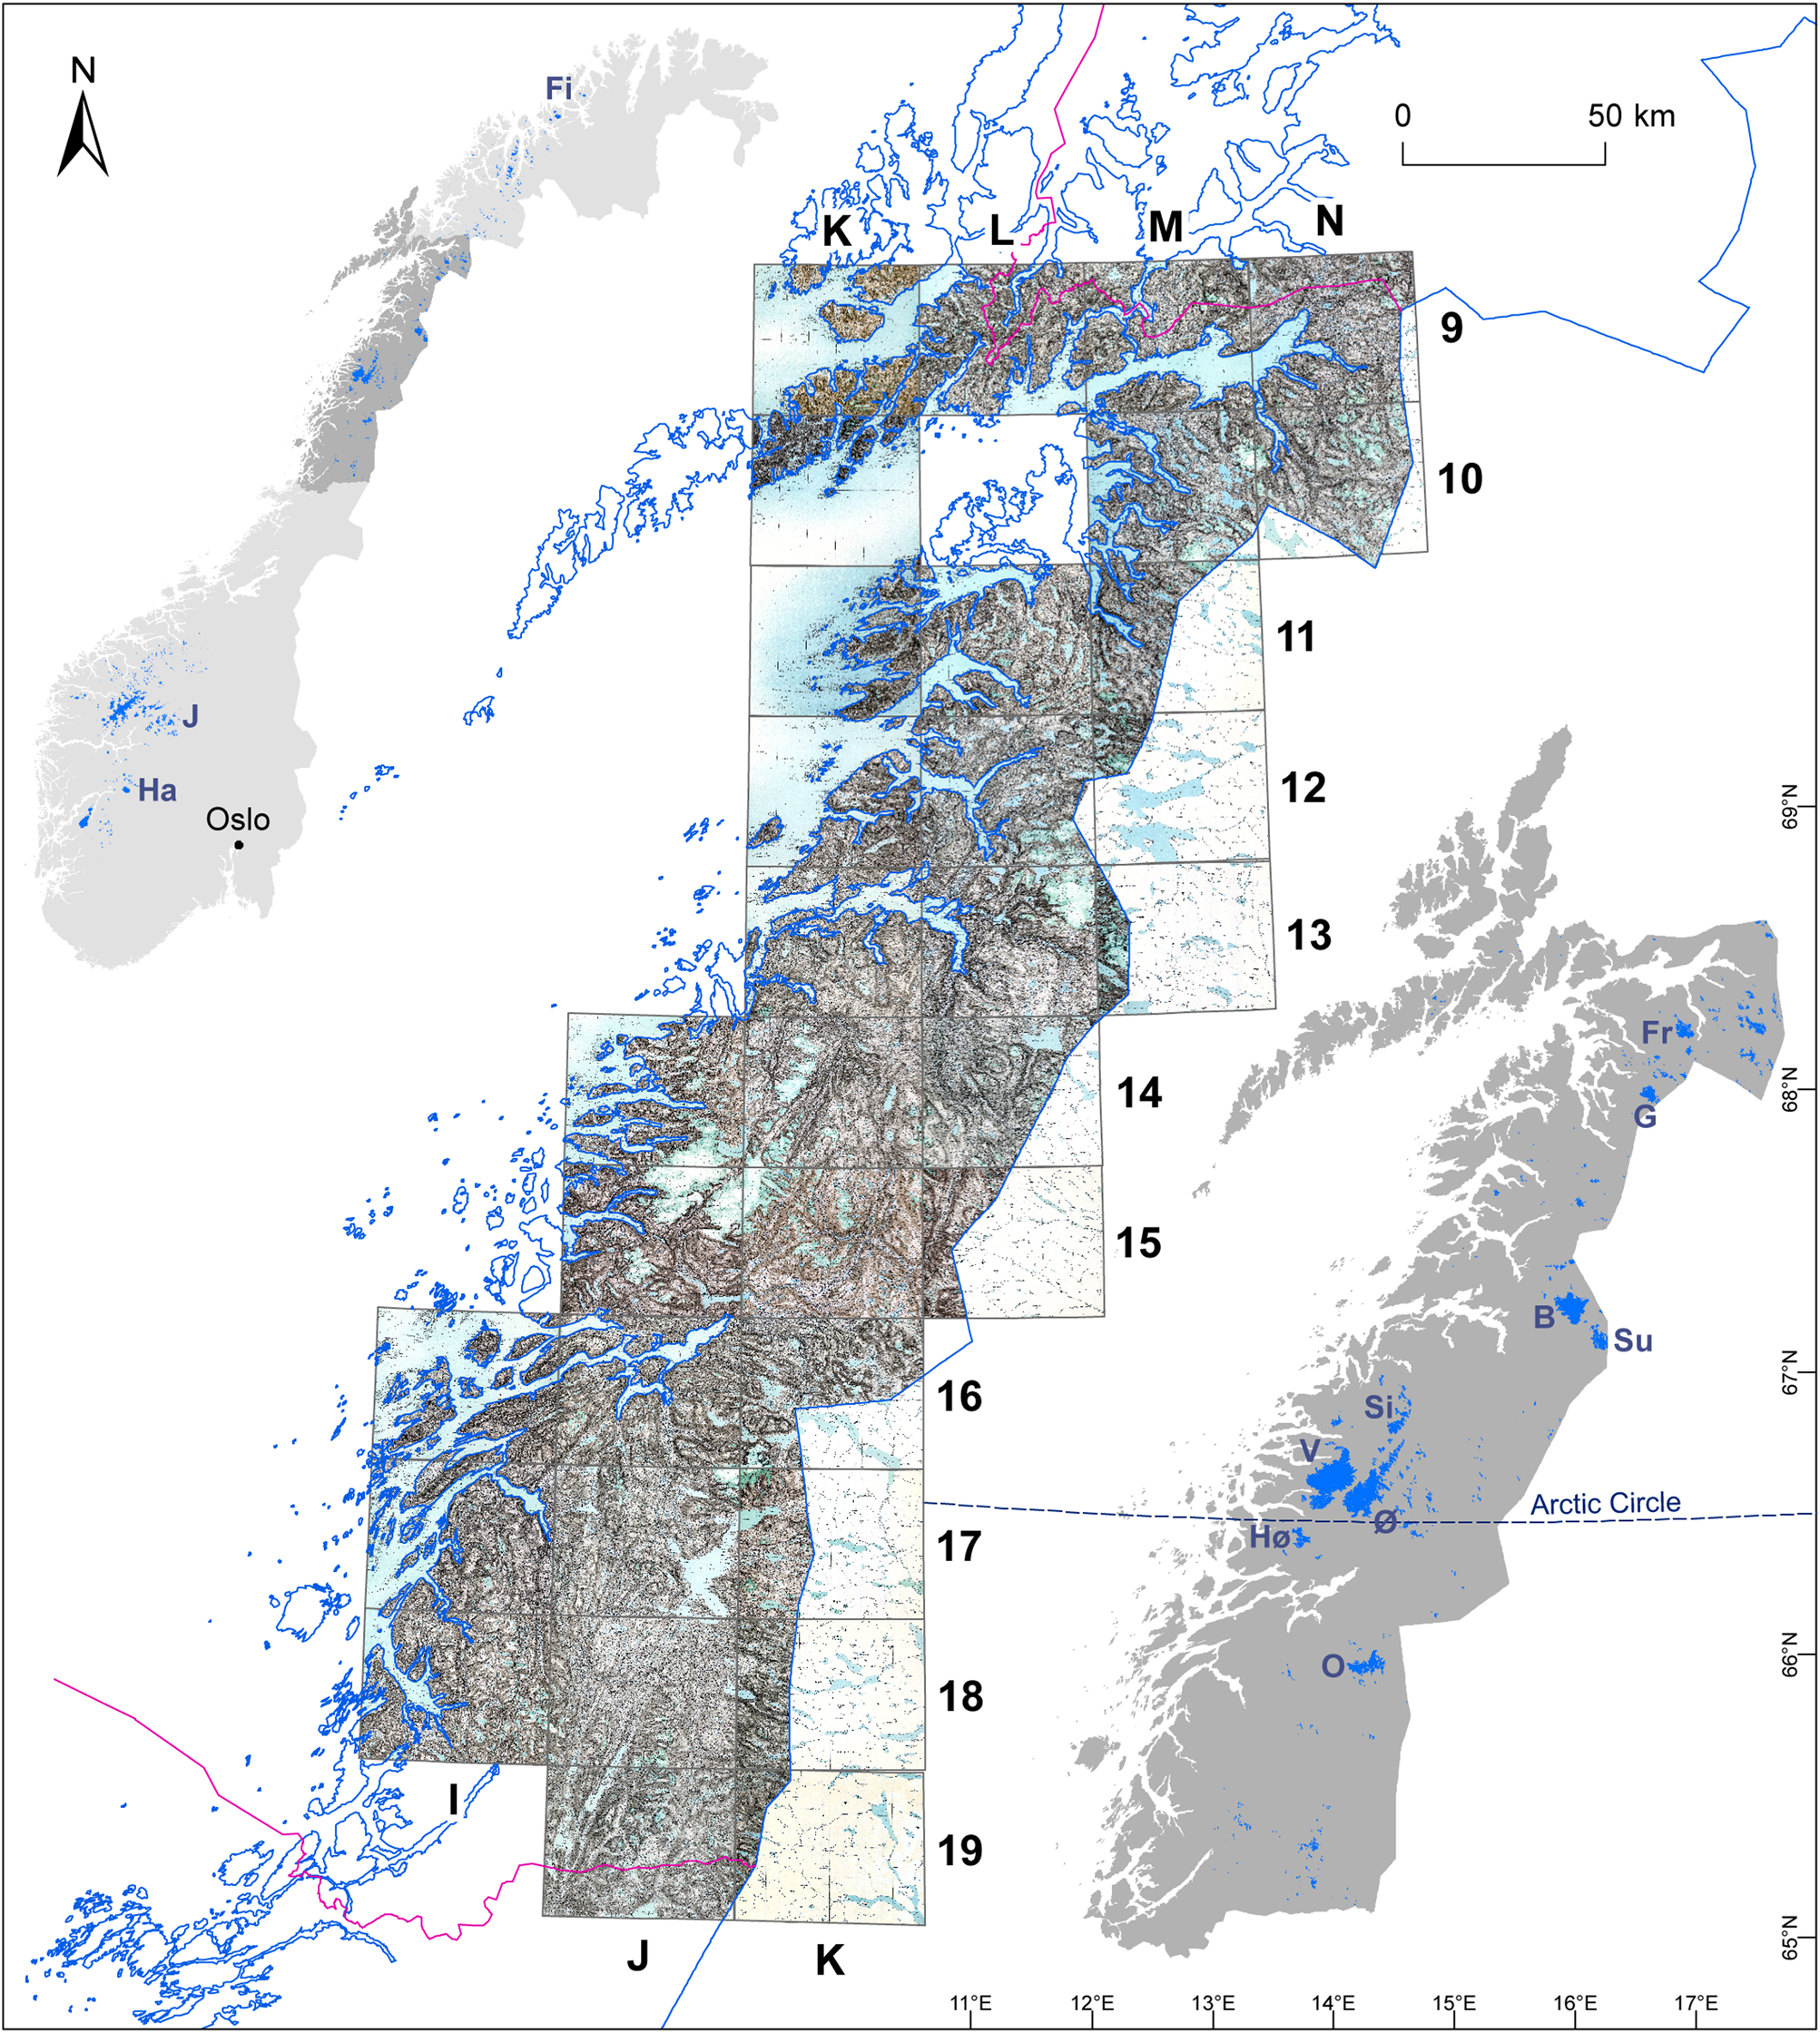
Fig. 1. Mosaic of all 33 historical Nordland gradteigskartene maps containing glaciers and used in this study. The map sheets are organised in an alphanumeric grid system. The inset maps show the location of ice masses in Norway (top-left) and Nordland (bottom-right). Glacier inventory data from Andreassen and others (Reference Andreassen, Winsvold, Paul and Hausberg2012a). Ice masses mentioned in this study are marked. Norway: Ha: Hardangerjøkulen; J: Jotunheimen glaciers; Fi: Plateau icefields in Finnmark. Nordland: O: Okstindbreen; Hø: Høgtuvbreen; Ø: Østre Svartisen; V: Vestre Svartisen; Si: Simlebreen; Su: Sulitjelmaisen (Sallajiegŋa); B: Blåmannsisen (Ålmåjalosjiegŋa); G: Gihtsejiegŋa; Fr: Frostisen (Ruostajiekŋa).
In ~2000, just over 2% of Nordland was covered by glacier ice, according to the inventory of Norwegian glaciers by Andreassen and others (Reference Andreassen, Winsvold, Paul and Hausberg2012a). This inventory was derived from 1999 to 2006 Landsat satellite imagery and shows the extent of Nordland's glaciers in 1999–2001 (created in part by Paul and Andreassen, Reference Paul and Andreassen2009). Additional GIS-based inventories of Nordland's glaciers are available for ~1976 (1967–85; created in part by Paul and Andreassen, Reference Paul and Andreassen2009) and 1988. These form part of the complete glacier inventories of Norway for ~1960 (1947–85; derived from topographic maps based on aerial photographs) and ~1990 (1988–97; derived from Landsat satellite imagery), respectively, by Winsvold and others (Reference Winsvold, Andreassen and Kienholz2014). Here, we use the dates 1976, 1988 and 2000 (the median of each acquisition time range) to refer to the respective Nordland subsets of the glacier inventories (Table 1). Nordland's glaciers are also included in an analogue glacier inventory covering the whole of northern Scandinavia in the period ~1952–71 (Østrem and others, Reference Østrem, Haakensen and Melander1973). This inventory only exists in tabular form without detailed maps of the glacier extent, and therefore could not be used in our GIS-based glacier change analysis. All glacier ID numbers used in this study to identify individual ice masses are taken from the Andreassen and others (Reference Andreassen, Winsvold, Paul and Hausberg2012a) inventory.
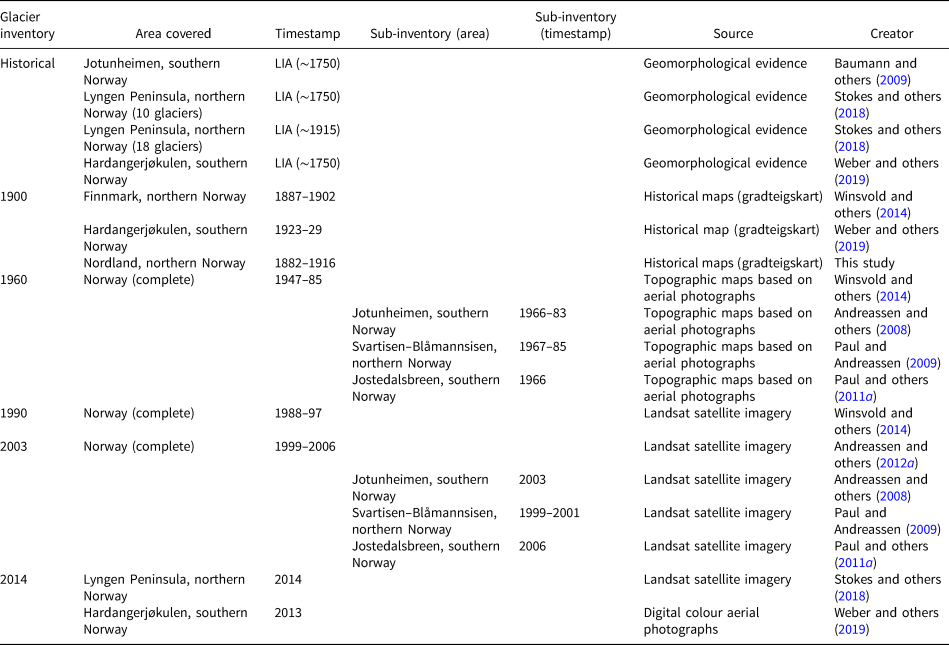
Table 1. Published inventories of Norwegian glaciers with available digital outlines
Nordland's glaciers experienced their last major expansion during the Little Ice Age (LIA) (e.g. Grove, Reference Grove2004). Historical records of a farm being destroyed by Vestre Svartisen's major outlet glacier Engabreen in the early 1720s (Rekstad, Reference Rekstad1892, Reference Rekstad1893, Reference Rekstad and Reusch1900), along with radiocarbon (Jansen and others, Reference Jansen, Dahl and Nielsen2018) and lichenometric (Winkler, Reference Winkler2003; Jansen and others, Reference Jansen, Simonsen, Dahl, Bakke and Nielsen2016) dates from the Svartisen area, Høgtuvbreen, and the glaciers in the Okstindan mountains, place the culmination of this glacier advance in the mid-18th century. Moraine evidence just outside the LIA limit of the Okstindan glaciers (Griffey, Reference Griffey1977; Griffey and Worsley, Reference Griffey and Worsley1978; Winkler, Reference Winkler2003; Bakke and others, Reference Bakke2010) and Engabreen (Worsley and Alexander, Reference Worsley and Alexander1976) demonstrates that the LIA advance of these ice masses was preceded by a slightly more extensive Neoglacial advance, dated to ~ad 700 at Austre Okstindbreen (Bakke and others, Reference Bakke2010). The first scientific observations on many of the glaciers of Svartisen and Okstindan were made by early explorers, geologists and glaciologists from the late-19th century (e.g. de Seue, Reference de Seue1876; Rekstad, Reference Rekstad1892, Reference Rekstad1893, Reference Rekstad and Reusch1900; Rabot, Reference Rabot1899; Marstrander, Reference Marstrander1910, Reference Marstrander and Reusch1911; see also summaries in Hoel and Werenskiold, Reference Hoel and Werenskiold1962 and Theakstone, Reference Theakstone1965). The observations show that the glaciers in both the Svartisen and Okstindan areas terminated a short distance from their outer LIA limits at the end of the 19th century. However, while Svartisen's non-calving outlet glaciers had been in slow retreat until the beginning of the 20th century, the Okstindan glaciers had advanced considerably since ~1875 (Hoel and Werenskiold, Reference Hoel and Werenskiold1962; Theakstone, Reference Theakstone1965, Reference Theakstone1990, Reference Theakstone2010, Reference Theakstone2018 and references therein; Knudsen and Theakstone, Reference Knudsen and Theakstone1984). Hoel (Reference Hoel1907) also suggested a late-19th-century advance of the Frostisen (Ruostajiekŋa) icefield that ended close to the LIA limit.
More systematic glaciological monitoring, including glacier front position measurements, was initiated in the Svartisen, Okstindan and Frostisen areas in the first decade of the 20th century (e.g. Hoel, Reference Hoel1907; Rekstad, Reference Rekstad1910, Reference Rekstad1912, Reference Rekstad1914; Hoel and Werenskiold, Reference Hoel and Werenskiold1962; Andreassen and others, Reference Andreassen, Elvehøy, Kjøllmoen, Engeset and Haakensen2005). These investigations document an episode of outlet glacier advance in the 1900s (Hoel, Reference Hoel1907; Marstrander, Reference Marstrander1910; Rekstad, Reference Rekstad1910, Reference Rekstad1912; Hoel and Werenskiold, Reference Hoel and Werenskiold1962) and partly into the 1910s at some glaciers in the Okstindan and Frostisen areas (Hoel and Werenskiold, Reference Hoel and Werenskiold1962), followed by rapid retreat in the period ~1930–60 (Fægri, Reference Fægri1935; Hoel and Werenskiold, Reference Hoel and Werenskiold1962; Theakstone, Reference Theakstone1965, Reference Theakstone1990, Reference Theakstone2010, Reference Theakstone2018; Knudsen and Theakstone, Reference Knudsen and Theakstone1984; Andreassen and others, Reference Andreassen, Elvehøy, Kjøllmoen, Engeset and Haakensen2005; Nesje and others, Reference Nesje, Bakke, Dahl, Lie and Matthews2008). Glacier change in the last four decades of the 20th century was spatially more heterogeneous across Nordland (Andreassen and others, Reference Andreassen, KjølImoen, Knudsen, Whalley and Fjellanger2000). Høgtuvbreen and the glaciers in the Frostisen area continued to retreat, albeit at lower rates. A mixture of advances and retreats occurred in Okstindan and across the different outlet glaciers of Blåmannsisen. Variations in glacier behaviour were even more pronounced in the Svartisen area (Andreassen and others, Reference Andreassen, KjølImoen, Knudsen, Whalley and Fjellanger2000), where calving contributed to the recession of some outlets (Theakstone, Reference Theakstone1990, Reference Theakstone2010, Reference Theakstone2018). Engabreen, in accordance with other maritime glaciers along the west coast of Norway, readvanced significantly in the 1990s after a period of increased winter precipitation in the late 1980s and early 1990s (Andreassen and others, Reference Andreassen, KjølImoen, Knudsen, Whalley and Fjellanger2000, Reference Andreassen, Elvehøy, Kjøllmoen, Engeset and Haakensen2005; Nesje and others, Reference Nesje, Bakke, Dahl, Lie and Matthews2008; Theakstone, Reference Theakstone2010). A comparison of the 1976 and 2000 inventory data for the Svartisen–Blåmannsisen region (Paul and Andreassen, Reference Paul and Andreassen2009) found no significant changes in either the area of the three plateau icefields or the total glacier area in the region, but saw that areal change became more variable in the smaller glacier size classes. Since the beginning of the 21st century, Vestre Svartisen's outlet glaciers have entered a state of rapid retreat (Andreassen and others, Reference Andreassen, Elvehøy, Kjøllmoen, Engeset and Haakensen2005; Nesje and others, Reference Nesje, Bakke, Dahl, Lie and Matthews2008; Theakstone, Reference Theakstone2018). Engabreen's recent behaviour is reflected in surface mass-balance measurements, which have been performed annually at the outlet glacier since 1970. A volume increase of 6.4 m w.e. between 1988 and 2000 was cancelled out by a mass-balance loss of 6.1 m w.e. in the period 2000–17 (Kjøllmoen and others, Reference Kjøllmoen, Andreassen, Elvehøy and Jackson2018).
3. Historical map production
Nordland is covered by a total of 54 gradteigskart map sheets (hereafter referred to as ‘maps’ or ‘map sheets’), of which 33 contain glaciers (ice masses extending into Sweden were only mapped on the Norwegian side) (Fig. 1, Table 2). The maps were produced from trigonometrical plane-table surveys that took place between 1882 and 1916. Harsson (Reference Harsson2009) and Harsson and Aanrud (Reference Harsson and Aanrud2016) provide an overview of the production of the maps, which is important to consider in order to assess their suitability for deriving a reliable glacier inventory (Figs 2a, b).
Table 2. Overview of published Nordland gradteigskart maps and respective georeferencing details
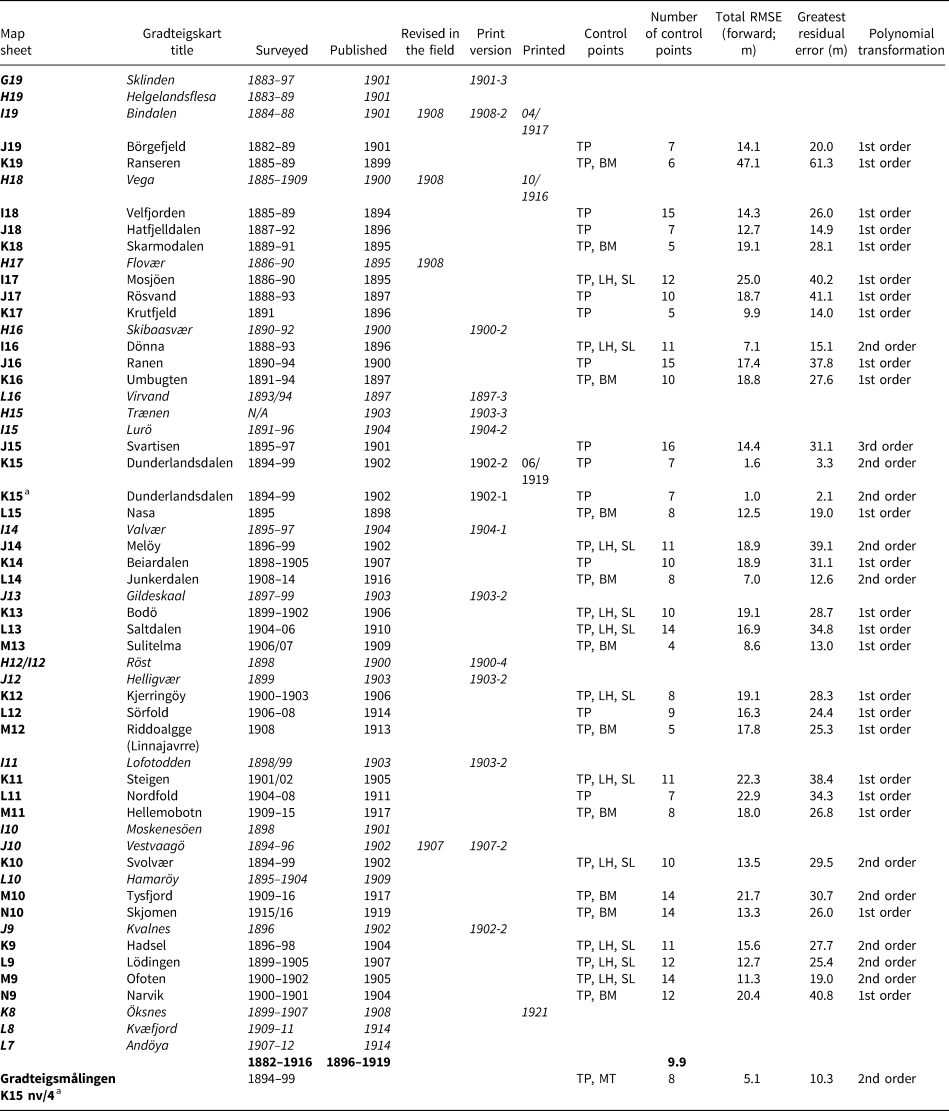
Control points: TP, trigonometric point; BM, boundary marker; LH, lighthouse; SL, sector light; MT, mountaintop.
Map sheets in italics do not contain ice masses and were not used in this study.
aNot inventoried; only used to estimate the map (re-)production error (e MR).
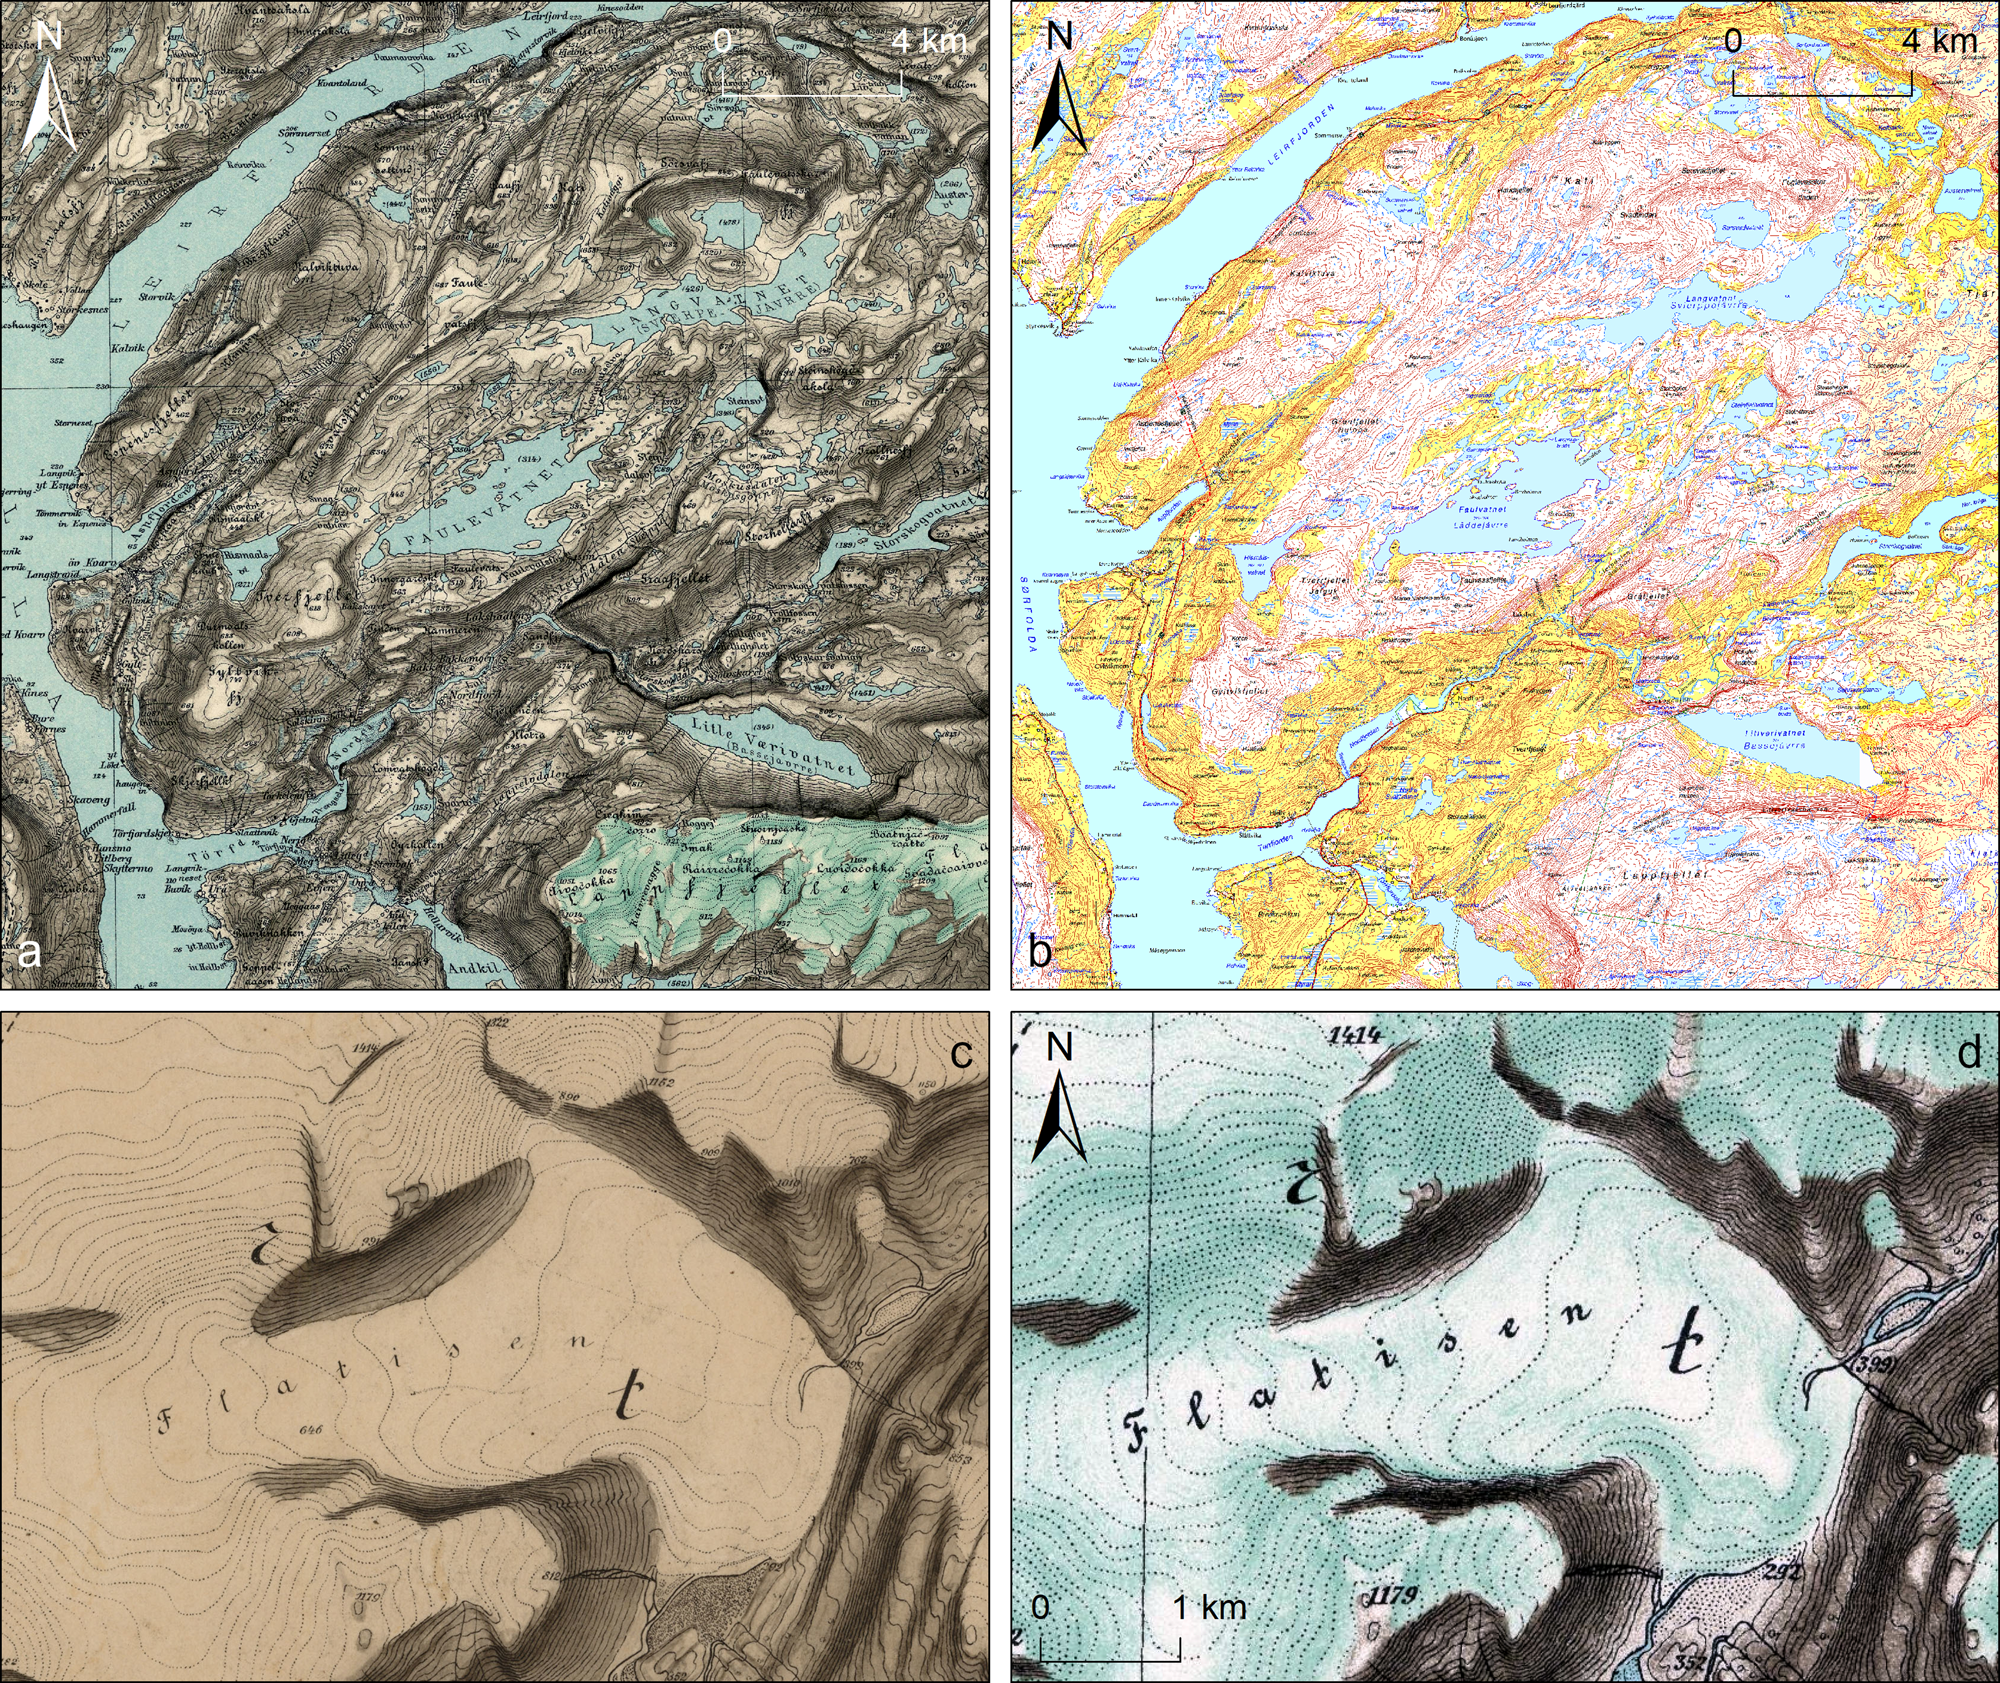
Fig. 2. (a) Section of gradteigskartet map sheet L12 Sörfold (1 : 100 000; produced by an unknown cartographer; published in 1914; Norges geografiske oppmåling; available from Kartverket), displayed at a scale of 1 : 250 000. An extensive plateau icefield appears to cover the Lappfjellet massif in the southeast of the map area. (b) Modern-day topographic map (‘N50 Raster’; Kartverket) with the same extent as (a). Note how well the historical mapping matches the modern mapping, particularly the mapped shoreline of the Sørfolda–Leirfjorden and other water bodies, attesting to the high quality of the old Nordland maps. Also note the restricted ice cover on Lappfjellet, suggesting substantial glacier recession since the beginning of the 20th century. (c) Section of survey map (rektangelmålingen) J15 nö/4 (1 : 50 000; surveyed by Captain O. H. Paulsen; 1897; Norges geografiske oppmåling; available from Kartverket) showing Flatisen, an eastern outlet glacier of Vestre Svartisen. (d) Flatisen (1 : 80 000) as depicted on gradteigskartet map sheet J15 Svartisen (1 : 100 000; produced by T. Lundtvedt and O. Engh; published in 1901; Norges geografiske oppmåling; available from Kartverket).
According to Harsson (Reference Harsson2009) and Harsson and Aanrud (Reference Harsson and Aanrud2016), the plan for a new 1 : 100 000 scale main map series for Norway was set out by Norges geografiske oppmåling (NGO; Norwegian Geographical Survey; now: Kartverket – Norwegian Mapping Authority) in 1867. The mapping of northern Norway began at the beginning of the 1880s and introduced the gradteigskart map format. These maps have a polyconic projection with a prime meridian that runs through the Astronomical Observatory in Oslo. Lines of latitude and longitude define the margins of each map sheet. Since the meridians converge towards the poles, the maps of northern Norway cover a whole degree of longitude (Harsson, Reference Harsson2009; Harsson and Aanrud, Reference Harsson and Aanrud2016) (Fig. 1, Table 2).
The mapping of Nordland was completed in only 34 years (Table 2). A crucial prerequisite was the completion of a dense network of trigonometric points between the late 1870s and 1904. The geodetic measurements were carried out with theodolites following instructions that required a high level of accuracy. The heights of the trigonometric points were also established by theodolite, using vertical angular measurements. From 1872 onwards, the coordinates of all surveyed trigonometric points were, as a standard, calculated by employing the least-squares method (Harsson, Reference Harsson2009; Harsson and Aanrud, Reference Harsson and Aanrud2016).
The triangulators were followed by the topographers, who arrived in Nordland in the early 1880s. Work began each season in spring with the snowmelt and continued until autumn when the snow returned. Field surveying took place by plane tabling, which as a method was at a high and refined stage of its development in Norway in the period of the Nordland surveys (Harsson, Reference Harsson2009; Harsson and Aanrud, Reference Harsson and Aanrud2016). All aspects of the mapping were guided by detailed and frequently updated survey instructions (e.g. Norges geografiske opmåling, 1895, 1905; Norges geografiske Opmaaling, 1912), which, for instance, stipulated the use of 30 m-intervals for contours (drawn as dotted lines over glaciers). An updated edition of the survey instructions from 1912 introduced obligatory glacier frontal position measurements (Norges geografiske Opmaaling, 1912). However, this was only carried out at a handful of Nordland's glaciers on map sheets M10 Tysfjord and M11 Hellemobotn. The 1912 survey instructions and the results of the frontal position measurements are detailed by Hoel and Werenskiold (Reference Hoel and Werenskiold1962). After each survey season, the field maps were transferred and compiled into clean and uniform survey maps. These are known as gradteigsmålinger (‘quadrangle survey maps’; henceforth referred to as ‘survey maps’) and formed the basis for the final gradteigskartene maps (Kvarteig and others, Reference Kvarteig, Hansen and Lillethun2009). However, the maps of southern Nordland in map rows 16–19, including Okstindbreen, were based on rektangelmålinger (‘rectangle survey maps’), which would have normally provided the basis for the older, discontinued rektangelkart (‘rectangle maps’) map format (Kvarteig and others, Reference Kvarteig, Hansen and Lillethun2009) (Table 2). All survey maps were hand-drawn, hill-shaded and display glaciers as white features (Fig. 2c).
The (re-)production and printing of the final map sheets was a highly complex process involving photogravure and lithography and took an average of 1.8 years per map (Harsson and Aanrud, Reference Harsson and Aanrud2016). Photogravure was used to make an intaglio printing plate for each map sheet. An accurate drawing of the map was photographed and the negative transferred to a silver-coated copperplate and etched in. Separate lithographic printing plates were produced for the hill-shading (brown to beige) and the colouration of water bodies (blue) and ice masses (turquoise to beige). The final map was then printed from the individual printing plates, with the map colours applied first (Harsson and Aanrud, Reference Harsson and Aanrud2016). In Section 4.2, we examine the implications of this multistep printing workflow for the accuracy of the mapped glaciers.
3.1 Topographic descriptions and landscape photography
In addition to the mapping, all topographers were required to produce detailed written descriptions of the surveyed areas and the natural landscape features within them (e.g. Norges Geografiske Opmåling, 1905; cf. Hoel and Werenskiold, Reference Hoel and Werenskiold1962; Harsson and Aanrud, Reference Harsson and Aanrud2016). Only five of the handwritten descriptions were ever published in the 1920s (L10 Hamaröy, L11 Nordfold, M10 Tysfjord, M11 Hellemobotn and N10 Skjomen), with the bulk of the descriptions archived at Kartverket in Hønefoss, Norway. At the turn of the 19th century, NGO also started to equip topographers with cameras so they could supplement their field mapping with photographs of the surveyed landscape (Aasbø, Reference Aasbø2016; Harsson and Aanrud, Reference Harsson and Aanrud2016). Both the descriptions and the photographs are invaluable sources of independent evidence to validate the historical maps and, most importantly, the glacier extent displayed on them (Figs 2 and 3).
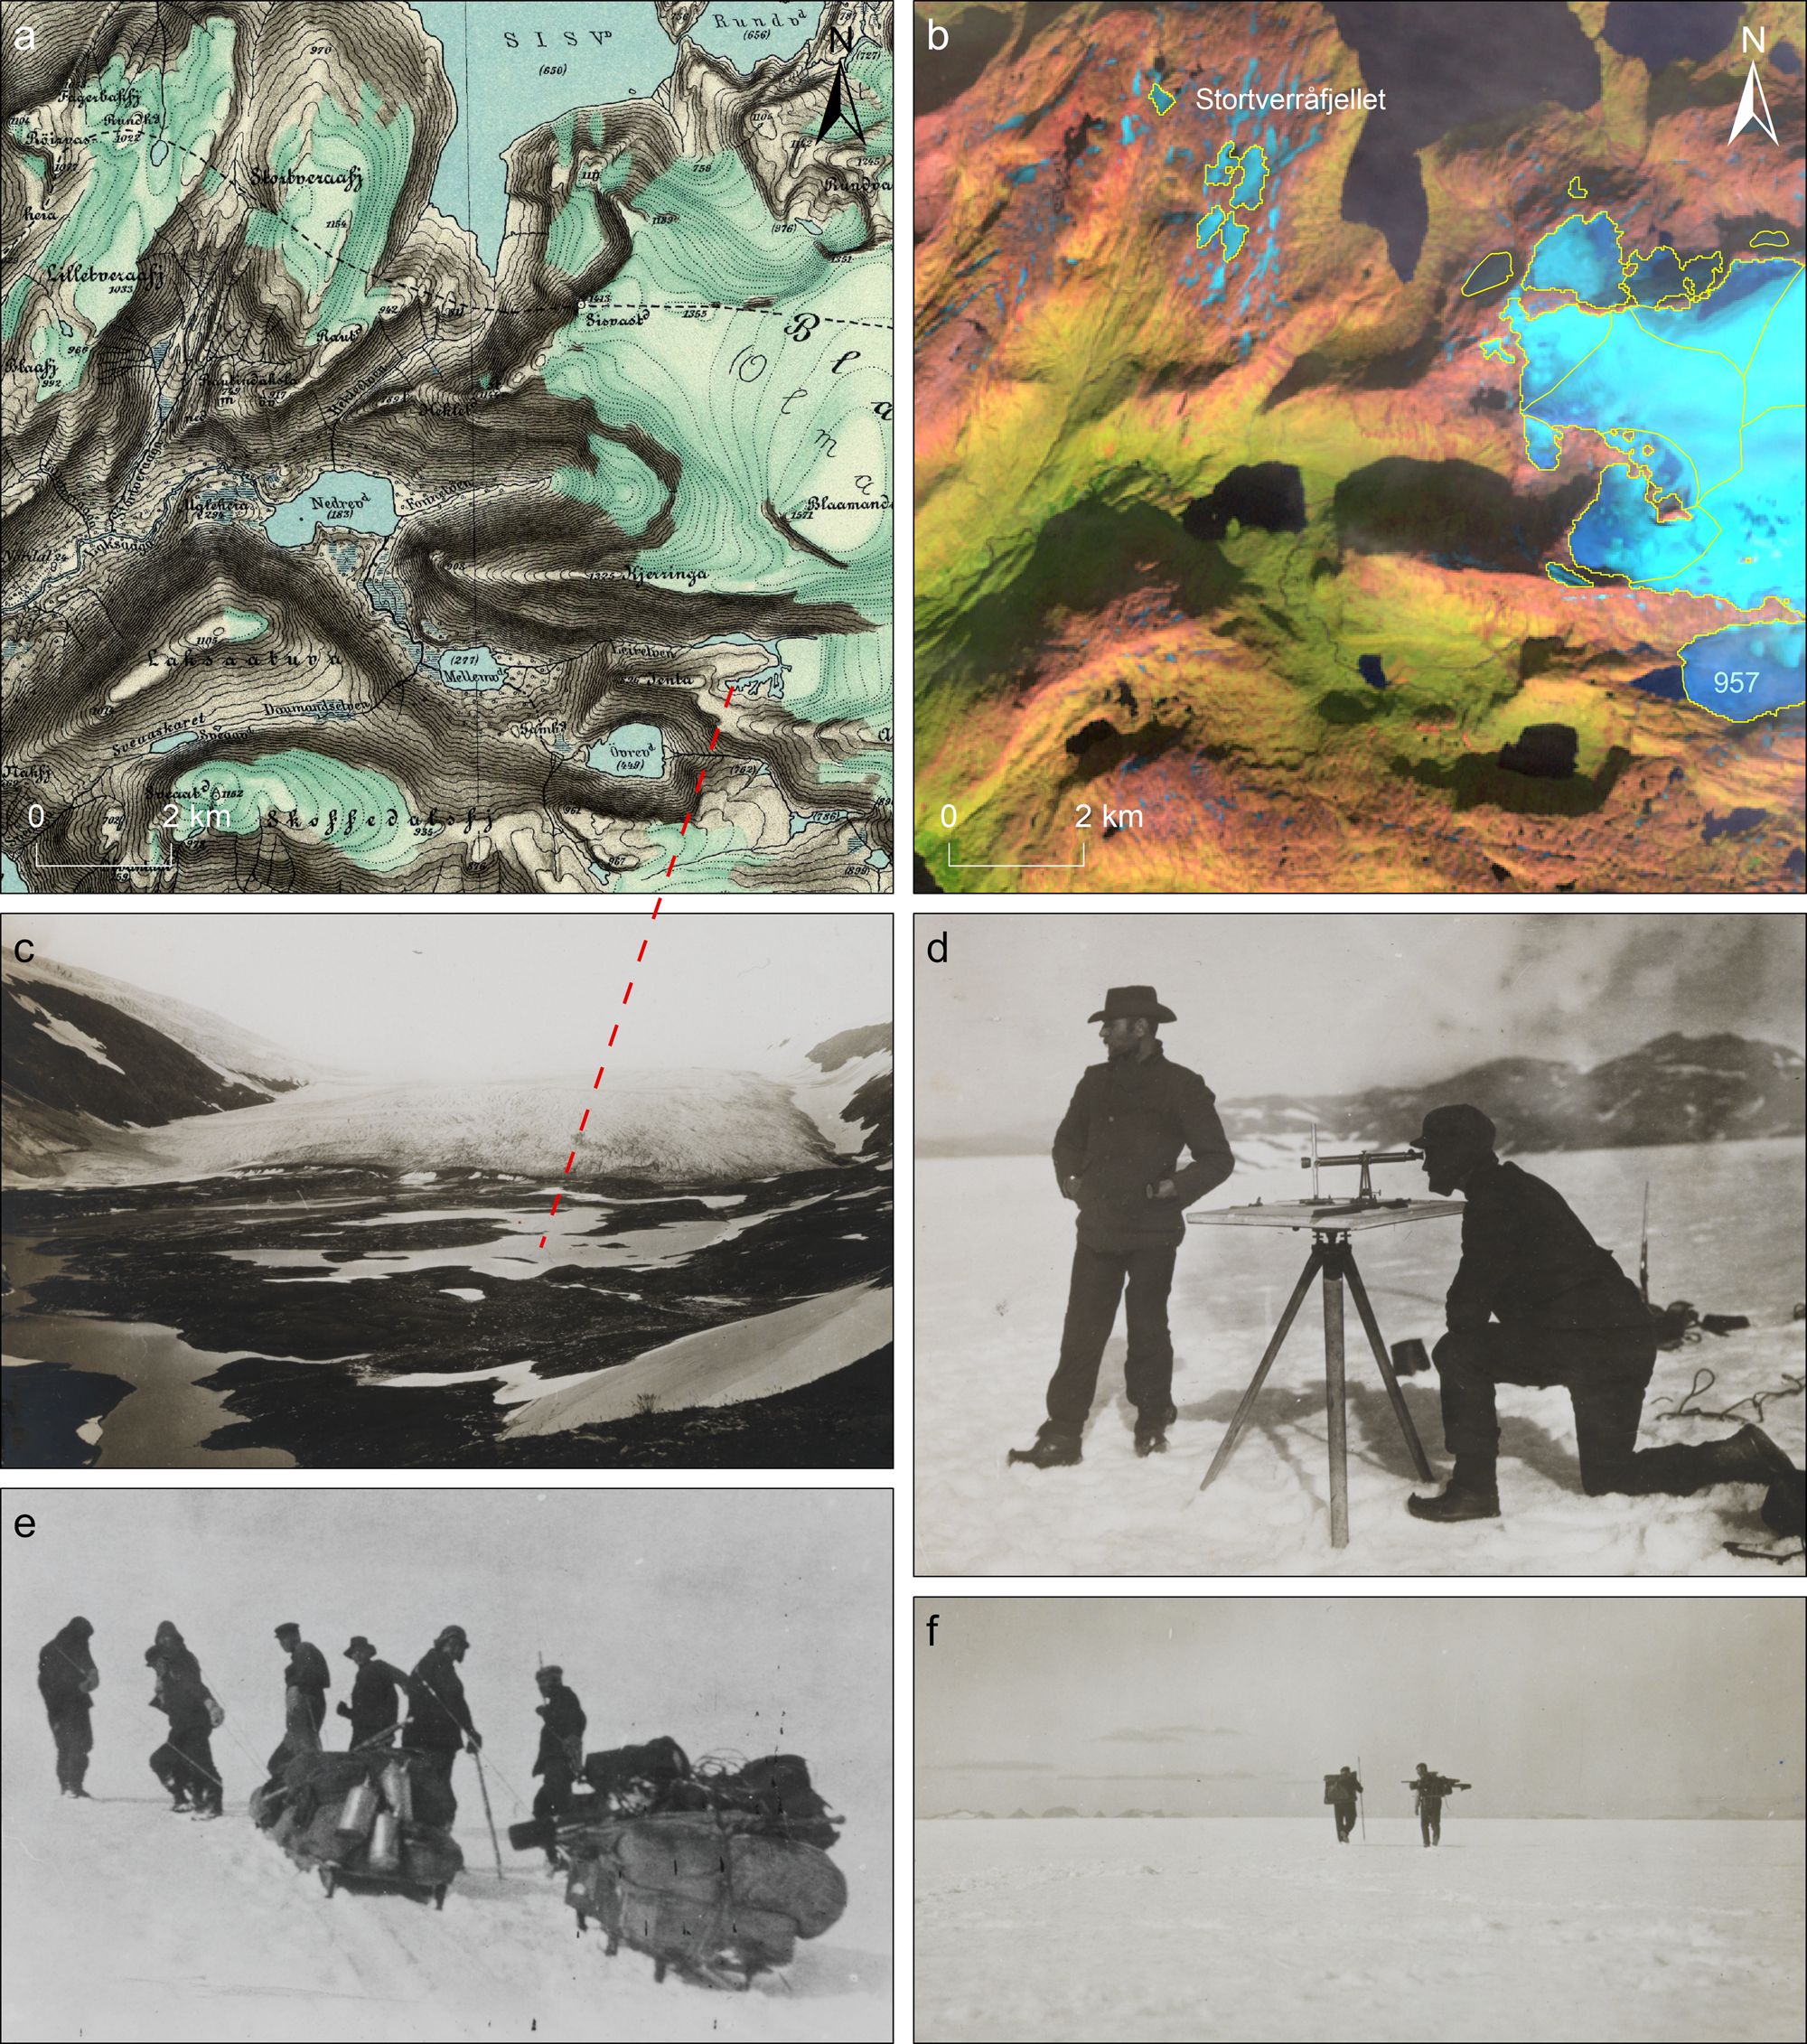
Fig. 3. (a) Section of map sheet L13 Saltdalen (1 : 100 000; produced by T. Lundtvedt and O. Engh; published in 1910; Norges geografiske oppmåling; available from Kartverket) showing the western Blåmannsisen area at a scale of 1 : 150 000. (b) Landsat-7 scene from 7 September 1999 (bands 5, 4, 3) with the same extent as (a) (Paul and Andreassen, Reference Paul and Andreassen2009). The 1999 glacier extent, as delineated by Paul and Andreassen (Reference Paul and Andreassen2009), is outlined in yellow. A substantial reduction in ice cover is apparent between the historical map and the satellite image, particularly on the mountain summits to the west of Blåmannsisen. (c) Historical survey photograph of Blåmannsisen's western outlet glacier with ID 957 (photo: Norges geografiske oppmåling, Nasjonalbiblioteket (National Library of Norway), SKM-S-L13-013). Note the proglacial meltwater system in front of the outlet that is mapped in some detail on the final L13 map. Dashed line shows location of the meltwater system in (a). (d) Plane tabling on top of Blåmannsisen (photo: Norges geografiske oppmåling, Nasjonalbiblioteket, SKM-S-L13-011). (e) Survey equipment is transported on sledges across Blåmannsisen (photo: Norges geografiske oppmåling, Nasjonalbiblioteket, SKM-S-L13-028). (f) Surveyors crossing Stortverråfjellet (photo: Norges geografiske oppmåling, Nasjonalbiblioteket, SKM-S-L13-010). All photographs were taken during the original field surveys.
In the context of producing glacier inventories from the maps, a critical question is to what degree the topographers differentiated between glacier ice and perennial/seasonal snow (cf. Racoviteanu and others, Reference Racoviteanu, Paul, Raup, Khalsa and Armstrong2009). As shown by Paul and Andreassen (Reference Paul and Andreassen2009), seasonal snow attached to a glacier, or even blanketing small glaciers entirely, can conceal the ice margin and may result in the mapping of exaggerated glacier outlines. Perennial snowfields typically occur in locations with favourable topographic conditions (e.g. depression, gullies, etc.) and often exhibit little change over time; thus, including them in a glacier inventory can obscure the signal and magnitude of glacier change in a multi-temporal glacier change assessment (Paul and Andreassen, Reference Paul and Andreassen2009).
Based on a sample of topographic descriptions and photographs, it appears that the mapping of valley and outlet glaciers was largely accurate. For example, Captain O. H. Paulsen, who surveyed the areas around Høgtuvbreen and the southern sector of Vestre Svartisen in 1895–97 (survey maps J15 sö/4, sv/4, nö/4; map sheet J15 Svartisen), provided an overview of the icefields’ outlet glaciers, crevasse patterns and summit areas. He described Vestre Svartisen's former key outlet glacier Flatisen as being,
formed by the coalescence of three glaciers, one along the valley and two from the northern side, with distinct boundaries, which probably indicates, that these three glaciers have a somewhat differing velocity, although Flatisen in its entire width looks like a continuous ice mass. Flatisen is the only one of the glaciers, which stretches right across the valley [Vesterdalen]. It almost forms a natural bridge across the river [Glomåga] (Paulsen, Reference Paulsen1898) (translated from Norwegian).
Paulsen's description is accurately reflected in his mapping and on the final map (Figs 2c, d).
To give another example, First Lieutenant K. M. Leewy, who surveyed the western sector of Blåmannsisen and the adjacent mountains and valleys to the west in 1905 (survey map L13 nö/4; map sheet L13 Saltdalen; Fig. 3a), observed that
Everlasting ice and snow cover large parts of the terrain. Blaamanden [Blåmannsisen] is one of the largest glaciers north of Svartisen. Large areas of [the mountain summits of] Skoffedalsfjeld [Skoffedalsfjellet], Stortveraafjeld [Stortverråfjellet] and Lilletveraafjeld [Blåfjellet] are permanently covered by snow. Snow- and ice-glaciers appear to a certain extent to be of the same size from one year to the next. The size still varies a little in response to the amount of snow in the winter and the temperature in the summer. This year (1905), the amount of snow in the mountains was particularly great because of the heavy snowfall last winter (Leewy, Reference Leewy1905, p. 170–34) (translated from Norwegian).
A photograph taken during the 1905 survey (Fig. 3c) shows Blåmannsisen's largest western outlet glacier (glacier ID 957) south of the mountain Kjerringa. Much of the glacier and its crevassed surface are snow-free, providing ideal conditions for determining and mapping the exact glacier extent. Proglacial meltwater ponds and streams are visible in the foreground of the photograph. These features are reproduced in detail on the final map (Fig. 3a) and demonstrate that the outlet glacier along with its foreland and the position of the glacier margin were mapped with high accuracy. Another pair of photographs, one showing a topographer carrying out a plane-table survey on top of Blåmannsisen (Fig. 3d), and the other how equipment is transported on sledges across the icefield (Fig. 3e), attests that even the accumulation areas of glaciers and icefields were visited and mapped.
Less clear, however, is the nature of the features on Skoffedalsfjellet, Stortverråfjellet and Blåfjellet, which Leewy describes as perennial snowfields rather than glaciers (while also emphasising the substantial amount of snow from the previous winter). Further complicating matters, Leewy used the term ‘snow-glacier’ (‘sne- og isbræerne’; sne = snow; is = ice; bræerne = definite plural form of glacier) in his description, which can either denote a glacier-like mass made up entirely of snow, i.e. a snowfield, or refer to the upper, snow-covered (accumulation) part of a glacier. The term appears to have been frequently used in the latter sense at the time (e.g. Rekstad, Reference Rekstad1892, Reference Rekstad1893). A survey photograph from the top of Stortverråfjellet (Fig. 3f) shows a wide, plateau-like expanse of snow with mountain peaks on the horizon, resembling a typical surface of a plateau icefield summit. The fragmented remnants of this feature were identified and mapped as small glaciers from the 1999 Landsat scene used for the 2000 inventory (Fig. 3b), which is why we lean towards interpreting all three features as glaciers rather than perennial snowfields.
An example of a mapping approach for small glaciers and ice bodies is the topographic description for survey map L12 sv/4 (map sheet L12 Sörfold). Captain O. G. Lund surveyed the coastal mountains south of the Sørfolda fjord in 1908 (Fig. 4a) and reported that
There is no noteworthy everlasting ice or snow, although I have marked down some small patches in Nordskaret and Sørskaret. In some other places, for instance at Korsviktind [Korsviktinden], I could not determine whether or not the snow will disappear over the course of the summer and have not marked down any glacier (Lund, Reference Lund1908, p. 92–1) (translated from Norwegian).
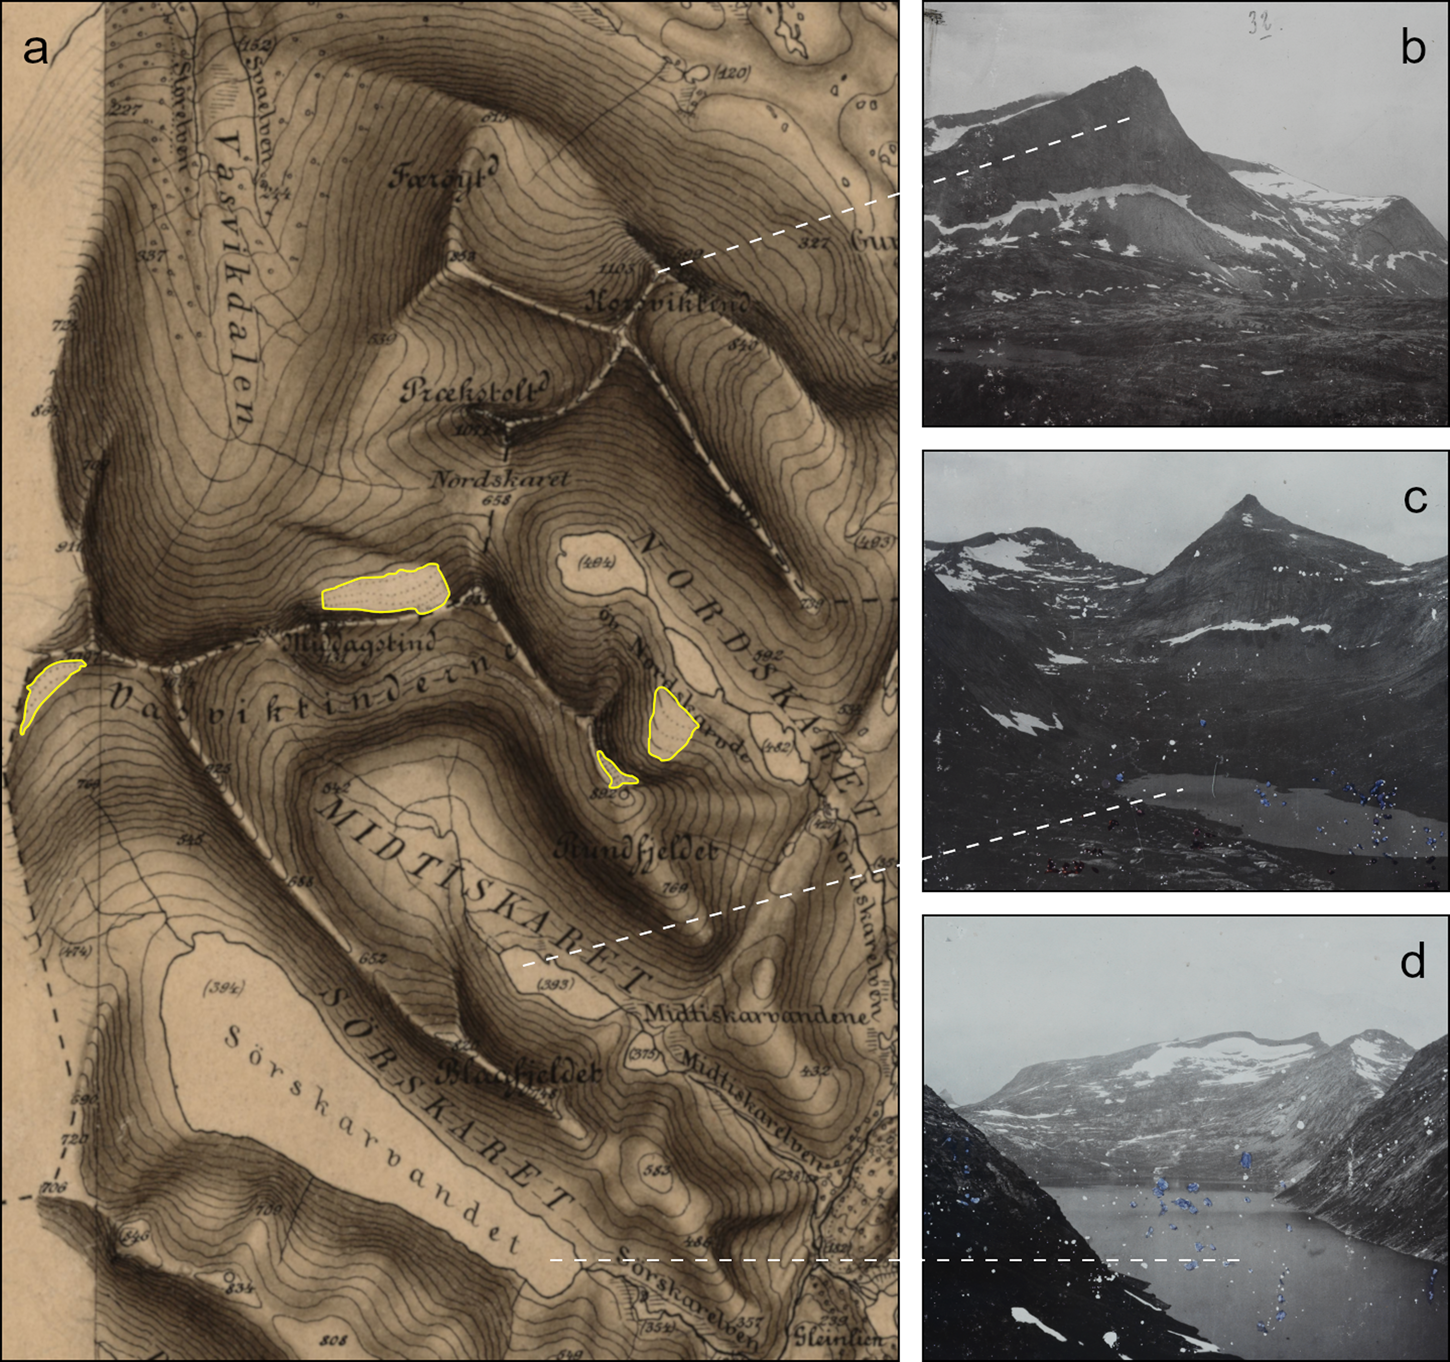
Fig. 4. (a) Section of survey map L12 sv/4 (1 : 50 000; surveyed by Captain E. Falch, First Lieutenant D. Ebbesen and Captain O. G. Lund; 1906–08; Norges geografiske oppmåling; available from Kartverket) showing the Vassviktindan massif to the west of the Sjunkfjorden. Glaciers are outlined in yellow. Panels (b) to (d) show historical survey photographs of (b) the mountains Korsviktinden (in the foreground to the left) and Færøytinden (in the distance to the right); (c) the Midtiskaret valley and the Midtiskartinden mountain in the distance; and (d) the Sørskaret valley with the Sørskarvatnet lake in the foreground of the photo and the Sørskarfjellet mountain in the distance (photos: Norges geografiske oppmåling, Nasjonalbiblioteket, SKM-S-L12-009 and SKM-S-L12-010). Although the mountain flanks shown in the photographs are draped with what appears to be patches of snow or snow-covered ice, only the most distinct feature in Sørskaret (d) was ultimately mapped in (a). All photographs were taken during the original field surveys.
This account is convincing evidence that the surveyors differentiated between seasonal snow and ice masses, but probably not between glaciers and perennial snow. Yet, it also suggests that mapping was conducted with great care and in a conservative manner; if the surveyor could not ascertain whether a feature was seasonal snow or a snow-covered glacier/perennial snow patch, the feature was not mapped in. The conservative mapping approach is documented by field photographs from the surveyed area (Figs 4b, c, d), which show that only a handful of glaciers/perennial snow patches were mapped despite mountain flanks clearly being snow-covered.
Our analysis of selected historical survey reports and photographs demonstrates that the glaciers depicted on the Nordland map sheets were mapped carefully, with the omission of seasonal snow. Nonetheless, it is reasonable to expect that the exact mapping approach and quality probably varied (within the framework of the survey instructions) between the individual topographers and between regions (with the latter depending on their accessibility and local snow conditions). With regards to perennial snow, it is interesting to note that many of the topographers used the term ‘everlasting’ (‘evig’) snow. We believe that today's strict distinction between glaciers and perennial snowfields may have been more fluid at the time of the surveys, where the concept of permanent snow was also applied to the upper part of a glacier's accumulation area, which is snow-covered in all seasons (e.g. Rekstad, Reference Rekstad1893). This supports the impression that a number of the features described as perennial snowfields and included on the maps are, at least partly, genuine glaciers. Based on these descriptions and the available information on map production, we conclude that the maps are an acceptable data source for a glacier inventory.
4. Creating the 1899 Nordland glacier inventory: methods and error analysis
4.1 Georeferencing of map sheets
Digital scans of all 33 map sheets containing glaciers, along with the original survey maps, were downloaded at a resolution of 300 dpi from Kartverket's online database of historical maps (https://kartverket.no/Kart/Historiske-kart/). The map sheets were georeferenced in ArcGIS to the digital 1 : 50 000 raster map of Norway (‘N50 Raster’) from Kartverket (Coordinate system: ETRS 1989 UTM Zone 33N). For control points (CPs), we only used trigonometric points, boundary markers on the border with Sweden, lighthouses, and sector lights that were present in the same location both on the historical map sheets and the N50 raster map. The rationale behind this approach was the assumption that the positions of these critical survey, territorial and navigational markers were measured with the highest possible accuracy for their time, using state of the art survey instruments and techniques (Harsson and Aanrud, Reference Harsson and Aanrud2016), and with the greatest possible care, thus constituting high-quality CPs. We have assumed that the positional accuracy of mapped features away from the trigonometric points may be lower, and that the location of some mapped features may have been altered over time due to human activity or natural processes (e.g. the location of river bends, etc.). On average, ten CPs were obtained per map sheet (Table 2), ranging from a maximum of 16 CPs to a minimum of 4–5 CPs for some of the map sheets covering the border region with Sweden, of which major portions show unmapped Swedish territory. We applied first- to third-order polynomial transformations depending on the best visual match to the reference data (Table 2). Two-thirds of the map sheets (n = 23) were transformed using a first-order polynomial, which yielded an average RMSE of 18 m, while a second-order polynomial was chosen for nine maps (average RMSE of 12 m) and a third-order polynomial for one map sheet (RMSE of 14 m). The georeferenced maps were permanently transformed (i.e. georectified) and saved as GeoTIFF raster images.
Tennant and others (Reference Tennant, Menounos, Wheate and Clague2012) quantified the uncertainty associated with their historical glacier extent by using the RMSE as one part of a buffer around the digitised glacier polygons. A buffer created from the weighted average of our RMSE values (17 m) changes the glacier area of our inventory by ±6%. However, our RMSE values are based on different polynomial transformations and so technically cannot be combined into a single value. Moreover, we mainly employed first-order polynomial transformations, which essentially only shifted, scaled and rotated the rasters. Since these operations are unlikely to have influenced the area of the features shown on the maps, we do not regard the RMSE as a suitable measure of the uncertainty associated with the glacier extent.
4.2 Digitising of glacier outlines
Based on the turquoise to beige colouration of the mapped glaciers, we digitised their outlines on-screen in a raster graphics editor (GIMP) in a semi-automated manner, rather than by manual editing in a GIS. Since most raster editors, including GIMP, do not support GeoTIFF files and strip them off their geospatial information, we had to store this information in separate world (.tfw) files before beginning the digitising work. We used a raster editor tool within GIMP that automatically identifies and selects image pixels and areas of similar colour. A colour value threshold of 0–255 can be set to adjust the range of colour to be included in the selection. We found that thresholds of 10–15 colour values produced adequate outlines for many of the glaciers. A major obstacle to our approach, however, was that the mapped glaciers were drawn and printed without clear boundary lines and often display a blurred transition from glacier ice to the surrounding terrain surface (Fig. 5a). This resulted in the automatic selection also including areas of similar colour beyond the glaciers (Fig. 5b). Additional and careful manual post-processing was therefore necessary to obtain the final glacier outlines, which we consider accurate to the pixel level (Fig. 5b). We compared the post-processed, pixel-accurate glacier outlines for map sheet J14 Melöy to automatic selections based on thresholds of 10 and 15 colour values and found that the threshold-only selections were 1 and 4% larger in total area, respectively.
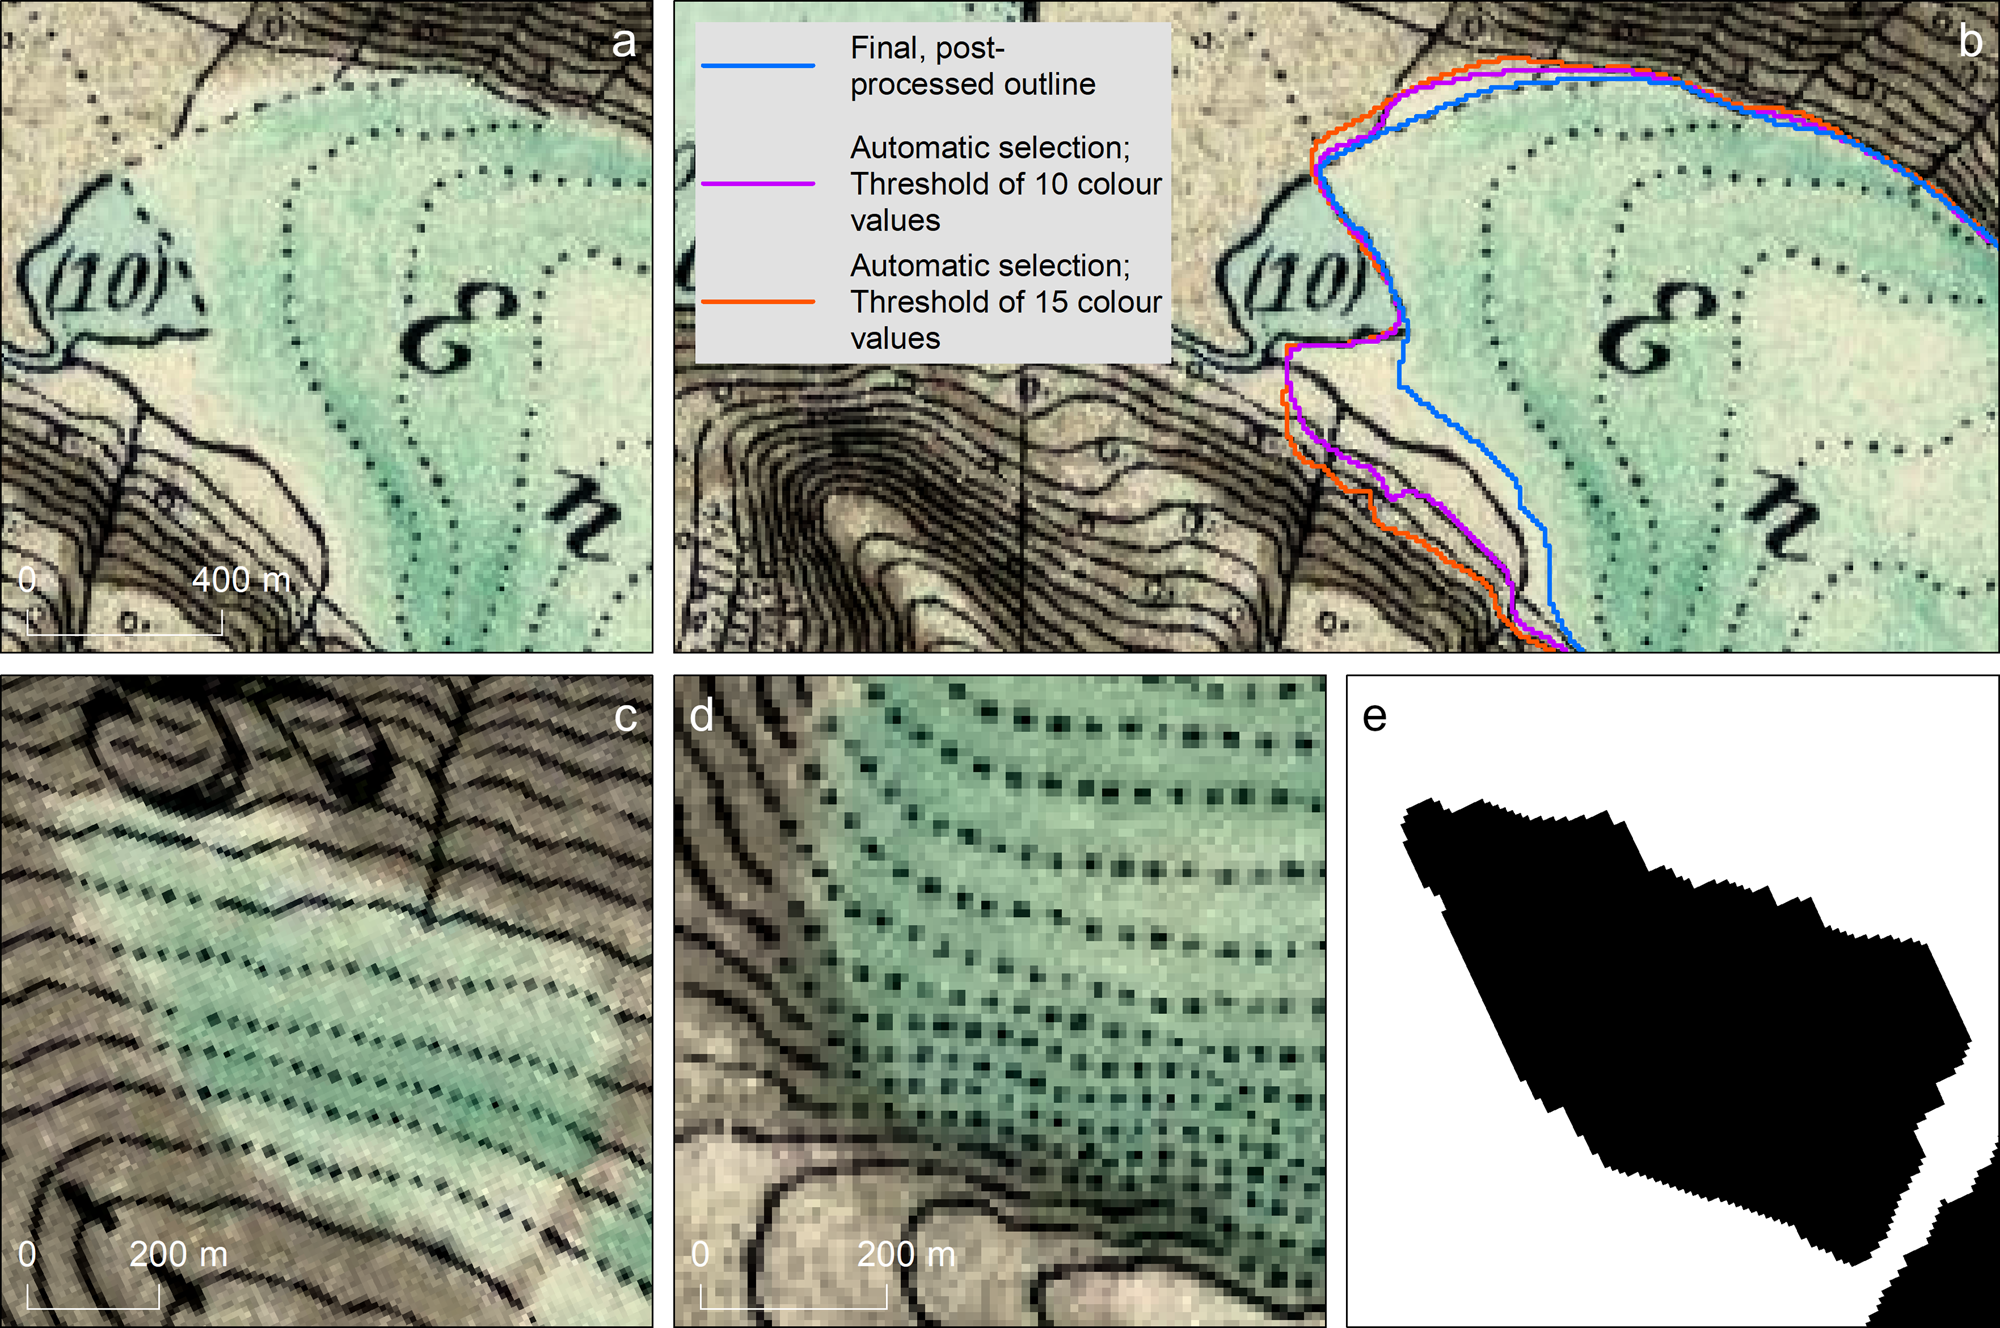
Fig. 5. (a) Tongue of Vestre Svartisen's major outlet glacier Engabreen (1 : 23 000), as depicted on map sheet J14 Melöy (1 : 100 000; produced by T. Lundtvedt and O. Engh; published in 1902; Norges geografiske oppmåling; available from Kartverket). Note the blurred transition between the ice front and the glacier foreland. (b) Digitised outlines of Engabreen's tongue based on (1) automatic selections using different colour value thresholds and (2) manual post-processing of the best-fit selection to derive the final glacier outline. Due to the poorly defined ice margin, the automatic selections also included areas of similar colour beyond the glacier. By contrast, note how accurately the automatic selections detect the glacier extent along the northern valley side where terrain contours and hill-shading provide a clear boundary line for the glacier. (c) Example of solid terrain contours extending into a glacier surface. (d) Example of dotted glacier contours outside a turquoise glacier surface. Faint traces of turquoise printing ink seem to be visible around some of the dots. (e) Black raster polygon of the glacier depicted in (c). This stencil-like black-and-white raster was imported into ArcGIS to generate the glacier polygons for the GIS inventory.
A few cases of small discrepancies occur on the maps where solid terrain contours extend into glacier surfaces (Fig. 5c); and conversely, where dotted glacier contours continue across hill-shaded terrain surfaces (Fig. 5d). A potential explanation for these mismatches may be that the complex, multistep map production process described in Section 3 resulted in small misalignments between the coloured glacier areas and the line features of the maps. Following our digitising approach, in many of these cases the glacier extent was determined based on the colour extent. Exceptions were made where faint traces of turquoise were visible on terrain surfaces with dotted glacier contours, suggesting that the glaciers’ original printing ink did not properly adhere to the map paper during lithography, or may have faded over time. Such areas were included as part of a glacier. Overall, we estimate the digitising error (e D) of the final, colour-based glacier outlines to be not more than one row of pixels around the polygons. With the sides of a pixel in the 300 dpi raster maps equalling a length of ~9 m × 9 m, applying a 9 m-buffer to the glacier polygons changes the area of our inventory by ±4%.
Each digitised glacier polygon, including its extent and any nunataks, was also compared and validated against the original survey maps. This showed generally good agreement for almost all mapped glaciers. However, we found 21 surveyed ice bodies, with an average size of only 0.04 km2, that were not included on the maps, and which we subsequently added to our dataset. For some of the excluded glaciers, a likely reason for their omission may be that they are in locations covered by map labels on the final maps. In a few other instances, very small glacier patches that had originally been surveyed as two adjacent ice bodies appeared as one glacier on the maps. We suspect this is the result of generalisation during upscaling of the 1 : 50 000 survey maps to the 1 : 100 000 maps, and thus digitised them as separate ice bodies. In a third case, two versions of the same survey map (M10 sö/4; surveyed 1913/14), one in the classic design of the 1905 survey instructions, and the other in the more modern design of the 1912 instructions (Norges geografiske Opmaaling, 1912), display differing ice cover in the western part of the Meraftesfjellet massif to the south of Frostisen (Figs 6a, b). The classic version was the basis for the final map sheet M10 Tysfjord. The more modern-styled version of the survey map shows an outlet glacier descending from Meraftesfjellet down to the Snøvatnet lake, in addition to a group of small ice patches to the west of the lake (Fig. 6b). By contrast, only two ice patches are present on the classic version of the survey map, while the outlet glacier is absent (Fig. 6a). Hoel (Reference Hoel1907), who investigated and described the Frostisen and Meraftesfjellet icefields in detail, does not report the existence of an outlet in this location, so we regard the modern-styled survey map as incorrect. Lastly, we discovered one case where the same glacier-covered area at the boundary between two survey maps (N9 sö/4; N9 Narvik and N10 nö/4; N10 Skjomen) had been surveyed twice at different dates (1900–1901 and 1916, respectively) by different topographers (Figs 6c, d). A clear reduction in local ice cover is observable in the 15 years between the surveys, which may either represent a true glacier retreat, or may just be due to a more selective mapping approach of the later topographer. The glacier extent on the final N10 map sheet is based on the 1916 survey map, which is the year we have assigned to the inventoried outlines.
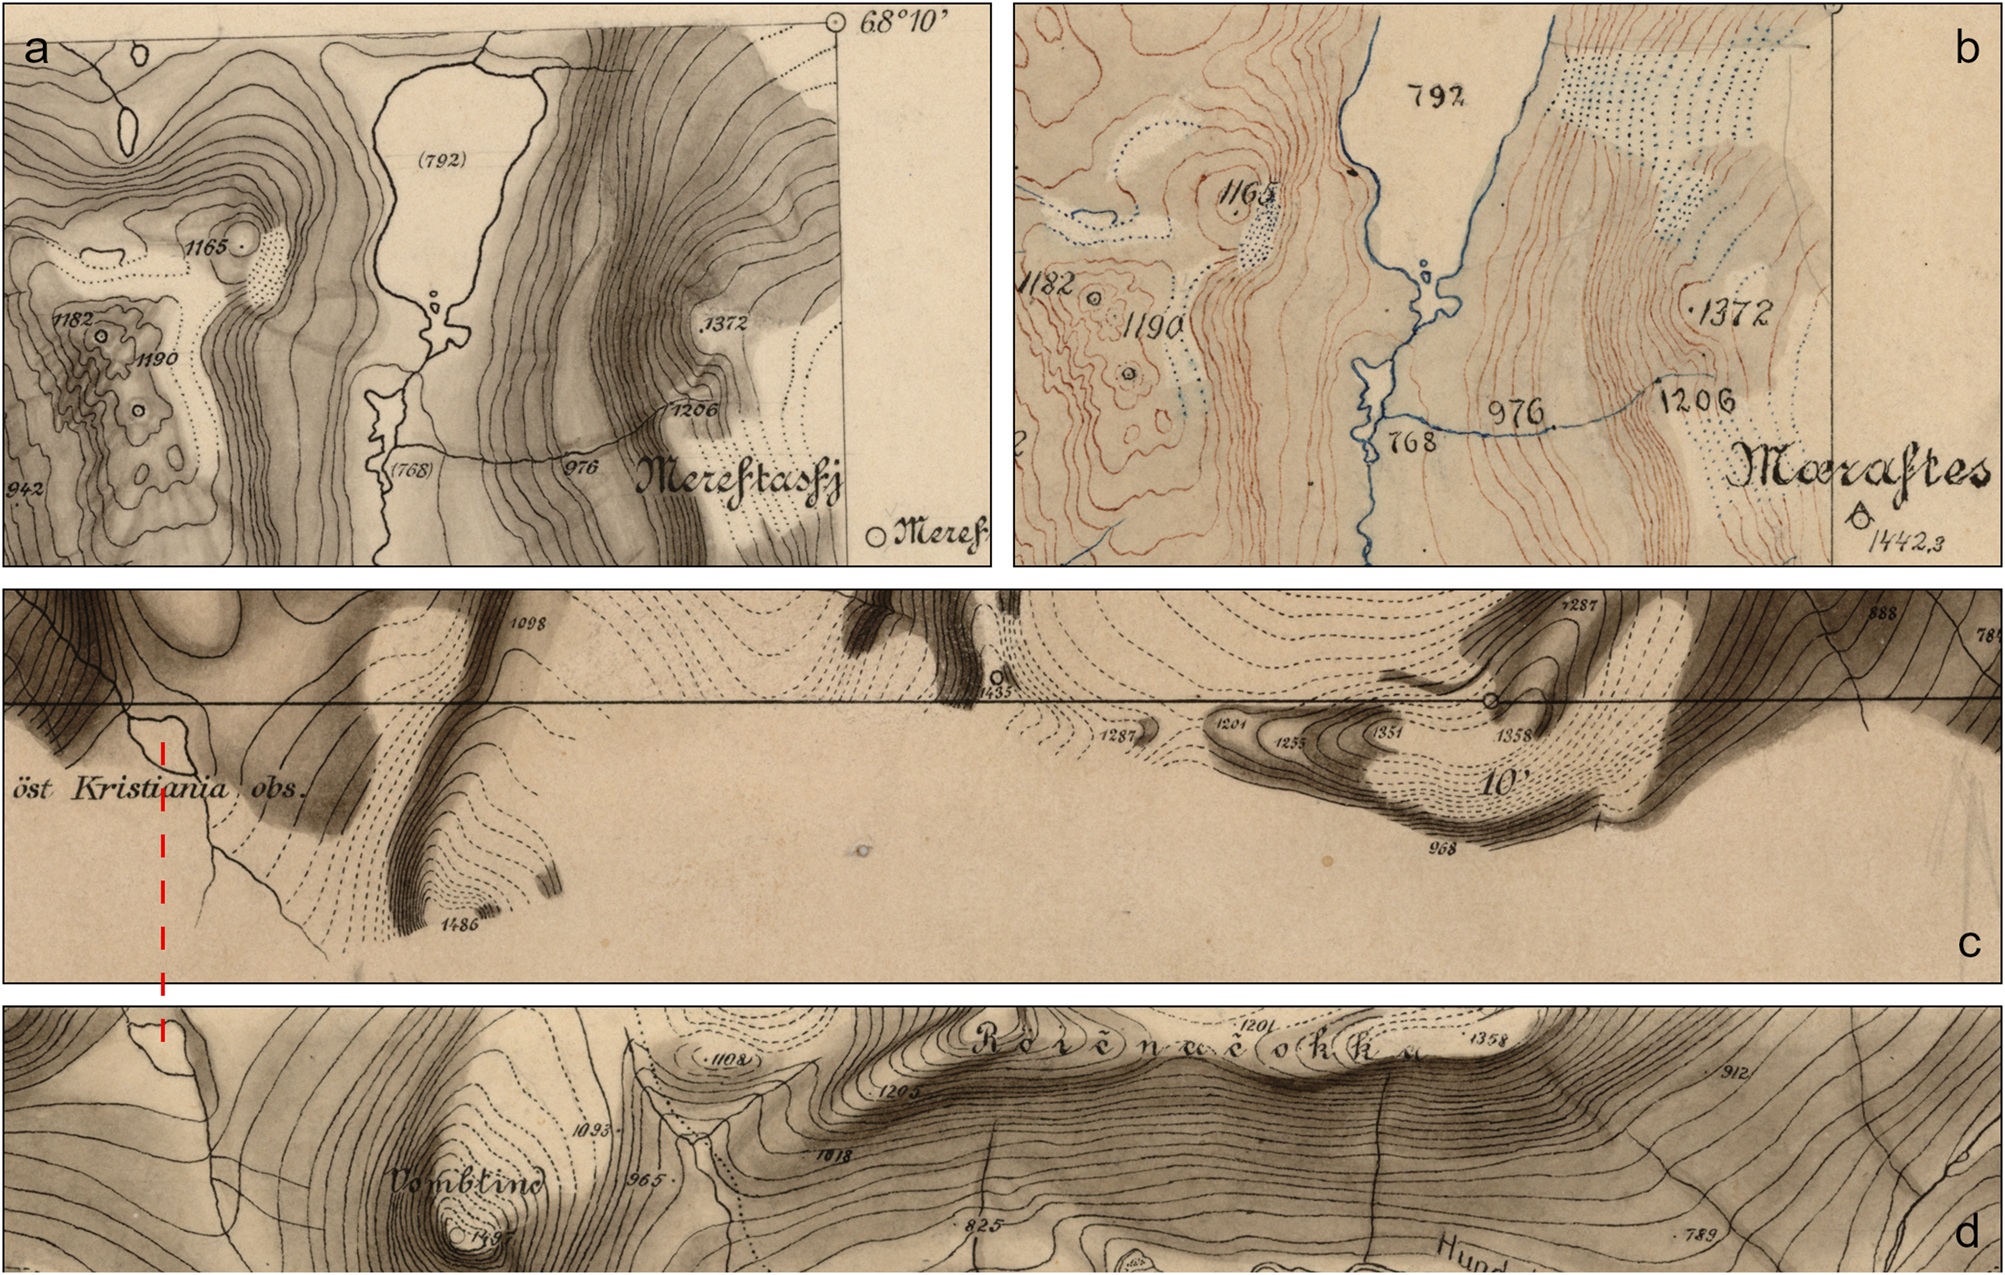
Fig. 6. In panels (a) and (b), two versions of survey map M10 sö/4 both depict the area around the Snøvatnet lake to the west of the Meraftesfjellet massif. (a) Classic version in the design of the 1905 survey instructions (1 : 50 000; surveyed by Captain O. B. Getz, Captain S. Nielsen and Captain O. Thue; 1913/14; Norges geografiske oppmåling; available from Kartverket). (b) Modern-styled version in the design of the 1912 survey instructions (1 : 50 000; surveyed by Captain O. B. Getz and Captain S. Nielsen; 1913/14; Norges geografiske oppmåling; available from Kartverket). Note the outlet glacier flowing down from Meraftesfjellet to Snøvatnet, which is not mapped in (a). Also, the group of ice patches to the west of the lake appears as only two ice bodies in (a). Panels (c) and (d) show ice cover to the south of the Blåisen (Beajojiekŋa) glacier, as mapped in 1900/01 on survey map N9 sö/4 (c) (1 : 50 000; surveyed by Captain F. Abrahamson; 1900/01; Norges geografiske oppmåling; available from Kartverket) and in 1916 on survey map N10 nö/4 (d) (1 : 50 000; surveyed by Captain T. Nummedal and First Lieutenant E. Bjørstad; 1915/16; Norges geografiske oppmåling; available from Kartverket). Dashed line links the same lake in both maps. The 1916 ice extent depicted in (d) is visibly more restricted than it was in 1900/01 (c).
In order to quantify the potential differences in glacier extent that may have resulted from the multistep map (re-)production process between (1) the survey maps and the final maps; and (2) the printed copies of the same map sheets, we examined survey map K15 nv/4 and two prints of the corresponding map sheet K15 Dunderlandsdalen more closely. The survey map and a second print version of the K15 map (one had already been georectified along with the rest of the map sheets) were georeferenced and transformed using second-order polynomials (Table 2). We then digitised a chain of cirque glaciers in the Stormdalsfjellet mountain range to the east of Østre Svartisen in a pixel-accurate fashion from all three map sources and compared the polygon area of these datasets (Fig. 7). The difference in size between the selected glaciers of the two K15 prints is only 0.3% (0.02 km2) and thus negligible. There is, however, a marked difference of 7% (0.45 km2) between the survey map (6.7 km2) and each of the printed copies of the final map (7.1 km2) (Fig. 7d). We take this number as a representative estimate of the map (re-)production error (e MR) caused by the complex workflow involved in creating the final map sheets (see Section 3).
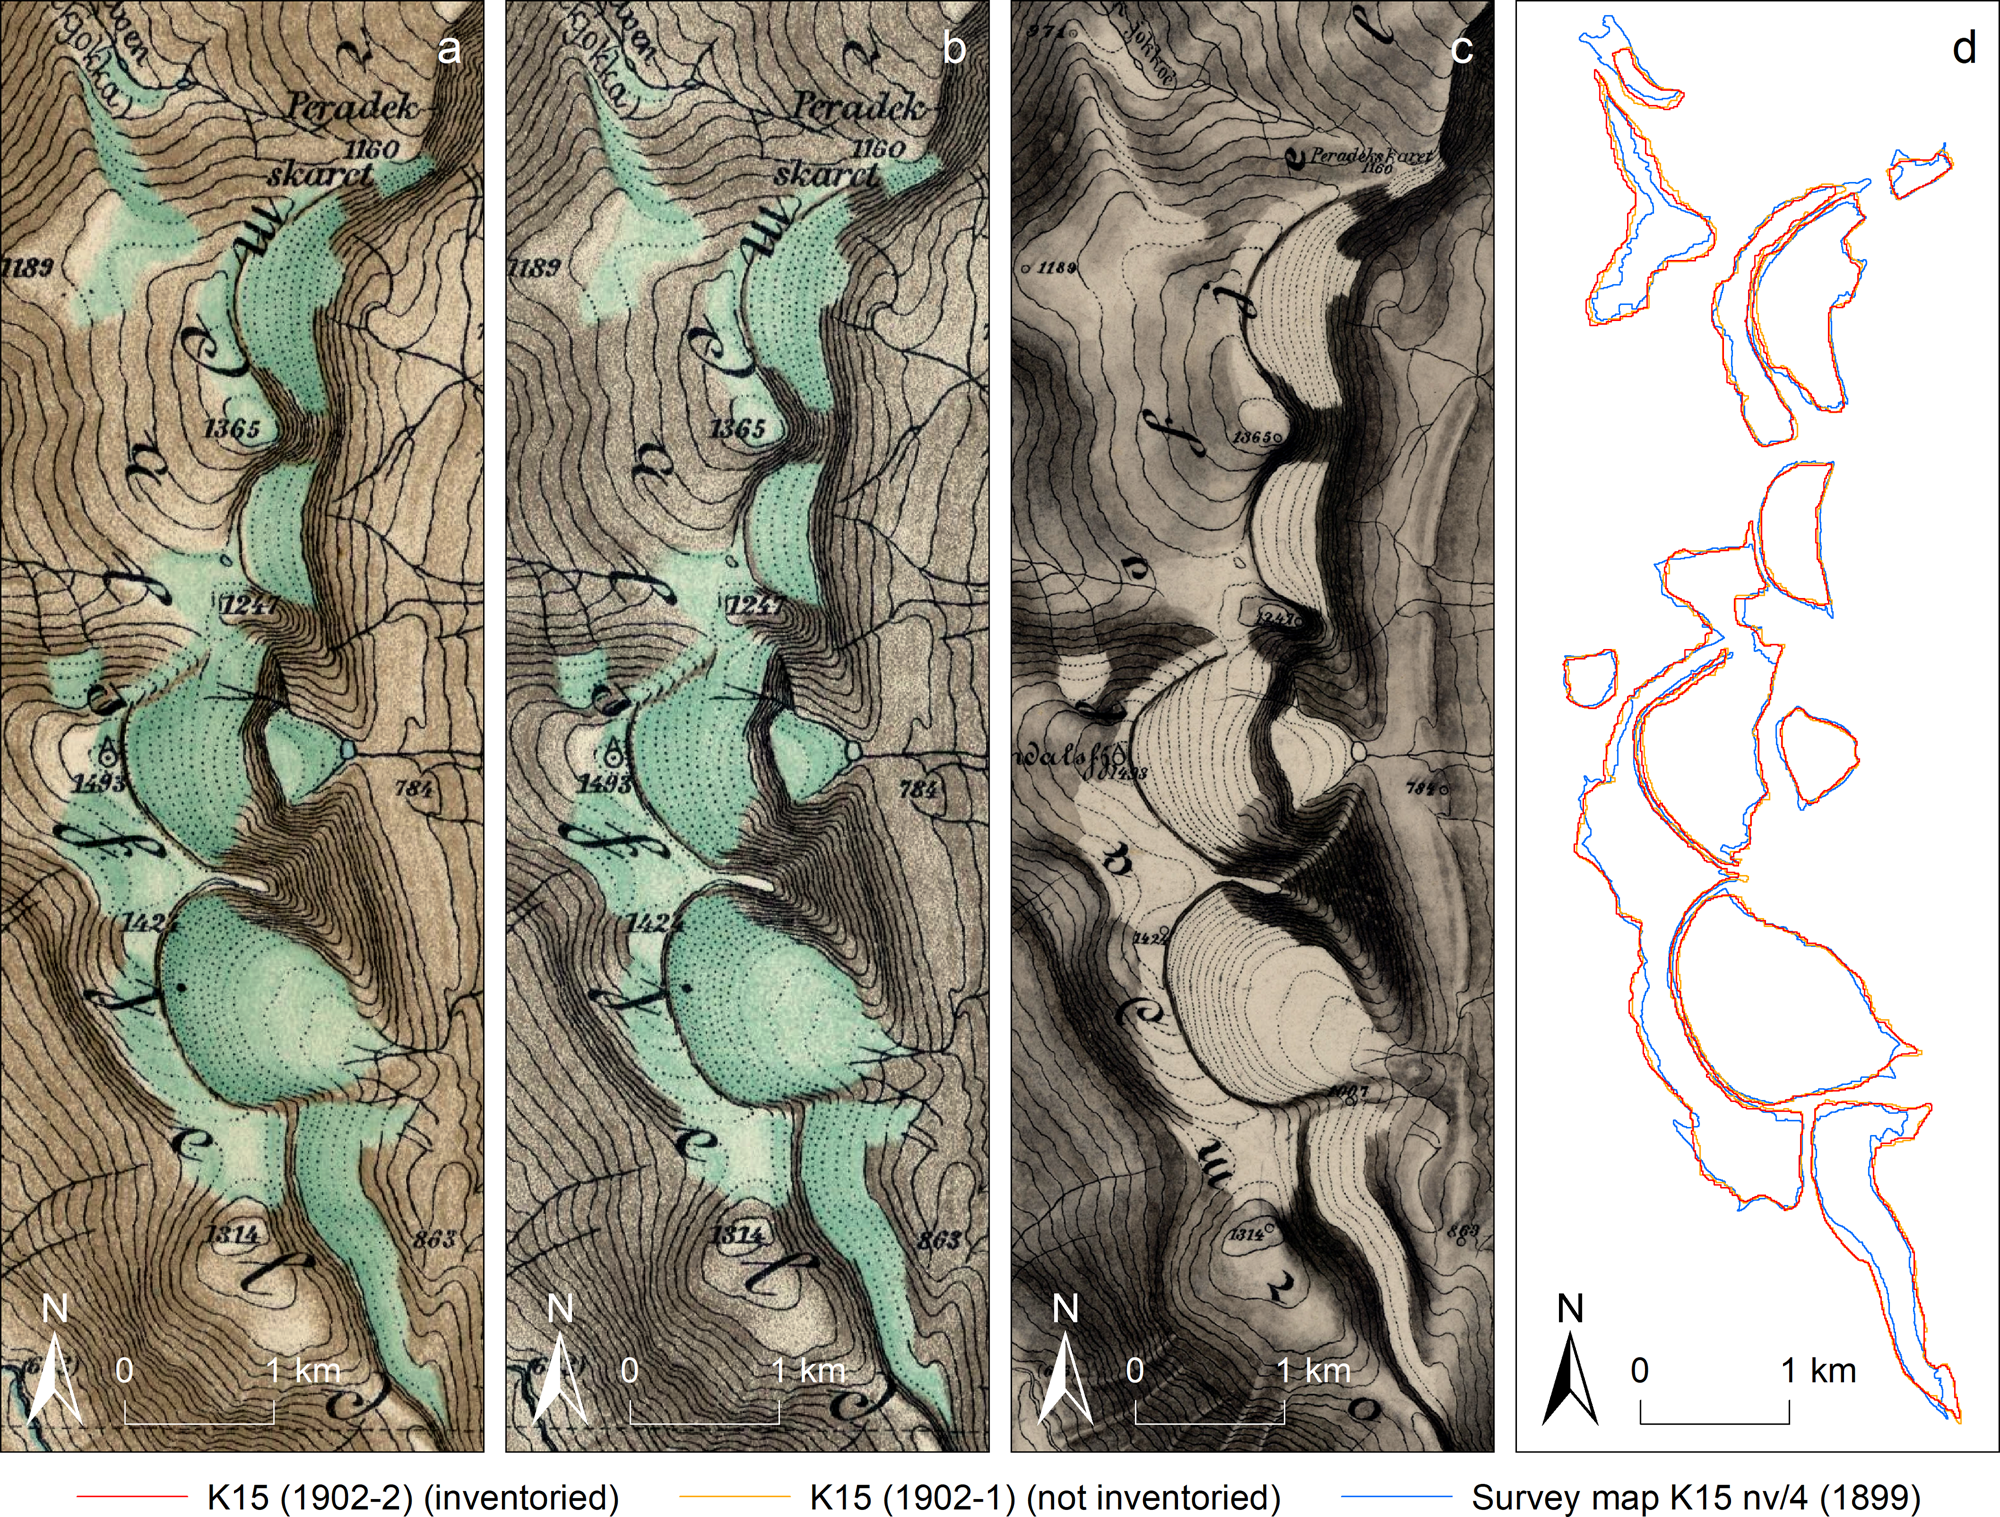
Fig. 7. Comparison of glacier area in the Stormdalsfjellet mountain range. (a) Print version 1902-2 (printed 06/1919) of map sheet K15 Dunderlandsdalen (1 : 100 000; produced by O. Tolstad and O. Engh; published in 1902; Norges geografiske oppmåling; available from Kartverket); this print version was used for the 1899 inventory; (b) K15 print version 1902-1 and (c) survey map K15 nv/4 (1 : 50 000; surveyed by Captain V. H. L. von Munthe af Morgenstierne, Captain C. M. N. Havig and Captain O. H. Paulsen; 1894, 1896 and 1899; Norges geografiske oppmåling; available from Kartverket). (d) Comparison of the 1899 glacier area as digitised from (a), (b) and (c).
The final step in digitising the glacier outlines in the raster graphics editor was to turn each map sheet into a stencil-like, monochromatic image, where only the digitised glacier polygons were visible in black on an otherwise white background (Fig. 5e). These monochromes were then used to overwrite the original GeoTIFF map files.
4.3 Geodatabase and polygon merge correction
After reapplying the geospatial information to the monochrome rasters (i.e. the former GeoTIFF map files), they were converted into GIS polygons in ArcGIS. These polygons were then compiled into a geodatabase, creating the 1899 glacier inventory. We clipped the dataset to the present-day outline of Norway to account for localised changes in the position of the border with Sweden (which did not affect boundary markers used in the georeferencing). Key metadata, including the original survey year/period of each glacier along with the surveyor(s), was extracted from the survey maps and linked to each glacier polygon in our geodatabase.
A number of glaciers extend across more than one map sheet, particularly Nordland's large plateau icefields such as Østre and Vestre Svartisen, Blåmannsisen, Okstindbreen and Frostisen. Their separate polygons had to be manually merged into one continuous glacier outline for each of these ice bodies. However, the georectified raster map sheets did not align seamlessly; both minor overlaps and narrow gaps occurred. This, in turn, translated into small misalignments between the digitised glacier parts (Fig. 8), so that the merging of polygons either meant glacier area was lost or gained (Table 3). For our entire Nordland inventory, the overlapping (i.e. deleted) polygon area is 2 km2, while an additional polygon area of 1 km2 had to be created in order to connect glacier polygons separated by gaps (see Table 3). As a result, a correction of 1 km2 has to be added to the total glacier area of our inventory to compensate for the area deficit.
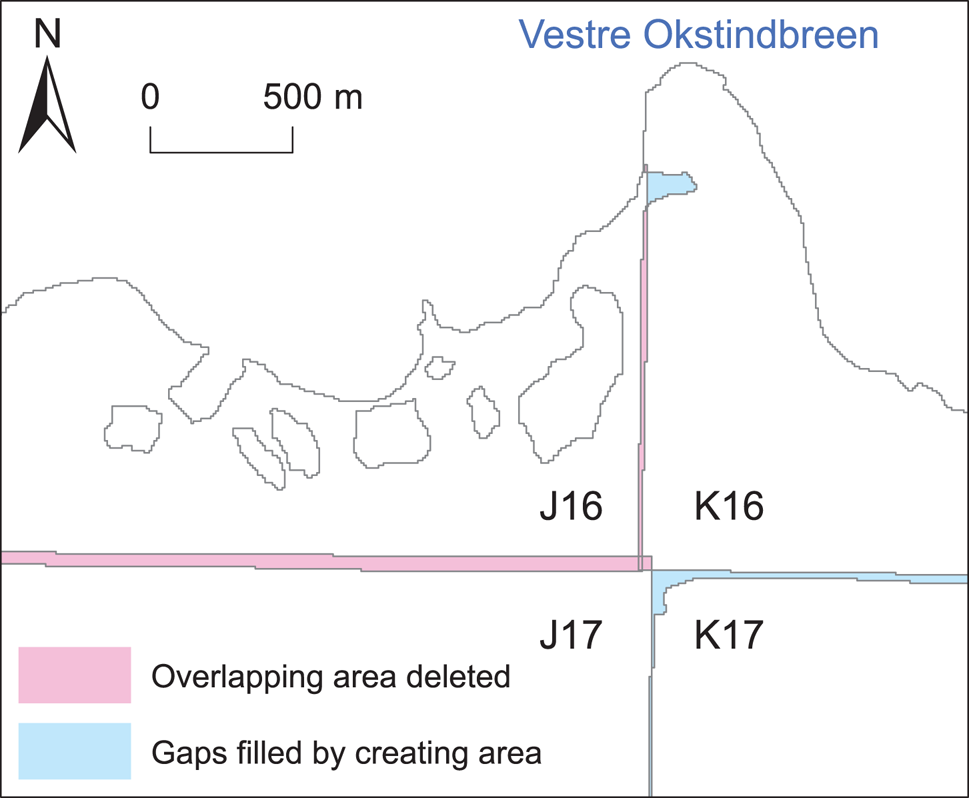
Fig. 8. Example of Okstindbreen extending across four map sheets. The merging of the separate polygons of the plateau icefield into one continuous outline resulted in both the loss of overlapping polygon area and the creation of additional glacier area.
Table 3. Overview of glacier area loss and/or gain due to the merging of separate icefield polygons and comparison of area change at the nine largest Nordland ice masses between 1899 and 2000 (Andreassen and others, Reference Andreassen, Winsvold, Paul and Hausberg2012a)
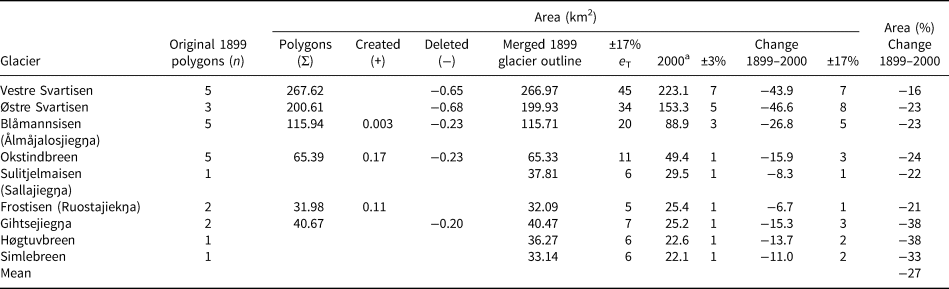
a Andreassen and others (Reference Andreassen, Winsvold, Paul and Hausberg2012a). Note that the 2000 icefield extents include the main 2000 icefield polygons and all additional 2000 ice bodies that lie within the respective 1899 polygon boundaries; the resulting area values can differ from those published in Andreassen and others (Reference Andreassen, Winsvold, Paul and Hausberg2012a, p. 51).
4.4 Snow-related error and total inventory uncertainty
Other inventories of Norwegian glaciers have shown that the digitised extent and area of the mostly debris-free glaciers in Norway is particularly prone to errors that arise from difficulties in differentiating between glacier ice and perennial/seasonal snow (e.g. Andreassen and others, Reference Andreassen, Paul, Kääb and Hausberg2008; Paul and Andreassen, Reference Paul and Andreassen2009). For the Svartisen–Blåmannsisen region, Paul and Andreassen (Reference Paul and Andreassen2009) estimated that this uncertainty might be 5–10% for glaciers over 5 km2 in size and as much as 25% for ice bodies smaller than 1 km2. Although our qualitative analysis of old survey reports and photographs suggests that seasonal snow was not included in the mapping (see Section 3.1), we suggest an error value in the range of that given by Paul and Andreassen (Reference Paul and Andreassen2009) is also reasonable for our dataset. To differentiate between glaciers and snowfields was probably as challenging in the field at the turn of the 19th century as it is today based on high-resolution remote-sensing data. We take the median of Paul and Andreassen's (Reference Paul and Andreassen2009) uncertainty range (15%) as a realistic value for the snow-related error (e S). This value is substantiated by long-term snow depth observations in Nordland (the first measurements began in 1895). These observations show that the period up to the 1920s was characterised by both large maximum snow depths and long durations of winter snow cover, particularly in the years 1904 and 1905 when values where as high as >1.5 m (Theakstone, Reference Theakstone2013). The deep-snow winter of 1905 was also noted by the surveyor First Lieutenant K. M. Leewy in his topographic description (Leewy, Reference Leewy1905; see Section 3.1). This allows us to calculate the total error (e T) associated with the 1899 glacier area, using the equation:
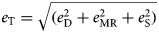
where the digitising error e D = ±4%; the map (re-)production error e MR = ±7% and the snow-related error e S = ±15%; which brings e T to ±17%.
4.5 1899 glacier inventory
Our 1899 inventory contains a total of 1587 glaciers with a combined area of 1736 ± 295 km2 (including the 1 km2 area correction; see Section 4.3). Nearly half of all inventoried glaciers (47%) are smaller than 0.1 km2; and 89% of the 1899 glaciers are below 1 km2 in area (Fig. 9). Table 3 lists the 1899 area of Nordland's nine largest ice masses. The plateau icefields Vestre Svartisen, Østre Svartisen and Blåmannsisen were 267 ± 45, 200 ± 34 and 116 ± 20 km2 in size, respectively. The number of glaciers within the present-day county boundaries of Nordland is 1540 with a total area of 1713 ± 291 km2 (including parts of ice masses located in Nordland but traversed by and extending across the county borders).
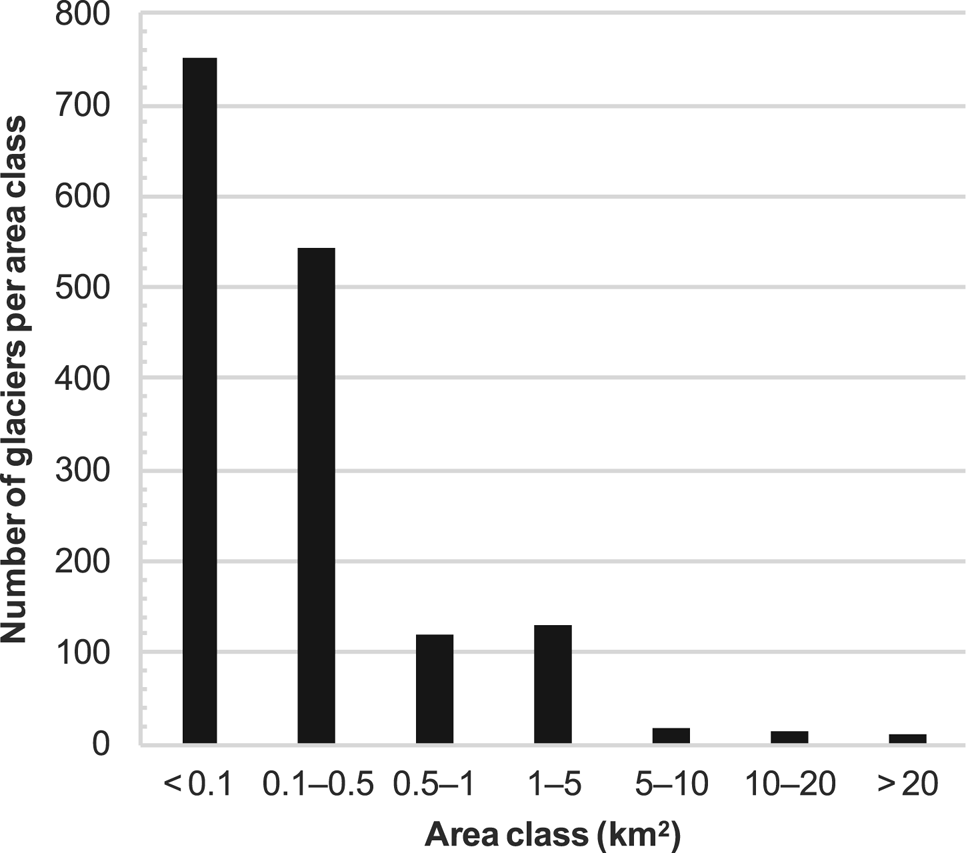
Fig. 9. Number of glaciers per glacier area class in the 1899 inventory (n = 1587 glaciers).
5. Independent quality assessment of glacier outline accuracy
In order to independently assess the accuracy of the 1899 glacier outlines, we developed a validation test using the post-LIA glacial history of Nordland (see Section 2). Following the LIA maximum in the mid-18th century, glacier retreat was initially slow, but accelerated dramatically between ~1930 and ~1970 (e.g. Theakstone, Reference Theakstone1965), after a brief period of renewed glacier advance at the beginning of the 20th century. Our test compared the historical 1899 outlines of selected glaciers in the Svartisen area with the glacier extent of the LIA maximum and to that of 1945 during the period of accelerated recession. In the context of the regional glacial history, the 1899 outlines had to lie between the LIA limit (1899 < LIA) and the 1945 glacier extent (1899 > 1945) to pass as accurate. The Svartisen glaciers selected for our test are considered a representative subset of the glacier types to be found in Nordland. These ranged from differently sized icefield outlet glaciers (Vestre Svartisen: Fonndalsbreen–Engabreen–Litlbreen, and outlets along the Vesterdalen valley, including Flatisen as an example of a glacier that exhibited post-LIA calving retreat; Østre Svartisen: Fingerbreen) to small mountain and valley glaciers adjacent to the northern sector of Østre Svartisen.
We used geomorphological mapping (e.g. Chandler and others, Reference Chandler2018) and the approach outlined in Weber and others (Reference Weber, Boston, Lovell and Andreassen2019) to reconstruct the maximum LIA extent of the selected glaciers, primarily from ice-marginal moraines, glacial drift limits, trimlines and identifiable erosion and weathering boundaries. Field mapping was carried out in summer 2016 and 2017 and was underpinned by remote mapping from high-resolution digital colour aerial photographs captured in 2007–14 (acquired from http://norgeibilder.no/). The 1945 glacier extent in these areas was extracted from post-WWII aerial reconnaissance photographs taken by the British Royal Air Force (RAF), which is the earliest available vertical aerial imagery of Svartisen. The scanned images were georeferenced and the 1945 outlines were manually digitised.
There are elements of uncertainty with the datasets we use in the independent assessment of accuracy. In Norway, the former maximum LIA extent is often clearly imprinted and readily discernible in the form of moraines, trimlines and a stark difference in vegetation density between the glacier forelands exposed since the LIA and the area beyond (e.g. Erikstad and Sollid, Reference Erikstad and Sollid1986; Baumann and others, Reference Baumann, Winkler and Andreassen2009; Stokes and others, Reference Stokes, Andreassen, Champion and Corner2018; Weber and others, Reference Weber, Boston, Lovell and Andreassen2019). In particular, Weber and others (Reference Weber, Boston, Lovell and Andreassen2019) found that nearly 60% of the Hardangerjøkulen icefield's LIA extent could be established from geomorphological evidence. Nonetheless, geomorphological mapping is not an objective practice, and both mapping errors and landform misinterpretation may occur (Chandler and others, Reference Chandler2018). The black-and-white RAF air photos contain geometric distortions (relief displacement) and have low contrast, particularly over and around ice masses. In addition, a major portion of many photographs shows glacier- and snow-covered terrain without identifiable landscape features, which made georeferencing challenging, especially in icefield summit areas without nunataks. The snowy, featureless icefield areas combined with the low contrast give rise to the risk of snow being included in the digitised 1945 glacier outlines.
With these caveats, our validation revealed that the selected icefield outlet glaciers and many of the larger valley glaciers generally meet the test criteria, and are therefore accurate. Their ice fronts can be seen to have terminated not far behind the outer LIA limit by the end of the 19th century (Fig. 10). This suggests that the topographers accurately delineated the extent of outlet and valley glaciers. These ice masses typically descend to areas of lower ground where summer ablation removes the snow cover and exposes bare ice, providing ideal survey conditions (see Fig. 3c). A few minor, local-scale violations of both criteria are, however, present, which mainly occur in the icefield summit areas. In instances where parts of the 1945 glacier outlines are slightly more extensive than their 1899 counterparts, the most likely explanations are relief displacement or ice-marginal snow in the RAF photographs, which were passed on to the digitised 1945 glacier extents. In those instances where the 1899 glacier outlines slightly extend beyond the reconstructed LIA limit, map georeferencing may be a factor because our georeferencing approach (see Section 4.1) favoured geolocation accuracy of an entire map sheet over local accuracy around individual ice masses.
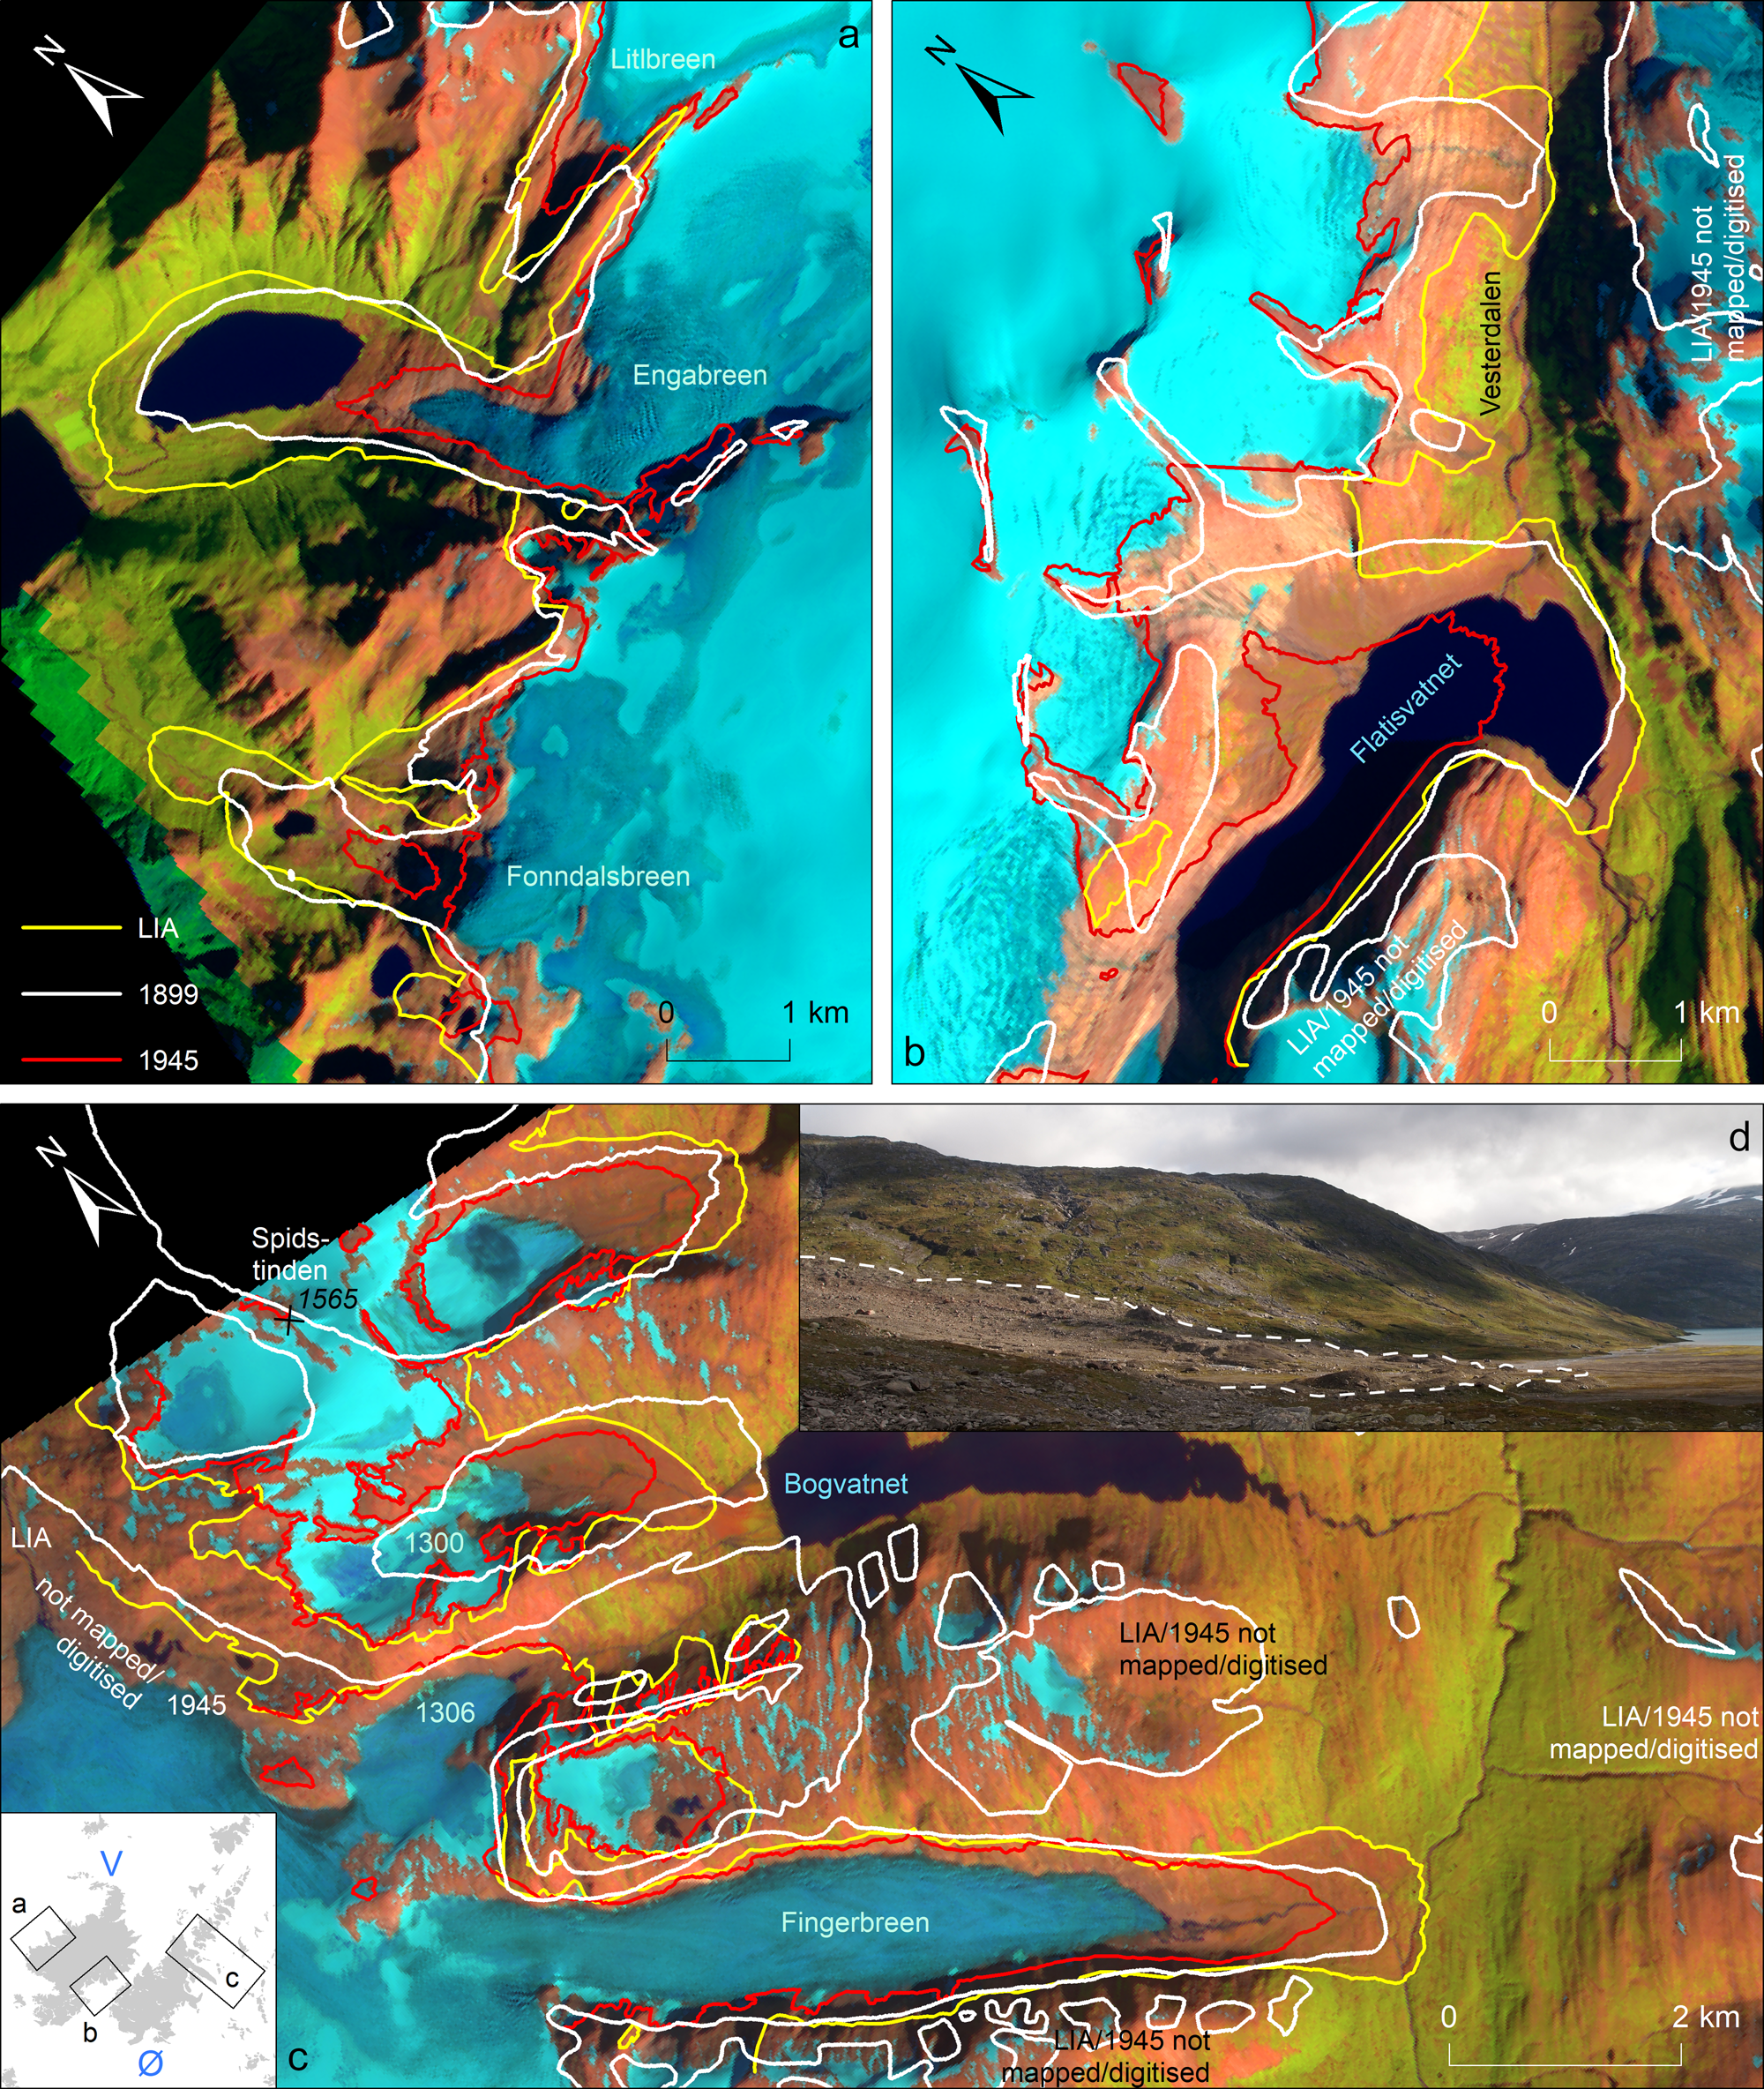
Fig. 10. LIA, 1899 and 1945 extent of (a) Vestre Svartisen's western outlet glaciers Fonndalsbreen, Engabreen and Litlbreen; (b) Vestre Svartisen's eastern outlet glacier Flatisen and smaller icefield outlets along the Vesterdalen valley and (c) Østre Svartisen's eastern outlet glacier Fingerbreen and small mountain glaciers to the north. Background images are a Sentinel-2A scene (bands 11, 8, 2) from 26 August 2016 (acquired from the Copernicus Open Access Hub). The inset map shows the locations of the three areas. The 1899 glacier outlines can be deemed accurate and reliable if they fall within the LIA and 1945 glacier extent (LIA > 1899 > 1945). (d) Photograph showing the foreland of glacier 1300, as viewed to the north. The maximum LIA extent is defined by moraine ridges and a clear trimline along the valley side (indicated by white dashed line), without vegetation cover inside the LIA limit. A proglacial outwash plain has accumulated beyond the LIA maximum moraines and extends to the Bogvatnet (Tjoamodisjávrre) lake.
For the 1899 outlines of the small mountain and valley glaciers to the north of Fingerbreen (Østre Svartisen), we found evidence of both over- and underestimated ice masses (Fig. 10c). The most notable example is the small valley glacier (glacier ID 1300) to the northwest of the Bogvatnet (Tjoamodisjávrre) lake. Moraine ridges and a pronounced trimline mark the glacier's maximum LIA position, which is located ~450 m from the lakeshore (Fig. 10d). An extensive glaciofluvial outwash plain occupies the intervening area. The valley sides above the LIA trimline are gullied and well vegetated, suggesting prolonged ice-free conditions. Despite this strong evidence for the glacier's LIA maximum, the 1899 outline is shown on the historical maps to have extended all the way down to the lake and laterally up the northern valley side (Fig. 10c), which constitutes a clear mapping error. Geomorphological evidence also indicates an exaggerated 1899 glacier extent in the neighbouring valley to the south (glacier ID 1306) (Fig. 10c). By contrast, when the 1899 outline of glacier 1300 is compared to the 1945 extent, a marked underestimation of the accumulation area is evident (Fig. 10c). This also applies to the accumulation areas of the small ice masses occupying the Spidstinden massif, some of which were not mapped at all by the topographers (Fig. 10c). We speculate that the complex, mountainous topography hindered the precise mapping of these glaciers. Underestimation of glacier accumulation areas was probably amplified by the conservative mapping approach of the surveyors in snow-covered terrain (see Section 3.1).
Based on the sample of glaciers included in our test, it seems that over- and underestimation of small ice masses on the historical maps is present to an approximately equal degree and more or less balance each other out. Icefield outlet glaciers and larger ice masses, on the other hand, appear to have been accurately mapped. Overall, we judge that this does not affect our calculated inventory uncertainty. Our test approach would benefit from spatially more extensive validation datasets, particularly of digital outlines of the maximum LIA glacier extent, to provide a significant baseline for inventory comparisons.
6. Quantifying 20th-century glacier recession in Nordland
We performed a glacier area change assessment by comparing our 1899 glacier inventory to the inventories for 1976 and 1988 (Winsvold and others, Reference Winsvold, Andreassen and Kienholz2014) and 2000 (Andreassen and others, Reference Andreassen, Winsvold, Paul and Hausberg2012a). Since the Andreassen and others (Reference Andreassen, Winsvold, Paul and Hausberg2012a) inventory was created from what is now ~20-year old Landsat data, our change analysis used the full, unprocessed inventory area in the calculations, without separating the glaciers into glacier-hydrological units (as is the norm; cf. Racoviteanu and others, Reference Racoviteanu, Paul, Raup, Khalsa and Armstrong2009). Once new inventories of the present-day glacier extent are available, our dataset can be used as a baseline for a more extensive and thorough analysis of individual drainage basins. For such an analysis, it would be important to use the survey date for individual glaciers, rather than the overall inventory median date of 1899 that we use here.
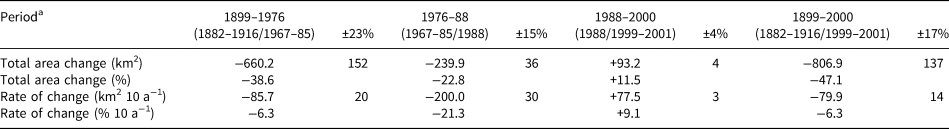
All inventories were clipped to the present-day county boundaries of Nordland, which excluded from our analysis a small number of 1899 glaciers located in the neighbouring counties as well as parts of glaciers extending across the county borders. Also omitted from the analysis were ice masses smaller than 0.01 km2 in area (n = 65). We calculated absolute and relative glacier area change for each time step between the successive inventories, as well as for the entire ~100-year period. Decadal rates of area change were computed using compound interest calculation (Andreassen and others, Reference Andreassen, Paul, Kääb and Hausberg2008; Zemp and others, Reference Zemp, Kargel, Leonard, Bishop, Kääb and Raup2014). We calculated the uncertainty associated with the glacier area change in each interval by inserting the error values of the respective inventories into Eqn (1), where the error value for the 1899 inventory is 17% (e T); 15% for the 1976 inventory (based on e S because of the potential amount of ice-marginal snow included in the 1976 glacier outlines; Paul and Andreassen, Reference Paul and Andreassen2009); and 3% each for the satellite-derived 1988 and 2000 inventories (following Andreassen and others, Reference Andreassen, Winsvold, Paul and Hausberg2012a). This resulted in uncertainty values of 23% for the period 1899–1976; 15% for the period 1976–88; 4% for the period 1988–2000 and 17% for the total 1899–2000 period (Table 4). All values stated here have been rounded to the nearest integer to not give a false impression of accuracy. Nordland's glaciers covered 1712 ± 291 km2 in 1899 (n = 1475). Changes in glacier area between the four inventories are summarised in Table 4. From 1899 to 1976, the glacier area change in Nordland was −39% (−660 ± 152 km2), which equates to a decadal rate of area loss of 6% 10 a−1 (86 ± 20 km2 10 a−1). Areal shrinkage continued in the period 1976–88 (23%; 240 ± 36 km2), albeit at a significantly faster rate of 21% 10 a−1 (200 ± 30 km2 10 a−1). In the final period 1988–2000, Nordland's glaciers grew by 11% (93 ± 4 km2), which translates into a decadal rate of area growth of 9% 10 a−1 (78 ± 3 km2 10 a−1). Over the total ~100-year period up to 2000, the glaciers in Nordland lost almost half of their original 1899 area (47%; 807 ± 137 km2), with a decadal rate of recession of 6% 10 a−1 (80 ± 14 km2 10 a−1). Total area change was lower for the nine largest icefields, which receded by 27% on average between 1899 and 2000, with the lowest recession recorded at Vestre Svartisen (16%) (Fig. 11), while the three smallest icefields in this group retreated in excess of 30% (Table 3). The number of glaciers in Nordland decreased by 54% (n = 795) from 1475 in 1899 to 680 in 2000.
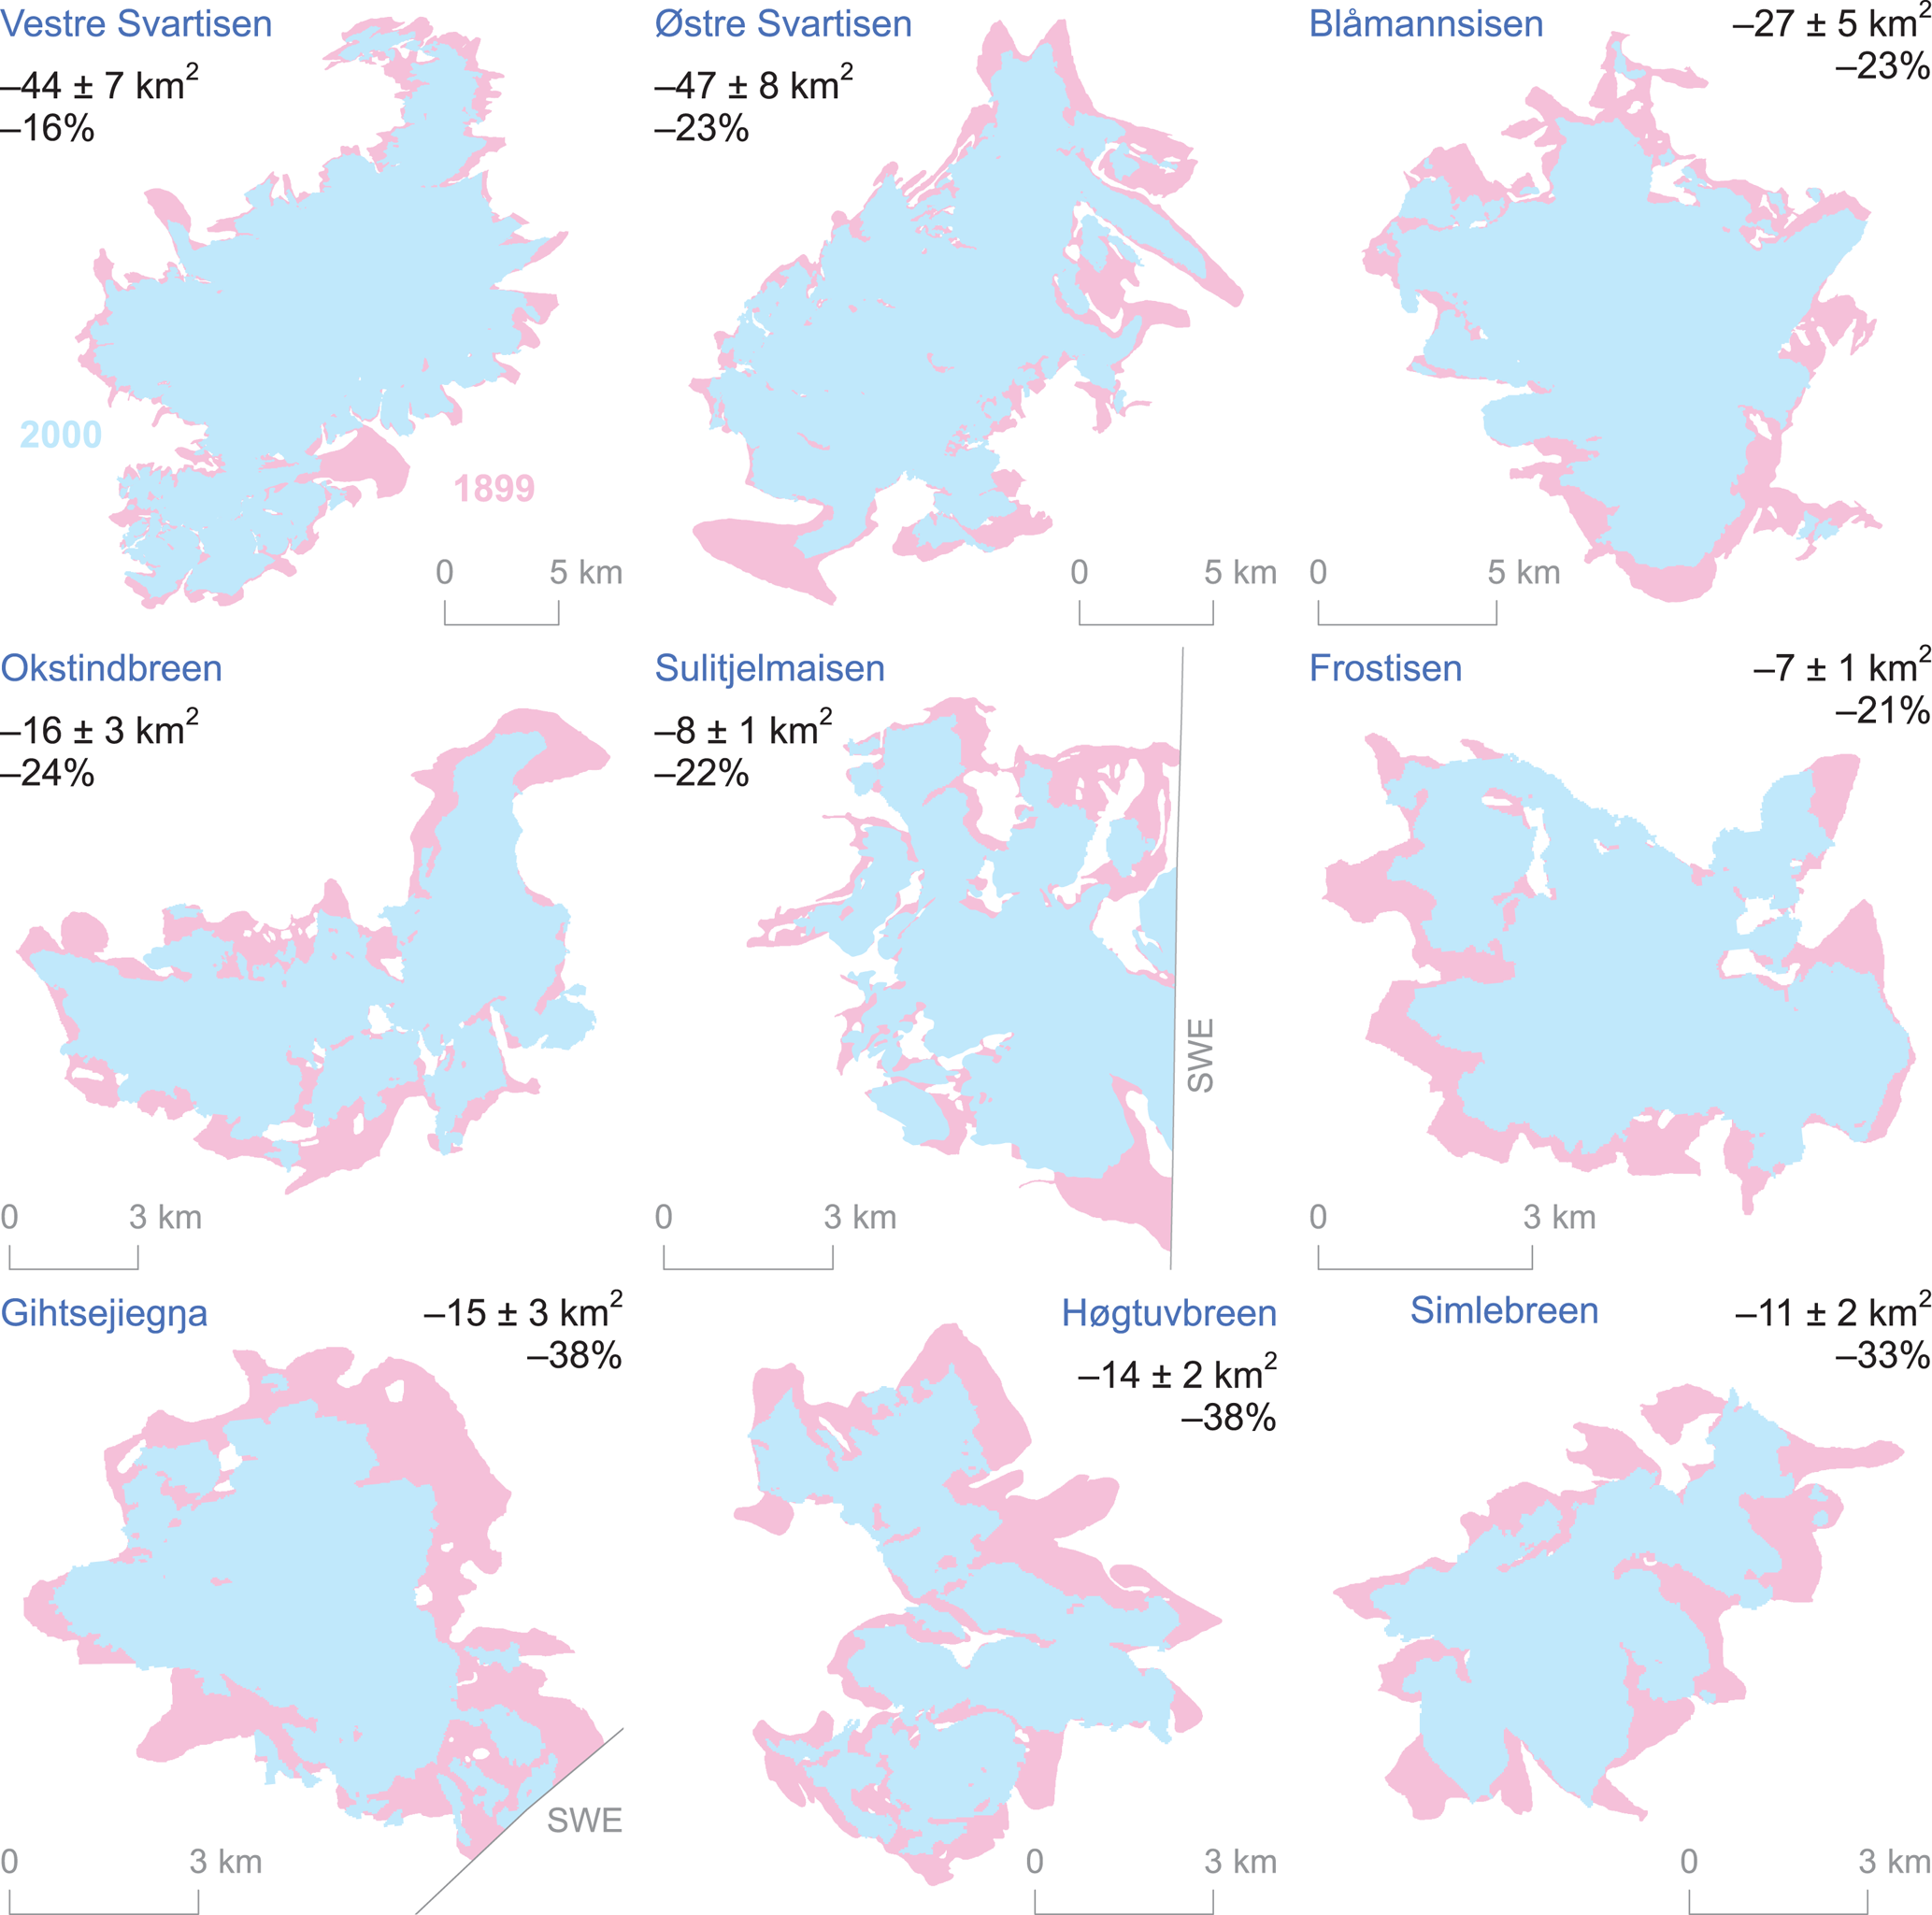
Fig. 11. Glacier area change at the nine largest Nordland ice masses between 1899 and 2000 (Andreassen and others, Reference Andreassen, Winsvold, Paul and Hausberg2012a). See Figure 1 for locations.
Table 4. Comparison of rates of glacier area change in Nordland for each measurement period
a Median of each time interval; used as basis for calculations.
Here, we discuss our results in the context of existing estimates of centennial-scale glacier change from historical maps both in Norway and elsewhere. Winsvold and others (Reference Winsvold, Andreassen and Kienholz2014) assessed 20th-century glacier change from three gradteigskart map sheets of Finnmark, northernmost Arctic Norway (Fig. 1). They found that the five major plateau icefields Langfjordjøkelen (Bártnatvuonjiehkki), Øksfjordjøkelen (Ákšovuonjiehkki), Svartfjelljøkelen, Seilandsjøkelen (Nuortageašjiehkki) and Nordmannsjøkelen (Dáččavuonjiehkki) had receded by an average of 53% (7% 10 a−1) in the period 1895–2006 (decadal rate calculated from data given in Winsvold and others, Reference Winsvold, Andreassen and Kienholz2014). These values compare well with total 20th-century glacier change across Nordland (−47%; −6% 10 a−1). However, when considering icefield-type glaciers alone, mean glacier area loss at the nine largest Nordland icefields (27%; 3% 10 a−1; Table 3) represents only half of the change that Winsvold and others (Reference Winsvold, Andreassen and Kienholz2014) reconstructed for Finnmark. This indicates that plateau icefields in northernmost Arctic Norway experienced particularly severe recession in the 20th century, which is supported by surface mass-balance modelling and geodetic mass-balance measurements at Langfjordjøkelen (Andreassen and others, Reference Andreassen, Kjøllmoen, Rasmussen, Melvold and Nordli2012b).
Two studies have calculated long-term glacier change in southern Norway from gradteigskart maps: an area loss of 23% (~4% 10 a−1) between 1931–34 and 2003 in the Jotunheimen mountains (Andreassen and others, Reference Andreassen, Paul, Kääb and Hausberg2008); and a decrease of 24% (~4% 10 a−1) in the period 1926–2003 at the Hardangerjøkulen icefield (Weber and others, Reference Weber, Boston, Lovell and Andreassen2019) (Fig. 1). Areal change at Hardangerjøkulen is comparable with average icefield recession in Nordland (Table 3), although we note the later date of the historical survey and thus the shorter time step between the two Hardangerjøkulen inventories (<80 years). By contrast, there is less agreement between Nordland and areal change of the more continental mountain glaciers in Jotunheimen, but, again, the measurement interval between the Jotunheimen inventories is considerably shorter (~70 years). Taken together, the four Norwegian regions for which 20th-century glacier area change has been quantified from historical gradteigskart maps experienced a total area loss of ~942 km2 over the last century. These four regions still contained 1142 km2 of glacier area in the ~2000 inventory by Andreassen and others (Reference Andreassen, Winsvold, Paul and Hausberg2012a).
In the Canadian Rocky Mountains, Tennant and others (Reference Tennant, Menounos, Wheate and Clague2012) documented a 40 ± 5% reduction in ice cover between 1919 and 2006, at a decadal rate of 5 ± 1% 10 a−1. Tielidze (Reference Tielidze2016) reported an area loss of 42 ± 2% (7 ± 0.2% 10 a−1) for the glaciers in the Caucasus Mountains of Georgia in the period 1911–2014. Glacier area in the Swiss Alps shrank by 47% (6% 10 a−1) between ~1900 and 2010 (or 41% between ~1900 and 2003; 5% 10 a−1), based on data provided by Freudiger and others (Reference Freudiger, Mennekes, Seibert and Weiler2018) (however, note that this study used the publication date of the historical maps as timestamps). The results of these studies show consistency with the 47% (6% 10 a−1) glacier area decline in Nordland between 1899 and 2000.
Overall, the few glacier inventories based on historical map analysis suggest that mountain glaciers in western Eurasia and western Canada have substantially decreased in area over the course of the 20th century, and that this recession was similar in terms of both the percentage area lost and the relative rate of shrinkage. Conversely, 20th-century retreat of the tropical Kilimanjaro icefields in eastern Africa was approximately twice that of the Northern Hemisphere examples (1912–2003: 78%; 17% 10 a−1; 1912–2011: 85%; 19% 10 a−1; calculated using data from Cullen and others, Reference Cullen2013).
7. Conclusions and recommendations
We present an inventory of the ~1899 glacier extent in Nordland county, northern Norway, from historical gradteigskart maps. The maps are based on topographic field surveys that took place between 1882 and 1916. Although the survey duration of 34 years is not comparable to the temporal coverage and revisit time of modern satellite platforms used in contemporary glacier monitoring, the uniform, systematic and continuous mapping programme ensured that the maps are of high quality and consistent in both form and content. Historical survey reports and photographs suggest that glacier mapping was carried out accurately and in a careful and conservative manner in areas of snow-covered terrain that could be erroneously mapped as glacier ice. Thus, the maps can serve as a basis for a glacier inventory. We digitised glacier outlines from georectified scans of 33 Nordland map sheets in a raster graphics editor employing a semi-automated procedure. The outlines were then compiled and inventoried in a GIS. Errors relating to glacier outline digitisation, map (re-)production and ice-marginal snow amount to a total inventory uncertainty of ±17%. In an additional independent validation of the accuracy of the historical glacier extent, we compared the 1899 outlines of selected glaciers in the Svartisen area with the maximum LIA glacier extent (established from geomorphological evidence) and the 1945 glacier extent (extracted from RAF vertical aerial photographs). For the 1899 glacier outlines to be accurate, their extent had to be smaller than at the LIA maximum, but larger than that of 1945 (LIA > 1899 > 1945). The test shows that both underestimated and exaggerated outlines are present, with misestimation more of a problem for small glaciers and ice masses in complex alpine terrain, but less of an issue for larger valley glaciers and icefield outlets.
Our 1899 inventory contains 1475 glaciers (⩾0.01 km2) within the county boundaries of Nordland, with a combined area of 1712 ± 291 km2. Since the end of the 19th century, substantial changes in the areal extent of Nordland's glaciers have occurred. Between 1899 and 2000, the total glacier cover decreased by 47% (807 ± 137 km2) at a decadal rate of 6% 10 a−1 (80 ± 14 km2 10 a−1). This demonstrates the value of historical maps for improving understanding of 20th-century glacier change. A more detailed assessment of change in comparison with an updated 21st-century glacier inventory, and at an individual glacier-unit level, should be a priority for future work.
Based on our research, we recommend that future studies of glacier inventories from old maps should first assess the overall quality of the historical map source and, in particular, the mapping approach and accuracy of ice masses depicted on the maps. For instance, this could include examining historical survey instructions, reports, photographs or other available historical observations. Second, detected mapping errors/inconsistencies as well as uncertainties relating to the GIS-based production of the glacier inventory should be reported, quantified and, most crucially, combined into a total inventory uncertainty, with corresponding error terms for all calculated glacier area values. Third, where possible, the inventoried glacier outlines should be independently validated against separate datasets, for example other available glacier inventories or the maximum LIA extent. Observed occurrences of over- or underestimation should be reported in the inventory metadata, and, if significant, incorporated into the total inventory uncertainty. Finally, in order to employ the inventory in glacier change assessments, it is important to establish the actual survey date of each inventoried glacier polygon. Using the publication date of the maps, which may have been much later than the original map surveys, precludes glacier change from being compared to other glacier regions and from being linked to (sub-)decadal variations in climate. Ideally, glacier change should be calculated for each individual ice body and its respective change period before computing the mean change (Winsvold and others, Reference Winsvold, Andreassen and Kienholz2014). Following these general guidelines will ensure that historical maps can be utilised to their full potential, while gaining a realistic picture of the uncertainties (and possible shortcomings) associated with historical map-based glacier inventories.
Data
The 1899 glacier inventory can be viewed online and downloaded from NVE's digital glacier atlas (‘NVEs Breatlas’), available at https://www.nve.no/hydrology/glaciers/. All historical maps can be freely accessed via Kartverket's online database of historical maps of Norway; https://kartverket.no/Kart/Historiske-kart/.
Acknowledgements
Thanks are due to Nasjonalbiblioteket (National Library of Norway) for providing high-resolution scans of selected gradteigskart survey photographs. We also thank Benjamin M. P. Chandler for fieldwork assistance at Østre Svartisen in 2016. PW gratefully acknowledges funding from the EU's Erasmus+ programme and the University of Portsmouth's Placement Scheme for Postgraduate Researchers, enabling invaluable research stays at NVE. PW's fieldwork in the Vesterdalen valley was funded by a Mount Everest Foundation (MEF) expedition grant (Reference 17-36). A British Society for Geomorphology ECR grant awarded to CMB aided in ground truthing LIA limits at Østre Svartisen. The manuscript benefited from constructive comments by Wilfred Theakstone and an anonymous reviewer and editorial handling by Neil Glasser. This work is also a contribution to the Norwegian Copernicus Glacier Service project (Contract NIT.06.15.5), partly funded by the Norwegian Space Centre through Copernicus.
Author contributions
PW: Conceptualisation, methodology, GIS and field investigation, archival research, analysis, writing – original draft, figure preparation.
LMA, CMB, HL and SK: Conceptualisation (LMA), field investigation (CMB and HL), archival research (SK), writing – review and editing, supervision (LMA, CMB and HL).


 Open access