

Introduction
Major depressive disorder (MDD) is a chronic mental disease with a remitting and relapsing course. Repetitive transcranial magnetic stimulation (rTMS) as a treatment method for MDD has been studied thoroughly over the past few years. High frequency (HF, 10 Hz) rTMS applied to the left dorsolateral prefrontal cortex (DLPFC) (Schutter, Reference Schutter2009) as well as low frequency (LF, 1 Hz) rTMS applied to the right DLPFC (Schutter, Reference Schutter2010) showed to have antidepressant effects. Additionally, left and right DLPFC stimulation seem to have similar clinical effects (Fitzgerald et al., Reference Fitzgerald, Brown, Marston, Daskalakis, de Castella and Kulkarni2003, Reference Fitzgerald, Hoy, Daskalakis and Kulkarni2009). rTMS also showed to be effective in treatment-resistant depression (Gaynes et al., Reference Gaynes, Lloyd, Lux, Gartlehner, Hansen, Brode, Jonas, Swinson Evans, Viswanathan and Lohr2014). However, even though rTMS is well accepted as a treatment option for MDD, response rates remain relatively low, ranging from 29.3% (Berlim et al., Reference Berlim, van den Eynde, Tovar-Perdomo and Daskalakis2014) to 58% (Carpenter et al., Reference Carpenter, Janicak, Aaronson, Boyadjis, Brock, Cook, Dunner, Lanocha, Solvason and Demitrack2012) in HF-rTMS, which is similar to a study that employed LF as well as HF rTMS [response rates 45% and 44%, respectively (Fitzgerald et al., Reference Fitzgerald, Hoy, Daskalakis and Kulkarni2009)]. Finding psychological measures that are associated with treatment response may help to identify those patients who have a greater chance of achieving response. Additionally, finding predictors that can enhance treatment allocation accuracy might increase response rates by immediately indicating the optimal treatment to a given patient, thereby saving time and money.
Substantial research has been done investigating the relationship between behavior, depression, and treatment response. Frequently studied domains include the ‘Big Five Personality Traits’ [neuroticism, extraversion, openness, conscientiousness, and agreeableness (Goldberg, Reference Goldberg1990)], anhedonia, depression severity, stress, and anxiety. A robust finding seems to be the relationship between the personality traits neuroticism and extraversion, wherein neuroticism seems to be positively associated to MDD (Jylhä and Isometsä, Reference Jylhä and Isometsä2006; Griffith et al., Reference Griffith, Zinbarg, Craske, Mineka, Rose, Waters and Sutton2010; Kotov et al., Reference Kotov, Gamez, Schmidt and Watson2010; Rosellini and Brown, Reference Rosellini and Brown2011; Hayward et al., Reference Hayward, Taylor, Smoski, Steffens and Payne2013), and extraversion seems to be inversely associated with MDD (Jylhä and Isometsä, Reference Jylhä and Isometsä2006; Kotov et al., Reference Kotov, Gamez, Schmidt and Watson2010; Rosellini and Brown, Reference Rosellini and Brown2011; Hayward et al., Reference Hayward, Taylor, Smoski, Steffens and Payne2013). Other studies have also elaborated on the association between personality traits and MDD by including treatment response. For example, Bagby and colleagues found that MDD patients with higher scores on neuroticism are more likely to respond to pharmacotherapy, rather than to cognitive behavioral therapy (Bagby et al., Reference Bagby, Quilty, Segal, McBride, Kennedy and Costa2008). Similarly, Quilty and colleagues found that neuroticism was indicative of a lower probability of response, whereas conscientiousness was predictive of a higher probability of response to combined pharmacotherapy and psychotherapy (Quilty et al., Reference Quilty, De Fruyt, Rolland, Kennedy, Rouillon and Bagby2008). A review by Mulder evaluated antidepressant response in a variety of treatments, including psychotherapy, pharmacotherapy, electroconvulsive therapy (ECT), or a combination thereof, and reported that higher neuroticism generally predicts worse treatment outcome, especially in the long-term (Mulder, Reference Mulder2002). However, not many studies focused on rTMS as a treatment. Berlim and colleagues demonstrated that neuroticism was found to decrease during rTMS treatment, yet lacked predictive value, whereas baseline extraversion levels predicted greater treatment response (Berlim et al., Reference Berlim, McGirr, Beaulieu, Van den Eynde and Turecki2013). In a study that focused on deep TMS (dTMS), higher agreeableness and higher conscientiousness were observed in patients who achieved remission (McGirr et al., Reference McGirr, Van den Eynde, Chachamovich, Fleck and Berlim2014).
Another psychological dimension that gained interest as a predictor of treatment outcome in MDD is anhedonia. Anhedonia is a core MDD symptom. Recently, the importance of considering the role of anhedonia in MDD has been highlighted (Treadway and Zald, Reference Treadway and Zald2011; Pizzagalli, Reference Pizzagalli2014). It has been argued that anhedonia is a difficult symptom to treat (Treadway and Zald, Reference Treadway and Zald2011) and multiple studies have shown that higher levels of anhedonia are predictive of poorer treatment outcome (Spijker et al., Reference Spijker, Bijl, de Graaf and Nolen2001; McMakin et al., Reference McMakin, Olino, Porta, Dietz, Emslie, Clarke, Wagner, Asarnow, Ryan, Birmaher, Shamseddeen, Mayes, Kennard, Spirito, Keller, Lynch, Dickerson and Brent2012). Likewise, improvements in anhedonia levels predicted increased psychosocial functioning in patients with MDD, which is in turn an important feature of treatment response and remission (Vinckier et al., Reference Vinckier, Gourion and Mouchabac2017). In an rTMS study, Downar and colleagues found that their groups of MDD non-responders to rTMS treatment were marked by more anhedonic symptoms (Downar et al., Reference Downar, Geraci, Salomons, Dunlop, Wheeler, McAndrews, Bakker, Blumberger, Daskalakis, Kennedy, Flint and Giacobbe2014). Likewise, a recent study by Rostami and colleagues found that loss of interest (an anhedonia-related symptom) predicted rTMS treatment response (Rostami et al., Reference Rostami, Kazemi, Nitsche, Gholipour and Salehinejad2017).
Next to such individual symptoms, overall depression severity is also considered an important treatment response predictor, with higher pretreatment depression severity being associated with lower response rates (Croughan et al., Reference Croughan, Secunda, Katz, Robins, Mendels, Swann and Harris-Larkin1988; Trivedi et al., Reference Trivedi, Rush, Wisniewski, Nierenberg, Warden, Ritz, Norquist, Howland, Lebowitz, McGrath, Shores-Wilson, Biggs, Balasubramani and Fava2006), however, the interaction between depression severity and treatment response is unclear. For example, in a placebo-controlled study Fournier and colleagues found that at mild to moderate levels of MDD, beneficial effects of antidepressants were minimal to none, however, at very severe levels of depression severity, there was a substantial benefit of the usage of medications (Fournier et al., Reference Fournier, DeRubeis, Hollon, Dimidjian, Amsterdam, Shelton and Fawcett2010). A similar trend of response was observed in those with high depression severity when assigned to the treatment or placebo group. That is, those with high depression severity that were assigned to the treatment group were more likely to have a greater response (i.e. the higher the severity, the greater the response), whereas those with high severity that were assigned to the placebo group were more likely to have a smaller response (i.e. the higher the severity, the smaller the response) (Khan et al., Reference Khan, Leventhal, Khan and Brown2002). For rTMS, it has been reported that younger patients with a lower baseline depression severity had a modestly better treatment outcome (Carpenter et al., Reference Carpenter, Janicak, Aaronson, Boyadjis, Brock, Cook, Dunner, Lanocha, Solvason and Demitrack2012). Likewise, Fitzgerald and colleagues found that rTMS responders had lower baseline depression severity, however, it did not sufficiently influence response rates to base treatment decisions on (Fitzgerald et al., Reference Fitzgerald, Hoy, Anderson and Daskalakis2016).
Finally, anxiety and stress are also associated with MDD and treatment response. Higher levels of anxiety have been associated with greater depression severity (Fava et al., Reference Fava, Alpert, Carmin, Wisniewski, Trivedi, Biggs, Shores Wilson, Morgan, Schwartz, Balasubramani and Rush2004; Uher et al., Reference Uher, Dernovsek, Mors, Hauser, Souery, Zobel, Maier, Henigsberg, Kalember, Rietschel, Placentino, Mendlewicz, Aitchison, McGuffin and Farmer2011) and lower response to pharmacological treatment (Fava et al., Reference Fava, Rush, Alpert, Balasubramani, Wisniewski, Carmin, Biggs, Zisook, Leuchter, Howland, Warden and Trivedi2008). It has even been proposed that depression with increased levels of anxiety could be a distinguished subtype of MDD (Fava et al., Reference Fava, Alpert, Carmin, Wisniewski, Trivedi, Biggs, Shores Wilson, Morgan, Schwartz, Balasubramani and Rush2004). However, the association between higher anxiety levels and decreased response to treatment is modest (Joffe et al., Reference Joffe, Bagby and Levitt1993) and inconsistently replicated, including reports of patients with anxious depression responding better to ketamine treatment (Ionescu et al., Reference Ionescu, Luckenbaugh, Niciu, Richards, Slonena, Vande Voort, Brutsche and Zarate2014), or reports in which anxious depression is not found to be predictive of worse pharmacological treatment response (Uher et al., Reference Uher, Dernovsek, Mors, Hauser, Souery, Zobel, Maier, Henigsberg, Kalember, Rietschel, Placentino, Mendlewicz, Aitchison, McGuffin and Farmer2011). In rTMS studies, it has been found that rTMS non-responders had higher baseline anxiety than responders (Brakemeier et al., Reference Brakemeier, Luborzewski, Danker-Hopfe, Kathmann and Bajbouj2007). For stress, it has been suggested that chronic stress is predictive of depression, even more so than acute stressors (McGonagle and Kessler, Reference McGonagle and Kessler1990; Hammen, Reference Hammen2005). Some studies support this, see for example Deng et al. (Reference Deng, McQuoid, Potter, Steffens, Albert, Riddle, Beyer and Taylor2018), in which greater perceived stress in remitted older (age ⩾ 60) people predicted recurrence of depression.
Given the above richness of available psychological factors that might be predictive of antidepressant treatment response, yet the lack of such research for rTMS, makes the purpose of this study to test various psychological factors that can predict rTMS treatment non-response in MDD. Finding such predictors in psychological measures is the most cost-effective way to optimize treatment allocation. To explore all possible psychological factors, this study used the total Beck Depression Inventory (BDI)-II-NL score, as well as subscales thereof, the Neuroticism, Extraversion, Openness Five-Factor Inventory (NEO-FFI), and the Depression, Anxiety, and Stress Scale (DASS) to investigate potential predictors of rTMS treatment outcome. The BDI subscales were literature-based. Next to this, the clinical relevance of these predictors was explored. That is, next to sensitivity and specificity, the positive predictive value (PPV) and negative predictive value (NPV) were examined. This method has been applied elsewhere [e.g. Kuk et al. (Reference Kuk, Li and Rush2010); Li et al. (Reference Li, Kuk and Rush2012)] and attempts to identify constructs that can accurately and reliably inform the therapist on treatment response and therefore treatment (dis)continuation (Li et al., Reference Li, Kuk and Rush2012), while incorporating the false positives and false negatives. Additionally, the predictors were tested for their robustness by immediate replication in an independent sample. More specifically, given the recently highlighted interest for the replication of studies (Open Science Collaboration, 2012; Pashler and Wagenmakers, Reference Pashler and Wagenmakers2012; Patil et al., Reference Patil, Peng and Leek2016), and our own recent non-replication of previous work (Krepel et al., Reference Krepel, Sack, Kenemans, Fitzgerald, Drinkenburg and Arns2018), it was decided to a priori split the complete dataset into a Discovery and Replication set. Hereby, it was possible to confirm or deny any findings in the Discovery set by executing the same analyses in the Replication set.
Methods and materials
Design
This study was a multi-site, open-label study. Data were collected at three sites (Brainclinics Treatment/neuroCare Nijmegen and The Hague, Psychologenpraktijk Timmers, Oosterhout, The Netherlands) between May 2007 and November 2016. Inclusion criteria were: (1) a primary diagnosis of major depressive or dysthymic disorder as confirmed by M.I.N.I. (M.I.N.I. Plus Dutch version 5.0.0), (2) a BDI-II of 14 or higher, and (3) a left DLPFC HF (10 Hz) rTMS or a right DLPFC LF (1 Hz) rTMS treatment combined with psychotherapy. Exclusion criteria included: (1) prior treatment with ECT, (2) epilepsy, (3) wearing a cardiac pacemaker, (4) wearing metal parts in the head, and (5) pregnancy. All participants signed an informed consent form before treatment was initiated.
The specific treatment procedures and clinical outcomes have recently been published elsewhere (Donse et al., Reference Donse, Padberg, Sack, Rush and Arns2018). In short, baseline clinical variable measurements consisted of the BDI-II-NL, Depression, Anxiety and Stress Scale (DASS), and NEO-FFI. To track the course of the rTMS treatment, the BDI was assessed every fifth rTMS session.
Response prediction
Differences between responders (R) and non-responders (NR) were analyzed based on clinical baseline variables. The clinical variables were assessed using the following instruments:
• The BDI-II-NL was used to assess depression severity. Of the BDI, several subscales were taken. These included:
– the Anhedonia scale (items 4, 12, and 21) and the Non-Anhedonia scale (items 1–3, 5–11, and 13–20) (Leventhal et al., Reference Leventhal, Chasson, Tapia, Miller and Pettit2006)
– the Cognitive-Affective scale (items 1–13) and the Somatic and Performance scale (items 14–21) (Trentini et al., Reference Trentini, de Xavier, Chachamovich, Rocha, Hirakata and de Fleck2005)
– the Cognitive scale (items 2, 3, 5–9, and 14) and the Non-Cognitive scale (items 1, 4, 10–13, and 15–21) (Kumar et al., Reference Kumar, Steer, Teitelman and Villacis2002)
These subscales were computed by adding the indicated items into one variable (e.g. the anhedonia scale was computed by adding item 4, item 12, and item 21). Scores for these scales were also calculated at outtake, as well as in change over time (in absolute numbers and percentages).
• The NEO-FFI was used to examine ‘the Big Five’ personality traits. The NEO-FFI is a 60-item, self-report instrument that measures five personality traits, being Neuroticism, Extraversion, Openness, Agreeableness, and Conscientiousness. These domains have shown good internal consistency (Cronbach's α range 0.87–0.92) (Costa and McCrae, Reference Costa and McCrae1992).
• To measure anxiety and stress, the DASS (Henry and Crawford, Reference Henry and Crawford2005) was used.
Discovery and Replication set
To obtain a Discovery and Replication set, the complete, original dataset (n = 196) was randomly divided into a 60% Discovery sample and 40% Replication sample. Differences in gender, response, and remission were tested for using χ2 statistics. Differences in age and BDI at intake were tested for using one-way analysis of variance tests. Once none of these variables differed significantly between the two groups, the random division was frozen and the two groups were designated as Discovery set and Replication set. This resulted in a Discovery set (n = 119; 62 females) and Replication set (n = 77; 37 females). All exploratory analyses were performed in the Discovery set. Only when a significant result was obtained in the Discovery set, the same statistical test was used in the Replication set to confirm or deny the prior obtained finding.
Statistics
SPSS version 24 was used for statistical analyses. Response was defined as a ⩾50% decrease on the BDI score from intake to outtake (outtake BDI scores were taken around the last session of a patient, on average at session 21). All predictors were tested for statistical differences, robustness (independent replication), dimensional association, predictive value, and clinical relevance.
First, a generalized linear model (GLM) univariate analysis was performed to test for baseline psychological differences between R and NR, with response as a fixed factor, age as a covariate, and the BDI subscales (including total BDI, Anhedonia, Non-Anhedonia, Cognitive Affective, Somatic and Performance, Cognitive, and Non-Cognitive), NEO-FFI subscales (including Neuroticism, Extraversion, Openness, Agreeableness, and Conscientiousness), and DASS scales (Depression, Anxiety, and Stress) as dependent variables. Effect sizes reported are Cohen's d.
Next, the sensitivity, specificity, PPV, and NPV for predicting non-response of all the above described variables were examined, using a discriminant analysis. The reason for this extra dimension of statistical evaluation was that a psychological measure may not be significantly different between R and NR, as tested by a GLM univariate analysis, yet it may prove to be highly predictive of non-response in a smaller specific subset of NR. Typically, PPV and NPV are set relatively high, i.e. ⩾0.75 or 75% (Li et al., Reference Li, Kuk and Rush2012). Thus, if it were the case that NPV or PPV exceeded 75% and replicated, this psychological measure was still examined in the following analyses.
Replicated psychological measures (or those showing a PPV or NPV higher than 75%) were also tested for dimensional association by partially correlating these measures with BDI percentage change (BDI% change) from intake to outtake, while controlling for age.
Next, a discriminant analysis on non-response was performed, using the predictors as indicated by GLM univariates of PPV and NPV. More specifically, the replicated baseline psychological measures that showed to be significantly different between R and NR, or that had a replicated NPV or PPV of 75% or higher, were used as independent variables in the discriminant analysis. In addition to these items, age was also used in this analysis. From these variables, a receiver operator curve (ROC) was derived to establish the predictive value of the discriminant analysis on treatment response.
It was also attempted to establish a useful construct based on the replicated predictors by examining the severity levels of these predictors. That is, a cut-off score of these predictors was established using sensitivity, specificity, and Youden's J. This cut-off score provided a useful construct on which a therapist can act.
A further confirmatory approach that also compares a Discovery–Replication approach to a more traditional approach applied to the full sample (albeit using strict Bonferroni corrected p-values) is reported in the online Supplementary material. In previous treatment prediction studies in MDD we have reported many sex-specific predictors (van Dinteren et al., Reference van Dinteren, Arns, Kenemans, Jongsma, Kessels, Fitzgerald, Fallahpour, Debattista, Gordon and Williams2015; Arns et al., Reference Arns, Bruder, Hegerl, Spooner, Palmer, Etkin, Fallahpour, Gatt, Hirshberg and Gordon2016; Iseger et al., Reference Iseger, Korgaonkar, Kenemans, Grieve, Baeken, Fitzgerald and Arns2017), yet statistically testing such interactions requires relatively large sample sizes (Leon and Heo, Reference Leon and Heo2009). Therefore, in this full sample a post-hoc analysis on the complete dataset was conducted and statistically examined the data for potential sex × response interactions by including sex as a between-subject factor. In the online supplementary material, it is also investigated whether anhedonia could accurately predict long-term response.
Primary and secondary hypotheses
By dividing our complete sample into a Discovery and Replication set, the sample sizes naturally decreased in both samples. To prevent a type-II error from occurring due to reduced sample sizes, it was decided that the hypotheses were defined as primary or secondary hypotheses. A primary hypothesis was defined as a hypothesis that was predicted from the literature and the p-value was set p ⩽ 0.1 in the Discovery set. In the Replication set this finding had to reach p ⩽ 0.05 to be considered a replication. A secondary hypothesis was defined as a hypothesis that was not predicted from the literature, i.e. an exploratory analysis, yet showed statistical significance in the dataset. This p-value was set at p ⩽ 0.05. Given the confirmatory nature of the Replication set, it was decided that the correlation would be one-tailed (under the condition that the direction of the two-tailed test was the same as in the Discovery set).
As primary hypotheses, the following were defined as predictors for non-response: high total BDI, high anhedonia, high neuroticism, low extraversion, high anxiety, and high stress.
All other psychological measures were marked as secondary hypotheses.
Results
A total of 196 MDD patients were enrolled in this study (average age: 43.62, range 18–78 years; 99 females and 97 males). Dividing the complete dataset (n = 196) in a 60–40 distribution (60% Discovery, 40% Replication) resulted in a Discovery set of 119 MDD patients (average age: 43.60, range 18–73; 62 females and 57 males) and a Replication set of 77 MDD patients (average age: 43.64, range 19–78 years; 37 females and 40 males). The clinical outcome measures of the Discovery and Replication sample are summarized in Table 1. One subject was excluded based on missing data. Note that, given that most the MDD patients were from Nijmegen, the following analyses were also performed in the Nijmegen-only cohort. These analyses for data collected in Nijmegen only yielded similar statistical outcomes and did not result in different conclusions.
Clinical outcome measures of the Discovery and Replication sample

This table depicts the number of responders, total number of sessions, total BDI at intake, total BDI at outtake, the BDI change from intake to outtake (in percentage), as well as the ES (Cohen's d) of total BDI change from intake to outtake, trial center, and rTMS protocol. BDI at intake, BDI at outtake, BDI percentage change, and number of responders did not differ significantly between groups (p ⩾ 0.502).
Discovery set
Primary-analyses only yielded an effect of response for the Anhedonia scale (p = 0.072; F = 3.298; df = 1). For the secondary analyses only Openness differed between R and NR (p = 0.029; F = 4.889; df = 1). All other variables were not significantly different between R and NR (see Table 2). In Table 2, all the effect sizes (Cohen's d) for each baseline psychological measure, subdivided for R and NR, are reported as well.
This table depicts the mean, standard deviation, p-value, and ES for each baseline psychological measure, showing values for Discovery as well as Replication sample, subdivided into R and NR

A univariate analysis, controlled for age, showed that the Anhedonia scale is significantly different between R and NR in both the Discovery (p = 0.072; d = 0.36) as well as for the Replication set (p = 0.005; d = 0.76). Openness shows to be significantly different between R and NR in the Discovery sample (p = 0.029; d = −0.35), however, this results fails to be replicated in the Replication sample (p = 0.227; d = −0.33). These results are indicated in bold.
Replication set
A GLM univariate test was performed on the Replication set, with the exact same parameters as in the Discovery set. When focusing on only the predicted psychological measures that were significantly related to response in the Discovery set (i.e. the Anhedonia scale and the NEO-FFI Openness scale), a significant effect was found for the Anhedonia scale (p = 0.005; F = 8.516; df = 1). No significant effect was found for Openness (p = 0.227; F = 1.490; df = 1). The results are shown in Table 2. Since all other variables showed to be non-significant in the Discovery set, significant differences between R and NR that were confined to only the Replication set were ignored. However, for purposes of completeness, all other variables and their statistical values are shown as well.
Sensitivity, specificity, NPV, and PPV
As described, baseline psychological measures may not be significantly different between R and NR, yet be of high predictive value for a (specific) (sub)group. Therefore, each baseline psychological measure was individually assessed for these features, using one psychological measure and age in a discriminant analysis. The preset value of both PPV and NPV was 75%. As can be observed from Table 3, none of the baseline variables reached or exceeded and replicated the preset value of PPV and NPV.
This table depicts the sensitivity, specificity, PPV, and NPV per individual baseline psychological measure
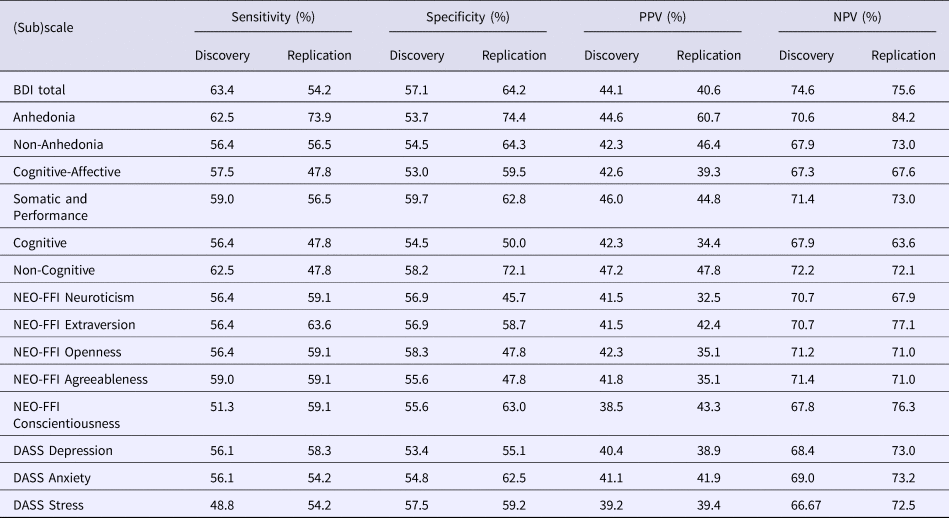
A discriminant analysis was performed using one psychological measure plus age as independent variables. Based on the absolute number of true positives, true negative, false positives, and false negatives (as predicted by the discriminant analysis), the above metrics were calculated. If PPV or NPV exceeded 75% and replicated, this psychological measure would still be examined in the following analyses, even though it showed not to be significantly different between R and NR in the previous univariate analyses. None of the baseline psychological measures showed a PPV or NPV of 75% or higher in both the Discovery and Replication sample.
Correlations between psychological scales and BDI percentage change
A two-tailed correlation while controlling for age showed a significant correlation between BDI% change and the Anhedonia scale at intake (p = 0.023; r = −0.221; r 2 = 4.9%). Additionally, BDI% change and Openness at baseline were shown to be significantly correlated (p = 0.025; r = 0.214; r 2 = 4.6%).
In the Replication set, there was a significant one-tailed partial correlation between BDI% change and the Anhedonia scale (p = 0.025; r = −0.244; r 2 = 6.0%), and between BDI% change and Openness (p = 0.047; r = 0.206; r 2 = 4.2%).
Discriminant analysis
Using the Discovery set, a discriminant analysis was performed using the Anhedonia scale and age. The resulting model was shown to be significant (p = 0.034; Wilks’ λ = 0.937; χ2 = 6.771; df = 2), with a sensitivity of 62.5% and a specificity of 53.7%. The PPV and NPV were 44.6% and 70.6%, respectively. The area under the curve of the ROC, regressed on non-response, was 0.643 (Fig. 1). This analysis was repeated in the Replication set. This model also reached significance (p = 0.018; Wilks’ λ = 0.880; χ2 = 8.024; df = 2), with a sensitivity of 73.9%, and a specificity of 74.4%. The PPV and NPV were 60.7% and 80.0%, respectively. The area under the ROC curve was 0.726 (Fig. 2).
ROC of the discriminant analysis on non-response using the Anhedonia scale and age as independent variables in the Discovery sample, with an area under the curve of 0.643. The ROC shows the sensitivity (62.5%) and specificity (53.7%) for non-responders (dotted line) and responders (striped line). NPV and PPV were 44.6% and 70.6%, respectively.

ROC of the discriminant analysis on non-response using the Anhedonia scale and age as independent variables in the Replication sample, with an area under the curve of 0.726. The ROC shows the sensitivity (73.9%) and specificity (74.4%) for non-responders (dotted line) and responders (striped line). The PPV and NPV were 60.7% and 80.0%, respectively.

Clinical relevance (sensitivity, specificity, NPV, PPV, Youden's J of the Anhedonia scale)
For the current calculations, the Discovery and Replication set were merged, since in this section the clinical relevance of this metric was investigated, rather than its methodological value. To specify the clinical relevance of the Anhedonia scale, a cut-off score was established by calculating Youden's index.
A complete overview of statistics can be found in the online supplementary material. In short, using an ROC the cut-off, from which predicting NR based on the Anhedonia scale was most accurate, was estimated. Youden's J was highest at severity level 6 (J = 0.235). Also, the PPV and NPV do not reach the preset value of 75%, and therefore the model is, based on this method, considered to not be clinically relevant.
Discussion
This study focused on finding psychological measures and their potential ability to predict rTMS treatment response in an MDD sample. Additionally, attempting to overcome the issue of (non-)replication, this study tried to immediately replicate obtained findings by a priori dividing the complete dataset into a Discovery and Replication set.
Our study suggests that none of the psychological measures are clinically meaningful predictors of rTMS treatment response in an MDD sample. This is in line with studies that found evidence for predictive utilities of psychological measures, but did not found it to be highly influential on response rates (Fitzgerald et al., Reference Fitzgerald, Hoy, Anderson and Daskalakis2016). However, this study suggests that NR robustly show higher anhedonia scores at baseline, and that this score was – to some degree – related to clinical improvement. More specifically, a higher score on the Anhedonia scale (as taken from the BDI) marginally predicted non-response to rTMS. However, the ROC curves were only mildly predictive of non-response, and NPV was 70.6–80.0% and PPV was 44.6–60.7%, thereby the NPV just being short of the a priori preset threshold of 75%. Therefore, even though NR seem to have a higher anhedonia score at baseline, its predictive value remains relatively low. This is partly in line with Rostami and colleagues., who found that the symptom ‘loss of interest’ was strongly predictive in rTMS response (Rostami et al., Reference Rostami, Kazemi, Nitsche, Gholipour and Salehinejad2017). Even though in our sample it is also found that baseline anhedonia is different between R and NR, the subset of symptoms could not predict treatment response such that is was clinically relevant.
When attempting to find the optimal cut-off score on which a therapist can act, it was found that those with a baseline anhedonia score of 6 or higher are less likely to respond to rTMS treatment. However, given the overall clinical non-relevance of the model based on anhedonia, this cut-off should be taken with caution.
Replication
In this study we employed two approaches that are often advocated as tools to overcome the ‘Replication crisis’. Some people have advocated to rely more strongly on replication studies (Open Science Collaboration, 2012; Pashler and Wagenmakers, Reference Pashler and Wagenmakers2012; Roediger, Reference Roediger2012; Simons, Reference Simons2014) [although caution should be taken when designing and interpreting a replication study, see Maxwell et al. (Reference Maxwell, Lau and Howard2015)], as well as self-replication (i.e. replicate your own work before publishing) (Roediger, Reference Roediger2012; Simons, Reference Simons2014), which is what we performed in this main manuscript. Others advocate to use stricter p-values, for example using a p-value of 0.005 (Benjamin et al., Reference Benjamin, Berger, Johannesson, Nosek, Wagenmakers, Berk, Bollen, Brembs, Brown, Camerer, Cesarini, Chambers, Clyde, Cook, De Boeck, Dienes, Dreber, Easwaran, Efferson, Fehr, Fidler, Field, Forster, George, Gonzalez, Goodman, Green, Green, Greenwald, Hadfield, Hedges, Held, Hua Ho, Hoijtink, Hruschka, Imai, Imbens, Ioannidis, Jeon, Jones, Kirchler, Laibson, List, Little, Lupia, Machery, Maxwell, McCarthy, Moore, Morgan, Munafó, Nakagawa, Nyhan, Parker, Pericchi, Perugini, Rouder, Rousseau, Savalei, Schönbrodt, Sellke, Sinclair, Tingley, Van Zandt, Vazire, Watts, Winship, Wolpert, Xie, Young, Zinman and Johson2018). In the online supplementary material this latter approach was implemented, using the full sample and a strict Bonferroni corrected p-value of 0.0033. Interestingly, both approaches converged on identifying anhedonia as a predictor for response. A difference was that in the latter approach, as elaborated on in the online supplementary material, another psychological scale of the BDI (the Non-Cognitive scale) was identified as being statistically different between R and NR. However, it seems that this difference is mainly driven by BDI item overlap with the Anhedonia scale (since the Anhedonia scale is also part of the Non-Cognitive scale) and thus a spurious correlation. Further elaboration on these analyses can be found in the online supplementary material.
Interestingly, Table 2 can also be inspected as an example of how many false positives one could obtain using a p < 0.05 approach without requiring replication (i.e. if these would be published as two separate papers). When looking at any p < 0.05 values in either the Discovery or Replication dataset 6 out of 17 measures (35%) are significantly different, whereas only one of those metrics (6%) actually replicates. When using stricter thresholding and a larger sample size (p < 0.0033; online supplementary material) only one false positive was found (the Non-Cognitive scale) and the same result for anhedonia was confirmed.
Therefore, these results further highlight that false positive findings can be easily obtained. Both approaches (replication v. stricter p-thresholding) increased the robustness of results. Based on these results we cannot draw a definite conclusion, but for future manuscripts where we will be looking at other predictors [e.g. electroencephalography (EEG)], we will use this exact same approach and hope to obtain robust and clinically relevant predictors of treatment response.
Limitations
This study did not employ a double blind placebo controlled design, hence we are unable to rule out that the obtained results can be (partly) explained by such effects. Similarly, this study was open-labeled, which poses another weakness, albeit results in ecologically valid results. Furthermore, as is described by Donse et al. (Reference Donse, Padberg, Sack, Rush and Arns2018), this sample consisted of MDD patients who received simultaneous rTMS and psychotherapy, rather than rTMS only. Lastly, while the complete sample consists of 196 MDD patients, reducing it to a Discovery and Replication set and dividing it into a R/NR classification, narrows down the sample size, resulting in a smallest sample size (Replication set, NR) of 24.
Conclusion
Our study indicates that the psychological measure anhedonia, as measured by the Anhedonia scale of the BDI at baseline, is related to clinical improvement on MDD symptoms in response to rTMS treatment in an MDD sample. More specifically, lower baseline anhedonia scores were related to better clinical improvement. However, our study also suggests that anhedonia is only mildly predictive of treatment response and does not achieve predefined levels of clinical relevance. Therefore, it can be concluded that lower anhedonia scores are favorable in the treatment of MDD, however, these are unlikely to be of clinical usage and relevance due to the low PPV and NPV.
Furthermore, the current study also highlights that false positives are relatively easy obtained, when handling a 0.05 significance level, advocating for the Replication approach and the usage of stricter p-values, as was done in this main manuscript and online supplementary material.
Supplementary material
The supplementary material for this article can be found at https://doi.org/10.1017/S0033291718004191.
Acknowledgements
We would like to thank Lana Donse, Vera Kruiver, Rosalinde van Ruth, Marleen Stam, Maaike Moolenaar, Sanne Bongers, Myrthe van Eerdt, Dagmar Timmers, Inge Janssen-Bouwmeester and Nicole van Merode for support and collecting the data used in this study.
Author contributions
NK managed the literature search, performed the analyses, and wrote the first draft of the manuscript. All other authors contributed, reviewed, and approved the final manuscript.
Conflict of interest
MA reports options from Brain Resource (Sydney, Australia); he is director and owner of Research Institute Brainclinics, a minority shareholder in neuroCare Group (Munich, Germany), and a co-inventor on four patent applications (A61B5/0402; US2007/0299323, A1; WO2010/139361 A1) related to EEG, neuromodulation and psychophysiology, but does not own these nor receives any proceeds related to these patents; Research Institute Brainclinics received funding from Brain Resource (Sydney, Australia) and neuroCare Group (Munich, Germany), and equipment support from Deymed, neuroConn and Magventure, however data analyses and writing of this manuscript were unconstrained. AJR reports consulting fees from the American Psychiatric Association, Brain Resource Ltd., Compass Inc., Curbstone Consultant LLC, Eli Lilly, Emmes Corp., Liva-Nova, Lundbeck A/S, National Institute of Drug Abuse, Taj Medical, Santium Inc., Sunovion, Taj Medical, Takeda USA; speaking fees from Live Nova; royalties from Guilford Publications and the University of Texas Southwestern Medical Center. The other authors report no disclosures or conflicts of interest.


 Open access