

Impact Statements
Restoration professionals often rely on tools for sourcing plant materials (e.g., native seed) to bolster restoration outcomes. Common tools include seed transfer zones, which delimit areas of climate similarity, and web-based applications, which calculate climate distances between seed sources and restoration sites. These tools assume restoration success increases as climate distance decreases. This assumption, rarely tested during or after restoration treatments, is based on abundant research supporting the evolutionary process of local adaptation. Our analyses of mortality patterns across three plant species, each represented by 10–18 wildland seed sources collected at varying climate distances from an experimental garden, indicate that predictors of mortality vary among species. Specifically, our results indicate that: (1) many facets of environmental variation influence species, including climate, soils and unknown aspects correlated with geographic distance; (2) species respond to suites of environmental variation uniquely, impeding generalizations; (3) while a model can be constructed to explain mortality across species, mortality was positively correlated with climate distance for only one species; (4) for each species, the climatically closest population to the experimental garden did not have the lowest mortality – however, averaging mortality rates across seed sources with similar climates always resulted in lower overall mortality. Further, we assessed patterns of mortality in the context of abnormally hot and dry weather at our experimental garden compared with average climates and demonstrated that seed sources from hotter and drier climates relative to the garden had lower mortality in only one species. Our results highlight a potential strategy for restoration in drylands: if multiple intraspecific, genetically appropriate, and climatically approximate seed sources are available, a regional admixture provenancing strategy may increase the probability that plants can establish and persist.
Introduction
Decisions about the geographic origin of native plant seed directly influence restoration outcomes, affecting plant survival, ecosystem function and long-term resilience in degraded landscapes. To promote successful management outcomes, practitioners must balance a myriad of considerations during seed selection, including population-level suitability (Davidson and Germino, Reference Davidson and Germino2020), climate suitability, site conditions (McKay et al., Reference McKay, Christian, Harrison and Rice2005; Havens et al., Reference Havens, Vitt, Still, Kramer, Fant and Schatz2015) and logistical constraints, including cost, seed availability and project mandates (Cortina-Segarra et al., Reference Cortina-Segarra, García-Sánchez, Grace, Andrés, Baker, Bullock, Decleer, Dicks, Fisher, Frouz, Klimkowska, Kyriazopoulos, Moreno-Mateos, Rodríguez-González, Sarkki and Ventocilla2021; McCormick et al., Reference McCormick, Carr, Massatti, Winkler, De Angelis and Olwell2021; Shriver et al., Reference Shriver, Jordan, Massatti and Munson2025). Given that adaptation to the home environment is a well-illustrated phenomenon in plants (Baughman et al., Reference Baughman, Agneray, Forister, Kilkenny, Espeland, Fiegener, Horning, Johnson, Kaye, Ott, St. Clair and Leger2019), practitioners often leverage tools that incorporate known or assumed adaptive patterns, such as seed transfer zones (STZs), to guide the selection and movement of native seed.
STZs are models that link plant evolutionary processes to environmental conditions. As a result, they inform seed selection and support genetically and ecologically appropriate restoration (Plant Conservation Alliance [PCA], 2015). They are informed by the assumption that plants are adapted to their local climates, such that grouping geographic areas with similar climates (i.e., areas where climate distance is minimized) can help mitigate the risk of maladaptation (McKay et al., Reference McKay, Christian, Harrison and Rice2005). Provisional STZs utilize climate variables such as winter minimum temperature and aridity, which are generally assumed to influence adaptation across species (Bower et al., Reference Bower, Clair and Erickson2014), while empirical STZs incorporate climate gradients correlated with a species’ morphological traits or allele frequencies (St. Clair et al., Reference St. Clair, Kilkenny, Johnson, Shaw and Weaver2013; Shryock et al., Reference Shryock, Nila, DeFalco and Esque2024). STZs are largely based on climate normals, or 30-year averages of weather variables, that represent a baseline for yearly weather variability and long-term climate change; in North America, these are typically represented by either WorldClim v2.1 (Fick and Hijmans, Reference Fick and Hijmans2017) or ClimateNA (Wang et al., Reference Wang, Hamann, Spittlehouse and Carroll2016). However, shifting regional climate patterns may make the utility of climate-based STZs obsolete (Koehn et al., Reference Koehn, Petrie, Bradford, Litvak and Strachan2021; McKinnon et al., Reference McKinnon, Poppick and Simpson2021).
At the same time that current climate trajectories are mismatched with climate normals (Seager et al., Reference Seager, Ting, Held, Kushnir, Lu, Vecchi, Huang, Harnik, Leetmaa, Lau, Li, Velez and Naik2007), many landscapes are experiencing weather events that are exposing plants to conditions outside their optimal climate envelopes (Smith, Reference Smith2011; Stott, Reference Stott2016). In the context of restoration efforts, extreme or unusually timed weather events are decreasing restoration success (Hagger et al., Reference Hagger, Dwyer, Shoo and Wilson2018). For example, novel timing of weather events, such as late freezes or early soil warming, inhibits the establishment of native seed sources not adapted to these environmental pressures (Farnsworth et al., Reference Farnsworth, Nunez-Farfan, Careaga and Bazzaz1995; Ishioka et al., Reference Ishioka, Muller, Hiura and Kudo2013; Wheeler et al., Reference Wheeler, Hoch, Cortés, Sedlacek, Wipf and Rixen2014). When weather filters establishment at early life stages (James et al., Reference James, Svejcar and Rinella2011; Copeland et al., Reference Copeland, Baughman, Boyd, Davies, Kerby, Kildisheva and Svejcar2021), opportunities may exist to use species or populations adapted to alternative environmental conditions (e.g., hotter and drier conditions; Klein and Mitchell, Reference Klein and Mitchell2024).
Despite the primary emphasis on climate and the increasing importance of extreme weather in seed sourcing guidance (Hardegree et al., Reference Hardegree, Abatzoglou, Brunson, Germino, Hegewisch, Moffet, Pilliod, Roundy, Boehm and Meredith2018), other biotic and abiotic factors exert selective pressures and influence the adaptation of a species to its local environment. Biotic influences include exposure and response to herbivory (Karban and Myers, Reference Karban and Myers1989; Diaz et al., Reference Diaz, Lavorel, McIntire, Falczuk, Casanoves, Milchunas, Skarpe, Rusch, Sternberg, Noy-Meir, Landsberg, Zhang, Clark and Campbell2007), soil microbial communities (Lau and Lennon, Reference Lau and Lennon2012) and pollinators (Brooker, Reference Brooker2006; Aslan et al., Reference Aslan, Grady and Haubensak2025). Non-native species also impose selective pressures on native plant communities by shifting competitive dynamics and community composition (Brown et al. Reference Brown, Anderson, Claassen, Stannard, Wilson, Atkinson, Bromberg, Grant and Munis2008). Plants may also exhibit context-dependent responses to abiotic attributes, such as solar radiation and nutrients (Tilman, Reference Tilman1984; Lavorel and Garnier, Reference Lavorel and Garnier2002; Piedallu and Gégout, Reference Piedallu and Gégout2008; Gates, Reference Gates2012). Moreover, soil has been shown to drive local adaptation in plants (Raabová et al., Reference Raabová, Münzbergová and Fischer2011; Sherrard et al., Reference Sherrard, Joers, Carr and Cambardella2015; Gibson et al., Reference Gibson, Nelson, Rinehart, Archer and Eramian2019). Soil characteristics, including compaction, nutrients, texture and pH, impact plant distribution and performance metrics, such as survivorship and reproduction (Mod et al., Reference Mod, Scherrer, Luoto and Guisan2016; Soong et al., Reference Soong, Janssens, Grau, Margalef, Stahl, Van Langenhove, Urbina, Chave, Dourdain, Ferry, Freycon, Herault, Sardans, Peñuelas and Verbruggen2020; Shaheb et al., Reference Shaheb, Venkatesh and Shearer2021). Extreme soil environments can exert strong selective pressure, resulting in genetic differentiation within species (Andrade et al., Reference Andrade, Aquino, Echevarria, Oliveira, Pereira, Malaquias, Souza, Montargès-Pelletier, Faleiro, Reis Junior, Miranda, Sano and do Amaral2022), endemism (Rajakaruna, Reference Rajakaruna2004) and speciation. Despite the importance of soil for the performance, distribution and diversity of plants, edaphic characteristics are underutilized in species distribution modeling, niche modeling and the development of STZs (Mod et al., Reference Mod, Scherrer, Luoto and Guisan2016; Velazco et al., Reference Velazco, Galvão, Villalobos and De Marco2017; Gibson et al., Reference Gibson, Nelson, Rinehart, Archer and Eramian2019). Layered on top of this milieu is the disturbance event that precipitates the need for revegetation, which may have altered the site so that it falls outside a target species’ preferred suite of abiotic environmental attributes despite an otherwise suitable climate (Shinoda and Akasaka, Reference Shinoda and Akasaka2019).
In the context of long-term climate averages, contemporary weather and the additional selective pressures imposed by environmental variation such as soil characteristics, we leveraged mortality data from a 5-year, multispecies experimental garden to model relationships between plant performance (i.e., mortality in the experimental garden after 4 years) and climate distance (i.e., the similarity between the climate of seed source locations and the planting location). We predicted that minimizing climate distance can help reduce mortality, which represents the prevailing assumption of restoration using STZs. However, given the abundance of research supporting plant species’ complex biotic and abiotic interactions within their environments, we predicted that more complex models, including additional environmental factors, would explain mortality patterns more effectively. First, we constructed a null model to investigate whether climate distance or geographic distance more accurately predicted mortality. Second, we increased model complexity to test the prediction that many environmental factors influence plant performance (i.e., factors that are not typically included in STZs) and quantified model improvement. Specifically, we included soil texture and pH, as both factors play an important role in determining plant community composition (Renne et al., Reference Renne, Bradford, Burke and Lauenroth2019; Barlow et al., Reference Barlow, Mortensen and Drohan2020). Third, we investigated whether species’ mortality responses were influenced by parameters in similar ways or if responses were species-specific. Finally, we assessed whether populations from hotter and drier locations compared to the experimental garden survived better during abnormally hot, dry weather conditions. Overall, by shedding light on species-specific responses to geographic, climatic and environmental variation, our goal was to illuminate genetically and ecologically appropriate restoration strategies that foster successful outcomes given unpredictable weather and climate patterns.
Methods
We used data from three widely distributed perennial species important for restoration in the southwestern United States, including two C4 grasses, Bouteloua curtipendula (Michx.) Torr. (sideoats grama; Poaceae) and Sporobolus cryptandrus (Torr.) A. Gray (sand dropseed; Poaceae) and the C3 forb Heterotheca villosa (Pursh) Shinners (hairy false goldenaster; Asteraceae). These species are commonly included in post-disturbance and rehabilitation seedings on public lands because they establish reliably across broad environmental gradients and provide key ecosystem functions, including forage for wildlife and livestock (B. curtipendula, S. cryptandrus) and nectar resources for native pollinators (H. villosa). Seeds from 10 populations of B. curtipendula, 18 populations of H. villosa and 14 populations of S. cryptandrus were collected from New Mexico, Arizona, southern Utah and southern Colorado (Figure 1 and Supplementary Table S1) in accordance with the Bureau of Land Management’s Seeds of Success protocol (Haidet and Olwell, Reference Haidet and Olwell2015).
Collection locations of B. curtipendula (circles), H. villosa (squares) and S. cryptandrus (triangles) within the Four Corners region of the western United States. Background colors reflect Omernik Level III Ecoregions (Omernik and Griffith, Reference Omernik and Griffith2014). Larger symbols reflect higher mortality in 2023. The large pink circle indicates the common garden location in Santa Fe, New Mexico. The garden location is also indicated as a pink star in the map inset showing the polygon location relative to the contiguous United States.

Plant propagation and garden establishment
Methods for plant propagation and garden establishment at the New Mexico Land Conservancy’s Petchesky Conservation Center, located in Santa Fe, New Mexico (35.6126, −106.0045), are detailed in Samuel et al. (Reference Samuel, Mitchell, Winkler, Davidson, Lencioni and Massatti2024). Briefly, in March 2019, seeds were sown in a greenhouse to obtain 50 plants per population. Plants were grown for approximately 110 days before outplanting in the experimental garden (90–170 days for S. cryptandrus due to poor germination in some populations). Outplanting occurred after the onset of monsoon precipitation in July 2019. Plants received supplemental watering in the summer and fall of 2019 to counteract transplant shock, and again in summer 2020 due to historically low precipitation and high temperatures (Supplementary Figure S1). Plants were monitored in October 2019 and annually thereafter in spring or summer, and plants that displayed any green tissue were designated as living. Small interannual decreases in mortality (i.e., plants recorded as dead in previous surveys but later observed alive) were attributed to dormancy. Plants without green tissue were left in situ and not destructively harvested.
Fifty individuals from each population of H. villosa and B. curtipendula were outplanted. The number of replicates of S. cryptandrus varied and ranged from 15 to 68 individuals, as germination was variable and generally low among populations. Source locations represented twelve Bower et al. (Reference Bower, Clair and Erickson2014) seed zones (Supplementary Table S1) and five Omernik Level III Ecoregions (Omernik and Griffith, Reference Omernik and Griffith2014). Twenty-two source locations share the same seed zone as the garden (Bower et al., Reference Bower, Clair and Erickson2014). Across species, geographic distance between source locations and the garden ranges from 1.56 km to 630 km (Supplementary Table S1). The proportion of dead plants after four years ranged from 0.42–0.94 with a mean of 0.62 for B. curtipendula, 0.50–1.00 with a mean of 0.84 for H. villosa and 0.58–0.98 with a mean of 0.81 for S. cryptandrus. Garden mean annual temperature and mean annual precipitation are 10.9 °C and 358 mm, respectively. Mean annual temperature and mean annual precipitation of source locations range from 9.8–16.2 °C and 302–392 mm for B. curtipendula; 3.3–12.7 °C and 273–769 mm for H. villosa and 9.1–17 °C and 193–508 mm for S. cryptandrus (Supplementary Table S1).
Calculating geographic distance and climate distance
Because our goal was not to investigate specific climate drivers influencing species survival, but rather to quantify relationships between climate distance and survival, we chose to collapse climate variation across the study area into orthogonal axes using principal component analysis. We used WorldClim v2 bioclimatic data (Supplementary Table S2; Fick and Hijmans, Reference Fick and Hijmans2017) to represent climate space and performed PCA using the raster package (Hijmans, Reference Hijmans2023) in R v4.4.1 (Foundation for Statistical Computing, 2023). Specifically, we calculated the Euclidean climate distance between the experimental garden and each seed source location using the first three PC axes, which accounted for 87% of climate variation (Supplementary Table S2). To calculate geographic distance in kilometers, we used the distm function from the geosphere package (Hijmans, Reference Hijmans2022).
Model selection and statistical analyses
Ultimately, mortality was high across populations for each species (Supplementary Table S1). Thus, we decided to focus on mortality, rather than survival data. We modeled mortality patterns within and across populations for each species. We used mortality data collected in 2023 (i.e., four years after garden establishment) for model-building purposes. We did not include a plot-level random effect since plants were randomized across plots, and individual-level data were summarized as the proportion of population mortality. Because our data are proportions, we modeled mortality using a beta distribution (Geissinger et al., Reference Geissinger, Khoo, Richmond, Faulkner and Schneider2022). Furthermore, because 99.99% mortality is functionally the same as 100% mortality in a biological sense, we adjusted the four populations that displayed 100% mortality downward by 0.00001% to facilitate model fit (Supplementary Table S1). We note that zero–one-inflated beta regression provides an alternative framework for proportional data with boundary values; however, given the small number of populations exhibiting complete mortality and the biological equivalence of near-complete and complete mortality for our questions, we retained a standard beta regression approach. We modeled data using the betareg package and function (Cribari-Neto and Zeileis, Reference Cribari-Neto and Zeileis2010) and evaluated model assumptions graphically. During model selection, we retained factors that reduced the Akaike Information Criterion (hereafter, AIC) value by at least 4, which represents strong evidence of model difference (Burnham and Anderson, Reference Burnham and Anderson2004). While a reduction of 2 in AIC is usually regarded as enough to opt for greater complexity and additional parameters (Richards, Reference Richards2005), we used a difference of 4 to be more conservative in selecting parameters whenever AIC was used to compare models, and followed the principle that, in the case of a difference of <4, the model with fewer parameters was the preferred one.
Question 1. Do geographic distance, climate distance, or both predict mortality?
We evaluated climate and geographic distance for correlation. We began with two simple models, Proportion Dead ~ Climate Distance and Proportion Dead ~ Geographic Distance, and compared them using AIC. Next, the Proportion Dead model, including both distance metrics, was evaluated with AIC against the single-predictor models.
Question 2. Do environmental factors represented by soil metrics improve model predictions?
We obtained soil data from 100-m CONUS SoilGrids (Ramcharan et al., Reference Ramcharan, Hengl, Nauman, Brungard, Waltman, Wills and Thompson2018). In general, soils with higher sand content are expected to result in less water availability and lower nutrient retention, while soil pH influences nutrient availability and solubility in a variety of nonlinear ways (Brady and Weil, Reference Brady and Weil2016; Penn and Camberato, Reference Penn and Camberato2019). We extracted soil pH and percent sand at 0, 5, 15 and 30 cm depth for the seed source and garden locations, then averaged these values to create a profile for the most biologically active layer of soil that hosts most herbaceous plant roots and microbial biomass (Brady and Weil, Reference Brady and Weil2016). All predictive variables (distance metrics and soil variables) were checked for correlations before including them in the model-building process. Soil variables were added first individually, then together, to the model with the lowest AIC generated in Question 1.
Question 3. Is mortality equally sensitive across species to all factors?
After determining the best model in Question 2, we added species identity as an interaction term with each predictor variable in a stepwise manner and evaluated predictive power against the simpler version of the model using AIC. All models from Questions 1–3 were ranked by their AIC weights, which give the probability that a model is correct, assuming the correct model is included in the full set (Burnham and Anderson, Reference Burnham and Anderson2004).
Question 4. Do populations from hotter and drier source locations establish and persist better at our garden in abnormally hot, dry conditions?
The 2019 and 2020 growing seasons (defined as June–September) were abnormal with respect to temperature and precipitation relative to 30-year averages (Supplementary Figure S1), which provided an opportunity to explore survivorship in an extreme weather context adjacent to our formal modeling goals (see above). For each source location, we extracted mean annual temperature (WorldClim Bio1) and mean annual precipitation (WorldClim Bio12) as indices of climatic origin. We graphed interannual mortality of each population, ranked by their source location mean annual temperature and mean annual precipitation values, to evaluate whether populations sourced from hotter, drier locations exhibited lower mortality by the final monitoring year. Furthermore, for each species, we tested the significance of correlations between the response variable (proportion of individuals dead in each population in 2023) and each predictor variable (either mean annual temperature or mean annual precipitation) using a beta regression model. These models were constructed separately from the modeling efforts described in Questions 1–3.
Results
We evaluated four questions regarding how geographic distance, climate distance and additional environmental factors influence plant mortality and present four findings. Regarding Question 1, climate distance explained mortality better than geographic distance, with limited improvement when both predictors were included. For Question 2, incorporating soil texture and pH substantially improved model performance, indicating that environmental factors beyond climate contribute to mortality. For Question 3, species-specific responses to climate and edaphic variables were evident, although mortality increased consistently with geographic distance for all species. Finally, populations from hotter and drier environments exhibited improved survival under abnormally hot and dry conditions in only one species. We detail results for each question in turn (Findings 1–4).
Finding 1. In a simple model, climate distance was the primary predictor of mortality across species, whereas geographic distance contributed little additional explanatory power
Climate distance and geographic distance were moderately correlated (adjusted R2 = 0.46). Assumptions of normality for geographic and climatic distance were violated due to two outlying collection locations of H. villosa that were geographically close yet climatically distant, likely due to their high elevations relative to the garden. However, we opted not to transform the data. In models where climate distance and geographic distance were each considered as the sole predictors of mortality, climate distance was a better predictor of mortality than geographic distance (pseudo-R2 of 0.33 and 0.04, respectively, ΔAIC = 21.33; Supplementary Table S3). The model Proportion Dead ~ Geographic Distance + Climate Distance resulted in a ΔAIC of 1.94 compared to Proportion Dead ~ Climate Distance, indicating that climate distance is the primary driver of predictive strength.
Finding 2. Soil characteristics were important for explaining mortality patterns in all species
Although soil pH and percent sand were moderately correlated (adjusted R2 = 0.53), each variable independently improved model performance. When added individually to the model Proportion Dead ~ Geographic Distance + Climate Distance, either pH or percent sand reduced the AIC by 3.74 (Supplementary Table S3). Including both soil variables further improved model fit, decreasing the AIC by an additional 2.64 relative to models containing only one soil predictor. These results indicate that soil texture and pH each contribute independent explanatory power beyond geographic distance and climatic distance.
Finding 3. Species responded uniquely to climate and edaphic variables, but mortality was always positively correlated with geographic distance
Using the model with the lowest AIC from Question 2 (Proportion Dead ~ Geographic Distance + Climate Distance + pH + Percent Sand), we found that including species-specific responses to climate distance, pH and percent sand – but not geographic distance – resulted in a model with the lowest AIC (Table 1 and Supplementary Table S3).
Akaike Information Criterion (AIC, a metric for the relative performance of a model on a given dataset) values of the five top-performing models predicting mortality of the three study species

Note: The first model satisfies the requirement that it uses fewer parameters than the second-best-performing model and has a ΔAIC >4 relative to the next-best model that uses fewer parameters. The degrees of freedom (df) are associated with the log-likelihood of the given model. AIC weights are interpreted as the probability that a given model is the best model, assuming the correct model is in the model set. For a full accounting of the models tested, please see Supplementary Table S3.
Species-specific responses to climate distance, pH and percent sand varied in both strength and direction (Figure 2; Supplementary Table S4). For example, B. curtipendula exhibited a significant negative relationship between percent sand and mortality, whereas S. cryptandrus and H. villosa showed significant positive relationships. Only H. villosa had a significant relationship between pH and mortality. Responses to climate distance also differed: S. cryptandrus showed no significant association, while B. curtipendula and H. villosa exhibited significant relationships in opposite directions.
Estimated mortality effects based on the best predictive model (Proportion Dead ~ pH * Species + Percent Sand * Species + Geographic Distance + Climate Distance * Species). Species showed species-specific responses to climate distance between collection sites and the garden (first column), percent sand (second column) and pH (third column). Black stars indicate a significant effect, orange lines signify a negative relationship between the predictor and mortality and blue lines indicate a positive relationship between the predictor and mortality. Confidence intervals are represented by blue shading around the trend lines. Tick marks on the x-axis indicate data points.

All species had a positive relationship between mortality and geographic distance between the garden and source locations (Figure 3 and Supplementary Table S4). Geographic distance alone was a weak predictor of mortality, but its inclusion alongside climate distance and soil variables consistently improved model fit, indicating that it captures additional, unmeasured environmental or biotic variation relevant to survival. Estimated phi values indicated substantial dispersion in mortality among populations, consistent with heterogeneous biological responses to environmental gradients and suggesting caution when extrapolating predictions beyond the sampled populations (Supplementary Table S4).
Estimated mortality effects based on the best predictive model (Proportion Dead ~ pH * Species + Percent Sand * Species + Geographic Distance + Climate Distance * Species) as predicted by geographic distance (km) between the garden and collection locations. All species responded uniformly to geographic distance based on the AIC comparison to models with a Geographic Distance * Species term. The farther away the plants were sourced, the higher the percent mortality. Confidence intervals are represented by blue shading around the trend line. Black stars indicate a significant effect, and tick marks on the x-axis represent data points.

Finding 4. Populations sourced from hotter and drier climates survived better in only one species during the experiment
Across species, mortality responses to climatic origin differed among species (Figure 4; Table 2). In H. villosa, populations sourced from locations with higher mean annual temperature and lower mean annual precipitation experienced significantly lower mortality over 4 years than populations from cooler, wetter origins. In contrast, we found no evidence that populations from hotter, drier source environments had improved survival in B. curtipendula or S. cryptandrus (Figure 4; Table 2).
Proportion of plants recorded dead for each population across 4 years of monitoring. Species-specific results are arranged in columns. Rows represent the mean annual temperature (MAT) and mean annual precipitation (MAP). Line colors indicate populations ranked relative to one another, with darker colors representing higher mean annual temperature and precipitation at seed source locations. Decreases in mortality are attributed to dormancy, as plants were not removed from the soil to confirm mortality. Stars indicate a significant relationship between the proportion dead in 2023 and either MAT or MAP; detailed results of the beta regression models are provided in Table 2.

Species-specific parameter estimates of the beta regression models for proportion dead per population in 2023 (response variable) and the predictor variables, mean annual temperature (MAT) or mean annual precipitation (MAP)
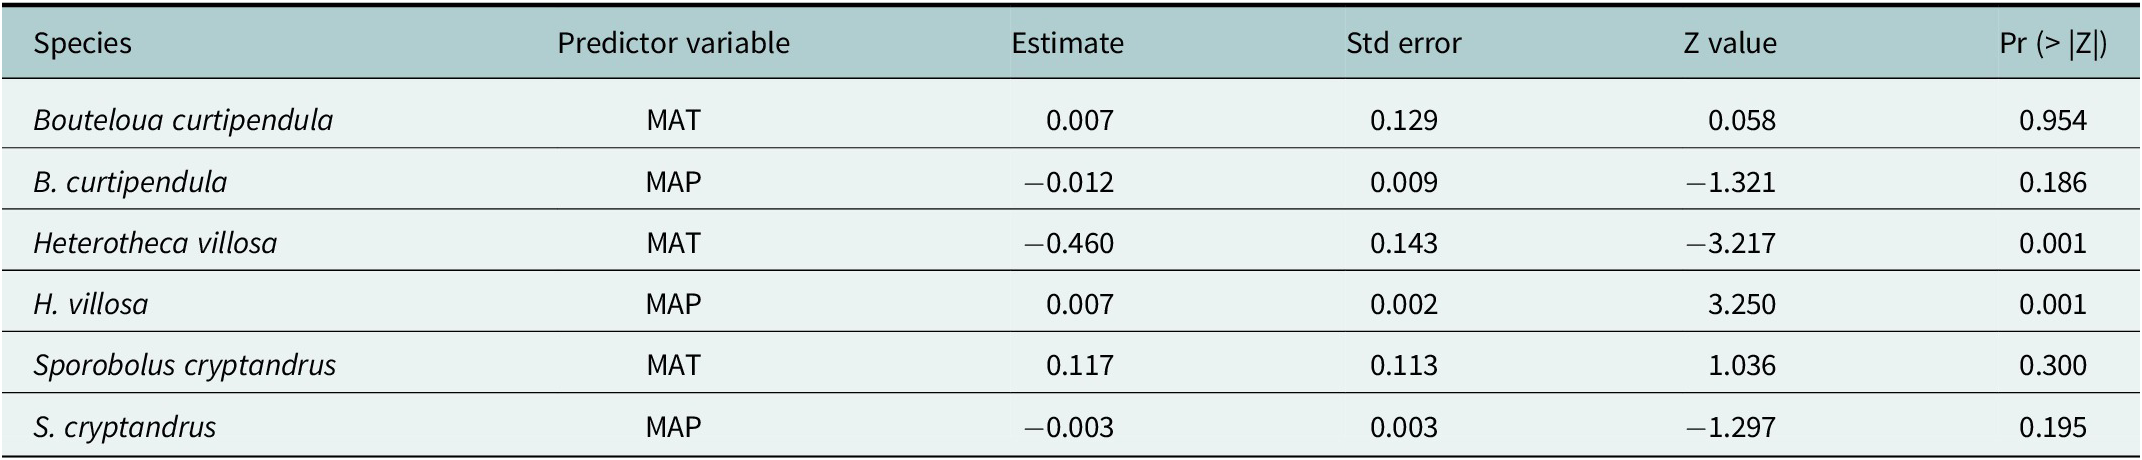
Note: Estimates indicate the change in the response variable associated with a one-unit change in the predictor.
Discussion
Successful restoration depends on plant materials, usually in the form of native seed, that can establish and survive following disturbances or management actions. Given the ubiquitous process of climate-based local adaptation in plants (Leimu and Fischer, Reference Leimu and Fischer2008), we often assume that tools such as STZs facilitate plant survival (Bower et al., Reference Bower, Clair and Erickson2014). However, in the context of adaptively important environmental variation not included in STZs (e.g., most provisional and empirical STZs are based solely on climate averages) and interannual weather variation, we may question whether STZs accurately predict native seed source performance (e.g., Nolan et al., Reference Nolan, Luong, Valliere, Mazer and D’Antonio2023). Field-based experiments that incorporate wild-collected native seed from across species’ environmental distributions are opportunities to test these hypotheses. By leveraging wild-sourced seed from at least 10 populations of three species important for restoration across the southwestern United States, we show that climate matching alone does not best predict empirical patterns of mortality. Instead, species respond to environmental variation in complex and individualistic ways.
After four years in an experimental garden with minimal management, B. curtipendula, S. cryptandrus and H. villosa experienced high levels of mortality across all seed sources (Figure 4). High mortality, despite supplemental watering in 2019 and 2020, reflects the difficulties restoration practitioners face in establishing plants in drylands worldwide (Shackelford et al., Reference Shackelford, Paterno, Winkler, Erickson, Leger, Svejcar, Breed, Faist, Harrison, Curran, Guo, Kirmer, Law, Mganga, Munson, Porensky, Quiroga, Török, Wainwright, Abdullahi, Bahm, Ballenger, Barger, Baughman, Becker, Lucas-Borja, Boyd, Burton, Burton, Calleja, Carrick, Caruana, Clements, Davies, Deák, Drake, Dullau, Eldridge, Espeland, Farrell, Fick, Garbowski, de la Riva, Golos, Grey, Heydenrych, Holmes, James, Jonas-Bratten, Kiss, Kramer, Larson, Lorite, Mayence, Merino-Martín, Miglécz, Milton, Monaco, Montalvo, Navarro-Cano, Paschke, Peri, Pokorny, Rinella, Saayman, Schantz, Parkhurst, Seabloom, Stuble, Uselman, Valkó, Veblen, Wilson, Wong, Xu and Suding2021). Our model that explained the most variation in mortality was one of the most complex, including all variables with species interaction terms except for geographic distance. Geographic distance was the only variable to which all species responded consistently, though geographic distance by itself was a poor predictor of performance. Despite a moderate correlation between geographic and climate distance, geographic distance increased our best model’s predictive power, indicating that it encapsulates environmental or biotic factors relevant to species survival beyond climate and the soil variables included here. For example, geographic distance may capture other interactions known to influence plant performance, such as with mycorrhizae (Bahram et al., Reference Bahram, Peay and Tedersoo2015), soil biota (Vandegehuchte et al., Reference Vandegehuchte, De La Peña, Breyne and Bonte2012; Sherrard et al., Reference Sherrard, Joers, Carr and Cambardella2015), pathogens (Crémieux et al., Reference Crémieux, Bischoff, Šmilauerová, Lawson, Mortimer, Doležal, Lanta, Edwards, Brook, Tscheulin, Macel, Lepš, Müller-Schärer and Steinger2008; Rúa et al., Reference Rúa, Antoninka, Antunes, Chaudhary, Gehring, Lamit, Piculell, Bever, Zabinski, Meadow, Lajeunesse, Milligan, Karst and Hoeksema2016), or other interactions between the abiotic and biotic environment (López-Goldar and Agrawal, Reference López-Goldar and Agrawal2021).
Species' mortality responded inconsistently in both direction and strength to percent sand, soil pH and climate distance (Figure 2), reflecting the importance of interaction terms in our best model. Species-specific responses to edaphic characteristics are well demonstrated within the literature (Rajakaruna, Reference Rajakaruna2004). Within species, differences in pH and nutrient levels can result in adaptive trait differentiation among populations (Raabová et al., Reference Raabová, Münzbergová and Fischer2011) and soil texture influences aridity experienced by plants by how they retain water and how available that water is to plants (Jensen et al., Reference Jensen, Mogensen, Poulsen, Henson, Aagot, Hansen, Ali and Wollenweber1998). In our study, mortality was significantly affected by percent sand across species, while species’ responses to pH were idiosyncratic (Rupprecht et al., Reference Rupprecht, Hölzel and Bucharova2021), which demonstrates the importance of evaluating all species prioritized for restoration and rehabilitation efforts, including those known to have strong local adaptation to edaphic factors or that inhabit edaphically distinct environments (Rajakaruna, Reference Rajakaruna2017). We acknowledge the difficulty of finding soil data at fine enough resolution or across broad spatial extents (though see Nauman et al., Reference Nauman, Kienast-Brown, Roecker, Brungard, White, Philippe and Thomson2024; Ramcharan et al., Reference Ramcharan, Hengl, Nauman, Brungard, Waltman, Wills and Thompson2018). However, pH and soil texture may be readily obtained for restoration sites with either rough measurements in the field or in partnership with a local expert.
While species-specific responses to edaphic characteristics were expected, the unique responses of species to climate distance were unexpected. Indeed, the implicit assumption in many management efforts is that minimizing climate distance, as facilitated by tools such as STZs, supports successful restoration outcomes (Bower et al., Reference Bower, Clair and Erickson2014). Within our study species, B. curtipendula seed sources from climates more similar to the experimental garden performed substantially worse, and the strength of the relationship (i.e., the slope in Figure 2) was also strong. H. villosa seed sources from similar climates performed substantially better, though the strength of the relationship was weak, and S. cryptandrus performance was not correlated with climate distance. These results corroborate patterns identified in Baughman et al. (Reference Baughman, Agneray, Forister, Kilkenny, Espeland, Fiegener, Horning, Johnson, Kaye, Ott, St. Clair and Leger2019), wherein a literature review of local adaptation experiments across the western United States demonstrated that, while local adaptation may be a pervasive evolutionary response by plants across the region, there are many instances of mixed or negative performance outcomes (i.e., see their Figure 4c). While our data do not help us identify the mechanism by which the hypothesized climate-adaptation relationship breaks down, the inclusion of geographic distance and soil properties in our best model indicates that climate distance alone may not support management practices. We also note that we did not test whether species-specific, empirical STZs may result in lower mortality when selecting seed sources based on climate matching, as these products were not available for our focal species during our study.
Our findings highlight the usefulness of long-term monitoring in experimental gardens (Aradottir and Hagen, Reference Aradottir and Hagen2013; Moffet et al., Reference Moffet, Hardegree, Abatzoglou, Hegewisch, Reuter, Sheley, Brunson, Flerchinger and Boehm2019). We did not begin to observe a consistent leveling out of mortality until 2022, three years after plugs were planted in the experimental garden. Moreover, species experienced mortality at different rates throughout the study (Figure 4). For example, mortality in S. cryptandrus occurred most rapidly between 2019 and 2020 across all populations, whereas H. villosa experienced greater variability among populations in mortality rates, and B. curtipendula was more consistent throughout. These trends parallel those reported by Germino et al. (Reference Germino, Moser and Sands2018), wherein Artemisia tridentata establishment was monitored over a 25-year period in an experimental garden. Mortality in this long-lived shrub took approximately 17 years to stabilize, and the rate of mortality varied among populations. Within a restoration treatment, differences between populations with rapid mortality versus gradual mortality may influence outcomes; plants persisting after relatively high mortality may reproduce opportunistically during wet years, thereby potentially overcoming initially poor performance. Further, it is possible that some populations may have increased reproductive output earlier in establishment at the expense of survival (Sheth and Angert, Reference Sheth and Angert2018). Whether such a demographic trade-off can effectively rescue declining populations remains unclear (Sheth and Angert, Reference Sheth and Angert2018).
Contemporary, interannual weather variability can present a challenge to land management practices that use tools based on long-term climate averages, as unpredictable short-term weather patterns, extreme weather events (Williams et al., Reference Williams, Cook and Smerdon2022) and the velocity of climate change (Loarie et al., Reference Loarie, Duffy, Hamilton, Asner, Field and Ackerly2009) introduce variation outside what is represented by climate values averaged over past decades. Plants experienced years with high temperatures and low precipitation relative to the long-term average conditions at the experimental site. Considering these weather patterns, we tested whether mortality in 2023 was significantly correlated with seed source mean annual temperature or precipitation. While no discernible patterns were evident in B. curtipendula or S. cryptandrus, H. villosa seed sources from populations with the highest mean annual temperature had the lowest mortality (Table 2). While not a ubiquitous pattern across species, for those species in which predictive provenancing – or selecting seed sources according to the climate expected to prevail at a restoration site (Bucharova et al., Reference Bucharova, Bossdorf, Hölzel, Kollmann, Prasse and Durka2019) – may support higher performance, climate-matching tools incorporating future climate variation can support the selection of seed sources during landscape management activities (Shryock et al., Reference Shryock, DeFalco and Esque2018; St. Clair et al. Reference St. Clair, Richardson, Stevenson-Molnar, Howe, Bower, Erickson, Ward, Bachelet, Kilkenny and Wang2022). However, we note that our field-based experiment started with greenhouse-grown plants, and we bypassed selective factors that may influence survival resulting from a species’ regeneration niche (Poorter, Reference Poorter2007). Furthermore, we did not track fecundity over the timeframe of this study (see Samuel et al., Reference Samuel, Mitchell, Winkler, Davidson, Lencioni and Massatti2024), which may be more important for the persistence of a restored population than an individual plant’s long-term survival (Pywell et al., Reference Pywell, Bullock, Roy, Warman, Walker and Rothery2003).
For species where climate distance does not predict performance, mixed-source provenancing strategies may support more successful restoration outcomes compared to predictive provenancing or climate matching (also known as local provenancing). Mixed-source provenancing strategies, for example, admixture and composite provenancing, focus less on climate matching and more on increasing overall genetic diversity, under the assumption that higher genetic diversity allows selection of the best genotypes at a particular site (see Breed et al., Reference Breed, Stead, Ottewell, Gardner and Lowe2013; Prober et al., Reference Prober, Byrne, McLean, Steane, Potts, Vaillancourt and Stock2015; Bucharova et al., Reference Bucharova, Bossdorf, Hölzel, Kollmann, Prasse and Durka2019 for in-depth discussions and references). Here, we do not test whether genotypic diversity may be correlated with population performance, but we quantify that, at least for B. curtipendula and S. cryptandrus, mortality is not tied to climate distance. However, for every species, mortality averaged across seed sources with a climate distance <2 (relative to the experimental garden, based on principal components analysis) was lower than the mortality rate of the climatically closest seed source to the experimental garden (Supplementary Table S1). As such, our results indicate that a regional admixture provenancing strategy (Bucharova et al., Reference Bucharova, Bossdorf, Hölzel, Kollmann, Prasse and Durka2019) may represent a bet-hedging approach, for example, by providing population variability that can buffer interannual weather conditions and/or microsite variability (Nolan et al., Reference Nolan, Luong, Valliere, Mazer and D’Antonio2023), which may increase overall survival in a restoration treatment. To the extent that interannual variation influences the performance of seed sources, an additional approach may be to seed restoration sites over multiple years, contrary to standard practice (Kulpa et al., Reference Kulpa, Leger, Espeland and Goergen2012; Pyke et al., Reference Pyke, Wirth and Beyers2013).
In the event that restoration professionals can include multiple intraspecific seed sources in a seed mix designed for a restoration site, care should be taken to avoid mixing incompatible seed sources for outcrossing species, either within the seed mix or between the seed mix and conspecifics at the restoration site. Incompatibility can manifest as reduced fecundity when individuals established from seed sources pollinate other intraspecific seed sources or pre-existing conspecifics, or as lower competitive ability of seedlings resulting from such outcrossing events. Incompatibility results from genomic differences that accumulate within a species through processes such as genome duplication (e.g., polyploidy or aneuploidy; Kramer et al., Reference Kramer, Wood, Frischie and Havens2018), inversions (Kirkpatrick and Barton, Reference Kirkpatrick and Barton2006), local adaptation (McKay et al. Reference McKay, Christian, Harrison and Rice2005), or genetic drift over a species’ history (Frankham et al., Reference Frankham, Ballou, Eldridge, Lacy, Ralls, Dudash and Fenster2011). Without pre-existing knowledge of the genetic patterns within a species, practitioners can reduce the probability of mixing seed sources that are too differentiated by limiting the geographic distances across which seed sources are collected (Massatti et al., Reference Massatti, Shriver, Winkler, Richardson and Bradford2020). However, quantifying spatial patterns of genetic differentiation resulting from historical processes (e.g., Massatti and Winkler, Reference Massatti and Winkler2022) would provide the most actionable guidance for seed source mixing, as genetically defined groups are generally considered cohesive units due to recent or ongoing gene flow (Waples and Gaggiotti, Reference Waples and Gaggiotti2006).
In conclusion, by using mortality patterns of three plant species established in an experimental garden, we were able to quantify the complexity of species’ responses to environmental gradients. Specifically, our results indicate that (1) in a simple model, climate distance performed better than geographic distance in predicting mortality; (2) soil characteristics, including texture and pH, were important for explaining mortality patterns across the study species; (3) species responded to climate and edaphic variables uniquely, but mortality was always positively correlated with geographic distance; (4) when we assessed mortality patterns in the context of abnormally hot, dry weather at our experimental garden relative to average climates, we found that seed sources from hotter and drier climates relative to the garden had lower mortality in only one species. Further, for each species, averaging mortality rates across seed sources with roughly similar but not identical climates relative to the experimental garden resulted in lower mortality than the most climatically similar seed source. Our results indicate that, if species-specific resources are not available, restoration in drylands may benefit from a regional admixture provenancing strategy.
Open peer review
For open peer review materials, please visit http://doi.org/10.1017/dry.2026.10031.
Supplementary material
The supplementary material for this article can be found at http://doi.org/10.1017/dry.2026.10031.
Data availability statement
The authors confirm that the data supporting the findings of this study are available within the article and its supplementary materials.
Acknowledgments
We thank the New Mexico Land Conservancy for their accommodation for this project at the Petchesky Conservation Center. In addition, we thank the Institute for Applied Ecology and the Bureau of Land Management Plant Conservation and Restoration Program for making seeds available. S. Lencioni, L. Shriver, M. Mullins, M. Rahn, C. Gill and A. Wolf maintained the garden and collected data. T. Faske provided input for Figure 1. P. Chuckran provided intellectual contributions for this work. Any use of trade, product, or firm names is for descriptive purposes only and does not imply endorsement by the U.S. Government.
Author contribution
R.M. conceived of the analysis, C.M.R. conducted the analysis, C.M.R. and R.M. wrote the manuscript, E.M.S. conducted the field work and generated the data, and all authors provided manuscript edits.
Financial support
This work was supported by the U.S. Department of the Interior Bureau of Land Management Colorado Plateau Native Plant Program (R.M., grant number L23PG00110) and New Mexico Plant Conservation Program (R.M., grant number L23PG00055).
Competing interests
The authors declare none.


 Open access
Comments
Date: August 1, 2025
Title: Rethinking seed selection based on climate matching during restoration: geographic, soil, and climate variation are necessary to explain species-specific mortality patterns
Name of corresponding author: Carla Roybal
Dear Drylands editors,
Please accept our paper, “Rethinking seed selection based on climate matching during restoration: geographic, soil, and climate variation help explain species-specific mortality patterns,” as a research article submission to Drylands. We submit this research article at the invitation of Drylands editor, Dr. Magda Garbowski. In our paper, we challenge the dogma implicit in seed transfer zones supporting landscape management that climate is the most important factor in determining plant performance. We leverage mortality data collected across three plant species, each represented by more than ten wild collected populations, to investigate models which leverage a common garden dataset to explore drivers of mortality in three species of restoration interest in the Southwestern United States.
Our findings suggest that many facets of environmental variation, including soils, climate, and unknown aspects related to environmental distance, contribute to plant performance in a species-specific manner. We also assessed mortality in the context of abnormally hot and dry weather compared to climate norms.
Our results highlight a potential strategy for restoration in drylands: if multiple intraspecific, genetically appropriate, and climatically approximate seed sources are available, a regional admixture provenancing strategy may increase the probability that seeds will establish and persist.
We find the applicable nature of this research is well suited to the readers of Drylands.
All authors have viewed and approved the submission of this manuscript. The results have not been previously published and are not being considered for publication in another journal.
Sincerely,
Carla Roybal
croybal@usgs.gov