

1. Introduction
This review is concerned with computer simulations of kinetics in molecular biophysics. In the last few years, there were numerous advances in theories of molecular simulations and this review focuses on one class of them. These advances made it possible to investigate time scales of biological processes rigorously and in detail. The use of simulations in conjunction with experimental tests makes it possible to construct comprehensive models of biological function. This is a useful opportunity since understanding kinetics is critical to the study of life at the molecular level.
The direction of many life processes is determined by kinetic selection. The next biochemical process to occur in a cellular environment is not necessarily the one leading to the most stable products. Instead, the selected process is progressing most rapidly as living systems exploit kinetics to pick desired outcomes. The role of enzymes, transporters, and molecular machines is to respond to diverse environmental changes quickly, according to the system needs, and with an appropriate set of tools. Therefore time scales and rates of biochemical reactions and biophysical processes are of considerable interest.
Computer simulations are an approach for studying biomolecular kinetics in atomistic detail. The quality of the results depends on the accuracy of the models and, hence, must be compared with experiment. If the comparison is favorable, the simulations are used to extract additional information on specific and complex mechanisms. Kinetics in biological systems are frequently modeled as a set of individual processes or as a collection of coupled reactions (a network) responsible for phenotypic behavior. Studies of biological networks are another important direction in which time scales are manipulated to ensure stability and specificity of collective behavior.
Thermodynamics and energy analysis determine the maximum amount of (free) energy available to a process, which motivates static investigations of biochemical systems. Thermodynamic considerations constrain kinetic pathways to those that satisfy the laws of thermodynamics. The last statement that seems a cliché is nevertheless problematic. Biological systems function far from equilibrium. For example, concentration and potential gradients across biological membranes are used as fuels for the production of biological energy (ATP) (Hochachka & Somero, Reference Hochachka and Somero2002) and directly influence transport processes. The requirements for fast reactions and retention of non-equilibrium conditions put biochemical and biophysical kinetics at variance with the frequently used kinetic models that assume near-equilibrium conditions. Nevertheless, equilibrium studies are useful for many biochemical processes due to the wide range of time scales in biology. Early works considered transitions between energy minima (Czerminski & Elber, Reference Czerminski and Elber1990; Wales & David, Reference Wales and David2003) assuming local equilibrium in the minima and metastability of these states. More elaborate exploitations of the metastability idea were put forward in the Macrostate approach of Shalloway (Shalloway, Reference Shalloway1996) and in the Markov State Models (Chodera et al. Reference Chodera, Singhal, Pande, Dill and Swope2007; Noe et al. Reference Noe, Horenko, Schutte and Smith2007; Sarich et al. Reference Sarich, Noe and Schutte2010). Separation of temporal scales implies that the fastest processes are at quasi or local equilibrium, while slower processes are not. For example, rapid folding of small proteins is completed in microsecond time scale (Prigozhin & Gruebele, Reference Prigozhin and Gruebele2013), while passive permeation events of peptides through membranes continue seconds and minutes (Cardenas et al. Reference Cardenas, Shrestha, Webb and Elber2015). The secondary structure of a peptide that permeates a membrane is in equilibrium during translocation through the membrane. We, therefore, seek a computational methodology that models a broad range of biophysical and biochemical kinetic data at extended time scales. This technology should also handle non-equilibrium states, as dictated by the problems at hand.
Atomically detailed simulations (Frenkel & Berend, Reference Frenkel and Berend1996; McCammon & Harvey, Reference McCammon and Harvey1987; Schlick, Reference Schlick2002) offer the most comprehensive, simulation method of biological activity. We focus on classical mechanic models of biological molecules in which empirical force fields are used to integrate equations of motions or sample configurations from desired ensembles (Allen & Tildesley, Reference Allen and Tildesley1987). Such models and simulations, called Molecular Dynamics or MD for brevity, have been around for decades, providing considerable insight into a diverse set of problems. It is a significant question what motivated the author to write the present review given the extensively documented successes of MD simulations. More careful examination of past MD studies reveals a strong emphasis on equilibrium and thermodynamics, (Frenkel & Berend, Reference Frenkel and Berend1996) making the study of kinetics the challenge of the present time.
2. Computer simulations of kinetics
The most straightforward computational approach to study kinetics is to run a large number of trajectories initiated at the reactant and to follow their population as a function of time. Let the number of trajectories be N. At the starting time t = 0, all the trajectories are found in the reactant, distributed in that state according to pre-set conditions. Typically the initial distribution follows local equilibrium hypothesis, and the Boltzmann distribution is used. Metastability of the reactant and product implies that the relaxation times within the states are much shorter than the time scale for exiting the metastable state and for a transition to the product. After initiation, the trajectories are integrated as a function of time using a concrete model for the particle motions. The model for the dynamics can be deterministic, like the Newton's equations of motion or stochastic, like the Langevin equation (Allen & Tildesley, Reference Allen and Tildesley1987). As the time advances some of the trajectories make it to the product state and complete a successful reaction. To measure the rate or the typical time of the reaction we consider the Mean First Passage Time (MFPT), which is the average time that it takes a collection of trajectories to reach the product state for the first time. We denote the MFPT also by 〈τ〉. In the simulation, we set an absorbing boundary condition at the product state, or in other words every trajectory that reaches the product state and ‘touches’ the boundary surrounding the products vanishes. As some of the trajectories disappear the population, N(t), decays as a function of time t. If the decay is of the form N(t) = N exp( − t/〈τ〉) then a rate coefficient of the reaction is k = 1/〈τ〉. Alternatively, the MFPT can also be estimated as the average time that it takes for the trajectory to reach the absorbing boundary $\langle \tau \rangle = 1/N\sum\nolimits_{i = 1, \ldots, N} {t_i} $
where t
i
is the termination time of the i-th trajectory. We comment that while the rate coefficient k is more widely used in the chemical and biochemical literature, it is less general than the MFPT. The reason is that the MFPT is a well-defined quantity for any type of kinetics, exponentially decaying as a function of time, or not. The rate coefficient is meaningful only for reactions that follow exponential kinetics. For example, if the process is diffusive the population may decay as a power law in time – N(t) ∝ t
−α
. The most comprehensive view of the kinetics is provided by ρ(τ), the probability density of the first passage time; i.e. the probability that in a single trajectory we will observe a first passage time between τ and τ + dτ. However, this information is difficult to obtain experimentally. Typically only the first moment of the distribution of the first passage time, 〈τ〉, is available.
$\langle \tau \rangle = 1/N\sum\nolimits_{i = 1, \ldots, N} {t_i} $
where t
i
is the termination time of the i-th trajectory. We comment that while the rate coefficient k is more widely used in the chemical and biochemical literature, it is less general than the MFPT. The reason is that the MFPT is a well-defined quantity for any type of kinetics, exponentially decaying as a function of time, or not. The rate coefficient is meaningful only for reactions that follow exponential kinetics. For example, if the process is diffusive the population may decay as a power law in time – N(t) ∝ t
−α
. The most comprehensive view of the kinetics is provided by ρ(τ), the probability density of the first passage time; i.e. the probability that in a single trajectory we will observe a first passage time between τ and τ + dτ. However, this information is difficult to obtain experimentally. Typically only the first moment of the distribution of the first passage time, 〈τ〉, is available.
The approach described above of running multiple trajectories from reactants to products is the most straightforward way to estimate the MFPT; however, it is not feasible in numerous cases. The problem is that the MFPT can be long compared with the time scale accessible to straightforward MD simulations. The typical time scale of simulation is sub-microseconds while many biological processes such as enzyme reactions (Warshel, Reference Warshel1997), slow folding events (Aronsson et al. Reference Aronsson, Brorsson, Sahlman and Jonsson1997) and conformational transitions (Elber & West, Reference Elber and West2010), can be of milliseconds or even longer. Hence, trajectories that start at the reactant state will not reach the product in the time accessible to MD simulations. How to estimate the MFPT? One famous approximate computational approach to estimate the rate coefficient (and the MFPT) is the Transition State Theory (TST) (Vanden-Eijnden & Tal, Reference Vanden-Eijnden and Tal2005). It is beyond the scope of the present review to discuss TST in details. We only note that the most frequent applications of TST requires a well-defined transition state (a single dominant high barrier), an assumption that is not satisfied in many biophysical processes.
3. The use of short trajectories to simulate long time kinetics
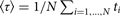
In the last few years, several new approaches have emerged that replace the long trajectories between reactants and products by a large number of short trajectories. At first sight, this idea seems absurd. How can short trajectories of typically picosecond length provide information on millisecond dynamics? The answer is in a theory of how to initiate and terminate these short trajectories and how to combine the information the short trajectories generate. The theory estimates local transition rates between nearby positions in coarse space or milestones (see also Fig. 1). For example, we compute the typical time to achieve a small change in distance (e.g. 0·1 Å). Using the theory the accumulation of these small changes provides a global view of the kinetics.
A schematic illustration of how short trajectories can be used to estimate long time behavior of the system. We plot a two-dimensional energy surface with an entropic barrier at the center. In approaches that utilized short trajectories, the space is divided into cells and short trajectories (red curved arrowed lines) are initiated at boundaries of cells (black lines). The trajectories are continued until they hit another boundary, which we call a “milestone” (Faradjian & Elber, Reference Faradjian and Elber2004).

We briefly describe the theory below and more information can be found in the literature (Kirmizialtin & Elber, Reference Kirmizialtin and Elber2011). The few paragraphs below are technical. Readers that are less interested in the description of the method are encouraged to skip to the paragraph of Summary of Equations
3.1 Statement of the challenges
Consider Fig. 1 of a model two-dimensional system describing a transition from a well on the left to a minimum on the right. There is only a narrow channel leading from the minimum on the left to the minimum on the right. As a result the probability of a stochastic trajectory to reach the narrow pipe is very low. In practice it means that many stochastic trajectories must be tried before we identify a reactive trajectory. Alternatively, we may need to simulate a single trajectory for an exceptionally long time, bouncing from the red walls of the minimum on the left many times before making it to the entry or the ‘pipe’ by a rare event.
The simulations would be more efficient if we can initiate the trajectory closer to the ‘pipe’ in improbable positions. There are two challenges in this proposition. The first challenge is of identifying the pipe and a pathway that leads to it (reaction coordinate – RC), and the second challenge is of modeling the kinetic along the pipe. While in the present simple case the RC can be identified visually as the coordinate x, this is not case for complex conformational transitions of proteins, and additional calculations are required (see Section 3.3).
3.2 Milestoning
To address the second challenge we divide the space along the RC into compartments that are separated by milestones (thin black lines in Fig. 1). We consider transitions between these compartments and will combine the information on local transitions, using consistency criterion, to obtain global information. Short trajectories (here we consider Brownian dynamics (Bello-Rivas & Elber, Reference Bello-Rivas and Elber2015, Reference Bello-Rivas and Elber2016)) are initiated on milestones and chart paths between different interfaces. The original initiating milestone can be re-crossed, and the trajectory is stopped only when it hits for the first time another milestone.
Selective initiation of trajectories at the milestones can enhance the sampling at reaction bottlenecks such as the narrow bridge between the two minima of Fig. 1. It makes it possible to efficiently observe a short trajectory that starts at the top of the barrier and glides to the left. It will be less likely to observe such a transition in a single long trajectory. The question remains, however, how to combine these short trajectories to obtain the kinetics from the reactant to the product. This is where theories like Partial Path Transition Interface Sampling (Moroni et al. Reference Moroni, Bolhuis and van Erp2004), Non-Equilibrium Umbrella Sampling (Warmflash et al. Reference Warmflash, Bhimalapuram and Dinner2007), and Milestoning (Faradjian & Elber, Reference Faradjian and Elber2004) are helpful.
Algorithms that were discussed extensively in the literature (Aristoff et al. Reference Aristoff, Bello-Rivas and Elber2016; Bello-Rivas & Elber, Reference Bello-Rivas and Elber2015; Vanden-Eijnden & Venturoli, Reference Vanden-Eijnden and Venturoli2009a; Warmflash et al. Reference Warmflash, Bhimalapuram and Dinner2007; Zhang et al. Reference Zhang, Jasnow and Zuckerman2010) show that the simulations with short trajectories can be made exact or as accurate as desired. By ‘exact’, we mean that given sufficient statistics kinetic observables would be the same using long or short trajectories. Several approaches exploiting short trajectories are available, such as Weighted Ensemble (Zhang et al. Reference Zhang, Jasnow and Zuckerman2010), Partial Path Transition Interface Sampling (Moroni et al. Reference Moroni, Bolhuis and van Erp2004), and Milestoning (Kirmizialtin & Elber, Reference Kirmizialtin and Elber2011). For clarity and brevity, we focus on the versatile method of Milestoning. Milestoning can handle deterministic (Newtonian) or stochastic (Langevin) dynamics. It can handle equilibrium or non-equilibrium processes and reaction space that include several coarse variables. For processes near thermal equilibrium, a highly efficient variant of Milestoning is available (Kirmizialtin & Elber, Reference Kirmizialtin and Elber2011). For non-equilibrium flow, an exact (but more expensive) implementation is in place (Bello-Rivas & Elber, Reference Bello-Rivas and Elber2016). The expensive version is still more efficient than straightforward MD simulations. All of these variants are based on a single theoretical formulation making the transitions between alternative approaches simple to use, understand, and code. It is available in the software MOIL (Ruymgaart et al. Reference Ruymgaart, Cardenas and Elber2011) and recently was added to NAMD (Phillips et al. Reference Phillips, Braun, Wang, Gumbart, Tajkhorshid, Villa, Chipot, Skeel, Kale and Schulten2005). The simplicity of the algorithm makes it possible to implement it as a script that drives general MD software (Bello-Rivas and Elber, to be published).
Figure 1 captures the essence of the new technology – running short trajectories between cell boundaries that are called milestones. Utilizing these trajectories to compute the MFPT, we evaluate two functions. The first, the kernel K ij , is the probability of reaching a boundary j given that the initial boundary was i. It is estimated from the short trajectories initiated at interface i, K ij ≅ n ij /n i , where n i is the number of trajectories initiated at interface i and n ij the number of trajectories initiated at milestone i that ended up at milestone j. The second function is the lifetime of a milestone – t i . It is the average time that takes a trajectory initiated at milestone i to terminate at any other milestone. It is remarkable that these two local functions, which are confined to two cells, are sufficient to determine the global thermodynamics and kinetics of the system. Of course, we need to determine the transition matrix and the local lifetimes for all the milestones; even so, the calculation is profoundly cheaper than straightforward MD (West et al. Reference West, Elber and Shalloway2007).
With these two functions at hand we determine first the eigenvector of the matrix K with an eigenvalue of one – ${\bf q}^t{\bf K} = {\bf q}^t$
. The i-th element of the vector
${\bf q}^t{\bf K} = {\bf q}^t$
. The i-th element of the vector $q_i = ({\bf q})_i$
is the number of trajectories that cross milestone i under stationary (steady state) conditions. This is also a consistency condition that merges the local information of transitions between nearby milestones (the non-zero elements of the K matrix) to obtain a global picture of steady flow throughout the cells. The condition that the flux is stationary imposes relationships on all the fluxes through the milestones and the result is the linear equation.
$q_i = ({\bf q})_i$
is the number of trajectories that cross milestone i under stationary (steady state) conditions. This is also a consistency condition that merges the local information of transitions between nearby milestones (the non-zero elements of the K matrix) to obtain a global picture of steady flow throughout the cells. The condition that the flux is stationary imposes relationships on all the fluxes through the milestones and the result is the linear equation.
We define a state of a trajectory by the last milestone that it crossed. The free energy of state i is given by F
i
= −k
B
T ln[q
i
t
i
], and the MFPT is given by $\langle \tau \rangle = \sum\nolimits_i {{{q_it_i} / {q_f}}} $
where f is the final milestone leading to the product state.
$\langle \tau \rangle = \sum\nolimits_i {{{q_it_i} / {q_f}}} $
where f is the final milestone leading to the product state.
So far we have not addressed the question of how the partitions or milestones are chosen. A reasonable choice of the milestones is important for efficiency and correctness of the calculations. When placing milestones, we have to make sure that the trajectories between the cell boundaries are indeed short and can be sampled with routine MD. We also need to make sure that the transition matrix K ij has a sequence of milestones with non-zero transition probability connecting the reactant and product. Otherwise, we cannot estimate the MFPT or the free energy profile. Nevertheless, there is no need for high precision in milestone placement. There are numerous correct choices and as long as the above two conditions are satisfied; different placement leads to the same free energies and rates.
3.3 Reaction coordinates (RC)
One highly efficient approach to place milestones is along a one-dimensional RC. In the reaction path approach we assume that the process follows a ‘pipe’ or a tube along a complex curvilinear coordinate in the full phase space of the system. In the simplest case it can be the position of a ligand (Yu et al. Reference Yu, Lapelosa, Vanden-Eijnden and Abrams2015), a particular distance, or a few torsion angles (Elber et al. Reference Elber, Kuczera and Jas2009). In more complex processes it is a collective motion that may include thousands of atoms and internal degrees of freedom (Kirmizialtin et al. Reference Kirmizialtin, Nguyen, Johnson and Elber2012). Despite the potential complexity, reaction coordinates are very useful computationally and conceptually. Conceptually they suggest a mechanism for the reaction. Computationally, they restrict the required space to sample trajectories to the neighborhood of the pipe, a significant computational saving.
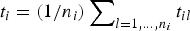
The RC can be guessed using chemical intuition (e.g. the distance between a ligand and an enzyme) or computed. We routinely compute the RC using a chain of configurations that connects the reactant and product. We seek to identify a pipe or a valley in the (free) energy space in which most of the trajectories pass. It is typically identified as a minimum energy or a minimum free energy pathway (see also Fig. 2). The problem is therefore to identify these coordinates in the full space of variables. One of the approaches we use is an exact algorithm to compute minimum energy paths (Ulitsky & Elber, Reference Ulitsky and Elber1990) between a known reactant and product. The RC is presented as a set of discrete points along the reaction coordinate. This algorithm is called LUP or Locally Updated Planes. Vanden Eijnden and E proposed an extension of this algorithm for the calculation of minimum free energy pathways (Weinan et al. Reference Weinan, Ren and Vanden-Eijnden2002), which is called the String method. The minimum free energy pathway is essentially a minimum energy path in an effective landscape (the potential of mean force) of coarse variables denoted by the vector Z. We note that the choice of the coarse space Z is important and far from trivial. It is necessary to include all relevant and slow degrees of freedom in Z to obtain accurate result. In some cases the Cartesian position of a ligand is sufficient (see Section 4.4). In other cases thousands of variables are required to correctly describe a collective motion (see Section 4.1). In general, if the reaction space is not known or obvious from chemical intuition, it is better to include a large set of coarse variables in the search algorithm of Eq. (1). The equations in Z space to minimize the chain of structures and provide a discrete representation of the RC are
 $$\displaystyle{dZ_i \over dt} = - \left\langle \nabla_{Z_i} U \right\rangle \left({\bf I} - \zeta_i \zeta_i^t \right) \quad i = 1, \ldots, L$$
where U is the potential energy, I the identity matrix, i is the index of the point along the path, and ζ is a unit vector along the current slope of the path. The last vector is estimated computationally by a finite difference ζ i ≅ (Z i+1 − Z i )/|Z i+1 − Z i |. The average 〈…〉 is over all degrees of freedom not included in the reaction space (e.g. the position of the water molecules). The set of all coupled differential equations for i = 1, …, L structures along the path are solved simultaneously until a fixed curve is found (dZ i /dt = 0), which is the steepest descent path in energy or free energy spaces. The structures in coarse space, with monotonically increasing indices, defined the RC (Fig. 2). Note that the first and last structures are fixed. We also comment that other definitions of the RC are possible, for example the path of maximum flux (Berkowitz et al. Reference Berkowitz, Morgan, McCammon and Northrup1983; Huo & Straub, Reference Huo and Straub1997).
The use of a minimum energy path to define milestones (Cardenas & Elber, Reference Cardenas, Elber and Schlick2012). The model energy landscape is the Mueller potential (Mueller & Brown, Reference Mueller and Brown1979), a two-dimensional energy landscape designed as a challenge for computational chemists. There are three minima and two saddle points. The black line connecting the upper and lower minima is the minimum energy path. The dots along the line are the discrete configurations Z i that represent the pathway. To define milestones we use the Z i as the centers of Voronoi cells (Vanden-Eijnden & Venturoli, Reference Vanden-Eijnden and Venturoli2009b). A Voronoi cell i is defined as the set of points that are closer to Z i than to any other point Z j≠i . The blue lines are the dividers of the Voronoi cells or the milestones. The position of the first and the final configurations (reactants and products) are fixed. Reproduced from Alfredo E. Cardenas and Ron Elber, “Enhancing the capacity of molecular dynamics simulations with trajectory fragments”, a chapter in “Innovation in Biomolecular Modeling and Simulation: Vol 1”, RSC Biomolecular Sciences 23. Ed. T. Schlick, Royal Society of Chemistry, London, UK, 2012 with permission from Royal Society of Chemistry.

3.3.1 Summary of equations
-
1. The probability of a transition between two milestones i and j is K ij and is estimated from many short trajectories as n ij /n i where n i is the number of trajectories initiated at milestone i, and n ij is the number of trajectories initiated at milestone i that terminate at milestone j (Fig. 1).
-
2. The average lifetime of a milestone is t i , which is estimates as $t_i = (1/n_i)\sum\nolimits_{l = 1, \ldots, n_i} {t_{il}} $
, where t
il
is the time that took trajectory l, initiated at milestone i to hit another milestone and terminate.
$t_i = (1/n_i)\sum\nolimits_{l = 1, \ldots, n_i} {t_{il}} $
, where t
il
is the time that took trajectory l, initiated at milestone i to hit another milestone and terminate. -
3. The number of trajectories that pass through milestone i in unit time is q i . The steady state q i is given by a solution of the linear equations
(2)where K ij is estimated in 1.
$$\sum\limits_i q_iK_{ij} = q_j \quad \forall j$$
-
4. The free energy of trajectories that passed milestone i last, and the overall MFPT are given by
(3)and
$$F_i = - k_{\rm B}T\ln (q_it_i)$$
(4)where q f is the number of trajectories that enter to the product state.
$$\left\langle \tau \right\rangle = \sum\limits_{i} q_i t_i / q_f $$
-
5. The RC is represented by a set of discrete points spreads along the valley of the minimum free energy path between reactants and products in which the trajectories are likely to pass. It satisfies the quench equation:
$dZ_i/dt =-\langle \nabla _{Z_i}U\rangle ({\bf I} - \zeta _i\zeta _i^t )$
for all intermediate structures i in coarse space (the structures of the reactant and product must be given and they are fixed). The average 〈…〉 is for the degrees of freedom not in Z. At the limit of t → ∞ and/or
$dZ_i/dt = 0\ {\rm } \forall i$
the structures provide a discrete representation of the reaction coordinate.


4. Applications
Below we list several interesting and different biological processes studied with the Milestoning approach and quote their typical time scale:
-
1. Conformational transitions and enzyme selectivity (milliseconds) (Kirmizialtin et al. Reference Kirmizialtin, Nguyen, Johnson and Elber2012, Reference Kirmizialtin, Johnson and Elber2015).
-
2. Substrate translocation and ATPase motion (milliseconds) (Ma & Schulten, Reference Ma and Schulten2015).
-
3. Water permeation through membrane (microseconds) (Cardenas & Elber, Reference Cardenas and Elber2014, Reference Cardenas and Elber2016).
-
4. Ligand diffusion in a protein (microseconds) (Yu et al. Reference Yu, Lapelosa, Vanden-Eijnden and Abrams2015).
-
5. Rapid ligand-protein binding (k on ≃ 109 M−1 s−1) (Votapka & Amaro, Reference Votapka and Amaro2015).
These problems are discussed below at some length.
4.1 Selectivity of a polymerase
One of the intriguing questions in enzymology is the role of the protein conformational transition in determining the specificity of the enzyme and the rate. By specificity, we mean its ability to pick up the correct substrate. Enzymatic reactions typically consist of several elementary steps
 $$E + S {\mathop {\rightleftharpoons}\limits_{k_{ - 1}}^{k_1}} ES {\mathop {\rightleftharpoons}\limits_{k_{ - 2}}^{k_2}} {E ^\prime} S {\mathop {\rightarrow} \limits^{k_3}} E + P$$
The symbol E denotes the bare enzyme, S is the substrate, ES is the enzyme-substrate complex while the substrate is only weakly (physically) bound to the protein, E′S is the complex after a conformational transition of the protein, and P is the product. Each of these steps can make a significant contribution to the speed of the reaction or to the specificity. In (Kirmizialtin et al. Reference Kirmizialtin, Nguyen, Johnson and Elber2012, Reference Kirmizialtin, Johnson and Elber2015) we focused on the impact of the conformational transition (step 2). We consider the enzyme HIV Reverse Transcriptase (HIV RT) that synthesizes one strand of DNA (or RNA), according to a template. Copying genetic information must be done accurately and efficiently.
The first step of the calculation must decide on the partition of space or the definition of milestones. Here we use a calculation of a reaction coordinate. It is not obvious that a single one-dimensional RC is sufficient to exhaustively explore the enzyme dynamics. Alternative pathways may exist. However, for enzymes and other molecular machines, we expect a design such that the motions of the protein are focused in a low dimension space. We expect these systems to follow a minimum free energy pathway (or a valley in free energy that guides them efficiently from reactants and products). If the number of soft modes or valleys accessible to a machine is large, and the system can proceed in many different directions, then the machine will be less efficient and specific. Imagine a car, a machine in the macroscopic world, which is responding to the wheel stochastically in more than one way. Clearly, such a wheel is a flawed design. It is, therefore, no surprise that models of the dynamics of biological machines in a neighborhood of a one-dimensional RC are working quite well.
We compute the RC for the conformational transition with the ligand bound (step 2) using the initial and final structures of the complexes as input (structures 1RTD (Huang et al. Reference Huang, Chopra, Verdine and Harrison1998) and 1J50 (Sarafianos et al. Reference Sarafianos, Marchand, Das, Himmel, Parniak, Hughes and Arnold2009) of the PDB (Berman et al. Reference Berman, Westbrook, Feng, Gilliland, Bhat, Weissig, Shindyalov and Bourne2000)). Since the motions are collective and extended over many atoms it is important to include a large number of coordinates in the coarse space. This inclusion avoids missing slow and relevant degrees of freedom when computing the RC. The coarse variables that define the reaction space Z (in which the RC is embedded) include all the alpha carbons of the protein and all the heavy atoms of the fingers domain (residues 1–85 and 115–150). To determine the reaction coordinate, we seek a curve that connects the reactant and product in coarse space and satisfies the equations of motion for a quenched chain (Fig. 2 and Eq. (1)).
Once the RC was at hand, we set milestones as hypersurfaces orthonormal to the curvilinear coordinate and initiated trajectories at the milestones (see Fig. 1). The initial and termination points of the trajectories are recorded and are used to estimate the matrix K. We also record the local lifetimes of the milestones in the vector ${\bf t} t_i = ({\bf t})_i$
(see Summary of Eqs. (1) and (2)).
${\bf t} t_i = ({\bf t})_i$
(see Summary of Eqs. (1) and (2)).
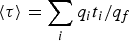
We then use Eqs. (3) and (4) to extract the free energy profile of the conformational transition and the MFPT along the reaction pathway. The position along the RC is the index i of the structure Z i of the curve. In Fig. 3 we report the free energy at position i. We also provide insets of the MFPT with initial condition at the reactant (left inset) or starting at the product and proceeding backward (right inset). Both directions are reported up to a position i along the reaction coordinate. If we use the inverse of the MFPT as an estimate for the rate constant our numbers compared favorably with experiment (Kirmizialtin et al. Reference Kirmizialtin, Nguyen, Johnson and Elber2012). For example, the forward rate coefficient for the correct nucleotide, k 2, is estimated computationally and experimentally at 2500 s−1, and the reverse rate, k −2 is estimated as 4 s−1 experimentally and 40 s−1 computationally. The statistical errors of the simulations are shown in Fig. 3 as bars and are estimated by averaging over independent samples of the short trajectories. They are smaller than the differences between simulations and experiments. Nevertheless, systematic errors of the simulations that include inaccuracies in the model (e.g. force fields) are likely to exceed the difference between simulations and experimental measurements.
The free energy profile for a conformational transition in HIV-RT following the physical binding of a substrate is shown. Two curves are computed. The red curve is the binding of a nucleotide that matches the template, and the blue curve is the binding of a mismatch. On the left we find the open conformation and the minima on the right are for the closed state. Also shown are two insets with MFPT for the transition. The free energy is in k B T where T = 300° K and the time is in nanoseconds. Hence, while the short trajectories between milestones never exceed a nanosecond, we are able to predict reaction times of ~100 ms. Reproduced from Serdal Kirmizialtin, Virginia Nguyen, Kenneth A Johnson, and Ron Elber, “How Conformational Dynamics of DNA Polymerase Select Correct Substrates: Experiments and Simulations”, Structure, 20, 618–627 (2012) with the permission of Elsevier.

The conformational transition with the correct nucleotide (Fig. 3, red circles) is leading to a deep minimum around position 55 that commits the complex towards the right and to the chemical step. The incorrect nucleotide (blue) binds with a shallow minimum and is ready to transition back to the solvent. Hence, this study illustrates the importance of an ‘induced fit’ model for enzyme selectivity. The incorrect substrate is rejected since it does not fit and unable to induce the conformation change, while the correct nucleotide binds strongly and support the final structure of the conformational transition or the induced fit. This is not to say that the conformational transition is the only factor that influences selectivity, but it is clearly an important one.
4.2 RNA translocation and ATPase motion
Enzymes facilitate biochemical reactions by selecting particular substrates and by speeding up reaction. However, there is no investment of energy and the relative free energy of reactants and products remains the same. It is the kinetics and not the thermodynamics that is modified. In contrast, a large class of molecular machines uses biological ATP to drive processes uphill against the passive free energy slope. An intriguing motor is the ring-shaped ATPase, Rho that was investigated recently by Ma & Schulten (Reference Ma and Schulten2015).
The system is highly complex. It consists of a hexamer that forms a channel. The channel translocates RNA by a functional rotation induced by a release of ADP. Each of the six monomers can bind an ATP and process it to ADP + Pi. The sites at the monomers can be occupied by ATP, by ADP + Pi, or be empty. Therefore, their respective conformations are different depending on their binding states, leading to asymmetry of the hexamer. In particular, the interactions of Lysine 326 of each monomer with the RNA are modified. It is this asymmetry that is argued to induce the spectacular functional rotation (Boyer, Reference Boyer1993) of ATPase motors in which the state of the units is changing in a way resembling a rotational motion.
The kinetics and thermodynamics of the process were analyzed with a similar set of tools that were described in the first example. Different implementations of the String method (trajectory swarm (Pan et al. Reference Pan, Sezer and Roux2008)) and Milestoning (Markovian Milestoning (Vanden-Eijnden & Venturoli, Reference Vanden-Eijnden and Venturoli2009b)) were used instead of those discussed in Section 1. However, the basic concepts as described are the same. The authors partition the configuration space along the RC into cells, estimate the fluxes at the cell boundaries by trajectories confined to the Voronoi cells, and solve linear equations for the MFPT by matching the boundary results. For the String method, we need to identify the collective variables, which is challenging in such a complex system similarly to the challenges in determining the RC in HIV RT. When the process is truly collective it is hard to guess a few internal degrees of freedom (e.g. bonds, angles, and torsions) that are sufficient to define the reaction space Z in which the RC is computed with Eq. (1). When our prior knowledge is limited, it is better to use an inclusive approach and define as collective variables a large part of the entire coordinate set. This inclusion reduces the probability of missing relevant motions. Missing variables may cause us to select a wrong mechanism and to predict erroneous rates. Therefore, the positions of 660 key residues were used as coarse variables in the optimization of the reaction pathway. The key residues were selected according to their interaction energies. The study is impressive in its ability to depict a detailed step-wise mechanism for the process. The calculations estimate barriers of up to 10 kcal mole−1 and time scales in the sub-milliseconds (Fig. 4). The estimates are consistent with experiments (Adelman et al. Reference Adelman, Jeong, Liao, Patel, Kim, Oster and Patel2006).
4.3 Water permeation through membrane
Permeation of water molecules through a biological membrane is an important process that counters concentration gradients of solutes and induces osmotic pressure. Water molecules permeate into the volume with higher ion concentration, attempting to lower the ratio of the number of ions to volume. We are interested in the kinetics and thermodynamics of water transport, and we have used Milestoning to accelerate the simulations of the transport.
The first step in Milestoning is the choice of coarse variables, and here we are facing a challenge. There are obviously many water molecules to consider and the degeneracy of which molecule to transport is an issue. Furthermore, it is not clear if a water molecule is being transported on its own or as a cluster. Simulations of thermodynamics illustrate the presence of ‘water fingers’ (Benjamin, Reference Benjamin1993). That is the equilibrium simulations of water-membrane system suggest the presence of clusters of water molecules inside the membrane forming ‘wires’. Based on these studies it is possible to speculate that kinetics of transport may be collective as well. Zhou and Karplus use water density (the number of water molecules per unit volume) at the interface of Scapharca hemoglobin as an order parameter to study the allosteric transition (Zhou et al. Reference Zhou, Zhou and Karplus2003). The number of water molecules at the interface is changing when the hemoglobin conformation is progressing from R to T. Another inspiring, computational study that considers density as an order parameter is the investigation of the hydrophobic collapse of a chain (Miller et al. Reference Miller, Vanden-Eijnden and Chandler2007). In the last study, the space was divided into cells and each cell has its own density as an order parameter. This is the approach we have taken. We divided the simulation box by milestones (Fig. 5) and consider the density fluxes through the milestones (Fig. 6). The Milestoning formulation, summarized in Eqs. (1)–(3) is the same for a system with a network of reaction pathways to describe diffusion and density flow.
An illustration of the coupling between the functional rotation of the ATPase hexamer, Rho, and the translocation of RNA. The RNA on the right is closer to the viewer. The free energy profile for the machine operation is shown. The figure was kindly provided by Mr Wen Ma.

A lattice representation of phospholipid membrane embedded in aqueous solution is shown. Small red spheres attached to two even smaller white spheres are the water molecules. We investigate the transport of water molecules through the blue-green lipid at the center. The large red spheres are the phosphate groups. Atomically detailed simulations are conducted in which atoms can exchange between the different cells. The density changes are monitored and are fed to the Milestoning Eqs. (1)–(3) to obtain the free energy and the MFPT. The coarse variables are types of densities of each cell (number of carbon atoms, number of water molecules, etc.). Reprinted (adapted) with a permission from Alfredo E. Cardenas and Ron Elber, “Markovian and non-Markovian Modeling of Membrane Dynamics with Milestoning”, Journal of Physical Chemistry B, 120, 8208–8216 (2016). Copyright 2016 American Chemical Society.

A schematic representation of density fluxes between spatial cells. Three cells are illustrated at positions R, R′ and R″. The numbers of water molecules (densities of the cells) are ρ(R), ρ(R′), ρ(R′′) respectively. The milestones are the cell boundaries at r and r′. We monitor the number of water molecules that pass in an MD simulation through those interfaces, given that they were initiated earlier at another interface. Hence we determine the kernel K for mass density changes for transitions between milestones r and r′. Reproduced from Alfredo E. Cardenas and Ron Elber, “Modeling kinetic and equilibrium of membranes with fields: Milestoning analysis and implication to permeation”, Journal of Chemical Physics, 141, 054101 (2014), with the permission of AIP publishing.

The Milestoning formulation makes it possible to collect the local fluxes at the boundaries of the cells and compute the free energy along with the transition times. In Fig. 7, we show the free energy profile as a function of two coordinates (i) the membrane depth, z, and (2) the number of water molecules per cell (water density).
The free energy profile for water permeation through membranes is shown as a function of two coarse variables, the membrane depth z and the number of water molecules in a cell. The calculations were conducted in the full space of coarse variables and the results are projected onto two dimensions. The membrane thickness is about 40 angstrom and the center is set to zero. At large values of absolute z (out of the membrane), the entity that approaches the membrane to start the permeation process is a cluster of about 4 water molecules. The cluster size decreases as it approaches the membrane center in which it is of size one. The zigzag purple and black lines are max flux pathways (Viswanath et al. Reference Viswanath, Kreuzer, Cardenas and Elber2013) projected to the plane defined by z and water density. The dotted lines are pathways second and third in flux magnitude compared with the solid lines. The interesting observation is the strong coupling between cluster size and permeation into the membrane. Reproduced from Alfredo E. Cardenas and Ron Elber, “Modeling kinetic and equilibrium of membranes with fields: Milestoning analysis and implication to permeation”, Journal of Chemical Physics, 141, 054101 (2014), with the permission of AIP publishing.

This study illustrates the power and flexibility of the Milestoning approach in investigating a diverse set of problems that do not necessarily conform to the picture of a one-dimensional reaction coordinate.
4.4 Ligand diffusion in a protein
After the experiments exploiting high pressure of Xe in myoglobin were published (Tilton et al. Reference Tilton, Kuntz and Petsko1984) it was recognized that myoglobin structure included empty hydrophobic cavities. The simulations of Tilton et al. (Reference Tilton, Kuntz and Petsko1984), and of Elber & Karplus (Reference Elber and Karplus1990) illustrate that xenon or small ligands, like oxygen or a carbon monoxide penetrate into protein matrices. The diffusion process of the small molecules follows a network of existing cavities and is conducted at sub-microsecond time scales. Time-resolved crystallography added vital information about the process (Aranda et al. Reference Aranda, Levin, Schotte, Anfinrud and Phillips2006). Nevertheless, attempts of fully quantifying the rate coefficients for transitions between the cavities and outside to the solvent were not reported until recently. The reason was the lack of statistics in straightforward MD simulations for all the possible migration pathways. Also puzzling was the apparent disagreement between experiment and theory on a system that is considered the hydrogen atom of biophysics (Austin et al. Reference Austin, Beeson, Eisenstein, Frauenfelder and Gunsalus1975).
Yu et al. used a combination of the String method to determine reaction coordinate, TPT (Weinan & Vanden-Eijnden, Reference Weinan and Vanden-Eijnden2010)) and a variant of Milestoning (Markovian Milestoning (Vanden-Eijnden & Venturoli, Reference Vanden-Eijnden and Venturoli2009b)) to quantitatively determine the rate of transitions between the cavities in myoglobin (Yu et al. Reference Yu, Lapelosa, Vanden-Eijnden and Abrams2015). They consider seven internal cavities and multiple exit pathways to the solvent. Between two cavities, only a single direct path was generated with the String method.
As in previous examples, a critical step in conducting the simulations is the choice of the coarse variables. The simplest selection, which was used in (Yu et al. Reference Yu, Lapelosa, Vanden-Eijnden and Abrams2015), is the three Cartesian coordinates of the center of mass of the small ligand. The authors further examined the ‘histidine gate’ proposed by inspections of the crystal structure (Perutz & Mathews, Reference Perutz and Mathews1966). They found it to be a significant contributor to the overall kinetics. The collection of all the rate coefficients for the diffusion network of carbon monoxide in myoglobin made it possible to determine the overall rate of entry and escape from the protein matrix. The comparisons of the simulation results with experimental data were encouraging.
This study illustrates one of the promising applications of Milestoning – namely, the quantification and analysis of a network of reactions between metastable states. The example here is a ligand migrating between cavities in a protein matrix and its escape to the solvent, where the trapping of a ligand in a cavity is a metastable state. This is similar in spirit to the applications of the Markov State Model (MSM (Sarich et al. Reference Sarich, Noe and Schutte2010)). In MSM we may consider the spatial location of the ligand in one of the cavities (or in the solvent) as a state and construct a corresponding kinetic model for it.
MSM constructs a Master Equation (ME) for transitions between the states. The ME is of the form
 $$\displaystyle{{dP_i} \over {dt}} = \sum\limits_j {k_{ij}P_j} $$
where P i is the probability of being at a metastable state i and k ij is the rate coefficient for a transition between state i and state j. Use of the ME is appealing since it is simple and reduces the system complexity to a Markov model of a few states. It relies on the assumption that the relaxation times within the metastable state are rapid compared with the times of the transitions. As a result every transition occurs from a metastable state at local equilibrium. The Markov limit implies that the transition between two states i and j can be modeled by a single rate coefficient – k ij .
For a total of seven cavities that include among others the heme pocket and the four cavities occupied by xenon, the set of kinetic equations is small and can be investigated in details. Milestoning makes the calculation of individual rate coefficients possible even if the transitions are rare events. In that sense, Milestoning is a complementary algorithm to MSM. It is also interesting to note that Milestoning can be used without a Markov assumption, simply breaking the free volume accessible to the ligand to cells and use milestones as cell boundaries. We then probe the fluxes between cells, simultaneously, using a network of transitions between the cells like the study of membrane density fluctuations. The last approach makes it possible to study the diffusion in a local equilibrium, or in a non-equilibrium state.
4.5 Ligand diffusion to a protein
By now it is quite clear that Milestoning is also a procedure to coarse-grained atomically detailed simulations. By partitioning the space into cells, we decrease the spatial resolution to the cell size. We identify a trajectory by the last milestone that it crossed and not the precise coordinate of the trajectory within the cell. This is (again) similar to a MSM description in which we provide the probability of a trajectory to be in a cell (or a state) but not the precise location within the cell. A significant difference between MSM and Milestoning is that MSM requires the cells to be metastable state while Milestoning does not.
Coarse graining can be done in multiple ways, by (1) decreasing the spatial resolution, as MSM and Milestoning do, or (2) collecting several particles and representing them as a single point mass (e.g. the Martini force field (Marrink et al. Reference Marrink, Risselada, Yefimov, Tieleman and de Vries2007)). Yet another approach to coarse-grained atomic models is to replace the solvent by continuum. Indeed a pioneering study to simulate a forward association of a small ligand and a protein was constructed for continuum solvent using Brownian dynamics (Ermak & Mccammon, Reference Ermak and Mccammon1978). This approach was successful in reproducing the flux of ligand approaching the protein, and overall rate coefficients. Furthermore, it was also successful in depicting the long-range spatial behavior of the trajectories.
How to correctly bridge between coarse-grained models and atomistic simulations remains a challenging problem which is still under investigation. Coarse-grained approaches have to rely on phenomenology to estimate kinetics. An example is the use of a friction constant in diffusive dynamics. The value of the microscopic friction is sometimes unknown, and the estimate of the rate may be uncertain. The authors of the last application we discuss (Votapka & Amaro, Reference Votapka and Amaro2015) took an interesting route to the problem of merging atomistic models and coarse-grained approaches. They made the observation that the ligand fluxes estimated from Brownian dynamics calculations at interfaces can be matched with an atomistic theory of fluxes at the milestones. The system they investigate superoxide dismutase has been a target for Brownian simulations in the past and was now refined using atomistic simulations. The use of spherical interfaces around the protein (or a choice of a RC which is the radial distance from the protein center) makes this intriguing and hierarchical model successful in bridging atomically detailed simulation in a focus area with a coarse-grained description on a larger scale (Fig. 8).
A schematic representation of matching Brownian dynamics (red) with atomically detailed simulations by Milestoning (green) as outlined in reference (Votapka & Amaro, Reference Votapka and Amaro2015). The protein is a blue filled object. The red circle denotes the boundaries used by Brownian dynamics and the twisted arrowed line denotes a Brownian trajectory terminating at the red interface. It is used to generate the distribution of initial conditions for flux sampling using atomically detailed trajectories in Milestoning. A sample Milestoning trajectory is the green arrowed line that is terminated at a green curve.

5. Conclusions
In this paper, we present a new paradigm for atomically detailed simulations of kinetics in biophysical systems. While MD simulations of one or a few trajectories have been proven useful for many problems, they have significant limitations describing kinetics. MD trajectories suggest detailed molecular mechanisms. They allow the computations of thermodynamic observables that are tested against experiment. However, their time scales are too short for direct calculations of kinetics. Methods for enhanced sampling of kinetics that are based on the use of a large number of short trajectories have emerged. In the present review, we described one of these methods, Milestoning, and provide several examples that exploit different formulations and address different problems. We consider processes that include reactions constrained to a ‘tunnel’, following a one-dimensional RC as expected from molecular machines. We also considered mass density fluctuations and transport. Finally, a bridging tool between coarse-grained studies and atomically detailed simulations is described.
As a closing note, we mention an important limitation of the approach. It is difficult to model with Milestoning states with high entropy. For example, we did not mention the famous kinetic problem of protein folding. A significant difficulty in modeling the unfolded state is to identify and sample a sufficient number of cells. States that are characterized with large internal entropy (or a broad distribution of alternative conformations), are difficult to sample. There is no obvious atomically detailed solution to this problem at present besides using exceptionally long trajectories to study folding of small proteins (Lindorff-Larsen et al. Reference Lindorff-Larsen, Piana, Dror and Shaw2011). Alternatively we may give up atomically detailed simulations and conduct approximate coarse-grained calculations (Kmiecik et al. Reference Kmiecik, Gront, Kolinski, Wieteska, Dawid and Kolinski2016).
Acknowledgements
The research summarized in the review was supported by grants GM059796 and GM111364 from the NIH and a grant F-1896 from the Welch Foundation. The editorial assistance of Nurit Elber is gratefully acknowledged.


