


1. Introduction and background
Design is a goal-directed activity (Reference GeroGero, 1990; Reference SimonSimon, 1969). It involves designers taking actions directed towards an internal conception of the design goals. The term design frame is used to refer to this internal conception that a designer has for what they are doing. A design frame involves a way of understanding the problem, a way of working, and a sense of the value being aimed for (Reference DorstDorst, 2011). In this paper, a design frame is taken to be a conceptual assemblage that does these things; an internal structure composed of concepts (Reference Kelly and GeroKelly & Gero, 2022). This definition follows an analysis of uses of the term design frame in the literature revealing multiple and contradictory uses (Reference Kelly and GeroKelly & Gero, 2022).
A core question in design research, at least since the time of Reference SchonSchön (1983), has been: How do designers construct and change their understanding of a design problem and its context throughout design activity? Satisfactory answers remain elusive at the level of cognitive processes. Yet there is broad agreement on the importance of understanding the cognitive and metacognitive abilities of designers, that is, the way that they work with concepts and understand their own ways of working with concepts (Reference Ball and ChristensenBall & Christensen, 2019; Reference Hay, Duffy, McTeague, Pidgeon, Vuletic and GrealyHay et al., 2017). Advances in methods to analyse design protocols for design framing phenomena help to address fundamental questions of why and how frames change. Such questions are significant for advancing scientific understanding of what designers do (design science) and how people gain capabilities for design (design education). For example, how do explicit instruction about approaches to design framing or the provision of real-time feedback change how somebody designs (Reference Kelly, Greentree, Sosa, Evans and GeroKelly et al., 2024)? This paper contributes to methods that can, in future, be used to respond to such important questions.
The methods of inquiry and the language to describe design framing have evolved through decades of research. A widely used method is to code design protocols for episodes of naming and framing and then identify the moving and reflecting that occurs within a frame, Figure 1a (Reference Valkenburg and DorstValkenburg & Dorst, 1998). This method is useful to qualitatively understand how a design frame shifts over time, to make visible the conceptual development of a designer or design team. Another method that makes links between concepts salient is linkography, showing how the concepts developed over time are connected to one another (Reference GoldschmidtGoldschmidt, 2014). Linkography permits quantitative analysis of the emergent conceptual lattice as it develops over time and provides the potential to see the genesis of ideas within the arc of a design problem by looking at forward and backward links, Figure 1. Reference Casakin, Sopher, Gero and AnidjarCasakin et al. (2024) introduced a data-driven approach to quantitatively characterize and measure framing and reframing behaviors during design problem-solving, using the concept of “first occurrence” of ideas in a design session (Reference Gero and KanGero & Kan, 2016).
This paper introduces and demonstrates a novel technique for bringing together semantic analysis through hierarchical word-vector embeddings and network analysis. It uses network and cosine similarity measures to permit comparison of designers addressing the same design task as well as analysis of individual designers addressing a design problem over time. It uses extraction of concepts from design protocols and similarity measurements to permit low-resource and high-precision qualitative analysis of designing. It builds on the work of Reference Kelly, Greentree, Sosa, Evans and GeroKelly et al. (2024) who developed methods for graphing design concepts over time. The method demonstrated here contributes to the agenda laid out by Kelly & Gero, of investigating how designers move around within their own knowledge, Figure 1c (2015). This paper makes a contribution by describing the novel method that blends existing approaches of automated concept identification (with LLMs), contextual word vector embeddings, clustering, and network analysis (graph construction and measurement).
Three different approaches to understanding designers’ cognition during design (a) naming-framing-moving-reflecting method of (after Reference Valkenburg and DorstValkenburg & Dorst, 1998); (b) the linkography method (after Reference GoldschmidtGoldschmidt, 2014); and (c) design activity conceived as a shifting conceptual assemblage within a designer’s own knowledge as inspiration for this paper (Reference Kelly and GeroKelly & Gero, 2015)

2. Methods
The method will be explained by first introducing two design tasks and the participants in a design protocol study. The study is part of a broader US NSF-funded experiment producing fMRI data looking at fixation (Reference Kim, Genzola, Navea, Milovanovic, Gero and ChrysikouKim et al., 2024). This section then describes the methods for semantic and network analysis of design protocols that are the focus of this paper. Results are then included as a demonstration of how this method permits new insights from design protocols into design framing phenomena, i.e., the dynamics of evolving conceptual assemblages that constitute a significant aspect of design cognition.
2.1. Design problems and participants
The experiment from which this verbalization data is drawn involves concurrent multi-modal measurements using fMRI for neurocognitive activity, think-aloud for cognitive activity and sketches for final design activity (Reference Kim, Genzola, Navea, Milovanovic, Gero and ChrysikouKim et al., 2024). Participants were given two tasks. The first task was the design of a spill-proof coffee cup. Instructions to participants read as follows: “You are asked to construct an inexpensive, disposable, spill-proof coffee cup. You should construct as many designs as possible, write comments with each design, and number each individual design. There are no constraints in the materials you may want to use. The problems to be addressed are: (1) Leaking of the cup if it tips over; (2) Leaking of the cup when squeezed; and (3) Hot liquid burning the user’s mouth.”
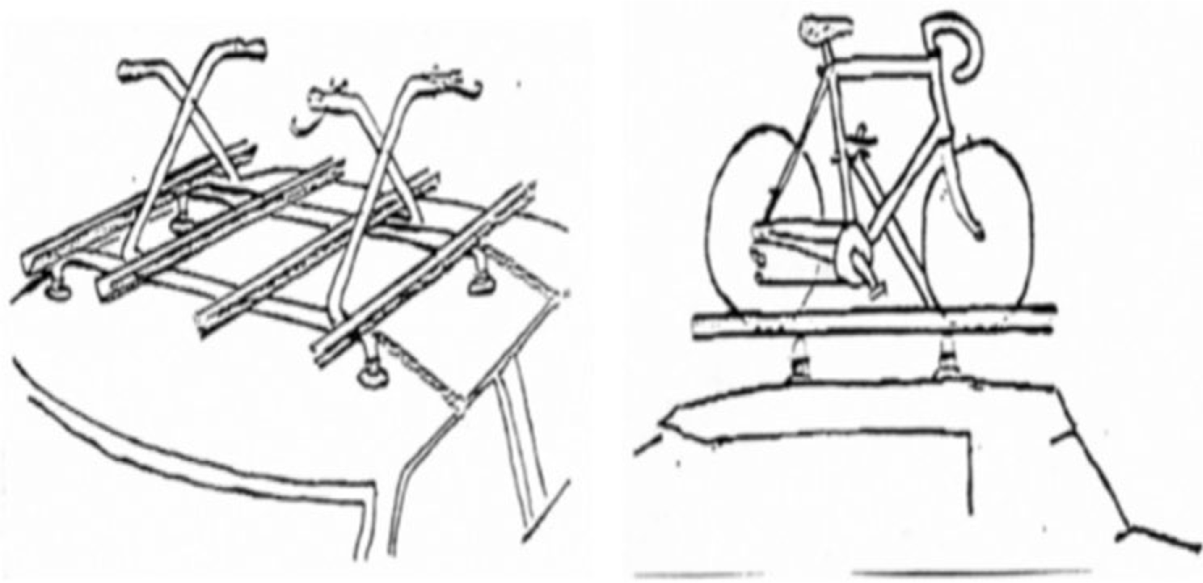
The second task was the design of a new kind of bike rack for a car. Instructions to participants included Figure 2 and the following text: “This is an example of a present-day bike rack. It is a top-mount design having suction cups holding it to the car roof and railings for the bicycle tires. The bicycle is set in the rails and the vinyl coated hook is attached to the seat tube of the bike and then the hook is tightened down by hand with a wing nut. The problem in this case is the difficulty of mounting the middle bikes on the rack. Suppose you are asked to construct a new bike rack for cars. You should construct as many designs as possible, write comments with each design, and number each individual design. There are no constraints in the materials you may want to use. The problems to be addressed are: (1) Easy mounting of the bicycle; (2) Easy mounting of the rack; (3) Cannot harm bike or car; and (4) Must be versatile for all bikes and cars.”
The study reported in this paper involved data from the first 17 participants of this larger study for whom we had complete datasets (i.e., protocols from both problems). Participants were volunteers, recruited from freshman (first year) students in the mechanical engineering degree in a private US east coast university under the university’s IRB arrangement, Participants were paid cash as an incentive to participate. All design activity occurred inside an fMRI machine and participants were able to sketch while designing. This setting and the sketching are irrelevant to the methods that are the focus of this paper but are significant for interpreting the results included here. Designing continued for 16 minutes. The think aloud recordings were transcribed, cleaned, and divided into 2-second segments to match the TR (repetition time) in the fMRI scanning. This transcript was the input for the process described.
Image included alongside instructions in bike rack design problem (Reference Kim, Genzola, Navea, Milovanovic, Gero and ChrysikouKim et al., 2024)

The pipeline for the entire method is shown in schematic form in Figure 3. Each of these steps is then described in more detail.
Pipeline for analysis of design protocol, from input of transcript to output of network and semantic measures

2.2. Coding concepts
Prior work has shown human coding of concepts and suggested the possibility of automating this with LLMs (Reference Kelly, Greentree, Sosa, Evans and GeroKelly et al., 2024). In this work we used a static LLM from OpenAI, “gpt-4o-2024-08-06”, accessed through API. Coding of concepts within transcripts was carried out by the LLM using the method and prompts described in this prior work by Reference Kelly, Greentree, Sosa, Evans and GeroKelly et al. (2024) with conceptual underpinning in situated cognition (Reference BarsalouBarsalou, 2005). The essence is that a concept is a noun along with its modifiers and adjectives but not pronouns or verbs.
Using an LLM for identifying concepts is inherently unreliable, both internally (repeated coding of the same transcript) and when compared to humans. This is a significant limitation of the method that is counterbalanced by the speed and low resources required when compared to human coding of concepts, though further research would be required to quantify this trade-off.
2.3. Semantic distance
Vectors within semantic word space were established for each identified concept. Word embeddings came from OpenAI’s model “text-embedding-3-small”. Weightings in establishing vectors were 0.8 for the full concept and 0.2 for the full sentence (including the concept) to shift weightings based on context of concept usage, i.e., the same concept will have different weights when used within different sentences.
Similarity between any two concepts was calculated as the cosine similarity between vectors, where a higher cosine similarity indicates more similarity between concepts (Reference SaltonSalton, 1983). Two cosine similarity measures were used in the study. The first is leap similarity, the similarity of the present concept to the immediate previous concept used by the designer. The second is global similarity, the similarity of the present concept to the most similar concept from all concepts that came previously. By definition, global similarity will always be equal to or greater than leap similarity.
Concept clustering
Concepts were grouped into clusters based upon their vectors. The optimal number of clusters was determined using K-means clustering and the silhouette method for establishing optimal K (max. 50). A critique of the work of Reference Kelly, Greentree, Sosa, Evans and GeroKelly et al. (2024) is that they treat concepts that are similar as entirely different entities. The motivation for clustering is to have graphs represent movement between regions in conceptual space. Word vector space is taken as a proxy for conceptual space, following the work of Reference GardenforsGärdenfors (2004) and others. Figure 4 shows an example of the clusters produced from a set of concepts for one participant, using t-SNE dimensional reduction to permit graphing of a high dimension space in two dimensions (axes have meaningless labels for this reason).
Clustering of concepts for a participant in the bike problem results in identification of regions of conceptual space. Here, clusters have been given names by ChatGPT and high dimensional word vector space has been projected onto two dimensions using t-distributed Stochastic Neighbour Embedding (t-SNE)

2.4. Network measures
The concepts detected within a protocol were then used to construct a graph. Each region of conceptual space, which contains a cluster of concepts used by the designer, becomes a node/vertex within the graph. Each time a concept is found within the transcript, a directed edge RA →RB is drawn between the region R containing concept A and that containing concept B. The resulting directed graph G = (V,E) represents the design protocol as a sequence of conceptual regions (vertices) V and the connections between them (edges) E. Some edges are self-connecting for multiple sequential concepts within the same region.
Within the resulting graph a range of network measures were utilised, specifically: numbers of nodes and edges, degree, connectivity, longest-shortest path, and clustering (Reference Wasserman and FaustWasserman, 1994).
3. Results
This section includes two sets of results. The method described here permits standardised, quantitative comparison of designers within a single problem. This approach enables inferences to be made about the different cognitive styles of individual designers across problems. We will refer to this as the cognitive style of the designer, following Herb Simon, who noted that “those differences among designs that we call ‘style’ arise from a variety of sources, and that the design process is one of the most important of these” (Reference Simon and EastmanSimon, 1975, p. 10). For example, it provides a basis for making claims about the transfer of framing style for a designer across different design problems, which would have significance for design education. It also permits comparison of cognitive style between designers within each problem, to establish a range of different approaches to the same problem. It is claimed that the proposed method is less resource intensive than either framing analysis or linkography and permits novel kinds of analysis. This results set is intended to demonstrate the utility of this novel method.
3.1. Comparing designers across both problems
For comparing designers’ response to each problem, the concepts from all 17 designers were pooled prior to clustering. The clusters that emerged through K-means clustering (e.g., Figure 4) were treated as regions of conceptual space; all concepts within a region are assumed to have a meaningful semantic relationship, based on cosine similarity, and the graph that is created represents movement between these regions of conceptual space. This is a form of hierarchical clustering, with clusters as an abstraction from the concepts within them. It prevents similar concepts (e.g., ‘wheel’ and ‘bike wheel’) from being treated as distinct entities when graphing: it is desirable that the structure of the graph represent movement through conceptual space, revealing revisitation of past spaces (like a Linkograph) rather having each distinct concept be treated as a node (a limitation in the work of (Reference Kelly, Greentree, Sosa, Evans and GeroKelly et al., 2024)).
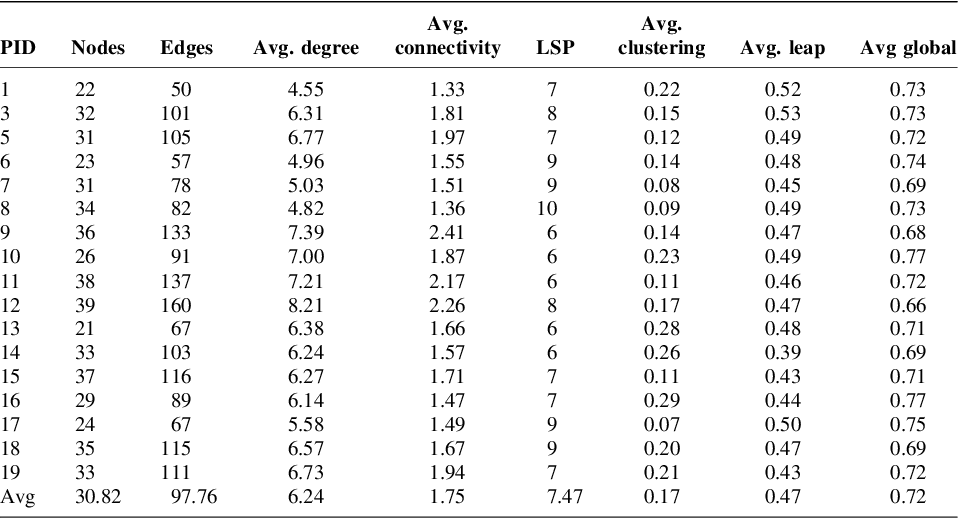
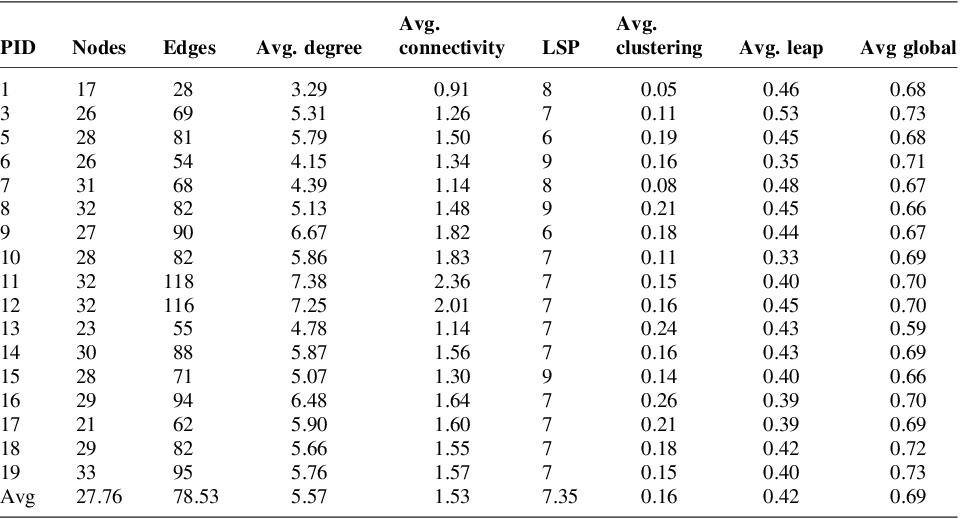
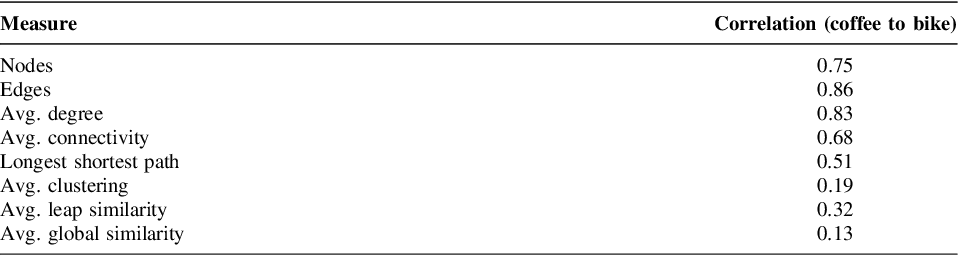
This technique permitted a comparison of the way that each designer navigated through the same regions of design space, after partitioning it into these emergent conceptual regions. Tables 1 and 2 show participants’ eight network metrics ordered by participant number. Three measures that we considered as interesting for revealing design process styles are average clustering, average leap similarity and average global cosine similarity.
Each node in a graph has a clustering coefficient, the number of connected triads of possible connected triads. Average clustering is the average of these values for all nodes. We suggest that high average clustering might indicate a style for moving frequently between clusters; perhaps trying on new ideas in rapid succession. The correlations in Table 3 show that clustering changed between the two problems (i.e., was not consistent for each designer).
Average leap similarity is an indicator of how semantically distant a designer tends to move in relation to each prior concept. Average global similarity is a measure of how semantically distant each new concept is in relation to all that came before it. In neither case was there a strong correlation for the same designer across problems.
Network measures for comparing participants in the bicycle problem in the same design space. Participant ID, number of nodes, number of edges, avg. degree, avg. connectivity, longest shortest path, avg. clustering, avg leap (avg. cosine similarity between sequential concepts), avg. global (avg. cosine similarity between concept and most similar prior concept)

Network measures for comparing participants in the coffee cup problem in the same design space. Participant ID, number of nodes, number of edges, avg. degree, avg. connectivity, longest shortest path, avg. clustering, avg leap (avg. cosine similarity between sequential concepts), avg. global (avg. cosine similarity between concept and most similar prior concept)

Network measures that are closely related to the total number of concepts (nodes, edges, degree) were highly correlated across problems. This indicates that participants are using a similar number of concepts in each problem, i.e., closely related to them talking at a similar rate in each problem.
Connectivity, a function of how many nodes must be removed from a network to disconnect it, correlates significantly (p<0.005) between the two problems. This indicates that the robustness of the graphs (is similar across the two problems. Degree, the ratio of nodes to edges, correlates significantly with connectivity in both directions: bike degree to coffee connectivity (0.721) and coffee degree to bike connectivity (0.710). It is possible that this result of connectivity being correlated is a function of similar numbers of nodes and edges across problems.
Correlations between each network measures across the two design problems (coffee to bike) for all 17 participants

These measures make it possible to delineate empirically between different designers addressing the same problem in a standardised way; with the recognition that exactly what is being delineated as a construct has yet to be established.
3.2. Selecting designers for further analysis
We ranked designers by average global similarity across the two problems. This measure involved noting the global similarity for each concept when it occurred within the transcript and then computing the average and then ranking designers for each problem. This permitted us to select the designer with the ‘highest novelty in leaps’ across both problems (lowest average global cosine similarity, a proxy for most novelty in conceptual leaps) as participant P9; and the designer with the ‘lowest novelty in leaps’ (i.e., highest average global cosine similarity) as participant P3. The hypothesis is that this measure can reveal differences in cognitive styles of these designer.
The method permits analysis of how an individual designer’s process develops over time. Figures 5 and 6 show graphs of changing similarity measures for participant P9. The two measurements of leap similarity and global similarity change over time and can be used to identify two phenomena.
Firstly, divergence between global and leap cosine similarity is indicated by a gap in the two lines, such as at concept 94 in Figure 5 or 106 in Figure 6. These points of divergence occur when the global similarity is high and the leap similarity is low indicating that the designer is revisiting an old concept (high global) but has arrived here from a distant part of conceptual space (low leap). Such moments can then be associated with the moments in the transcript for analysing design framing phenomena; in the latter case the designer has returned to consideration of the ‘user’ after a passage of design considering how hooks and padding on the bike rack might be structured.
Global and immediate cosine similarity measures over time for participant P9 in the coffee problem (x-axis is enumeration of concepts in order of occurrence)

Global and immediate cosine similarity measures over time for participant P9 in the bike problem (x-axis is enumeration of concepts in order of occurrence)

These results can be compared across different designers. Figures 7 and 8 are graphs for P3 who, as seen in Tables 1 and 2, had higher average global cosine similarity (more similar concepts with each move, in general) when compared to P9. In these graphs over time we can observe that global similarity for P9 (Figures 5 & 6) regularly goes below 0.5 throughout the design process for both problems (30 and 35 times respectively). In contrast, P3 (Figure 7 & 8) rarely has global similarity drop below 0.5 for either problem (12 and 16 times respectively). These graphs show time-based details, such as the rhythms with which more novel concepts occur: spikes of low global similarity, particularly those occurring later within the design activity. Figure 9 shows the networks for the two designers for the coffee problem graphed in the same 2D vector space with the same conceptual regions. P3 visits fewer regions.
Global and immediate cosine similarity measures over time for participant P3 in the coffee problem (x-axis is enumeration of concepts in order of occurrence)

Global and immediate cosine similarity measures over time for participant P3 in the bike problem (x-axis is enumeration of concepts in order of occurrence)

Comparison of network graphs for P9 and P3. Labels indicate nodes and positions of conceptual regions are consistent across the two graphs (within 2D vector space)

The method provides an output of a table of concepts in the order that they appear, with similarity measures at each step. This permits precise identification of phenomena (using empirical measures) to be associated with qualitative analysis (within tables of concepts), with reference to the original transcript available where required.
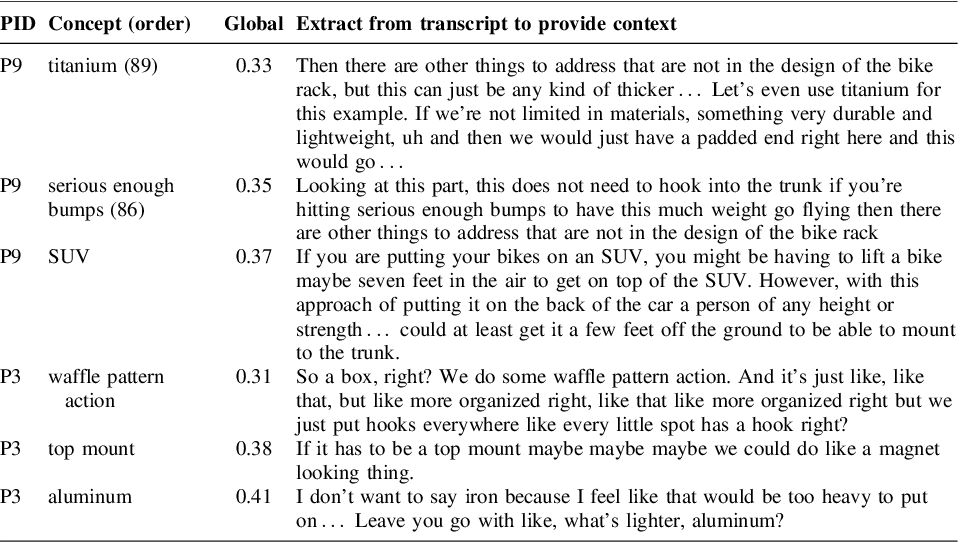
To demonstrate this utility of the method we developed a way of identifying significant design framing phenomena by finding concepts that have: (1) the lowest global cosine similarity values (as proxy for most novel); where those global minima (2) occur after the first 10 concepts, because global similarity becomes more interesting after the initial passage of design (during which it follows leap similarity); and (3) that were on task for design rather than dialogue about the experiment (e.g., “where is the eraser?”), as dialogue about the experiment was coded as quite novel perhaps as it was related to a different goal. The results for the top three concepts for each designer in the bike rack problem are shown in Table 4 along with the relevant passage of design. In each case we propose that these are interesting framing phenomena, bringing into the design structural considerations (e.g., the new material of titanium or the new structural relationship of a waffle pattern), behavioral considerations (e.g., bumps affecting performance of design) and functional considerations (e.g., the need for the rack to work on an SUV as well as a car).
Specific concepts as identified through global similarity with extracts from the transcript

4. Discussion and conclusion
This paper has demonstrated novel ways to use network and cosine similarity measures for analysing design protocols. The method appears to have utility for studying design framing, though this utility has only been demonstrated in a limited way with 17 participants addressing two problems (network measures) and two of those participants (more detailed analysis).
The first significant idea within the paper is that clustering concepts into regions, based on semantic similarity, prior to graphing, gives the resulting graph a structure that is more significant for investigating cognitive behaviours of designers, such as framing. In this way it implements past ideas for investigating design framing phenomena (Reference GardenforsGardenfors, 2004; Reference Kelly and GeroKelly & Gero, 2015) and addresses limitations in recent work (Reference Kelly, Greentree, Sosa, Evans and GeroKelly et al., 2024). It introduces a novel approach for visualising and measuring aspects of framing: the way that designers bring together a conceptual assemblage in response to a problem and shift it through design activity (Reference Kelly and GeroKelly & Gero, 2022).
The second is that partitioning a semantic space into conceptual regions, and then graphing the design process for multiple designers on that partitioned space, provides a new way of meaningfully comparing cognitive design styles. This idea has only been demonstrated here as more theorising and experimentation is required to determine the meaning and reliability of these measures.
The third significant idea is that producing tables for sequential conceptual development within a problem with associated measures can be of use in identifying where within a protocol transcript significant design framing phenomena are occurring. It has developed two heuristics that are shown to be useful for identifying such phenomena. These are that gaps between local and global similarity indicate revisiting old concepts, and that certain global similarity measures indicate significant new ideas. These proposed measures require further investigation for understanding their validity.
The fourth is that this entire process was automated using an LLM making it possibly to rapidly analyse hundreds or thousands of design protocols in this way. Our future work will look at the design of experiments that can use such automated analysis to look for convergence of findings across many different protocol studies using a dataset that we have begun to assemble. The focus of the work remains on understanding how designers develop and change their framing for a design problem.
Acknowledgments
This work is supported in part by a grant to J.S.G. from the NSF grant no. DRL-2100138. N.K. gratefully acknowledges the roles of Jess Greentree, Ricardo Sosa, and Richard Evans for their contributions to the work underpinning the methods described in this paper.


 Open access