

“Clean air for sale in China” was the title of one of many recent news articles describing a double-digit growth in the sale of air purifiers in China.Footnote 1 The market for devices that help keep indoor air clean by filtrating outdoor air before it enters the dwelling has sky rocketed since 2013 along with increasing use of face masks – now even available in fashionable patterns – meant to protect people from breathing polluted air.Footnote 2 A growing number of private schools in Beijing erect fabric domes over their campuses to provide clean air for students, and companies in the capital report that executive hiring has become more difficult due to poor air quality.Footnote 3 The boom in the market for air filtrating devices coincides with intensified media attention on air pollution that again suggests that a rapidly increasing number of Chinese citizens perceive pollution as an important health risk to themselves and their children. At the same time, we are seeing unprecedented attempts by the Chinese government to tackle the growing problem of air pollution without compromising continued economic growth.
The articles in this special section grow out of an interdisciplinary research project in which scholars from the humanities, social sciences and natural sciences together study how government, scientists, media, industry and the population of China try to make sense of and deal with the increased sense of risk related to the impact of air pollution on health, climate, economy and political stability.Footnote 4 To what extent is a general rise of concern for air pollution justified by the actual pollution levels seen in major Chinese cities in recent years? What is happening on the ground, where people have to live with new knowledge of what air pollution does to their health? Do we really see a rising environmental consciousness in China, and if so, what does that mean and how is it expressed? Based on the analysis of new empirical data, each of the articles in this issue offers at least partial answers to one or several of these questions. Common to all the articles is the interest in understanding if, how and to what extent political authorities, media, the general population and polluting enterprises in China interact in the face of the acknowledged risks that air pollution poses to the local environment, China's economic development and, not least, individual health and well-being.
The point of departure for Anna L. Ahlers and Yongdong Shen is the theory of authoritarian environmentalism and its application to the China case.Footnote 5 The existing literature argues that while the central government is able to effectively and rapidly introduce new environmental policies, the implementation of these is often hampered, even sabotaged, at the local level. In their in-depth analysis of how China's new air policies are translated into government initiatives at the local level in Hangzhou city, Ahlers and Shen show that local authorities in fact do work to implement air pollution regulation measures. The authors discuss under which conditions the local state engages in experiments with both coercive decision-making processes and with different forms of public inclusion. This analysis of local authoritarian environmentalism sets the political frame for the further exploration of interfaces of government, media and population, and of dominant discourse and popular practices related to air pollution, discussed in the other articles of the section.
Thus, the article by Hongtao Li and Rune Svarverud analyses the ways in which the Chinese media have sought to frame the issue of air pollution in a politically acceptable, though far from uncritical way.Footnote 6 In a historically grounded study, the authors show how the media have effectively used the famous “London Smog” to paint a picture of the Chinese present set against the backdrop of a foreign past. The unprecedented media interest in air pollution since 2012 has reached into all corners of the country, and people's concern with the health impact of industrial air pollution has to an increasing extent found support in these reports, as well as in new air pollution policies. Based on a combination of ethnographic fieldwork and household surveys, two articles in this special section discuss in more detail how residents in urban and rural China have come to understand and respond to these perceived risks of air pollution. In a survey among urban residents in one of China's notoriously polluted cities, Tangshan in Hebei province, Xiaoyue Li and Bryan TiltFootnote 7 found that middle-class citizens expressed a holistic view of what a good life implied, and they persistently ranked “environmental quality,” as linked to their own and their children's health, higher than job and income. Even the majority of the much less affluent rural residents in the study by Mette Halskov Hansen and Zhaohui Liu reported that they found environmental protection to be more important than economic development.Footnote 8 Villagers had been protesting for years against local sources of air pollution, but unlike their urban fellow citizens they had no access to scientific data about the actual air quality in their community. Nevertheless, protests were justified by the political imaginary of Ecological Civilization that aims at a heightened environmental consciousness of the whole population while stressing “harmony” and “social stability.”
One of the questions that frequently turned up during the ethnographic data collection leading to this section's articles was simply what we, as scholars, actually know about the air quality and its human impact in different areas of China, and whether or not things are improving. As a context for these articles, and a background for anybody interested in the social and political aspects of air pollution in China, we therefore aim in the following to review existing scientific data on air pollution in China in an attempt to summarize what the situation is, has been, as well as what the future may hold. We examine how the air quality in China compares with other countries, and probe into parameters that define the air pollution challenge in China, from emissions and concentration levels and further on to their impacts on human health. We also challenge the perception that air pollution is something that affects everybody equally. Clean air from Canada and Norway is now literally for sale in China,Footnote 9 but, more importantly, there are a number of socio-economic factors that affect an individual's exposure to air pollution and thereby modify the health risk. One of the more significant examples of structural differences between rural and urban, and between poorer and richer population groups, concerns the exposure to air pollution from the use of wood and coal in residential cooking and heating stoves which may be present in addition to other forms of ambient air pollution. This topic is taken up in the article by Hansen and Liu who found that villagers were not at all concerned with the possible impact of this kind of household-produced air pollution, although they were protesting vehemently against air pollution from local industry. Keeping in mind that “the dose is the demon,”Footnote 10 we discuss in what follows how different sources of population exposure have changed in China's recent history.
“Chinese Haze”: The Worst of Both Worlds?
Historically, recurring episodes of extremely severe air pollution within one location have led to special terminology of the phenomenon. The “London fog” or “London pea-souper” thus denoted the thick layer of air pollution that covered London repeatedly during winter months in the 19th and early 20th centuries, culminating with the London smog disaster in 1952 that caused between 4,000 and 12,000 deaths.Footnote 11 In textbooks this is often referred to as “London-type smog” or “classical smog.” It is characterized by a high content of sulphur oxides, carbon monoxide (CO) and soot particles, and is caused by the use of fossil fuels with a high sulphur content, the most important being coal. In London, the air pollution became particularly bad due to the widespread use of bituminous coal for heating in combination with a humid climate and stagnant winter weather conditions. As discussed in the article by Li and Svarverud, the London smog was introduced in Chinese media already in the 1870s. Interestingly, nearly 150 years later, in the 2010s, it came to play a renewed role in Chinese media's construction of a historical analogy suggesting that a world famous foreign city in the past had been just as bad – or worse – off than Chinese cities in the present.
Another main smog archetype is the “Los Angeles-type smog,” or “photochemical smog.” PhotochemicalFootnote 12 smog, first brought to the world's attention in the 1940s based on episodes in Los Angeles, requires neither smoke nor fog and typically occurs during summer in urban areas where a large number of cars are emitting nitrogen oxides and hydrocarbon vapours. Ozone, a highly reactive oxidant that adversely affects the respiratory system, is a key component of photochemical smog. Both the London and the Los Angeles types of smog reduce visibility, the former usually much more than the latter.Footnote 13 Beyond these two archetypes, a range of other mixtures and characteristics of air pollution may occur, depending on emission sources and physio-chemical conditions.
In China, polluting industries, an energy sector dominated by coal, rapidly increasing motorization, in combination with a continued use of wood and coal in simple stoves in hundreds of millions of homes along with open burning of crop wastes in agricultural fields, have contributed to a complex air pollution situation.Footnote 14 Depending on season and climate, some regions are experiencing both “classical” and “photochemical” smog, in addition to other types of anthropogenic and natural air pollution phenomena such as smoke from biomass burning and desert dust.Footnote 15 For instance, Shijiazhuang, the capital of Hebei province, had the highest or close to the highest annual mean readings for all air pollutants monitored in the national air pollution monitoring programme in 2013, including fine particulate matter (PM2.5), sulphur dioxide (SO2), nitrogen dioxide (NO2), and surface ozone (O3). The region-wide haze blanketing Shijiazhuang and many other cities as well as rural areas in China has in recent years been commonly referred to as haze (mai 霾) or smog (wumai 雾霾).Footnote 16
Haze is by definition a phenomenon that entails low atmospheric visibility and is mainly caused by the fine fraction of particles, which contribute to light extinction through scattering or absorption of visible light.Footnote 17 Thus, the sharp reduction in visibility observed in many megacities in China bears witness to the increased loading of fine fraction particles, often measured as PM2.5, in ambient air.Footnote 18 As we discuss below, this is the air pollution component thought to be most closely linked to severe health damage, including premature death. As a pollution phenomenon, “haze” is not an unambiguous term, however, and studies attempting to describe the sources and physio-chemical nature of haze episodes in Chinese cities show a varying picture depending on place and time.
Regarding the relative contribution of various source categories to urban PM2.5 pollution, traffic currently plays a smaller role in China than in the US, Western Europe and Japan, with an estimated 15–18 per cent of pollution in China resulting from traffic versus 21–35 per cent in the US, Western Europe, and Japan (a lower figure, 19 per cent, was estimated for Central and Eastern Europe). Industry, on the other hand, generally plays a larger role in China, constituting 16–27 per cent of the PM2.5 pollution versus 9–13 per cent in the US and Western Europe (higher figures were estimated for Central and Eastern Europe (17 per cent) and Japan (34 per cent).Footnote 19 Regarding the chemical composition, the air pollution mixture in China is richer in sulphur oxides and nitrogen oxides compared to the typical air pollution in developed countries, as these gases have not been abated to the same extent.Footnote 20 Soot, often measured as black carbon and a component in the PM2.5 size range, is also more prominent in the air pollution mixture in many parts of China as compared to, for instance, the US and Western Europe.Footnote 21 The reason is a combination of household air pollution caused by the use of biomass and coal for cooking and heating, and older technology used in some industries.
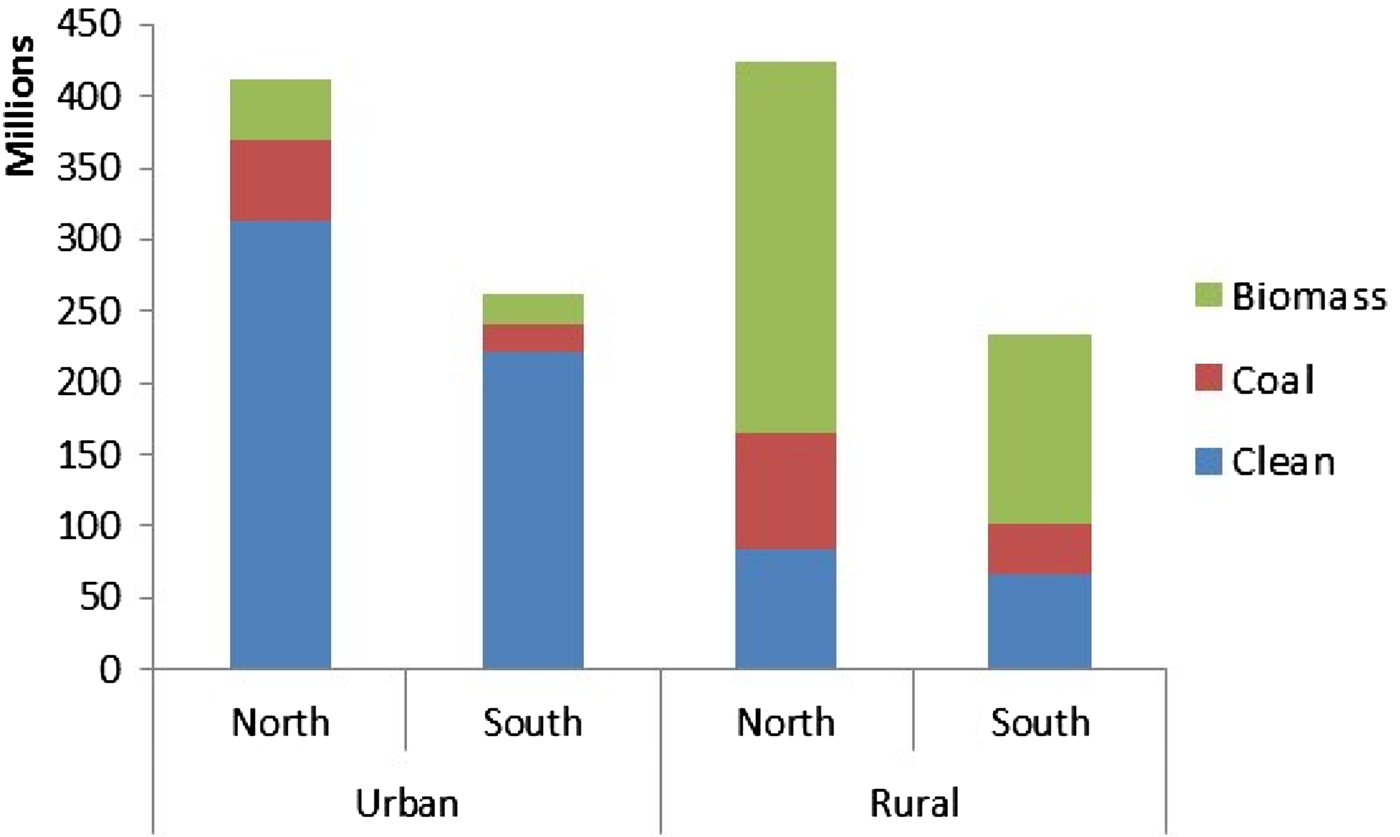
According to Chinese census data, nearly half of households primarily used solid fuels for cooking in 2010, and four out of five of these households were in rural areas (Figure 1).Footnote 22 Burning of wood, crop residues and coal in simple household stoves leads to the incomplete combustion of the fuel, meaning less heat is produced per kilogram of fuel used. Instead of producing heat (and CO2, the main product of complete combustion), some of the fuel carbon is converted to particles, carbon monoxide, and a range of toxic organic components.Footnote 23 Approximate 0.6 billion people are using solid fuels on a regular basis in their homes, thereby contributing an estimated 38 per cent of primary PM2.5 emissions in 2010, on par with the emissions from industry (41 per cent).Footnote 24 Estimates of the contribution from household stoves to average population-weighted exposure to ambient PM2.5 in China are in the range 10–20 per cent.Footnote 25
Main Household Cooking Fuels in the Chinese Population in 2010 (Million People)
The largest exposures to air pollution from cooking and heating with solid fuels are, however, not related to their contribution to ambient air pollution but rather to indoor pollution (denoted household air pollution, or HAP, by the World Health Organization [WHO]). This is due to the fact that most people spend many hours indoors in their home, and that burning of solid fuels in traditional stoves leads to high PM concentrations close to peoples’ breathing zone. Thus, the fraction of the total emitted particles that ends up being inhaled is much higher for this pollution source compared to emissions from high smoke stacks.
As discussed below, estimates of population-weighted exposure to ambient air pollution in China are becoming increasingly more robust due to the rapidly expanding urban PM2.5 monitoring network and the opportunity to use satellite data. The situation regarding exposure to HAP is different. Due to the lack of air quality monitoring in rural areas in China and the intrinsically larger difficulties in obtaining data on indoor pollution, the basis for estimating exposure for population groups dependent on solid household fuels is limited. In a global review of the evidence related to PM2.5 exposure from HAP, the pooled mean exposure was about 270 µg/m3 for women and about 220 µg/m3 for children (there were few studies on male exposure to HAP).Footnote 26 Studies in China and elsewhere indicate that biomass users generally have a higher exposure to PM2.5 than coal users.Footnote 27 On the other hand, high cancer rates have been linked to the use of “smoky coal” in Chinese villages.Footnote 28 Available data from China indicate that annual average exposure to PM2.5 among solid fuel-using populations is in the range of 100–400 µg/m3.Footnote 29 That is on par with, or considerably higher than, the annual mean level in the most polluted Chinese cities, something which is, however, rarely discussed in Chinese media and policy documents.
The use of household stoves seems to be rapidly decreasing in China as more and more people have access to, and can afford, cleaner fuels such as gas and electricity. Whereas certain policies have been implemented to promote a switch in household fuel use, such as banning the use of household coal in cities and subsidy programmes for biogas digesters in rural areas, urbanization in general, and massive rural–urban migration in particular, are likely the most important reasons for the fuel transition.Footnote 30 Therefore, poor urban residents without access to clean household fuels are now most likely the worst off in terms of air pollution exposure, being subject both to HAP and polluted urban air. Also, a recent study found that rural residents living close to polluted cities in fact were also more likely to suffer the detrimental impacts of smog episodes.Footnote 31
Exposure to particulate pollution has been linked to many diseases, including cardiovascular and respiratory diseases, diabetes, and neurodevelopment and cognitive impairment.Footnote 32 According to estimates for China, there were about 1.5 million premature deaths attributable to PM2.5 exposure in 2015, of which about 60 per cent were due to ambient PM2.5 pollution and about 40 per cent to HAP.Footnote 33 Thus, while contributing a limited share of the emissions of PM2.5 and its precursors, the burning of biomass and coal in household stoves contributes disproportionately to health damage due to the high exposures among certain population groups. An additional 0.07 million deaths were attributed to ambient ozone exposure. Air pollution-related deaths in total constituted 17 per cent of total annual deaths in 2015, among the highest in the world. In China, as in nearly all countries in the world, the rate of annual deaths attributable to HAP has been decreasing. The rate of deaths attributable to air pollution in total in 2015 (i.e. including ambient PM2.5, ozone and HAP) is estimated at about 115 deaths per 100,000 people. For comparison, the estimated figure for India was 138 deaths per 100,000 people, 49 in Japan, 43 in Western Europe and 31 in the US.Footnote 34
Comparison across Space and Time
Even though there are some differences in sources and composition of air pollution in China and developed countries, the largest difference is probably the mere concentration levels of pollutants, especially of particulate pollution. In most developed countries, the annual mean population-weighted exposure to PM2.5 has steadily decreased. In the US, Western Europe and Japan, for instance, it is now estimated to be below approximately 15 µg/m3 as an average, and reaching up to 40 µg/m3 only in very limited regions, for example, in Eastern European countries such as Poland, Romania, and Bulgaria, and in northern Italy.Footnote 35 For China as a whole, the corresponding figure is around 55–60 µg/m3 PM2.5, and in some regions of Eastern China it exceeds 100 µg/m3, i.e. the exposure is 2–7 times the levels observed in developed countries.Footnote 36 During the most severe haze episodes, PM2.5 concentrations may be one or two orders of magnitude higher than urban levels in the US and Western Europe.Footnote 37 This renders China among the top most polluted countries, above, for instance, Saudi Arabia, India, Pakistan and Nepal.
How then do the current air pollution concentrations in China compare with the “London smog” of 1952 and the “Los Angeles smog” in the 1960s? Comparisons are difficult to make due to discrepancies in measurement techniques and, for particulate matter, the components measured. However, rough comparisons suggest that the pollution levels even in the most polluted Chinese cities today seldom exceed the historical episodes as we know them. For instance, based on monitoring data for London for December 1952 (and the “normal” situation in 1951),Footnote 38 it seems clear that SO2 concentrations in London at the time were considerably higher than in today's most polluted Chinese cities. The daily mean SO2 level averaged for all 12 monitoring stations in London in December 1952 reached nearly 2000 µg/m3 on the worst days (one station in Central London reached a daily mean of nearly 4000 µg/m3), and the monthly mean in December 1951 (a “normal” year) was about 650 µg/m3. Such high values have not been recorded even during haze episodes in the most polluted cities in China currently. For instance, the highest daily mean SO2 level in Shijiazhuang in the severe haze episode in January 2013 was 557 µg/m3 (more recent haze episodes had much lower levels), and the monthly mean was 268 µg/m3.Footnote 39
Regarding particulate pollution, a comparison between London and Chinese cities is more complicated as PM in London was measured as black smoke (BS) at that time. The relationship between BS and PM10 (and PM2.5) may vary extensively with place and time (including season) and a conversion between the two is not recommended unless a validation study is available at a comparable site using comparable methods. To our knowledge, such validation is not available for London at this time. If we assume that the PM10/BS-ratio is between 0.6–1.26,Footnote 40 this implies that the daily mean PM10 level averaged for all 12 monitoring stations in London in December 1952 reached 1000–2000 µg/m3 on the worst days (and between 2700–5700 µg/m3 in Central London). The annual mean in Greater London 1952 was 270 µg/m3 for BS, i.e. a PM10 concentration of 160–340 µg/m3.Footnote 41 In comparison, in Shijiazhuang, the highest daily mean PM10 concentration recorded during January 2013 was 1222 µg/m3, whereas the annual mean PM10 was 305 µg/m3 in 2013. In other words, the annual average levels of particulate pollution in China's most polluted cities may be on par with London in the early 1950s, and the peak values in recent episodes, while generally being lower, may possibly have touched the levels of the December 1952 “London smog.” Regarding the “Los Angeles smog,” the ozone (O3) levels in Los Angeles were far above what is currently reported in China. For instance, hourly peak levels of nearly 1400 µg/m3 O3 were measured when the “Los Angeles smog” was at its worst, and 20–40 per cent of the days in the larger Los Angeles region had hourly maximum levels above 1000 µg/m3 during the period 1956–1972.Footnote 42 The mean value during summer (when O3 levels are the highest) was about 140 µg/m3. As a comparison, in Shanghai, Beijing, Shijiazhuang, and Guangzhou during 2013–2015 the maximum hourly level recorded was below around 360 µg/m3, and the highest mean value during summer (June to August) was 98 µg/m3 (recorded in Beijing in 2015).
Emissions of air pollutants in China primarily affect the country itself. However, long-range transport of polluted air masses also causes air pollution to increase in neighbouring countries. In Japan, it has been estimated that emissions in China contribute up to 50 per cent of the annual mean PM2.5 concentration in western parts of the country.Footnote 43 Regarding surface ozone, the contribution from China was found to be up to 15 per cent during pollution episodes in Tokyo, on the eastern coast of the country.Footnote 44 Similarly, China is shown to be a major source region affecting pollution levels in Korea.Footnote 45 Trans-Pacific transport of air pollution from China to the western coast of the US has long been recognized as a salient political issue, as it may contribute to violation of health-based US air quality standards in a situation where the US's own emissions are subject to continuously stricter regulations.Footnote 46 However, one reason for the differing levels of air pollution between China and Western countries is the outsourcing of manufacturing industries that has taken place as pollution policies were tightened in Europe and the US mainly since the 1970s.Footnote 47 For instance, during the period 1997–2010 it was estimated that the export of goods was the only final-demand category that drove the growth in emission of primary PM2.5 in China. The export-linked emission growth over the period corresponded to half the total emission in EU-27 countries in 2010.Footnote 48
Geographical Variations and National Trends
While China is home to some of the most polluted cities on earth, there are substantial differences across the country, due to varying emission intensity, meteorological conditions, and the impact of dust storms. The highest pollution levels and occurrence of haze episodes, i.e. episodes with high concentrations of PM2.5 and low visibility, are seen in the densely populated city cluster of the Beijing–Tianjin–Hebei region, the Sichuan basin, the Yangtze River Delta and, to a lesser extent, the Pearl River Delta. Generally, the urban air quality is worse in the north as compared with the south, and worse in the inland regions than in the coastal regions (Figure 2). There is considerable seasonal variation in PM2.5 levels, with levels being higher in winter and lower in summer.Footnote 49 While smog in the capital tends to receive a good deal of media attention in China and beyond, most of the top-ranking polluted cities are in its neighbouring provinces, Hebei and Shandong.Footnote 50 Li and Tilt (this issue), in their study of citizens’ views on air pollution in one of China's most polluted cities, Tangshan, within one of China's most polluted provinces, quote a popular Chinese saying: “If you want to see China's smog, look to Hebei; if you want to see Hebei's smog, look to Tangshan.” Other megacities such as Shanghai and Guangzhou to the south have considerably lower annual mean PM2.5 levels than the worst cities in the north (in 2015, around 50 µg/m3 and 40 µg/m3, respectively, i.e. still above the Chinese air quality standard of 35 µg/m3).
Annual Average PM2.5 Concentrations in China in 2015

How can we, then, summarize the general trends in Chinese cities when it comes to particulate air pollution? This is not as straightforward to determine as one might think. Only in recent years has the monitoring network established its current broad coverage. Furthermore, the metric for measuring PM has changed over time (from TSP (Total Suspended Particulates) to PM10 (see Figure 3) and only since 2013 is PM2.5 monitored on a regular basis and mainly in urban districts. Relying on monitoring data, studies indicate that urban levels of PM10 were reduced substantially in the period from around 2000 to 2012 in the north, while there was a small increase in the south during the same period.Footnote 51 Generally, PM2.5 concentrations have not been decreasing at the same pace as the coarser PM10, and may even have been increasing along with reduced PM10 levels in some areas. Also, secondary particles (which are mainly in the PM2.5 fraction) seem to be playing an increasingly more important role.Footnote 52 These features are linked to the fact that technologies that reduce emissions of primary particles have become more common in power plants and industries in China, whereas technologies and policies to reduce particle precursor gases (SO2, NOx, NH3, and VOCs (Volatile Organic Compounds) have not yet reached the same coverage. A study using satellite data confirms the main pattern of hot spots for PM2.5 pollution and quantifies changes over the period 2004–2013, showing, for instance, that Hebei province was most affected. For the entire country and period, the study found a small increase in PM2.5 levels, resulting from a rise in the first years (2004–2007) followed by a smaller reduction in the period 2008–2013.Footnote 53 It is important, however, to note that whereas a continued reduction in annual average levels was observed also in the period 2013–2015, several extreme smog episodes continued to occur. Moreover, according to the most recent data from the urban monitoring network, the PM2.5 levels in cities in central and western China – the regions that are seeing the highest rates of industrial growth – appear to be increasing along with the decline in northern and eastern parts of the country.Footnote 54 Meteorological conditions may also have played a role in the increase in haze episodes since the 2010s. Typically, low wind speed and high relative humidity are “smog-prone” conditions. In eastern China, both wind speeds and precipitation have shown an overall decline, thus the area is now more prone to smog than it used to be.Footnote 55 In 2015, low wind speeds and high relative humidity probably also contributed to the bad air quality in Beijing in the last two months that led to the capital's first-ever red alert for air pollution, prompting schools and factories to close and restrictions on vehicle use to be put in place.
Main Terms Used to Describe Particulate Air Pollution
Regarding photochemical pollution, the long-term trend shows that surface ozone has been increasing substantially during 2003–2015 in China along with growing emissions of its two main precursor gases, NOx and VOC.Footnote 56 Some authors, in fact, now warn that the efforts to reduce PM2.5 may aggravate the ozone problem if the reductions in the precursor gases NOx and VOCs are not carefully balanced.Footnote 57 This raises the complicated issue of which abatement measures to apply where and when, and we discuss this briefly in the following section focusing on examples of how scientists have been involved in developing both short- and long-term attempts to control air pollution.
Short-term Interventions vs Long-term Abatement
In many Chinese cities, for instance Beijing and Shanghai, local emission reductions will have only a limited impact on local air quality, as there is large regional and interprovincial transport of polluted air masses.Footnote 58 The importance of interprovincial transport has been clearly demonstrated in the Beijing region in recent years when great efforts were put into clearing the sky for a short period of time during large public and international events. Good examples are the Olympic Games in 2008, the APEC (Asia–Pacific Economic Cooperation) summit in 2014, and the Second World War 70th-anniversary Military Parade in September 2015. For the latter event, for instance, temporary control was implemented in power plants, on construction sites, and in more than 10,000 factories, not only in Beijing but in six neighbouring provinces as well.Footnote 59 New popular terms like “APEC blue” and “military parade blue” testified to the successes of these cross-province actions.
While these short-term abatement measures may be drastic and unsustainable they are specifically implemented to cope with air pollution during events that enjoy a high political prestige, most recently the G20 in September 2016 in Hangzhou city. However, a range of long-term overarching national air pollution policies have been decided upon and local governments now have to deal with the complexities of implementing them, as discussed in detail in the article by Ahlers and Shen (this issue). The establishment of mandatory targets for emission control in the 11th Five-Year Plan (FYP) (2006–2010) was a turning point and proved effective for reducing SO2, the first air pollutant subject to a mandatory target. The 10 per cent reduction target for SO2 emissions was achieved with wide margins and was followed up in the 12th FYP (2011–2015), which set an 8 per cent mandatory target for SO2 and also included a 10 per cent mandatory target for NOx. As seen in Figure 4, SO2 emissions were reduced during the 11th FYP period,Footnote 60 whereas some other components of importance for PM2.5 pollution continued to grow.
Annual Emissions (in Mt) of Primary PM2.5 and Main PM2.5 Precursors in China (2000, 2005, 2010, 2013)
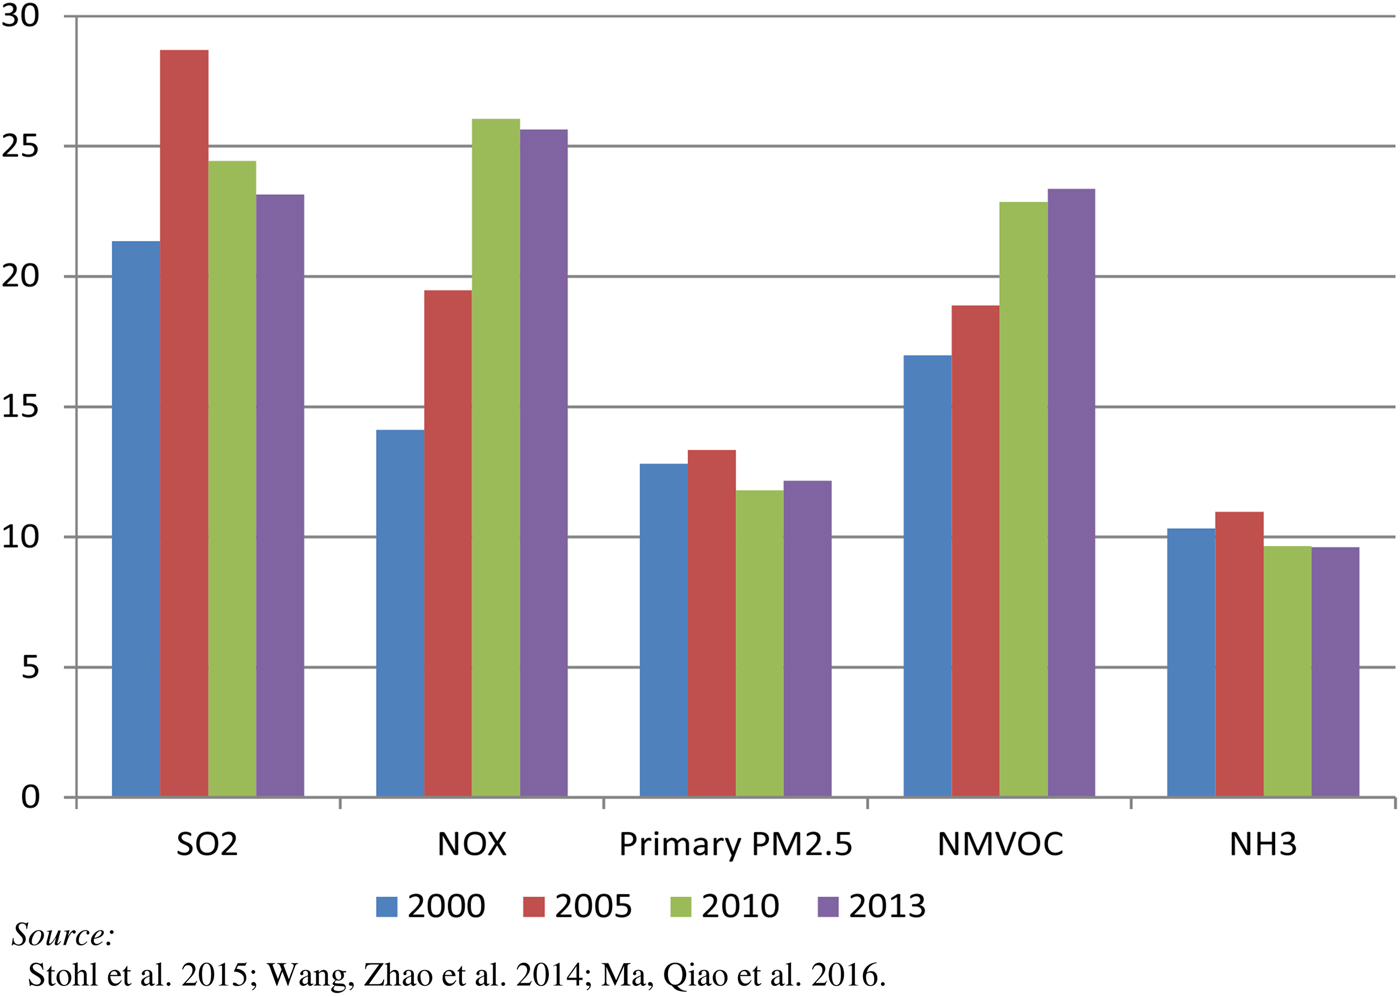
Recent research has shown that in addition to fossil fuels and biomass, ammonia (NH3) from livestock farming and nitrogen fertilizer application (the two dominate sources of ammonia) may also play an important role in creating particulate pollution in China. Therefore, to address the complexity of air pollution formation, a multi-pollutant abatement plan aiming at reducing emissions of all main air pollutants, i.e. primary PM, SO2, NOx, NH3, and VOC, was issued by the Chinese government in 2013 as shown in The Air Pollution Prevention and Control Plan. Footnote 61 Ambitious targets were set for the most polluted regions for the period 2012–2017 with a 25 per cent, 20 per cent, and 15 per cent reduction in the PM2.5 concentrations in the Beijing–Tianjin–Hebei, Yangtze River Delta, and Pearl River Delta regions, respectively. In addition, the PM2.5 concentration in Beijing should be controlled below 60 µg/m3 – something which is a significant reduction compared to the period 2013–2015 when the level was in the range 80–90 µg/m3 in the city. According to the interim report on the evaluation of the progress in implementation of the Action Plan for Prevention and Control of Air Pollution, the policy measures taken have significantly reduced the emissions of main air pollutants and been effective in lowering PM2.5 concentrations during 2013–2015. The average concentration of PM2.5 in the 74 key cities in 2015 was down to 55 µg/m3, i.e. 23.6 per cent lower than in 2013. Satellite monitoring also found a 10–20 per cent decline of NO2 levels and a 30–45 per cent decline of SO2 levels in the Beijing–Tianjin–Hebei, Yangtze River Delta, and Pearl River Delta regions.Footnote 62
Concluding Remarks: Light at the End of the Tunnel?
As we have shown in this article, data on emissions of major air pollutants and concentration levels across China, together with estimates of the health effects associated with air pollution exposure, suggest that the worst air pollution era may belong to the past for most of the Chinese population. Nevertheless, the levels of air pollution in Chinese cities will undoubtedly remain high, well above WHO's health-based air quality guidelines for a long time to come, and the rural population residing in areas close to industry and polluted cities and still depending on solid household fuels will likely be the worst off when it comes to air pollution exposure. To reach the national air quality standard of 35 µg/m3 of PM2.5, China would need to reduce its emissions by between 50 and 70 per cent from the 2012 levels.Footnote 63 However, if local governments are able to implement the central government's ambitious plans to curb air pollution through further energy transitions away from the reliance on coal, innovate and introduce new technologies, and close down outdated polluting industries, there is hope for the continued reduction of concentrations of air pollutants. Furthermore, if solutions are sought through measures other than end-of-pipe technologies (i.e. cleaning of emissions rather than reducing them at the source), the reduction of air pollution will not only have profound consequences for the health of the population, but will also serve to reduce the emission of greenhouse gases that are contributing to climate change.Footnote 64
What needs more attention in this (cautiously optimistic) image of a general trend of decreasing concentrations of air pollutants in China is, for instance, the highly uneven distribution of pollution exposure. Such an approach should, in particular, include more analysis of the ways in which national policies are translated into local measures that, again, affect people differently depending on their socio-economic status, gender, options for mobility and access to knowledge and power. Finally, what cannot be ignored are the global connections of capitalism that now make it possible for China to begin pushing polluting industries towards poorer areas of the world, much as the US and Europe have done for decades. The Chinese government, like most governments in the world, seems to be set on a path of optimism regarding the possibility of combining continued economic growth with a thorough reduction of emissions of climate gasses and pollution in general. This is reflected in the state's anthropocentric vision of an Ecological Civilization and the related policy documents that, for instance, outline the requirements on local officials to continue the drive towards higher levels of economic development without endangering the environment any further, and without causing social instability. The following articles in this issue take a deeper look into the ways in which people of different social status, and with highly different levels of power and access to knowledge deal with the now thoroughly documented risks that air pollution poses to the Chinese society.
Biographical notes
Mette Halskov Hansen is professor in modern Chinese society and politics at the University of Oslo, Norway. She has published on topics such as ethnic identity, colonization of border areas, and individualization in Chinese society. During years of fieldwork in rural China she became increasingly interested in how people understand and respond to risks of pollution, what they expect from government, and how they envision their future. Recent publications include the monograph Educating the Chinese Individual (University of Washington Press 2015).
Kristin Aunan is senior research fellow at CICERO Center for International Climate Research and professor II in the department of chemistry, University of Oslo, Norway. Trained in environmental sciences, her research interests include air pollution exposure assessment and the distributional determinants of exposure and health burden. She has studied these issues in a number of interdisciplinary projects, including with colleagues in China, and publishes regularly in international journals.
Shuxiao Wang is professor of air pollution control at Tsinghua University in Beijing, China. Trained in environmental sciences, her research interests include atmospheric chemistry and physics, as well as air pollution control policies and health benefit assessment. Wang has published widely and internationally on these topics.


 Open access