


Introduction
Recently, there has been a growing number of studies addressing environmental changes in Antarctica in response to retreating glaciers, thawing permafrost and melting ice (Ruiz-Fernández et al. Reference Ruiz-Fernández, Oliva, Nvlt, Cannone, García-Hernández and Guglielmin2019, Hrbáček et al. Reference Hrbáček, Vieira, Oliva, Balks, Guglielmin and de Pablo2021). Antarctic research has traditionally focused on either the continental zone or the marine environment. However, the transitional zone between these environments - the coastline - has received comparatively less attention (Hansom Reference Hansom1983, Hansom et al. Reference Hansom, Forbes and Etienne2014, Pérez-Alberti et al. Reference Pérez-Alberti, García-Hernández, Oliva and Ruiz-Fernández2018).
This coastal interface is shaped by numerous processes and interactions from various geographical and temporal scales. Changes in this zone can occur at highly variable rates, often driven by factors such as the recurrence of storms, their intensity or, in the case of polar regions such as Antarctica, the period of snow and sea-ice cover, the advance or retreat of glaciers or the delivery of icebergs to the coastal zone (Hansom et al. Reference Hansom, Forbes and Etienne2014).
Less than 0.5% of the Antarctic continent’s surface is ice-free terrain during the summer, primarily found along the coastline and inland in the form of nunataks (Hrbáček et al. Reference Hrbáček, Oliva, Hansen, Balks, O’Neill and de Pablo2023). Nevertheless, studies of coastal zones have predominantly concentrated on biological, geomorphological, geological or hydrological processes occurring further inland (Benayas et al. Reference Benayas, Pertierra, Tejedo, Lara, Bermudez, Hughes and Quesada2013, Ruiz-Fernández & Oliva Reference Ruiz-Fernández and Oliva2016, Ruiz-Fernández et al. Reference Ruiz-Fernández, Oliva and García-Hernández2017, Bastias-Silva et al. Reference Bastias-Silva, Burton-Johnson, Chew, Riley, Jara and Chiaradia2024). Only a few studies directly address coastal processes themselves, such as Hansom (Reference Hansom1983) in Hell Gates (Byers Peninsula) or Pérez-Alberti et al. (Reference Pérez-Alberti, García-Hernández, Oliva and Ruiz-Fernández2018) in Fildes and Hurd peninsulas.
Variations in ice thickness, distribution and duration of coverage (both continental and sea ice) strongly influence coastal landform development in Antarctica. These changes cause erosion and sediment deposition in different coastal zones (Hall & Perry Reference Hall and Perry2004, Lantuit et al. Reference Lantuit, Overduin, Couture, Wettereich, Aré and Atkinson2012, Palacios et al. Reference Palacios, Ruiz-Fernández, Oliva, Andrés, Fernández- Fernández and Schimmelpfennig2020). Reduced sea-ice thickness or its disappearance exposes the coastline to greater oceanic forces, accelerating erosion rates (Strzelecki Reference Strzelecki2017). However, ice is not the only factor that explains how the coast changes over time. Other factors, such as the type of rock, how much sediment is available, the shape of the land both inland and offshore and volcanic or tectonic activity, also significantly affect the long-term coastal evolution in this region (e.g. Antoniades et al. Reference Antoniades, Giralt, Geyer, Álvarez-Valero, Pla-Rabes and Granados2018, Bastias et al. Reference Bastias, Calderón, Israel, Hervé, Spikings and Pankhurst2019).
Polar coastal research has been more extensively developed in the Arctic, in regions such as Svalbard (Nicu et al. Reference Nicu, Rubensdotter, Stalsberg and Nau2021, Swirad et al. Reference Swirad, Johansson and Malnes2024) or the Canadian Arctic coast (Marie Reference Marie2022). In these regions, understanding coastal changes holds particular importance due to the presence and interests of local communities (Fritz et al. Reference Fritz, Vonk and Lantuit2017), which contrasts with the case of Livingston Island (Maritime Antarctic), where human presence is only seasonal.
This research aims to characterize and map the spatial distribution of the landforms in Spanish Cove on the north-west coast of Hurd Peninsula (Livingston Island) in order to advance knowledge of their evolution and recent morphodynamics. The specific objectives are 1) to classify and analyse the coastal landforms and recent coastal dynamics, with particular attention to the effects of glacial retreat and the interaction between continental and marine ice processes, 2) to investigate the relationship between the hardness of rocks (measured in 2018) and the distribution of landforms across different beach levels, 3) to assess changes in coastal morphology using semi-automatic grain size measurements derived from unmanned aerial vehicle (UAV) imagery acquired in 2024 and 4) to contribute to the understanding of the long-term evolution of Antarctic coastal environments, especially in the context of global change and rapidly retreating glaciers.
This study provides an initial approach to the detailed geomorphological characterization of Antarctic coastal sectors, contributing to a better understanding of these environments. Prior to this work, no high-resolution geomorphological mapping had been conducted for Spanish Cove, making this study a significant contribution to the spatial documentation and analysis of this area.
Study site
Livingston Island is part of the South Shetland Islands, which extend longitudinally in a south-west to north-east direction along the north-west coast of the Antarctic Peninsula. Geologically, Livingston Island is composed of Mesozoic and Cenozoic volcanic rocks and sedimentary deposits shaped by Quaternary glacial activity (Smellie et al. Reference Smellie, Pankhurst, Thomson and Davies1984, Bastias et al. Reference Bastias, Chew, Villanueva, Riley, Manfroi and Trevisan2023). These islands have undergone significant weathering and erosion processes throughout the Holocene. This geomorphological evolution has been influenced by both gravitational processes - including glacial isostatic adjustment, which has caused post-glacial rebound at rates of ~2.8 mm/year during the Holocene (Fretwell et al. Reference Fretwell, Hodgson, Watcham, Bentley and Roberts2010) - and marine processes, resulting in a diverse coastal landscape featuring cliffs, shore platforms and boulder beaches (Hansom Reference Hansom1983).
This archipelago is characterized by a mean annual air temperature of −1°C to −2°C at sea level and precipitation of between 500 and 800 mm/year (Bañón et al. Reference Bañón, Justel, Velázquez and Quesada2013). Due to its geographical position, the ocean defines a highly variable maritime climate, with frequent cloudiness and precipitation throughout the year.
The South Shetland Islands’ maritime environment was classified as a storm wave environment (Davies Reference Davies1964) and is greatly influenced by the reduction of wave energy due to its rocky outcrops and sheltered bays, which are evident in the study area. Indeed, Spanish Cove, located in the southern bay of Livingston Island between Ballester Point and Polish Bluff, exemplifies these conditions (Fig. 1). Due to the interrelation of various marine and continental processes (Porter-Smith et al. Reference Porter-Smith, McKinlay, Fraser and Massom2021), this is a particularly dynamic sector, where coastal erosion processes have been visible over recent decades, and where the effects of the new climatic conditions can be well observed. Moreover, its proximity to the Spanish Antarctic Station Juan Carlos I (BAE-JCI) has allowed the compilation of an important database for the geomorphological and evolutionary characterization of the coastal sector.
Location maps a. within the Antarctic continent, b. within the South Shetland Islands and c. within Livingston Island. d. Unmanned aerial vehicle survey of the Spanish Cove sector based on images obtained from 2024 (coastal zone) and 2022 (upper part, Román et al. Reference Román, Navarro, Tovar-Sánchez, Zarandona, Roque-Atienza and Barbero2024). Red triangles represent the Equotip measurement positions (Fig. 4), yellow polygons indicate the compared areas in Fig. 5 and light green polygons are the zones used for the clast size analysis (Table II). Photographic camera images indicate the locations where the photographs that are used in Fig. 3 were taken (only the images included in this sector). BAE = Spanish Antarctic Station.

This coastal area is characterized by a gentle slope in the seaward sector, with accumulations of heterometric boulders, clasts and various landforms associated with Antarctic conditions, such as sea-ice erosion holes or rocky outcrops. The boulder beach of Spanish Cove extends ~700 m between rocky outcrops, with an active beach width that varies between 15 and 50 m (Fig. 2). The area is dominated by Mount Reina Sofía (273 m) and its slopes, which partially influence the evolution of this sector in terms of material availability and cold-climate processes. On the western side, raised beaches at different elevations serve as indicators of the sector’s evolution (Haus et al. Reference Haus, Wilhelm, Bockheim, Fournelle and Miller2016, Ruiz-Fernández et al. Reference Ruiz-Fernández, Oliva and García-Hernández2017), whereas on the eastern side (area of Cathedral Valley) there are till deposits reaching 10 m above the current beach level. These tills contribute to the presence of sharper clasts, which are later reworked by the sea. Further inland, the eastern part of Spanish Cove is bounded by Johnsons Glacier, located ~700 m from the boulder beach.
Identified landforms in Spanish Cove. a. Spanish Cove 2024 digital surface model. b. Landform distribution and the zones used for the clast size analysis (light green polygons). c. Sea-ice erosion hole detailed image. d. Zoomed-in image of the dynamic area on the east sector. e. Topographic profile in 2024; the profile is indicated by the dark red dot-dashed line in the western part of Spanish Cove shown in b.

Sedimentary structures in the region are largely linked to glacial and post-glacial processes. Morainic ridges and glacial till are prominent, influencing the coastal morphology (John & Sugden Reference John and Sugden1971). Several processes interact in this sector, including cold-related factors such as glacial and periglacial dynamics, surface erosion and the accumulation of material in moraines (Ruiz-Fernández et al. Reference Ruiz-Fernández, Oliva, Nvlt, Cannone, García-Hernández and Guglielmin2019, Oliva et al. Reference Oliva, Palacios, Sancho, Fernández-Fernández, Çiner and Fernandes2024). Fluvial processes also occur in Spanish Cove, especially near the small stream (Cazadora Stream) at BAE-JCI. It originates from the BAE lobe, which constitutes a part of Hurd Glacier. Here, sediments of different sizes are transported from the steeper slopes of Mount Reina Sofía to the coastal area, with their behaviour influenced by water levels and the rates of ice and snow melt.
It is also necessary to relate the study area to the dynamics observed in recent decades in nearby glacier masses, such as Hurd Glacier and Johnsons Glacier. These areas have experienced a loss of ~10% of their ice mass between 1957 and 2000 (Molina et al. Reference Molina, Navarro, Calvet, García-Sellés and Lapazaran2007). These variations are key factors to consider in the coastal evolution of the area, both due to the increased exposure of the shoreline and the rise in sediment availability, as well as the reduced protection against marine storms.
Materials and methods
This study presents a multi-approach characterization of the coastal sector of Spanish Cove using several complementary techniques to describe the landforms and processes present in this area.
UAV survey
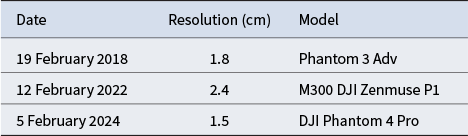
High-resolution images were acquired using UAVs between 2018 and 2024 (Table I). Data from 2018 and 2022 were processed using Pix4D, and the 2024 flight data were processed using Agisoft Metashape. For the 2018 flight, no ground control points (GCPs) were used, and an 80% overlap between photographs was applied, capturing a total of 60 images over an area of 0.036 km2, resulting in a ground sampling distance (GSD) of 1.8. In the 2024 flight, 36 GCPs were used, and 880 images were captured with 80% frontal overlap and 75% lateral overlap, resulting in a GSD of 1.5. The 2022 data come from the work of Román et al. (Reference Román, Navarro, Tovar-Sánchez, Zarandona, Roque-Atienza and Barbero2024), in which high-resolution information was collected from different sectors of the South Shetland Islands.
Main information regarding the unmanned aerial vehicle flight characteristics.

Prior to landform classification and temporal analysis, all UAV-derived digital surface models (DSMs) and orthophotography were pre-processed to ensure geometric consistency. This pre-processing workflow included 1) co-registration of all DSMs to a common reference frame using GCPs established in 2024 on stable, recognizable terrain features that were identifiable across all surveys, 2) resampling of all models to a uniform spatial resolution of 2 cm and 3) geometric verification on stable terrain areas to validate alignment accuracy.
A detailed classification of the landforms of the Spanish Cove sector has been established through photointerpretation, using DSMs with a spatial resolution of 1.5 cm and indices such as roughness (Riley et al. Reference Riley, Degloria and Elliot1999) using the most recent image obtained by the UAV in 2024. This includes 15 categories/landforms that were considered the main features due to their distribution along the coast and spatial extent. The same method was used to analyse the temporal variations by comparing the landforms mapped on the available dates. The mapped area is outlined with a dashed line in Fig. 2.
Sediment size characterization
Based on the classification categories established for 2024 using high-resolution drone-derived orthomosaics and DSMs, a semi-automatic analysis was performed to determine the size distribution of pebbles and boulders within different classes. For this, ten 10 × 10 m polygons were selected along Spanish Cove to cover most of the landforms (Fig. 1). The analysis utilized a wavelet-based digital image analysis method that does not rely on individual grain detection or segmentation, making it particularly suitable for field validation work in remote environments. Specifically, sediment distribution analysis followed the method developed by Buscombe (Reference Buscombe2013), which estimates grain size distributions from image textures using continuous wavelet transformation, implemented using Python tools (Cuttler et al. Reference Cuttler, Lowe, Falter and Buscombe2017). Although comprehensive in situ sediment characterization could not be conducted during the 2024 field campaign due to logistical constraints inherent to Antarctic operations, the high spatial resolution of the UAV-derived imagery enabled reliable grain size estimation.
Rock hardness
To investigate possible variations in beach elevation and to interpret rock exposure time through mechanical weathering indicators, a durometer was employed as a tool to determine both active processes and exposure times based on rock resistance. During the 2018 field survey, a systematic durometer protocol was developed to relate existing landforms to rock hardness values while accounting for geological and environmental controls on surface strength (Coombes et al. Reference Coombes, Feal-Pérez, Naylor and Wilhelm2013).
Rock hardness measurements were conducted exclusively on 1) stable, flat to sub-horizontal surfaces free of sediment or biological material that could interfere with readings, 2) boulders composed of lithologically homogeneous material with similar characteristics across all measurement locations, minimizing mechanical property variability due to compositional heterogeneity, and 3) field conditions characterized by consistent temperatures (3–6°C).
A profile was created of the western area of Spanish Cove with 10 control sectors (Fig. 1), with each sector carefully selected from visually competent, unweathered rock outcrops. Using a Proceq Equotip 3 hardness tester, systematic measurements were conducted at each sampling location to account for the surface heterogeneity inherent to natural rock surfaces. A total of 25 measurements were made on surrounding cobbles and boulders.
These measurements were then statistically analysed to produce both unfiltered and filtered results. In the filtered dataset, 17 measurements were selected after applying standardized filtering criteria to remove extreme values (those exceeding ± 2 standard deviations from the mean), which were evenly distributed between the lowest and highest readings. This filtering procedure followed established protocols for durometer-based weathering studies (Coombes et al. Reference Coombes, Feal-Pérez, Naylor and Wilhelm2013, Pérez-Alberti et al. Reference Pérez-Alberti, Gomes, Trenhaile, Oliveira and Horacio2013), ensuring that the central tendency of the hardness distribution was preserved while eliminating potential surface anomalies or localized weathering features.
Results
Geomorphological characterization of Spanish Cove
The categories identified during the mapping follow a distribution from the seaward zone to the upper continental region, with several landforms irregularly distributed throughout the area. Figure 2 shows the different categories and the area of over 40 000 m2 mapped along the coast. The following sections will focus on the most prominent landform categories, highlighting their distribution and main characteristics.
Boulder pavements
Boulder pavements appear primarily in the seaward area and represent the most extensive feature in the study site, occupying more than 11 000 m2. This is the sector closest to the sea in most of the area, and its extent is more significant in the western sector. However, reduced visibility caused by a water layer and biotic cover makes mapping difficult. The boulders and cobbles comprising this pavement are products of coastal sediment mobilization processes rather than glacial erratics; they result from wave-driven transport, storm-surge emplacement and periglacial reworking of local bedrock fragments and previously deposited coastal debris. These boulders have an average size of ~30 cm (Table II). However, in several instances their size ranges from 40 to 100 cm, with the lower average values influenced by smaller cobbles, which have a less stable distribution in the area. These materials were distributed on a low slope, mostly below 3 m above sea level (a.s.l.; Fig. 3a), and sometimes overlying boulders, such as those made of ice, can also serve as key elements in creating the circular landforms in this environment, which will be described further later. The spatial extent of the boulder pavement ranges from 6 m in the eastern sector to 30 m in the western region.
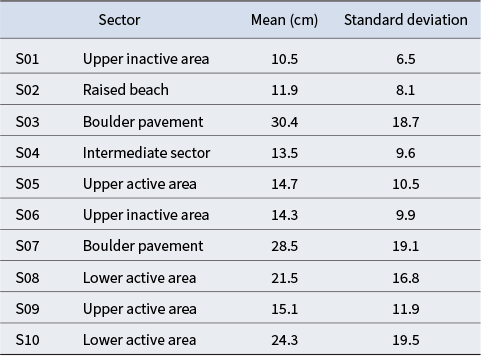
Main statistics of the grain size analysis in each sector of Fig. 1 (light green polygons).

Sea-ice erosion holes
Circular landforms (sea-ice erosion holes) abound in the lower part of the coastline. These develop on boulder pavements or shielded surfaces and consist of hollows with circular shapes, delimited from their surroundings by aligning similar-sized materials. In many cases, they are formed by small (10–15 cm) or medium (20–30 cm) clasts (Fig. 3b,c). In this case, the limiting materials also vary among different beach sectors, with larger sizes occurring in the eastern part and decreasing towards the central and western sectors. As shown in Fig. 3b,c, the dimensions of these forms vary widely, ranging from 0.2 to 2.5 m2, but without a clear size differentiation along the coastline. These landforms can also merge to produce more complex structures, such as clusters of circles merging at their edges, as can be seen in Fig. 2c.
Rocky surfaces
Rocky surfaces are restricted to rocky outcrops at the eastern and western ends (Polish Bluff) of the area, where exposed bedrock exhibits varying degrees of weathering depending on lithology, structural features and the combined effects of multiple erosional processes. In this zone, the dominant weathering mechanisms include 1) marine abrasion by wave-driven sediment, which breaks down exposed rock, and 2) freeze-thaw weathering cycles, which are particularly effective in coastal settings, with high-frequency, short-duration freeze-thaw events characteristic of the Maritime Antarctic.
For example, Fig. 3d shows a western zone where small rocks, produced by abrasion and cryogenic weathering, contribute to the beach, whereas Fig. 3e depicts wave-driven abrasion and periglacial weathering dominating the eastern zone and the area connecting Spanish Cove with Johnsons Dock. The greater wave exposure in this sector intensifies mechanical erosion and facilitates sediment transport. These weathering patterns have probably operated throughout the Holocene, contributing to the evolution of the present coastal platform.
Boulder accumulations
Boulder accumulations occur in some areas, such as the central part, and overlap with the previous category, but they have a greater spatial extent along the coastline. These accumulations are characterized by heterometric boulders, mostly rounded in shape, ranging from 50 to 100 cm in size, with no embedding, in contrast to the boulder pavements. They are generally distributed in 2–5 m-wide sectors at the lower and middle intertidal levels. In addition, these boulders often rest on thinner materials over which they are displaced.
Intertidal zonation and morphodynamical sectors
The distribution of landforms on the beach and its surroundings follows a gradual pattern, characterized by slope breaks and small ridges that contribute to defining these sectors. Four basic categories are included from the sea to the continent: a lower active area, an intermediate sector, an upper active area and an upper inactive area. Morphological differences are evident, beginning with clast/boulder size, which ranges from smaller in the continental sectors to larger in the lower active area (Table II). Landform width varies substantially along the beach. The lower active area spans widths of 2–15 m throughout the beach, whereas categories such as the intermediate level nearly disappear in the east, where the beach profile is smoother and lacks scarps. Differences between these categories are evident in the central and western parts, where crescent shapes are observed, with algae that indicate the maximum tidal level and show the erosive forms in the sector (Fig. 3f). These lines provide evidence of morphological changes occurring over years and even seasons.
All categories are present in the eastern part of Spanish Cove, including till deposits in the outermost section extending downslope as moraine ridges. These ridges contain intermixed materials from both the active and inactive upper areas. This sector presents the most pronounced level differences and the most rapid profile changes (Fig. 2d). Towards the east, both the extent and clarity of category boundaries decrease, particularly from the wet zone, often near the intermediate sector boundary or the eastern edge of the upper active area. There, landform boundaries narrow and become harder to define. Figure 2e shows a topographic profile where these categories occupy a small portion of the analysed sector.
In most zones, the inactive upper area corresponds to gentler slopes and lacks marine influence, promoting material stabilization. These materials are typically thin (Table II), smaller sized (10–20 cm) and more angular than those near the sea. Boulders frequently rest atop finer sediments, originating from higher slopes and relocated due to marine forces, snow accumulation and gravity.
Water bodies and vegetated areas
The western sector of Spanish Cove is characterized by the presence of highly variable water bodies throughout the year, depending on climate conditions. This sector, encompassing Cazadora Stream, vegetated flat areas and the upper inactive zone (Fig. 2), exhibits pronounced annual and seasonal dynamics. Vegetation here includes lichens, mosses and Deschampsia antarctica, species adapted to the harsh regional conditions, exhibiting small sizes and rapid growth cycles with notable annual variability.
Raised beach
The raised beach is the highest identified level within the mapped area, previously noted by John & Sugden (Reference John and Sugden1971). Various studies have addressed these Antarctic coastal features to elucidate their Holocene age and evolutionary context (John & Sugden Reference John and Sugden1971, Fretwell et al. Reference Fretwell, Hodgson, Watcham, Bentley and Roberts2010, Ferri-Hidalgo et al. Reference Ferri-Hidalgo, García-Hernández and Ruiz-Fernández2024). The presence of this category is restricted to the western part of Spanish Cove, where boundaries are well defined and free from anthropogenic alteration.
Photography of coastal sectors. a. Shielded sector from the eastern to western parts of Spanish Cove. b. Sea-ice erosion holes. c. Detail of a sea-ice erosion hole. d. Rocky outcrop erosion pattern in the central sector. e. Detail of the abrasion process in a rocky outcrop in the eastern part of Spanish Cove. f. Crescent shapes at the boundary of the lower and upper active sectors. g. Boulder barricade on the King George Island coastline. h. Sea-ice erosion corridor in the Johnsons Dock sector. Photographs: b., d., g. and h.: AP-A, 2018; a., c., e. and f.: AG-P, 2024.

Variations in sediment size on coastal landforms
Clast and boulder size distributions (Table II) support the spatial categories described earlier. Clast differences exist in mean particle sizes between sectors, particularly between boulder pavements and the lower active zone.
These data also confirm similarities between categories in different sectors, such as the upper active zone (14–15 cm) and the lower active zone (21–24 cm). Variations relate to each category’s formation period and the dominant influence of continental vs marine processes. Larger materials accumulate on lower slopes, where stable boulder pavements restrict boulder mobility and inhibit fine sediment deposition. Conversely, finer sediments dominate the middle and upper intertidal zones, where enhanced clast and boulder mobility results from wave and tidal dynamics, favouring the deposition and redistribution of finer particles. Hence, intertidal conditions play a vital role in shaping sediment spatial patterns, with stable pavements hosting coarser sediments and more dynamic zones accumulating finer sediments.
Rock hardness at different elevation levels
Hardness values generally decrease from sectors E01 to E10 (Fig. 4). Regression lines for both unfiltered and filtered data fit this trend satisfactorily; the filtered data show a slightly better fit, with R 2 values of 0.74 and 0.71, respectively.
Hardness values (HDL) along different sample points (E01–E10). Dashed purple lines indicate the boundaries between coastal categories. Their positions appear in the red triangles of Fig. 1.

Although the means of the filtered and unfiltered data are similar, all measures indicate that hardness decreases with increasing distance from the sea towards the rear of the beach (palaeo-cliff). This pattern aligns with expected exposure times and erosion processes. Notably, sectors E06 and E09 show particular deviations from the expected values (Fig. 4), where the hardness of the materials is greater than expected.
The spatial distribution of hardness reflects variations in the degree of weathering and exposure of the surface materials, which can be interpreted as indicators of their relative age. In general, surfaces showing greater weathering are likely to be older or to have been exposed for a longer duration, whereas those with higher hardness values are likely to be younger or to have been more recently reworked. Apart from isolated exceptions, this variation helps us to reconstruct both current and historical geomorphological sequences (Goudie Reference Goudie2016).
Recent geomorphological evolution of Spanish Cove
Figure 5 highlights three coastal sectors where significant variations occurred over the 6 year period between UAV flights (Table I). Conditions at both survey dates were compared.
Coastal variations identified in the intertidal and active sectors between 2018 (a., b. and c.) and 2024 (d., e. and f.). Sector position are as marked in Fig. 1 with yellow polygons. The red polygon in b. and e. represents a mobile boulder of 123 × 64 cm.

Variations in the sector marked in Fig. 2d. a. LiDAR data of 28 January 2024 and b. LiDAR data of 1 February 2024. The complete LiDAR sequence is available at https://www.youtube.com/watch?v=7kEbxXGkD3Y.

In Sector A (Fig. 5a,d), changes in the adjacent stream outlet to the sea near BAE-JCI mainly drive the observed variations. This area shows significant seasonal and annual variations depending on water flow, primarily from glacial melt of the BAE lobe of Hurd Glacier, and snow accumulation periods. Variations here related closely to continental settings, with similar conditions observed in the intertidal zone.
Sector B (Fig. 5b,e) shows changes in clast distribution within the water-covered zone near the low intertidal level or below it, being a zone that is practically always underwater. Material generally moves south-east to east between survey dates. A notable indicator is a 123 × 64 cm boulder (red polygon, Fig. 5b,e) that displaced 5.6 m over 6 years based on photointerpretation observation.
Sector C (Fig. 5c,f) exemplifies the behaviour of circular intertidal structures. In 2018, small, confined structures with a few medium-sized clasts were observed; by 2024, boundary shapes and complex forms resulting from merging circular structures became more apparent. Tidal conditions during the 2018 UAV flight limited detailed analysis of lower beach dynamics and landform evolution. Variations in these sectors are probably linked to the quantity, duration and dynamics of brash ice accumulation and extreme events influencing landform removal.
During the 2024 field survey, short-term variations in the coastal sector were observed in the absence of high-energy marine events. Between 28 January and 1 February, changes were recorded in the eastern Spanish Cove (Fig. 2d), including displacements of 15–30 cm for clasts around the monitored boulder and algae colonization in the area (Fig. 6). These observations clearly indicate coastal dynamics and are essential for understanding the energy required to initiate sediment movement. In this case, material displacement resulted primarily from wave and tidal action without major storm influences. The area shown in Fig. 6 lies within the active beach zone on a slope conducive to sediment mobility, driven by combined marine dynamics and gravity during tidal retreat.
Discussion
Spanish Cove’s landforms and processes
The detailed mapping allowed, for the first time, a comprehensive review of the landforms in the coastal zone of Spanish Cove. This analysis represents a significant advance beyond the basic differentiation between the current beach and raised beaches reported in previous, broader studies (Fretwell et al. Reference Fretwell, Hodgson, Watcham, Bentley and Roberts2010, López-Martínez et al. Reference López-Marínez, Serrano, Schmid, Mink and Linés2012, Ruiz-Fernández et al. Reference Ruiz-Fernández, Oliva and García-Hernández2017). This increased precision was made possible due to UAV-derived data, which offer a level of detail unattainable with existing satellite data.
Using this information, it is possible to identify the boundaries of each category based on terrain roughness or slope. This facilitates our understanding of temporal variations, such as those shown in Fig.5a,d, where the crests of 2024 are absent in 2018. Sediment size analyses characterize different beach levels, with such values being consistent with similar zones elsewhere (Theilen et al. Reference Theilen, Simms, Dewitt, Zurbuchen, Garcia and Gernant2023). The boulder pavement - the most extensive landform - occupies more than 11 000 m2, mainly in the seaward area. Boulders and cobbles averaging ~30 cm form a stable pavement, although mapping is complicated by reduced visibility through water and biological coverings. The pavements width ranges from 6 m in the east to 30 m in the west, occurring mostly on a low slope, mostly below 3 m a.s.l.
The boulders characterizing Spanish Cove’s beach derive from three primary sources.
First, erosion of local bedrock, occurring both on the beach and in adjacent submerged areas, produced fresh, angular boulders and cobbles through mechanical breakdown by wave action, weathering and tidal processes (Gómez-Pazo et al. Reference Gómez-Pazo, Pérez-Alberti and Trehaile2019).
Second, slope movements, including rockfalls and landslides, from surrounding continental areas deliver additional material downslope. These transport pre-existing boulders and cobbles that accumulate at slope bases before marine reworking. Over time, these clasts become rounded due to abrasion during transport and wave action.
Third, glacial deposits contribute as another sediment source. Historically, the Cathedral Valley glacier extended towards the area near Johnsons Dock, where its front-deposited materials were later reworked by near-shore marine processes. This pattern of glacial sediment delivery and marine reworking is consistent with observations from the nearby King George Island, where similar processes of glacial retreat and coastal sediment remobilization have been observed (Hrbáček et al. Reference Hrbáček, Oliva, Hansen, Balks, O’Neill and de Pablo2023).
In the Spanish Cove sector, angular boulders cluster near bedrock outcrops and submerged areas, indicating in situ fragmentation, whereas rounded boulders are prevalent at slope bases and in the adjacent eastern sectors. This origin typifies boulder beaches at mid-latitudes, where sediment supply reflects an interplay between marine erosion and terrestrial slope dynamics (Theilen et al. Reference Theilen, Simms, Dewitt, Zurbuchen, Garcia and Gernant2023). The limited efficacy of regular wave action to mobilize large boulders means that their distribution is largely controlled by episodic high-energy events, such as storms or extreme tides, which are capable of remobilizing these sediments along the shore (Gómez-Pazo et al. Reference Gómez-Pazo, Pérez-Alberti and Trehaile2019).
Accordingly, given the minimal fluvial input in the area (except the BAE stream), cooler conditions associated with sea ice results in less frequent reworking of beach cobbles, yielding poorly rounded clasts in the upper beach zone, whereas marine processes in seaward areas round boulders through abrasion and transport mechanisms (Feal-Pérez & Blanco-Chao Reference Feal-Pérez and Blanco-Chao2013).
Other larger boulders persist higher on the beach due to their resistance to wave transport. The glacial-related boulders are more angular than those found in the sector closer to the sea. Furthermore, freeze-thaw cycles, wind and water erosion contribute to sorting and reshaping these sedimentary paraglacial deposits (Ruiz-Fernández et al. Reference Ruiz-Fernández, Oliva, Nvlt, Cannone, García-Hernández and Guglielmin2019). Similar paraglacial coastal dynamics and periglacial processes operating on boulder accumulations have been documented across the South Shetland Islands (López-Martínez et al. Reference López-Marínez, Serrano, Schmid, Mink and Linés2012). For instance, on Nelson Island’s Stansbury Peninsula, soil-landscape studies reveal active periglacial processes, including patterned ground (Meier et al. Reference Meier, Francelino, Gasparini, Thomazini, Pereira and von Krüger2023). Furthermore, on Fildes Peninsula (King George Island), raised beach deposits show evidence of grain size variation and clast sorting controlled by freeze-thaw action and wave dynamics (Fretwell et al. Reference Fretwell, Hodgson, Watcham, Bentley and Roberts2010). Boulder accumulations range between 50 and 100 cm in size, commonly forming 2–5 m-wide bands at lower and middle intertidal levels. Morphological differences among dynamic categories correspond to clast size variations, with finer particles occurring in continental zones and larger boulders occurring in lower active sectors.
Durometer analyses in the western Spanish Cove reveal clear hardness differences. Hardness decreases progressively from sectors E01 to E10, with regression analyses of filtered and unfiltered data showing good fits (R 2 = 0.74 and 0.71, respectively). This progressive trend corresponds to longer exposure times and greater susceptibility to erosion. Deviations observed at sampling points E09 and E06 probably result from material transfers between geomorphological levels, facilitated by the small elevation difference (~1 m) and the steeper palaeo-cliff slope. This hardness patterns align with methodological applications validated in other Antarctic contexts, where durometer data provide reliable proxies for interpreting Holocene exposure histories and weathering trajectories in glacially influenced coastal systems (Guglielmin et al. Reference Guglielmin, Worland, Convey and Cannone2012). Similar approaches using rock hardness measurements have effectively constrained deglaciation chronologies and estimated relative age sequences in paraglacial environments across the Antarctic Peninsula (Matthews & Winkler Reference Matthews and Winkler2011, Ruiz-Fernández et al. Reference Ruiz-Fernández, Oliva, Nvlt, Cannone, García-Hernández and Guglielmin2019).
Coastal landforms in Antarctica
Antarctic coastlines display diverse landforms shaped by the interaction of glacial inheritance, paraglacial readjustments, active periglacial processes and current marine factors, including sea ice and winter snow cover. Unlike mid-latitude coasts, sea ice in both intertidal and subtidal zones plays a key geomorphological role by reducing fetch, limiting wave energy and abrading exposed rock surfaces (Fig. 3e). This results in forms such as boulder pavements and other ice-related features (Fig. 3b,c,g; Hansom et al. Reference Hansom, Forbes and Etienne2014, Pérez-Alberti et al. Reference Pérez-Alberti, Gómez-Pazo, Oliva and Ruiz-Fernández2023), with sea-ice erosion corridors occurring in some lower beach zones (Fig. 3h). Physical weathering and chemical weathering (Fig. 3d) further diversify coastal morphology, especially on rocky outcrops such as Polish Bluff.
In these paraglacial coastal environments, boulder accumulations are composed of heterometric material clusters (parts of them previously glaciated) in lower-energy zones due to energy dissipation and enclosure effects. Although absent from Spanish Cove, boulder barricades - linear formations acting as coastal sector boundaries (Fig. 3g) - are notable on King George Island (Pérez-Alberti et al. Reference Pérez-Alberti, García-Hernández, Oliva and Ruiz-Fernández2018). In addition to the accumulations observed in the lower part of the beach, as shown in Fig. 2b, various coastal morphologies can be identified in the Spanish Cove sector. These features often have poorly defined boundaries and exhibit different behaviours and materials with diverse origins and dynamics. For example, the tidal influence limit is marked in some areas, such as the central part of Spanish Cove, by the presence of finer sediments and seaweed accumulations (Fig. 3f), whose extent, position and morphology vary seasonally. Together, these features illustrate the continuum between paraglacial and marine processes that currently shape the coastal landscape and record its postglacial evolution.
Coastal geomorphological context and evolution
The coastal morphologies identified in the study area gain clearer significance when interpreted within the framework of previous geomorphological research conducted across the South Shetland Islands. Although investigations of Antarctic coastal environments have historically been limited, pioneering works by Hansom and colleagues since the 1970s (Hansom Reference Hansom1979, Reference Hansom1983, Hansom et al. Reference Hansom, Forbes and Etienne2014) established key foundations for understanding the geomorphic influences of sea ice, wave action and glacio-isostatic adjustment. Early studies focused primarily on shoreline evolution, coastal platforms and relative sea-level change (Hansom Reference Hansom1983), building upon earlier observations of abrasion processes on shore platforms (John & Sugden Reference John and Sugden1971). More recently, studies focused on the Spanish Cove area addressed island geomorphology and neotectonics at broad scales (Pallàs et al. Reference Pallàs, Vllaplana and Sabat1995), classifying this area within the category of periglacial soils. More recent work divided the sector into present and Holocene beaches (López-Martínez et al. Reference López-Marínez, Serrano, Schmid, Mink and Linés2012), and Oliva et al. (Reference Oliva, Palacios, Sancho, Fernández-Fernández, Çiner and Fernandes2024) produced coastal maps delineating current and raised beaches and flood zones near BAE-JCI, though this work was descriptive, and the samples used for dating come from outside the current study area. Other investigations focused on soil chemical parameters within the area, classifying soils as Gelorthents in lower zones and Humigelepts higher up, highlighting the differences between raised beach and elevated sectors (Haus et al. Reference Haus, Wilhelm, Bockheim, Fournelle and Miller2016).
In these previous works, boulder pavements appear near shore platforms and in flat to gently sloped sectors, where clasts/boulders consolidate through their loss of mobility, often influenced by ice mass presence and reworking (Hansom et al. Reference Hansom, Forbes and Etienne2014). Within this main category are morphologies such as those found in sea-ice erosion holes (Fig. 2) or sea-ice erosion corridors (Fig. 3g) that occur on Livingston Island, especially in areas with frequent ice block arrivals from the sea (e.g. Johnsons Dock). Sediments in lower beach sections often display marine signatures, rounded shapes and polished surfaces, in contrast with the finer sediments and sharper clasts occurring at upper inactive sectors near till accumulations.
Isostatic rebound is another crucial coastal factor at Spanish Cove, where ice retreat-induced uplift documented in the South Shetland Islands (Watcham et al. Reference Watcham, Bentley, Hodgson, Roberts, Fretwell and Lloyd2011) progressively exposed former submerged coastal platforms, enabling the differential wave action and sediment sorting patterns observed in the study area. This Holocene sea-level adjustment directly explains the morphological contrasts in different South Shetland Islands sectors. Sally Rocks’ steeper slopes and exposed rocky platforms with evident abrasion reflect higher isostatic exposure rates, and milder abrasion patterns concentrated near Spanish Cove’s boundary promontories such as Polish Bluff indicate spatially variable uplift trajectories across Livingston Island’s southern coast. Present ice mass loss continues to alter topography and coastal dynamics locally. The permanence of sea ice in these regions further modulates these processes, creating significant differences in comparison with non-polar latitudes and even within the South Shetland Islands, where significant variations in seasonal ice between the north and south of the archipelago have been estimated (Hansom Reference Hansom1983). Such glacial-isostatic and sea-ice controls on coastal evolution distinguish polar sectors from mid-latitude settings (Lantuit et al. Reference Lantuit, Overduin, Couture, Wettereich, Aré and Atkinson2012, Irrgang et al. Reference Irrgang, Bendixen, Farquharson, Baranskaya, Eerikson and Gibbs2022).
The contemporary coastal geomorphology reflects climate-driven changes to coastal protection mechanisms. Sea ice and glacial masses contribute to natural shoreline stabilization (Hansom et al. Reference Hansom, Forbes and Etienne2014); however, regional warming (~3°C since 1950) has reduced these protective elements, accelerating exposure to wave and storm impacts (Josey et al. Reference Josey, Meijers, Blaker, Grist, Mecking and Ayres2024). Storm events fundamentally reshape periglacial and paraglacial coastal environments through episodic sediment mobilization and cliff recession, particularly in systems lacking protective sea-ice coverage (Paredes et al. Reference Paredes, Santalices, Sanchíz and Ropero2025). Glacier retreat - notably of Johnsons Glacier at Spanish Cove - exposes new paraglacial surfaces and sediment sources to active erosion, creating landforms not previously subject to intensive marine mobilization. In this environment, coastal transport dynamics are controlled by 1) energy requirements for heterogeneous sediment mobilization, enhanced by accelerated glacier retreat, 2) sediment accumulation near glacier discharge outlets (Torre et al. Reference Torre, Alurralde, Lagger, Abele, Schloss and Sahade2021) and 3) loss of the sea-ice protective effect. These elements lead to unprecedented erosion rates and to the emergence of paraglacial features (Torre et al. Reference Torre, Alurralde, Lagger, Abele, Schloss and Sahade2021).
UAV-based geomorphological mapping and high-resolution coastal monitoring in the South Shetland Islands
The current findings underscore the necessity of high-resolution, site-specific data for understanding polar coast evolution. Although some such data exist for Spanish Cove, expanding UAV and field datasets will enhance analyses of marine and continental process interactions. Recent advances in structure-from-motion photogrammetry deployed via UAVs have enabled the cost-effective acquisition of high-resolution geomorphological data across the South Shetland Islands, providing new opportunities for the systematic mapping and monitoring of complex coastal environments (Román et al. Reference Román, Navarro, Tovar-Sánchez, Zarandona, Roque-Atienza and Barbero2024).
Optimal environmental conditions remain critical; tidal height at image acquisition directly influences geoform visibility in regions such as Spanish Cove. For example, sea-ice erosion holes require image captures at below 0.4 m tidal height, which were achieved during the 2024 UAV survey, enabling clear feature identification. This was not possible with the higher tidal levels of 2022 (Román et al. Reference Román, Navarro, Tovar-Sánchez, Zarandona, Roque-Atienza and Barbero2024), which limited visibility. Similar UAV-based geomorphological surveys across adjacent South Shetland Islands sectors have documented the importance of acquisition timing and environmental parameters for accurate feature detection and landform characterization (Dąbski et al. Reference Dabski, Zmarz, Pabjanek, Korczak-Abshire, Karsznia and Chwedorzewska2017).
The future of coastal sectors in the polar context
The geomorphological characterization of Spanish Cove reveals distinct coastal zonation and differential erosion patterns reflecting the vulnerability of polar coastlines to climate-driven processes. Polar environments are inherently susceptible to accelerated erosion through the loss of protective ice and periglacial stabilization mechanisms (Lantuit et al. Reference Lantuit, Overduin, Couture, Wettereich, Aré and Atkinson2012). The spatial and temporal patterns documented at Spanish Cove - including the extensive boulder pavement (> 11 000 m2), intertidal zonation with differential hardness values decreasing seaward and boulder displacement of 5.6 m over 6 years in Sector B - exemplify these erosion dynamics. The observed coastal retreat, evidenced by infrastructure relocation requirements, remains less severe than in inhabited Arctic settlements facing existential threats (Tanguy et al. Reference Tanguy, Bartsch, Nitze, Irrgang, Petzold and Widhalm2024), yet it provides a critical baseline understanding for predicting polar coastal evolution under accelerated warming.
Both Arctic and Antarctic regions face reduced sea-ice extents and shortened ice cover periods (Purich & Doddridge Reference Purich and Doddridge2023, Josey et al. Reference Josey, Meijers, Blaker, Grist, Mecking and Ayres2024), increasing their exposure to marine energy events that erode and modify coastal characteristics (Barnhart et al. Reference Barnhart, Overeem and Anderson2014, Reid & Massom Reference Reid and Massom2022, Swirad et al. Reference Swirad, Johansson and Malnes2024). For Spanish Cove near BAE-JCI, coastal retreat is especially evident on the eastern beach sector, where base personnel have been required to relocate storage facilities and equipment in response to progressive shoreline erosion, as documented during recent field surveys.
Finally, the lack of a standardized landform classification in Antarctic coastal research contrasts with process-level or periglacial landform schemes (López-Martínez et al. Reference López-Marínez, Serrano, Schmid, Mink and Linés2012, Michel et al. Reference Michel, Schaefer, López-Martínez, Simas, Haus, Serrano and Bockheim2014). Complex, interacting factors complicate coastal landform standardization (Kroon Reference Kroon, Masselink and Gehrels2015). This study offers an initial framework for Antarctic coastal landform characterization, with parallels to Arctic contexts, such as boulder barricades (Gilbert Reference Gilbert1990).
Conclusions
The geomorphological study of Spanish Cove on Livingston Island has led to the detailed identification and characterization of several inherited and active coastal landforms. Their spatial distribution reflects the intricate interplay between marine, cryogenic and continental processes within a highly dynamic polar environment, where clear signs of ongoing coastal erosion have been documented in recent decades.
Widespread boulder pavements in the most exposed parts of Spanish Cove play a key geomorphological role by stabilizing the coastline against tidal forces and wave action. The discovery of circular depressions, most probably formed through sea-ice erosion and rarely documented in Antarctic coastal studies, provides new insights into how ice influences the morphology of the lower intertidal zone. Additionally, changes in rock hardness with elevation and distance from the sea suggest that exposed surfaces undergo differential weathering and erosion, influenced both by the duration of surface exposure and by the intensity of local geomorphic processes.
Multitemporal aerial data reveal notable coastal changes over relatively short timescales. These include shifts in the morphology of the small stream mouth near the BAE-JCI and the movement of large boulders. Such findings highlight how the combined effects of wave action, short-term climate variability and glacial meltwater can drive active and measurable landscape variations, even in polar regions often assumed to be geomorphologically stable.
When considered together, the applied techniques demonstrate that Spanish Cove emerges as a particularly valuable natural laboratory for exploring coastal geomorphic processes in polar environments. In addition to describing the current state of the coastal system, the combined use of geomatic tools, fieldwork and sediment analysis offers key insights into its recent geomorphological evolution. This work provides a strong basis for future monitoring and modelling efforts in the context of accelerating climate change and contributes to the growing repository of data on how polar coastal systems respond to environmental variability.
Acknowledgements
We thank the GEAFROST (Grupo de Estudios en Ambientes Fríos y de Montaña; University of Oviedo) and GEOPAT (Geomorfología, Paisaje y Territorio; University of León) research groups. AG-P’s work contributes to International Geoscience and Geoparks Program (IGCP) Project 725, ‘Forecasting Coastal Change’. We thank the three anonymous reviewers for their constructive comments and valuable suggestions, which greatly improved the quality of this manuscript.
Author contributions
AG-P, AP-A, CG-H, MAdP and JR-F conceived the study. AG-P, AP-A, CG-H, MAdP, GG and JR-F collected information on the field. AG-P, AP-A and CG-H analysed the data. AG-P wrote the original draft. AG-P, AP-A, CG-H, MAdP, MO, GG and JR-F reviewed and edited the text. All authors have read and agreed to the published version of the manuscript.
Financial support
Grants PID2020-115269GB-I00 and CTM2016-77878-P were funded by MCIN/AEI/10.13039/501100011033 and the contracts between Universidad de Alcalá (UAH) and Unidad de Tecnología Marina - Consejo Superior de Investigaciones Científicas (UTM-CSIC) based on Art 83 LOU and Art 60 LOSU, PERMATHERMAL 2021/00381, 2022/00102, 2023/00117 and 2024/00041.
Competing interests
The authors declare none.


 Open access