

1 INTRODUCTION AND MOTIVATION
The Galactic bulge is major component of the Milky Way (MW) Galaxy, morphologically distinct from the disk and halo, composed of mostly old stars with an embedded bar. It is the closest bulge and bar to us and we can study it in greater detail than for any other galaxy, down to individual stars. Not only does the MW bulge provide a way to understand bulges and bars in extra-galactic spiral galaxies, but its population is similar to distant giant elliptical galaxies.
We would, naturally, like to know how the bulge came to be: how did it evolve? Because the chemical element abundance patterns contain a fossil record of past star formation, much could be learned from a study of the bulge chemical composition. However, an impediment to reading this fossil record is that we do not fully understand the nucleogenesis of all the elements. Thus, we must try to simultaneously understand both the mechanisms and astrophysical sites of element synthesis as well as the star-formation history of the bulge.
Because the bulge is situated in a deep gravitational well, compared to the MW disk and halo, and because its stars seem to be mostly old, chemical evolution occurred under different environmental conditions in the bulge. Thus, a comparison of the bulge chemical properties, to those in other locations, offers a way to understand how environment can affect chemical evolution. This should inform us about the sites of nucleosynthesis and clues to how the bulge evolved. Certainly, the chemical evolution models, developed to explain the composition of stars near the sun, should work everywhere.
To address these questions and issues, we must first measure the bulge’s chemical properties; good measurements are the basis for understanding. Once we have good measurements, we need to compare them to something. It would be nice to compare with the output of chemical evolution models, but at the present time, it is more informative to compare to other chemically evolving systems. Here, we compare the bulge chemical composition with the MW thin and thick disks, and then ask how the evolution of these systems could have produced the measured composition differences.
2 A FEW IDEAS IN CHEMICAL EVOLUTION
The idea that the chemical composition of the Galaxy has evolved over time sprang from the identification of metal-poor stars by Chamberlain & Aller (Reference Chamberlain and Aller1951) and the theoretical predictions of Hoyle (Reference Hoyle1946), who proposed that element synthesis occurred in stars and supernova explosions.
The Simple model of chemical enrichment (e.g., Schmidt Reference Schmidt1959; Searle & Sargent Reference Searle and Sargent1972) assumed zero metal starting point, gas in a closed box, consumed by multiple generations of star formation; each generation locked-up some gas in the form of low-mass stars and returned gas enriched in metals from massive stars. The return of metals was assumed to occur instantaneously and the interstellar gas immediately homogenised.
Upon complete consumption of the gas in this model, the metallicity distribution function (henceforth MDF) has a predictable mean and standard deviation. In particular, the mean metallicity of the final MDF is equal to the ratio of the mass of metals produced to mass of gas locked-up in dwarf stars per generation; this parameter is called the yield (Searle & Sargent Reference Searle and Sargent1972). For systems that lose gas or metal-rich ejecta, the yield is lowered; for systems that over-produce low-mass stars the yield is also lowered, whilst for systems that under-produce low-mass stars or over-produce high-mass stars, the yield is increased. In such situations, we often refer to the effective yield. Early comparison of the MDF predicted from the Simple model with metallicity measurements of G-dwarf stars (e.g., Schmidt Reference Schmidt1963) showed that the MW disk has fewer metal-poor stars than expected; this lacuna was called ‘The G-dwarf Problem’. The G-dwarf problem is thought to be due to infall of fresh material (e.g., Larson Reference Larson1972; Pagel Reference Pagel, Beckman and Pagel1989) during the chemical evolution of the MW disk.
The Simple model provides a tight age–metallicity relation, linear for a constant star-formation rate, which occurs when not much of the gas has been consumed.
The factor of two enhancement in [X/Fe] for even-numbered light elements in metal-poor stars of the Galactic halo, has been known for over 50 yr (e.g., Wallerstein Reference Wallerstein1962; Wallerstein et al. Reference Wallerstein, Greenstein, Parker, Helfer and Aller1963; Conti et al. Reference Conti, Greenstein, Spinrad, Wallerstein and Vardya1967). Initially, it was thought that these elements (e.g., O, Mg, Si, S, Ca, Ti) were produced in the α-process, suggested by Burbidge et al. (Reference Burbidge, Burbidge, Fowler and Hoyle1957), by successive addition of α particles. Although alpha-capture in massive stars accounts for 16O and some 24Mg, the remaining 24Mg is produced by carbon burning, whilst Si, S, and Ca are thought to be produced during explosive oxygen burning in core-collapse SNII events (e.g., Woosley & Weaver Reference Woosley and Weaver1995, abbreviated WW95). Thus, ‘alpha element’ is not a very appropriate name.
Tinsley (Reference Tinsley1979) suggested that the observed decline of the [O/Fe] ratio with increasing [Fe/H] (from halo to disk) was due to the delayed addition of iron from Type Ia supernovae (henceforth SNIa), whose progenitors are ⩽ 8 M⊙, to an oxygen-rich composition produced by more massive stars. These massive stars end as core-collapse supernovae (henceforth SNII) with O/Fe yields that increase with progenitor mass (e.g., WW95). A small, but useful, idea is that the frequency of SNIa declines with delay time roughly 1/τdelay; most SNIa occur promptly, in less than 2 Gyr, with a long tail out to 10 Gyr (see Maoz, Sharon, & Gal-Yam Reference Maoz, Sharon and Gal-Yam2010; Greggio, Renzini, & Daddi Reference Greggio, Renzini and Daddi2008).
Matteucci & Brocato (Reference Matteucci and Brocato1990, henceforth MB90) produced a marvellous sketch of the expected [O/Fe] trend with [Fe/H] for stellar systems with different star-formation rates (henceforth SFR). Since infall time scales with $1/\sqrt{\rho}$
, where ρ is the mass density, dense systems collapse more quickly, and have a higher SFR than low-density or loose systems. Thus, at high SFR, expected for bulges and giant elliptical galaxies, MB90 predicted that [O/Fe] remains high to much higher [Fe/H] than than low SFR systems like the solar vicinity or dwarf galaxies. This idea of MB90 provides a useful prediction for the composition of the Galactic bulge, that can constrain the bulge SFR and formation timescale. Figure 1 shows a representation of the MB90 [O/Fe] prediction, and also the sense of the effect due to increased fraction of massive stars. Remarkably, the low [O/Fe] ratios predicted by MB90 for dwarf galaxies is verified (e.g., Shetrone, Côté, & Sargent Reference Shetrone, Côté and Sargent2001; Shetrone et al. Reference Shetrone, Venn, Tolstoy, Primas, Hill and Kaufer2003), although some dwarf galaxies show low [O/Fe] due to IMF modification (e.g., McWilliam, Wallerstein, & Mottini Reference McWilliam, Wallerstein and Mottini2013).
$1/\sqrt{\rho}$
, where ρ is the mass density, dense systems collapse more quickly, and have a higher SFR than low-density or loose systems. Thus, at high SFR, expected for bulges and giant elliptical galaxies, MB90 predicted that [O/Fe] remains high to much higher [Fe/H] than than low SFR systems like the solar vicinity or dwarf galaxies. This idea of MB90 provides a useful prediction for the composition of the Galactic bulge, that can constrain the bulge SFR and formation timescale. Figure 1 shows a representation of the MB90 [O/Fe] prediction, and also the sense of the effect due to increased fraction of massive stars. Remarkably, the low [O/Fe] ratios predicted by MB90 for dwarf galaxies is verified (e.g., Shetrone, Côté, & Sargent Reference Shetrone, Côté and Sargent2001; Shetrone et al. Reference Shetrone, Venn, Tolstoy, Primas, Hill and Kaufer2003), although some dwarf galaxies show low [O/Fe] due to IMF modification (e.g., McWilliam, Wallerstein, & Mottini Reference McWilliam, Wallerstein and Mottini2013).
Matteucci & Brocato (Reference Matteucci and Brocato1990) predicted that the knee in the trend of [O/Fe] with [Fe/H] depends on the SFR: High SFR systems, like bulges and elliptical galaxies, should show enhanced [O/Fe] to high [Fe/H], whilst the low SFR dwarf galaxies show reduced [O/Fe] relative to the Solar vicinity. Also shown is the direction of the [O/Fe] plateau with an enhanced fraction of massive stars, marked as IMF, which over-produce oxygen.

These simple ideas provide a framework for understanding evolution of the Galactic bulge, compared to the solar neighbourhood, by the study of the detailed chemical composition. We may hope to learn how much time it took chemical evolution to build the bulge and what the SFR was. We may also learn whether, or not, the initial mass function (henceforth IMF; Salpeter Reference Salpeter1955) of stars in the bulge was like that in the solar vicinity. Whilst such detailed abundance ratios may elucidate the chemical evolution history of the bulge, and provide a test for these ideas, abundance ratios in the bulge can be used to constrain the sites of nucleosynthesis of various elements, whose origin is uncertain.
The current observational situation for alpha-elements in the solar neighbourhood disk, from analysis of 714 nearby dwarf stars by Bensby et al. (Reference Bensby, Feltzing and Oey2014), is summarised in Figure 2, revealing a situation much more complex than initially considered. Most of the results were previously seen by Reddy et al. (Reference Reddy, Tomkin, Lambert and Prieto2003), Reddy, Lambert, & Allende Prieto (Reference Reddy, Lambert and Allende Prieto2006), and Bensby, Feltzing, & Lundström (Reference Bensby, Feltzing and Lundström2003), Bensby et al. (Reference Bensby, Feltzing, Lundström and Ilyin2005).
[⟨SiCaTi⟩/Fe] for halo (open blue boxes), thick disk (red crosses) and thin disk (filled black circles) stars from Bensby, Feltzing, & Oey (Reference Bensby, Feltzing and Oey2014). Differences and confusion between thick and thin disks are apparent. Kinematically identified thick disk stars plummet in [⟨SiCaTi⟩/Fe] near [Fe/H] = −0.2 dex and merge with the thin disk trend. However, an extrapolation of the alpha-enhanced main thick disk trend of [⟨SiCaTi⟩/Fe] with [Fe/H] seems continue beyond solar [Fe/H], dominated by a sub-sample of thin disk stars.

Figure 2 shows kinematic identifications, at P > 90%, for the halo, thick disk, and thin disk. There is a large dispersion in [α/Fe] for halo stars at a given [Fe/H], probably due to different SNII/SNIa ratios of accreted dwarf galaxies. The stars identified as thick disk have larger [α/Fe] than the thin disk, declining with increasing [Fe/H], but near [Fe/H] = −0.2 dex, the thick disk [α/Fe] declines sharply and merges with the thin disk. These low [α/Fe] thick disk stars could well be misidentified thin disk stars, or simply thin disk stars that suffered kinematic heating to thick disk velocities.
Figure 2 shows a number of intriguing sub-populations. For example, the α-enhanced metal-poor stars with thin disk kinematics could be thick disk stars misidentified as thin disk. However, they may simply be old, α-enhanced, stars but with thin disk kinematics. If this is true, a more accurate name for the thick disk might be the ‘early disk’ or ‘old disk’.
Another unusual sub-population in Figure 2 includes stars identified with thick disk kinematics, but showing low [α/Fe] ratios, similar to most thin disk stars. Whilst these stars may simply be misidentified thin disk stars, taken at face value, it is possible that they reflect the composition of the late thick disk; this might occur in a prolonged evolution of the thick disk, where there was sufficient time to permit late SNIa ejecta to be included in the chemical enrichment. Such a slow-down of thick disk chemical enrichment might be expected after the main MDF peak, by which time a significant fraction of gas had been lost. Another possibility is that these stars formed in the thin disk, but later experienced gravitational interactions that resulted in increased vertical scale heights and kinematics similar to the thick disk.
Finally, the most interesting sub-population in Figure 2 include the kinematically identified thin disk stars with slightly sub-solar [Fe/H], which seem to extrapolate the alpha-enhanced thick disk trend, from lower [Fe/H]. These stars cannot be explained by misidentification and composition measurement error seems highly unlikely. The chemical similarity to the bulge suggests that these stars might be due to radial migration of low-vertical scale height stars from the inner thick disk or bulge.
If these stars have not migrated from inner regions, but are related to the local thick disk, their thin disk kinematics suggests low vertical scale heights and, thus, a vertical metallicity gradient in the thick disk; this may have occurred shortly after the time when thick disk molecular clouds relaxed into thin disk kinematics. Other scenarios, some heretical, may also explain this unusual sub-population of stars.
It appears as if there are two modes of chemical enrichment in the MW disk that are not strictly confined to kinematic sub-populations: the metal-poor α-rich mostly thick disk trend and the metal-rich, low-α mostly thin disk trend. The two populations both show [α/Fe] decline with increasing [Fe/H] suggesting the delayed addition of SNIa iron.
Another inconsistency with simplistic ideas of chemical enrichment, seen in Bensby et al. (Reference Bensby, Feltzing and Oey2014) and Edvardsson et al. (Reference Edvardsson, Andersen, Gustafsson, Lambert, Nissen and Tomkin1993), is the relatively large dispersion in the age–metallicity relation. Whilst metal-rich disk stars are mostly young, older stars cover a large range of [Fe/H] in both MW disks; the tight age–metallicity relations predicted by the simple model is not evident.
For more detailed discussions of chemical evolution, see Pagel (Reference Pagel and Pagel1997) and Matteucci (Reference Matteucci2012).
3 A BRIEF HISTORY OF THE BULGE METALLICITY
The presence of both RR Lyrae stars and M giant stars in the Galactic bulge indicate a large metallicity range, from halo metallicities up to at least the solar value (e.g., Baade Reference Baade1946; Nassau & Blanco Reference Nassau and Blanco1958). Strictly, the word ‘metallicity’ refers to the mass fraction of metals (elements heavier than He), represented as Z. However, in modern times, the abundance of iron relative to the sun, [Fe/H], has been used, interchangeably, with the word ‘metallicity’. The connection is that in order to compute the metallicity, Z, one must scale the solar abundance distribution by a reference element, typically iron, which is easily measured. Here, I will use an imprecise meaning of the word, generally correlated with overall Z or [Fe/H].
The seminal work of Rich (Reference Rich1988) provided the first metallicity estimate for the bulge from low-resolution stellar spectra of 88 bulge K giants in Baade’s Window, at b = −3.9°; he found a mean [Fe/H] of + 0.3 dex; 1σ measurement uncertainties were 0.20 dex. This was not a model atmosphere abundance analysis, but rather a correlation of the equivalent widths (henceforth EWs) of prominent Fe, Mg, and Na optical features versus (J − K) colour, calibrated against high-resolution model atmosphere abundance results from solar neighbourhood stars.
Terndrup (Reference Terndrup1988) used BVI photometry to estimate the bulge metallicity, at latitudes ranging from − 4° to − 10°, that relied upon colour-metallicity calibrations from detailed abundance analyses of solar neighbourhood stars. Terndrup claimed mean solar [Fe/H] in Baade’s Window, and a decrease in [Fe/H] by 0.5 dex for the highest latitude field, i.e., a vertical metallicity gradient in the bulge.
Rich (Reference Rich1990) showed that the metallicity distribution of his 88 bulge K giants compared well with the predicted MDF of the Simple Closed-Box model of Searle & Sargent (Reference Searle and Sargent1972). This was unlike the MDF of the solar neighbourhood, which shows a distinct deficit of metal-poor stars, known as ‘The G-Dwarf Problem’ (van den Bergh Reference van den Bergh1962; Schmidt Reference Schmidt1963). Thus, it appeared that the bulge did not suffer from the G-Dwarf Problem seen in the MW disk. Presumably, chemical evolution in the bulge was not affected by significant, prolonged, infall of metal-free gas, unlike the MW disk.
Geisler & Friel (Reference Geisler and Friel1992) used the Washington photometric system to estimate the metallicity of 314 G and K giants in Baade’s Window, giving a mean [Fe/H] of + 0.17 ± 0.15 dex; they also confirmed a very good fit of their MDF to a closed-box model of chemical evolution.
McWilliam & Rich (Reference McWilliam and Rich1994, henceforth MR94) were the first to attempt model atmosphere chemical abundance analysis of bulge stars, for 11 K giants in Baade’s Window, with R = 17 000 echelle spectra. From only 11 [Fe/H] values of the brightest bulge K giants, a true iron distribution function (IDF) could not be measured, but a calibration against the Rich (Reference Rich1988) metallicities suggested a low mean [Fe/H] of − 0.25 dex.
Minniti et al. (Reference Minniti1995) obtained R ~ 2 000 spectra of bulge giants at 1.5–1.7 kpc from the Galactic centre and determined metallicities using a similar method to Rich (Reference Rich1988). By combining previous photometric and spectroscopic metallicity estimates, Minniti et al. (Reference Minniti1995) showed convincing support for the vertical metallicity gradient claimed by Terndrup (Reference Terndrup1988).
Sadler, Rich, & Terndrup (Reference Sadler, Rich and Terndrup1996) measured line-strength indices, from R ~ 1 000 spectra, of 400 K and M giant stars in Baade’s Window. A correlation of the indices against [Fe/H] from solar neighbourhood giants resulted in an average [Fe/H] of − 0.11 ± 0.04 dex for the bulge.
High resolution (R = 45 000 and 67 000) echelle spectra of 25 bulge and two non-bulge K giants in Baade’s Window, by Fulbright, McWilliam, & Rich (Reference Fulbright, McWilliam and Rich2006; Reference Fulbright, McWilliam and Rich2007 henceforth FMR06, FMR07) performed model atmosphere abundance analysis, improving upon MR94. The average difference of MR94 minus FMR07 [Fe/H] values was 0.02 dex, but for the six stars above [Fe/H] = −0.34 dex, FMR07 were higher, on average, by 0.05 dex. Since 25 [Fe/H] measurements of bright bulge K giants is still too few (and too biased) to measure the bulge IDF, FMR06 correlated their [Fe/H] measurements against the Sadler et al. (Reference Sadler, Rich and Terndrup1996) and R88 metallicities, and found a mean Baade’s Window [Fe/H] of − 0.10 ± 0.04 dex.
Zoccali et al. (Reference Zoccali2008) performed model atmosphere abundance analysis on high-resolution spectra of 800 bulge K giants at three latitudes. They found a large range of [Fe/H], from − 1.5 to + 0.5 dex, a mean near the solar [Fe/H], and confirmed the vertical metallicity gradient, at 0.6 dex kpc−1, previously found by Minniti et al. (Reference Minniti1995) and Terndrup (Reference Terndrup1988). Although Gonzalez et al. (Reference Gonzalez2011) focussed on alpha-element trends, their [Fe/H] values agreed with this vertical metallicity gradient (see also Uttenthaler et al. Reference Uttenthaler2012).
The preceding methods all measured, or estimated, the compositions of mostly bright bulge K giants, but resulted in a selection bias against the most metal-rich stars. Metal-rich giants form TiO more readily in their atmospheres than metal-poor giants, particularly for the coolest, most evolved, giants at high luminosity. Thus, whilst bright K giants are more amenable for high resolution abundance analysis, they systematically sample the low side of the MDF. This problem is exacerbated by increased TiO blanketing, due to the enhancement of Ti, in solar metallicity bulge stars. The solution to this bias is to study the chemical composition of Red Clump (henceforth RC) giant stars, since they are considerably warmer than the cool K and M giants, yet the RC samples all metallicities. The small scatter in RC luminosities reduces the chance of foreground contamination from the disk, which is a problem for bright K giants.
The excellent study by Hill et al. (Reference Hill2011), based on high-resolution spectra of 219 RC stars in Baade’s Window included [Fe/H] and [Mg/H] measurements. The RC stars allowed improved bulge identification and more fully encompassed the bulge metallicity range, compared to luminous K giants of some previous studies. They found an asymmetric [Fe/H] distribution, with mean and median values of + 0.05 and + 0.16 dex, respectively. This asymmetric [Fe/H] distribution was decomposed into two Gaussian components, with average [Fe/H] centred at − 0.30 and + 0.32 dex. A Simple closed-box model consisting of two components fit the results. Hill et al. (Reference Hill2011) also speculated that the bulge vertical metallicity gradient could be explained by the changing dominance of one sub-population to the other with increasing latitude.
G15 measured [Fe/H] from high-resolution spectra of 400 bulge RC stars, near b = −4°, at four positions in longitude between l = −10° to + 10°. They found no variation in the IDF with longitude. The global IDF was well fit by two Gaussians, with average [Fe/H] = −0.31 and + 0.26 dex, similar to the Hill et al. (Reference Hill2011). The combined IDF from the Hill et al. (Reference Hill2011) and G15 RC results are presented in Figure 3.
A comparison of the [Fe/H] distribution function in the solar neighbourhood (blue-filled histogram) for stars within 15 pc from Allende Preito et al. (2004, scaled to the peak number of bulge stars) compared to RC stars in the bulge, at b = −4° (red-filled histogram), from Gonzalez et al. (Reference Gonzalez2015) and Hill et al. (Reference Hill2011). The average and median separations are 0.19 and 0.28 dex, respectively.

The [Fe/H] distribution for RC stars over multiple b = −4° fields, shown in Figure 3, indicate a mean [Fe/H] of + 0.06 dex, but a median [Fe/H] of + 0.15 dex; the difference is due to the asymmetry towards the metal-poor sub-population. The solar neighbourhood histogram in Figure 3 is from the study of 118 stars within 15 pc of the sun (nearly all dwarfs) by Allende Prieto et al. (Reference Prieto, Barklem, Lambert and Cunha2004) and dominated by the thin disk; both the mean and median [Fe/H] are − 0.13 dex. In Figure 3, the number of stars in the solar neighbourhood sample has been scaled up by a factor of 3.4 so that the peak bin matches the bulge sample.
Casagrande et al. (Reference Casagrande, Ramírez, Meléndez, Bessell and Asplund2010) revised the photometric temperature scale for dwarf stars up by 100 K, from the Alonso, Arribas, & Martínez-Roger (Reference Alonso, Arribas and Martínez-Roger1999) temperature scale employed by in the solar neighbourhood study of Allende Prieto et al. (Reference Prieto, Barklem, Lambert and Cunha2004). However, Allende Prieto et al. (Reference Prieto, Barklem, Lambert and Cunha2004) found good agreement of their photometric T eff values with those computed from Hβ line profiles. An increase in T eff of 100 K typically results in an increase in [Fe/H] by ~ 0.1 dex.
From a recalibration of the Strömgren photometric system, based on their higher temperature scale, Casagrande et al. (Reference Casagrande2011) found the median [Fe/H] of solar neighbourhood stars at − 0.05 dex, some 0.08 dex higher than the Allende Prieto et al. (Reference Prieto, Barklem, Lambert and Cunha2004) result. If this correction is applied, then the b = −4° bulge average and median [Fe/H] values are higher than the nearby thin disk by + 0.11 dex and + 0.20 dex, respectively.
The [Fe/H] abundance ratios for the 58 lensed bulge dwarf stars, studied by Bensby et al. (Reference Bensby2013), reveal remarkably similar IDF envelope to the RC giants in Hill et al. (Reference Hill2011). A larger sample of lensed dwarf stars would enable more detailed comparison, particularly for the position of the [Fe/H] peaks of sub-populations.
From R = 11 000 spectra of 28 000 mostly RC stars in various bulge fields, Ness et al. (Reference Ness2013) found [Fe/H] ranging from − 2.8 to + 0.6 dex. Multiple [Fe/H] sub-populations were identified, with the three most prominent at [Fe/H] = + 0.15, − 0.25, and − 0.71 dex for a latitude of b = −5°; at this latitude, the median [Fe/H] is − 0.12 dex. Whilst the peaks of these individual sub-populations vary slowly with latitude, the overall vertical metallicity gradient is obtained due the changing proportions with latitude, similar to the suggestion of Hill et al. (Reference Hill2011). Based on the change in median [Fe/H] of their b = −5° field, at − 0.12 dex, to − 0.46 dex for their b = −10° field, and a Galactic centre distance of 8.0 kpc, a vertical [Fe/H] gradient of 0.48 dex kpc−1 is obtained, quite similar to Zoccali et al. (Reference Zoccali2008), who obtained 0.6 dex kpc−1. See Ness & Freeman (Reference Ness and Freeman2016, this volume) for a further discussion of their bulge MDF and APOGEE results.
The MDF as measured by the [Mg/H] distribution offers the advantage that Mg is dominated by SNII progenitors, whose lifetimes are relatively short. Therefore, with Mg there is no need to account for production on long timescales, as occurs with the delayed production of Fe from SNIa; thus, Mg chemical enrichment is closer to the instantaneous recycling approximation than Fe.
In Figure 4, the separation in [Mg/H] between the solar neighbourhood and bulge at b = −4° is even greater than for [Fe/H]; the average and median [Mg/H] of the bulge are 0.24 and 0.33 dex higher, respectively, than solar neighbourhood. These differences are much larger than the possible 0.08 dex correction expected if the hotter temperature scale of Casagrande et al. (Reference Casagrande, Ramírez, Meléndez, Bessell and Asplund2010, Reference Casagrande2011) had been used in the Allende Prieto et al. (Reference Prieto, Barklem, Lambert and Cunha2004) analysis of nearby thin disk stars.
A comparison of the [Mg/H] distribution function in the solar neighbourhood (blue-filled histogram) for stars within 15 pc from Allende Preito et al. (2004, scaled to the peak number of bulge stars) compared to RC stars in the bulge, at b = −4° (red-filled histogram), from Gonzalez et al. (Reference Gonzalez2015) and Hill et al. (Reference Hill2011). The average and median separations are 0.24 and 0.33 dex, respectively.

These plots show that the bulge yield of Fe and Mg are significantly higher than the in MW thin disk. Clearly, with the MW thick disk mean [Fe/H] at − 0.7 dex (Gilmore, Wyse, & Jones Reference Gilmore, Wyse and Jones1995), the bulge yield also exceeds the thick disk’s.
3.1. Bulge alphas overview
An overview of some of the features of the bulge [α/Fe] trends are displayed in Figure 5, inspired by a plot from Johnson et al. (Reference Johnson, Rich, Kobayashi, Kunder and Koch2014). This figure shows three elements (O, Mg, and Al) principally made in the hydrostatic phase of massive stars, and two elements (Si and Ca) mostly produced during explosive nucleosynthesis of SNII events, although some small production also occurs in SNIa events. Thus, O and Mg are hydrostatic alpha-elements whilst Si, S, Ca, Ti are explosive alpha-elements. Significant production of Al, Na, and Cu occurs in massive star progenitors to SNII events, synthesised in hydrostatic phases, so they are hydrostatic elements; notably, their production is thought to be sensitive to metallicity (e.g., WW95; Nomoto et al Reference Nomoto, Tominaga, Umeda, Kobayashi and Maeda2006).
A plot inspired by Johnson et al. (Reference Johnson, Rich, Kobayashi, Kunder and Koch2014), showing [α/Fe] versus [Fe/H] in the bulge for O, Mg, Al, Si, and Ca. All five elements are enhanced by ~ 0.15 dex at [Fe/H] = 0.0 dex, and all trends show the classic decline in [α/Fe] with increasing metallicity, but the [O/Fe] range is greater than the other alphas. Aluminum shows a clear alpha-like trend, consistent with its production in massive stars.

Obvious in Figure 5 is the fact that all five elements are over-abundant in [X/Fe] at lower metallicity and decline roughly linearly with increasing [Fe/H], similar to the alpha-element trends seen from MW halo to thick and thin disks. At [Fe/H]=0.0, all five elements are overabundant, by ~ 0.15 dex, suggesting a higher SFR in the bulge than the solar neighbourhood.
The use of [Al/Fe] as a reference in Figure 5 shows that Mg, Si, and Ca have roughly the same trends in the bulge, and also that [Al/Fe] displays an alpha-like trend. Whilst Al is not often appreciated to be an alpha-element, its alpha-like trend reflects the fact that it is mostly produced by massive stars. The alpha-like trend for Al is also seen in the MW thick and thick disk abundance results of Bensby et al. (Reference Bensby, Feltzing, Lundström and Ilyin2005) and Reddy et al. (Reference Reddy, Lambert and Allende Prieto2006). Notably, the predicted metal-dependent Al yields (e.g., Arnett Reference Arnett1971; WW95) are not apparent in the [Al/Fe] trend seen in the bulge.
Finally, the low-metallicity [O/Fe] ratio in the bulge is higher than the other four elements, and declines more steeply, in Figure 5. Although the Johnson et al. (Reference Johnson, Rich, Kobayashi, Kunder and Koch2014) [O/Fe] are slightly higher than other studies, and their measurement uncertainties larger, all show this effect, indicating that O behaves differently and must have evolved differently.
3.2. Oxygen
The first bulge oxygen abundances, measured by MR94 for six bulge K giants, were quite noisy due to the low resolution (R ~ 17 000), low S/N, spectra, blending with an Sc II line and lack of identifiable continuum. The [O/Fe] ratios also suffered from a 0.20 dex zero-point error, due to the high solar oxygen abundance reference (Anders & Grevesse Reference Anders and Grevesse1989). The average [O/Fe] from MR94, corrected for the zero-point systematic error, near + 0.3 dex, is roughly consistent with present-day values.
McWilliam & Rich (Reference McWilliam, Rich, McWilliam and Pasadena2004, henceforth MR04) performed a high-resolution (R ~ 35 000–60 000), model atmosphere, abundance analysis of 10 bulge RGB stars. The [O/Fe] results were arguably consistent with the MW thick disk for metallicities below solar. Above solar [Fe/H], the [O/Fe] values appeared to plummet, as if no further oxygen production occurred above [Fe/H] = −0.5 dex. The data used by MR04 was a subset of FMR07, ultimately re-analysed by McWilliam, Fulbright, & Rich (Reference McWilliam, Fulbright, Rich, Cunha, Spite and Barbuy2010; henceforth MFR10). However, the re-analysis by MFR10 gave higher [O/Fe] than MR04 for the super-metal-rich (henceforth SMR) stars, and the steep, zero-oxygen production, slope claimed by MR04 was not evident.
Rich & Origlia (Reference Rich and Origlia2005) performed the first detailed abundance study of 14 bulge M giant stars in Baade’s Window, using R = 25 000 Keck-NIRSPEC spectra at 1.5–1.8μm. The M giants covered a relatively narrow range in [Fe/H], with the mean [Fe/H] at − 0.19 dex, and no stars above [Fe/H] = −0.03 dex. Their [O/Fe] ratios, with oxygen abundances derived from OH lines, were uniformly high, with a 1σ scatter of 0.07 dex, and a mean value of ⟨[O/Fe]⟩ = +0.32 ± 0.02 dex. The location of the mean fits very well with the present-day results shown in Figure 6. Similar enhancements of [O/Fe] and [Ti/Fe] were also found using near-IR echelle spectra of a handful of Baade’s Window RGB stars by Cunha & Smith (Reference Cunha and Smith2006).
Top panel: [O/Fe] versus [Fe/H] in the Galactic bulge. Green filled circles: Johnson et al. (Reference Johnson, Rich, Kobayashi, Kunder and Koch2014) RC stars at R ~ 22 000; blue crosses: giants from Lecureur et al. (Reference Lecureur2007), at R ~ 47 000; filled red triangles: McWilliam et al. (Reference McWilliam, Fulbright, Rich, Cunha, Spite and Barbuy2010) re-analysis of Fulbright et al. (Reference Fulbright, McWilliam and Rich2007) EWs for RGB stars at R > 45 000; filled blue squares: Bensby et al. (Reference Bensby2013) lensed dwarfs at R > 40 000. Bottom panel: [O/Fe] versus [Fe/H] in the thick disk (crosses) and thin disk (filled circles), from Bensby et al. (Reference Bensby, Feltzing, Lundström and Ilyin2005). The thick/thin disk lines, reproduced in the top panel, are estimated, not fit.

Zoccali et al. (Reference Zoccali2006) performed a high-resolution detailed abundance study of [O/Fe] versus [Fe/H] for 50 bulge K giants using S/N=50, R = 45 000, VLT UVES spectra. Like all optical studies, they employed the [O I] line at 6300 Å, a line that is very robust against deviations from LTE. Zoccali et al. (Reference Zoccali2006) found [O/Fe] declining with increasing [Fe/H], parallel to the MW thick disk trend, but enhanced by ~ 0.10 dex.
FMR07 and Lecureur et al. (Reference Lecureur2007) measured [O/Fe] for bulge giant stars in Baade’s Window. Both studies employed high resolving power (R ~ 45 000 to 67 000) spectra, and both reached similar conclusions: that [O/Fe] is over-abundant in Baade’s Window bulge stars relative to both the MW thin and thick disks; the [O/Fe] trend decreases with increasing [Fe/H], parallel to, but enhanced by ~ 0.1 dex compared to the MW thick disk trend, similar to the results of Zoccali et al. (Reference Zoccali2006).
An important point is that the FMR07 study employed a line-by-line differential abundance technique, relative to the nearby red giant α Boo.
Meléndez et al. (Reference Meléndez2008), based on high resolving power near-IR spectra, R = 50 000, at 1.55 μ, combined with published EWs from the optical spectra of FMR07. Meléndez et al. (Reference Meléndez2008) also acquired spectra of MW thick and thin disk RGB stars for comparison, using the same spectrograph. Whilst Meléndez et al. (Reference Meléndez2008) found a mean difference with the [O/Fe] of FMR07 of + 0.03 ± 0.13 dex, their [O/Fe] trend was consistent with the MW thick disk. Inspection of the results shows that the FMR07 bulge stars near [Fe/H] = −0.5 dex are near [O/Fe] ~ +0.5 and ~ 0.10 dex higher than the thick disk comparison, whereas for Meléndez et al. (Reference Meléndez2008) the bulge stars are only marginally higher than the thick disk. At solar [Fe/H], Meléndez et al. (Reference Meléndez2008) and FMR07 found [O/Fe] ~ +0.2 dex, whilst Lecureur et al. (Reference Lecureur2007) and MFR10 found [O/Fe] ~ 0.10 dex.
Meléndez et al. (Reference Meléndez2008) found that the choice of model atmosphere [α/Fe] ratio has a significant effect on the derived [O/Fe] ratio, with a difference in [α/Fe] = +0.2 dex leading to an increase in [O/Fe] of ~ 0.1 dex.
A re-analysis of the FMR07 EWs by MFR10 found that the [O/Fe] trend with [Fe/H] in bulge RGB stars, is indeed, consistent with the MW thick disk, as claimed by Meléndez et al. (Reference Meléndez2008).
The chemical composition of 58 microlensed bulge dwarf and subgiant stars were measured by Bensby et al. (Reference Bensby2010, Bensby et al. Reference Bensby2013; henceforth B13), using R = 40 000, S/N ~ 50, UVES VLT spectra. Notably, B13 employed published non-LTE corrections to Fe and O abundances (e.g., Lind, Bergemann, & Asplund Reference Lind, Bergemann and Asplund2012). The oxygen abundance measurements employed the allowed O I triplet lines at 7772, 7774, and 7775Å, with excitation potential of the lower level of 9.14 eV. These lines are sensitive to the adopted temperature, arising from a small fraction of the total oxygen population; Thus, the correction for non-LTE effects is important. Because the solar lines are used in the calibration, the differential non-LTE corrections, relative to the sun, are more important than the absolute non-LTE corrections.
The 6 300 Å [O I] lines in the B13 dwarf stars are too weak for reliable abundance measurement, at the S/N of the spectra; furthermore, the Ni I blend has a significant impact on the derived abundance. This is unlike the situation for RGB stars, where the [O I] line is stronger (30–60 mÅ) and the Ni I blend is negligible, by comparison.
B13 claimed that their bulge alpha-element abundance ratios show trends that are similar to the nearby thick disk, but the knee in the alpha-trends (other than oxygen) occur at a higher [Fe/H], by ~ 0.10 dex, than the local thick disk (near [Fe/H] = −0.3 to − 0.2 dex). The B13 results indicate that the [O/Fe] knee occurs near [Fe/H] = −0.6 dex, followed by a steep, linear, decline with [Fe/H]. Although the decline in [O/Fe] versus [Fe/H] is steep, the slope is shallower than would result if no oxygen had been produced.
Johnson et al. (Reference Johnson, Rich, Kobayashi, Kunder and Koch2014; henceforth J14) analysed S/N=70, R=20 000, GIRAFFE fibre spectra of 156 RGB and RC stars at (l, b)=( + 5.25, −3.02) and (0, − 12), employing both spectrum synthesis and EW abundance analysis techniques. Like other abundance studies of evolved bulge stars, oxygen abundances were derived from the [O I] line at 6 300 Å. Given the relatively low spectral resolution, which results in line blending and poor continuum definition, it is not surprising that the dispersion in element abundances is greater than other studies at higher resolving power; in particular, the scatter is relatively large above [Fe/H]=0.00. Still, the work was expertly done and the results remarkably similar to other studies. The [O/Fe] values form a plateau near [O/Fe] = +0.55 dex below [Fe/H] ~ −0.25 dex, followed by a decline in [O/Fe] with increasing [Fe/H]. The knee in the plateau is located at a higher [Fe/H] than the thick disk plateau, indicating a high SFR and rapid chemical enrichment timescale. This high-metallicity knee is similar to the general alpha-element trends found by B13, but at higher [Fe/H] than Bensby et al.’s oxygen plateau. It is notable that both fields in J14 show the same [X/Fe] trends with [Fe/H], although the stars in the b = −12° field have lower overall [Fe/H] than the b = −3° field, consistent with the vertical metallicity gradient.
The results of J14 indicate [O/Fe] = ~ + 0.2 dex at solar metallicity; however, there is considerable scatter above [Fe/H]=0.00, which confuses this value. The [O/Fe] ratio appears to decline from + 0.55 to roughly 0.00 dex between [Fe/H] = −0.25 and + 0.20; although, an intercept with solar composition at [Fe/H] = +0.30 dex is not unreasonable. If the latter is true, then there appears to be no production of oxygen above [Fe/H] = −0.25 dex. If the steeper [O/Fe] slope is correct, then the composition at [Fe/H] = −0.25 is not related to that at [Fe/H] = +0.20 dex, or there is a systematic measurement error.
Taken at face value, the simplest interpretation of the J14 [O/Fe] trend is that oxygen production in the bulge ceased after [Fe/H] = −0.25 dex, similar to the suggestion of MR04. However, the scatter in J14 and the revision of the MR04 scale by MFR10 suggests that such excessively steep [O/Fe] slopes are due to measurement error about the already steep slope.
A visual summary of the observational situation for the bulge [O/Fe] trend, and comparison with the MW thick and thin disks, is shown in Figure 6. The top panel shows measured [O/Fe] ratios in bulge RGB stars from J14, FMR10 and Lecureur et al. (Reference Lecureur2007) and the lensed bulge dwarfs of B13. The lower panel shows [O/Fe] for dwarf stars in the MW thick and thin disks measured by Bensby et al. (Reference Bensby, Feltzing, Lundström and Ilyin2005). Lines in the lower panel of Figure 6, showing the approximate trends for thick and thin disks, are reproduced in the upper panel for comparison with the bulge trend. Obviously, as first found by Meléndez et al. (Reference Meléndez2008), the bulge [O/Fe] trend follows that of the thick disk, and lies roughly 0.15 dex above the thin disk trend; indeed, the trend line shows that, at solar [Fe/H], the thick disk [O/Fe] is + 0.16 dex. Note that the thick disk [O/Fe] trend above solar [Fe/H] is not clear: A few putative thick disk stars lie co-incident with the thin disk line at [Fe/H] ~ +0.2 dex; but, are these really from thick disk, or simply mis-identified thin disk members? On the other hand, the bulge stars seem to continue a linear decline of [O/Fe] versus [Fe/H] up to [Fe/H] ~ + 0.5 dex, passing through solar [O/Fe] near [Fe/H]= + 0.25 dex. The SMR bulge stars lie above the thin disk trend, but the separation from the thin disk trend here is smaller than at sub-solar [Fe/H]. Future, improved measurements of [O/Fe] versus [Fe/H] up to [Fe/H] ~ +0.5 dex would be useful for understanding whether the bulge approaches the thin disk trend at high metallicity.
Inspection of Figure 6 suggests that a metal-poor plateau of [O/Fe] exists near + 0.52 dex; but, the data are consistent with a mean ranging from + 0.47 to + 0.57 dex. Notwithstanding, a handful of the B13 lensed dwarfs show [O/Fe] near + 0.60 dex. It is notable that the range of the [O/Fe] plateau in the bulge is similar to the two most metal-poor stars in the Bensby et al. (Reference Bensby, Feltzing, Lundström and Ilyin2005) thick disk sample. However, [O/Fe] measurement of thick disk stars by Nissen et al. (Reference Nissen, Primas, Asplund and Lambert2002) and Ramírez, Allende Prieto, & Lambert (Reference Ramírez, Allende Prieto and Lambert2013) find [O/Fe] of + 0.47 and + 0.45 dex, respectively, for the plateau between [Fe/H]= − 1 to − 2 dex. To avoid a confusing figure, we do not show these results in Figure 6. Thus, whilst the bulge and thick disk [O/Fe] plateaus agree to within reasonable systematic measurement uncertainties, it appears that the average [O/Fe] of bulge plateau stars is 0.05 dex higher than for the thick disk, but the bulge could be 0.10 dex higher, mostly due to the high values of J14. Clearly, improved [O/Fe] measurements of the plateau is desirable.
In the context of the SNIa time-delay scenario of Tinsley (Reference Tinsley1979) and MB90: if the [O/Fe] plateau in bulge and thick disk are the same, then the IMF of the bulge and thick disk are equal. However, the plateau difference of 0.05 dex suggests that, in fact, the bulge IMF included slightly more massive stars than the thick disk, but the [O/Fe] difference is within measurement uncertainties. The plateau difference is not enough to explain the observed bulge/thick disk [O/Fe]= + 0.16 dex at solar [Fe/H], and why the bulge does not reach solar [O/Fe] until [Fe/H] near + 0.25 dex. From these measurements, the SNIa time-delay idea (see Figure 1) suggests that the SFR during bulge and thick disk evolution must have been higher than the thin disk, and the formation timescale correspondingly shorter. In this way, the bulge [O/Fe] ratios indicate that the bulge chemical enrichment timescale was faster than for the thin disk, but similar to the thick disk (although the thick disk stopped forming stars near solar [Fe/H]).
As discussed later, an important feature of the [O/Fe] trend in the bulge, especially evident in the B13 results, and indeed, the MW thin and thick disks, is that oxygen has a larger [X/Fe] decline with metallicity than other alpha elements. This cannot occur in the SNIa time-delay scenario if alpha-element [X/Fe] ratios decline only by the addition of Fe from SNIa; an additional mechanism must be at work. Two possible methods for this extra [O/Fe] decline are (1) reduction of the O yield via stellar wind mass-loss, and (2) a steepening of the upper-end of the IMF with increasing metallicity.
3.3. Magnesium
Like oxygen, it is thought that most magnesium production is associated with SNII events, during the hydrostatic evolution of the progenitor star. Thus, the evolution of both Mg and O should follow the expectations of the SNIa time-delay scenario of Tinsley (Reference Tinsley1979) and MB90. For this reason, the trend of [Mg/Fe] with [Fe/H] should depend on the bulge SFR.
Beginning with MR94, Lecureur et al. (Reference Lecureur2007), FMR07 and through to today’s excellent bulge Mg abundance studies by Hill et al. (Reference Hill2011), J14 and Gonzalez et al. (Reference Gonzalez2015, henceforth G15), [Mg/Fe] has been found to be enhanced relative to the thick and thin disks, defined by dwarf stars. The earlier studies compared to the Edvardsson et al. (Reference Edvardsson, Andersen, Gustafsson, Lambert, Nissen and Tomkin1993) MW disk dwarf star results, rather than the MW disk dwarfs of Bensby et al. (Reference Bensby, Feltzing, Lundström and Ilyin2005, Reference Bensby, Feltzing and Oey2014); notably, MR94, Lecureur et al. (Reference Lecureur2007), and FMR07 also over-estimated the size of the bulge Mg enhancements.
The [Mg/Fe] ratios measured by all MW bulge studies show enhancements at low metallicity, and a decline with increasing [Fe/H]. However, there is an unsatisfactory range in the reported [Mg/Fe] ratios; in particular, the results of FMR07 are higher than more recent studies (e.g., G15, J14).
In the FMR07 abundance tablesFootnote 1 [Mg/Fe] for stars below [Fe/H]= − 1 have a mean near + 0.46 dex; subsequently, there is a very shallow decline in [Mg/Fe] as [Fe/H] increases to ~ −0.3 dex. From [Fe/H]= − 0.3 to + 0.1 dex, [Mg/Fe] drops sharply, slightly above the MW thick disk trend. Finally, for the five SMR stars in FMR07 with [Fe/H] ~ +0.2 to + 0.5 dex, the mean reported [Mg/Fe] values is + 0.28 dex.
In contrast to FMR07, the bulge [Mg/Fe] trend defined by J14 and G15 (see Figure 7) shows [Mg/Fe] ~ +0.37 dex for the metal-poor stars, flat up to roughly [Fe/H]= − 0.6 dex, followed by a linear decline towards increasing metallicity. At solar metallicity, the mean G15 and J14 [Mg/Fe] ratio is + 0.15 dex. Thus, the J14 and G15 [Mg/Fe] ratios are lower than FMR07 at low [Fe/H] by 0.09 dex; but, at the metal-rich end, for stars near [Fe/H] ~ +0.5 dex, the J14 and G15 points are lower than the original FMR07 values by ~ 0.20 dex.
Top Panel: [Mg/Fe] versus [Fe/H] in the Galactic bulge. Small black crosses: RC star results from Gonzalez et al. (Reference Gonzalez2015), at R ~ 22 000; filled red squares: Fulbright et al. (Reference Fulbright, McWilliam and Rich2007) RGB stars at R > 45 000, including a − 0.07 dex zero-point correction (this work); filled red triangle: re-analysis (this work) of I-025 RGB star from data from Fulbright et al. (Reference Fulbright, McWilliam and Rich2007); other symbols are the same as Figure 6. Bottom Panel: [Mg/Fe] versus [Fe/H] for MW thin disk (black filled circles) and thick disk (large black crosses) from Bensby et al. (Reference Bensby, Feltzing, Lundström and Ilyin2005). Halo and thick disk stars (green crosses) and thin disk stars (filled red circles) are from Reddy et al. (Reference Reddy, Lambert and Allende Prieto2006). The black line is the estimated linear trend for the thick disk from the Bensby et al. (Reference Bensby, Feltzing, Lundström and Ilyin2005) results, reproduced in the top panel.

In order to understand the difference between FMR07 and J14/G15 [Mg/Fe] trends, for this review, I have investigated the FMR07 results, using original spectra. In particular, I re-consider the analyses for the Arcturus standard star and for bulge star I-025, with [Fe/H] values near − 0.5 and + 0.5 dex, respectively.
In the re-analysis, I find [Mg/Fe]= + 0.32 dex for Arcturus, which is lower than FMR07 by 0.07 dex and higher than the J14 result by 0.02 dex. Since FMR07 employed Arcturus as a standard, this removes a zero-point difference of 0.09 dex between FMR07 and J14 [Mg/Fe] ratios. This change is mostly due to the strongly damped wings of the Mg I lines in the sun, used in the line-by-line differential abundance analysis of Arcturus relative to the sun. Because of the absence of damping constants for their Mg I lines, the Unsöld Van der Waals damping constants were default in FMR07; but the Unsöld damping constants for the red Mg I lines used by FMR07 under-predict the wings in the solar spectrum.
An important Mg I abundance indicator, employed by several bulge studies, is the 6319Å triplet, which is, unfortunately, blended with a very broad, shallow, Ca I auto-ionising line. For giant star spectra, the Ca I auto-ionisation line profile can be reasonably well treated as a pseudo-continuum, in which the Mg I lines sit, and an EW abundance analysis, as performed by FMR07, give good results. This works well for the bulge giants and the FMR07 standard star, Arcturus. However, in the solar spectrum, the local pseudo-continuum merges the wide Mg I line wings into the Ca I auto-ionising line profile, resulting in a degeneracy between Mg and Ca profiles. In a pseudo-continuum analysis, the depth of the Mg I lines is under-estimated in the sun, leading to an over-estimate of the Mg abundance of Arcturus relative to the sun. Unfortunately, the Ca I auto-ionising line wavelengths and damping constants are only approximately known (e.g., Newsom Reference Newsom1968), resulting in additional covariances.
In the re-analysis performed here, the Ca I auto-ionisation line is treated properly in the LTE line radiative transfer code (i.e., no pseudo-continuum). I find a reasonable fit to the solar Ca I auto-ionisation line profile using a wavelength of 6318.209Å, a radiative damping constant Γ=1.095 × 10¹² s−1, and log gfε=6.52. Notably, the Mg I 6319Å triplet Van der Waals line damping constants are not known and even the log gf values are highly uncertain. I employed log gfε=5.567, 5.346, and 4.867 dex for the solar Mg I lines at 6318.72, 6319.24, and 6319.50 Å, respectively, with Barklem damping constants copied from the Mg I line at 9255.78 Å, which has a similar upper-level energy.
Strongly damped wings are very obvious for most Mg I lines in the red region of the solar spectrum. For these lines, the upper level of the transition is close to the ionisation potential; thus, the electron orbits are large, leading to an enhanced collision cross-section. This results in a high collisional rate and strong damping at the density of the solar atmosphere, but not for the relatively thin RGB atmospheres. For such lines, the strong solar line wings can depress the local continuum and/or be mistaken for blending features. In these cases, the EW of the solar Mg I lines may easily be under-estimated, whilst in Arcturus and bulge giant spectra these difficulties do not arise, due to the absence of significantly damped wings. This effect would result in a high estimate for the Arcturus Mg abundance relative to the sun.
The re-analysis of the SMR bulge RGB star I-025, from FMR07 spectra, resulted in a decrease from [Mg/Fe]= + 0.24 reported by FMR07, to − 0.05 dex, found here. The analysis performed here relies heavily on synthesis of the 6 319 Å Mg I triplet, because these lines are relatively unsaturated. Other red lines of Mg are so strong, and the continuum so blended, in I-025, that Mg abundance changes of ± 0.1 dex occur with quite small differences in the assumed continuum level.
The result obtained here for I-025 is in excellent agreement with the J14, G15, and even the MR94 [Mg/Fe] ratios seen near [Fe/H]= + 0.5 dex, and fits the consensus values better than the [Mg/Fe] value from FMR07. As a result of the lower [Mg/Fe] and [O/Fe] found here (and in MFR10) for star I-025, a scaled-solar composition model atmosphere is appropriate, instead of the alpha-enhanced atmosphere used by FMR07. In that case, [Fe/H]= + 0.47 according to FMR07. Note that, for the differential line-by-line analysis, relative to Arcturus and ultimately the sun, the FMR07, and corrected FMR07 results are on a solar scale and independent of log gf values.
Table 1 shows my estimate of the parameters defining the [Mg/Fe] trends of various studies, based on the published results. Except for the dwarfs of B13, all the studies listed in Table 1 provide [Mg/Fe] and [Fe/H] values for Arcturus. In this way, we may attempt to evaluate zero-point differences between these studies. For example, FMR07 originally obtained [Mg/Fe]= + 0.39 dex for Arcturus, but the value found in this review is + 0.32 dex; thus, a − 0.07 dex correction should be applied to the published [Mg/Fe] values of FMR07. Similarly, G15 found [Mg/Fe] for Arcturus of + 0.22 dex; J14 obtained + 0.30 dex; for Hill et al. (Reference Hill2011), it was + 0.38 dex, whilst Lecureur et al. (Reference Lecureur2007) found + 0.32 dex, and MR94 + 0.30 dex. The implied correction for the G15 [Mg/Fe] values, of + 0.10 dex, seems too large in Figure 7, and suggests random error.
Summary of galactic bulge [Mg/Fe] measurements.

a Fulbright et al. (Reference Fulbright, McWilliam and Rich2007) entries were corrected in a partial re-analysis performed for this review; see text for details.
b Alves-Brito et al. (Reference Alves-Brito, Meléndez, Asplund, Ramírez and Yong2010) re-analysed EWs of Fulbright et al. (Reference Fulbright, McWilliam and Rich2007).
c Bensby et al. (Reference Bensby2013) abundances for lensed bulge dwarf stars, other studies were bulge red giants.
d Gonzalez et al. (Reference Gonzalez2015) measured the knee at [Fe/H]= − 0.44 dex, based on the same data.
As for the knee in the [Mg/Fe] versus [Fe/H] trend: a point near [Fe/H]= − 0.6 dex would reasonably agree with the most reliable of the published results.
Considering these issues, my best estimate of the [Mg/Fe] plateau and [Mg/Fe] at solar [Fe/H] are + 0.39 ± 0.02 and + 0.17 ± 0.02 dex, respectively. For [Fe/H]= + 0.50 dex, my best estimate of the bulge [Mg/Fe] is − 0.05 dex; however, scatter between different studies suggests that further investigation of these fiducial points would be useful.
Figure 7 shows the uncorrected [Mg/Fe] versus [Fe/H] results from the studies of B13, J14, and G15; small zero-point shifts to these studies are probably required (as discussed earlier) to place these onto the same scale and reproduce my best estimate of the [Mg/Fe] at the plateau, knee, at [Fe/H]=0.0 and + 0.5 dex. Also included in Figure 7 are results from Fulbright et al. (Reference Fulbright, McWilliam and Rich2007), with the − 0.07 dex zero-point correction applied, as well as the re-analysis of star I-025 performed here.
The lower panel of Figure 7 shows the MW thin disk, thick disk, and some halo results for solar neighbourhood dwarf stars analysed by Bensby et al. (Reference Bensby, Feltzing, Lundström and Ilyin2005) and Reddy et al. (Reference Reddy, Lambert and Allende Prieto2006). Whilst there is good agreement for solar metallicity thin disk stars, the Reddy et al. (Reference Reddy, Lambert and Allende Prieto2006) thick disk points appear to suffer from more contamination by thin disk stars, plus a larger dispersion than the Bensby et al. (Reference Bensby, Feltzing, Lundström and Ilyin2005) results. Reddy et al. (Reference Reddy, Lambert and Allende Prieto2006) had a much larger sample of metal-poor thick disk and halo stars than Bensby et al. (Reference Bensby, Feltzing, Lundström and Ilyin2005). Notwithstanding, it appears that the Bensby et al. (Reference Bensby, Feltzing, Lundström and Ilyin2005) metal-poor (below [Fe/H] ~ −0.6 dex) plateau has higher [Mg/Fe] than the Reddy et al. (Reference Reddy, Lambert and Allende Prieto2006) value. A high estimate of the plateau from Reddy et al. (Reference Reddy, Lambert and Allende Prieto2006) is [Mg/Fe]= + 0.34 dex, whereas the Bensby et al. (Reference Bensby, Feltzing, Lundström and Ilyin2005) thick disk data are consistent with the bulge plateau, at [Mg/F]= + 0.39 ± 0.02 dex. In this way, difficulties in measuring the [Mg/Fe] ratios for solar neighbourhood thick disk stars interferes with our interpretation of the relative IMF of the bulge.
The line in the lower panel of Figure 7 indicates the thick disk trend from the Bensby et al. (Reference Bensby, Feltzing, Lundström and Ilyin2005) results, which is slightly higher, by ~ 0.05 dex, than would be obtained from the Reddy et al. (Reference Reddy, Lambert and Allende Prieto2006) values. This line is reproduced in the upper panel of Figure 7.
The most noticeable features of the bulge [Mg/Fe] trend shown in Figure 7 is that, past the knee, the bulge [Mg/Fe] ratios lie above the Bensby et al. (Reference Bensby, Feltzing, Lundström and Ilyin2005) thick disk trend (as noted by B13), by about + 0.05 dex, and at solar [Fe/H] the bulge has [Mg/Fe] of + 0.17 dex, well above the solar composition and about 0.09 dex higher than the Bensby et al. (Reference Bensby, Feltzing, Lundström and Ilyin2005) thick disk. The solar [Mg/Fe] ratio is not reached in the bulge until [Fe/H] ~ +0.3 dex.
Perhaps, the simplest interpretation of the data is that the bulge [Mg/Fe] trend appears shifted to higher [Fe/H] compared to the solar neighbourhood thick disk trend of Bensby et al. (Reference Bensby, Feltzing, Lundström and Ilyin2005), by approximately + 0.16 dex in [Fe/H]. This indicates a higher SFR in the bulge than the thick disk. Furthermore, the Bensby et al. (Reference Bensby, Feltzing, Lundström and Ilyin2005) metal-poor [Mg/Fe] plateau is similar to the B13 bulge results, conceivably identical, suggesting a similar IMF.
However, if the Reddy et al. (Reference Reddy, Lambert and Allende Prieto2006) thick disk results are correct, then the metal-poor plateau of the bulge has higher [Mg/Fe] than the thick disk, by at least + 0.05 dex and possibly + 0.10 dex; but, the bulge [Mg/Fe] at solar [Fe/H] is at least + 0.10 dex higher than the Reddy et al. (Reference Reddy, Lambert and Allende Prieto2006) thick disk. Thus, it is possible that the bulge is both shifted to higher [Mg/Fe] and higher [Fe/H] than the Reddy et al. (Reference Reddy, Lambert and Allende Prieto2006) thick disk, suggesting both an IMF weighted to higher mass stars and a higher SFR in the bulge.
Interestingly, at the most metal-rich end both the bulge and disk [Mg/Fe] trends appear flat with [Fe/H], suggesting a convergence in Mg and Fe production. However, at the metal-rich end, the bulge points are sub-solar, near [Mg/Fe] ~ −0.05 dex, whereas the Bensby et al. (Reference Bensby, Feltzing, Lundström and Ilyin2005) thin disk points lie above solar, near + 0.05 dex. Thus, the bulge shows a larger range of [Mg/Fe] than the Bensby et al. (Reference Bensby, Feltzing, Lundström and Ilyin2005) thick plus thin disks.
This difference in SMR [Mg/Fe] levels, between disk and bulge, may be due to systematic measurement error, perhaps resulting from different Mg I line treatment for dwarfs and giants. Indeed, the uncharacteristic increase in [Mg/Fe] with [Fe/H] for the B13 SMR lensed dwarfs, compared to the RC and RGB bulge star studies, suggests that such an error is likely. However, if the difference in SMR [Mg/Fe] ratios is due to a genuine abundance effect, then the sun is a relatively Mg deficient thin disk star and the SMR bulge may have had a different IMF than the SMR thin disk.
Compelling similarities between bulge and thick disk abundance ratios were first pointed out for [O/Fe] by Meléndez et al. (Reference Meléndez2008), and extended to Na, Mg, Al, Si, Ca, and Ti by Alves Brito et al. (Reference Alves-Brito, Meléndez, Asplund, Ramírez and Yong2010); although this was based on rather few data points. More recently, J14 found bulge [O/Fe], [Mg/Fe], [Si/Fe], and [Ca/Fe] ratios, overlapping but slightly above the thick disk trends, based on their large sample. For Mg, at least, the bulge trend is measurably different than the thick disk trend.
3.4. [O/Mg]: Stellar winds, element yields, and WR Stars
The production of both oxygen and magnesium is thought to be dominated by SNII progenitors (e.g., WW95, Nomoto et al. Reference Nomoto1997, Kobayashi et al. Reference Kobayashi, Umeda, Nomoto, Tominaga and Ohkubo2006), during hydrostatic nuclear burning phases.
Inspection of the bulge and disk points in Figures 6 and 7 show that the oxygen plateau has higher [O/Fe], at + 0.52 dex, than the magnesium plateau [Mg/Fe] at + 0.39 dex. It is clear that the range of [O/Fe] is larger than the range of [Mg/Fe] for the galactic bulge and disks; consequently, the trend of [O/Mg] must show a decline with increasing [Fe/H].
Figure 8 shows the [O/Mg] decline with increasing [Fe/H] from the galactic bulge chemical abundance studies compared to the thin and thick disk results of Bensby et al. (Reference Bensby, Feltzing, Lundström and Ilyin2005). Interestingly, the [O/Mg] trends with [Fe/H] for MW bulge and both thick and thin disks look remarkably similar, although the bulge data has larger scatter, presumably due to measurement error. I note that if the upturn in the B13 bulge [Mg/Fe] ratios (see Figure 7), for their subset of lensed dwarf stars above [Fe/H]= + 0.2 dex, is assumed to be spurious, and if these are corrected to the median giant star [Mg/Fe] trend, then the bulge [O/Mg] ratios would move closer to the disk [O/Mg] trend.
Top Panel: [O/Mg] versus [Fe/H] in the Galactic bulge. Key to symbols is the same as in Figure 6. Note the ~ 0.2 dex decline in [O/Mg] with increasing [Fe/H]. Bottom Panel: The thick disk (crosses) and thin disk stars (filled circles) show the same metal-dependent decline. The trend is unchanged for the larger sample of disk stars in Bensby et al. (Reference Bensby, Feltzing and Oey2014).

Clearly, Figure 8 shows that there is an additional reduction of [O/Fe] that is not seen in [Mg/Fe] (and other alpha elements).
Bensby, Feltzing, & Lundström (Reference Bensby, Feltzing and Lundström2004) was the first to find this decline in [O/Mg] with [Mg/H] for MW thick and thin disk stars; the same result holds for the 714 disk stars studied in Bensby et al. (Reference Bensby, Feltzing and Oey2014). Whilst FMR07 noted different bulge trends for O compared to other α elements, Lecureur et al. (Reference Lecureur2007) and McWilliam et al. (Reference McWilliam, Matteucci, Ballero, Rich, Fulbright and Cescutti2008; henceforth M08) emphasised the metal-dependent decline in [O/Mg] versus [Mg/H], [O/H], or [Fe/H] ratios, seemingly the same in the galactic bulge and MW thick and thin disks.
Because the [O/Fe] decline is greater than the decline in [Mg/Fe] (or other alphas), it is not possible to explain the [O/Fe] and other [α/Fe] trends simultaneously with only the delayed addition of SNIa iron, as in the SNIa time-delay scenario of Tinsley (Reference Tinsley1979) and MB90.
This steep decline in [O/Fe], in excess of other alpha-elements, indicates a significant decline in the production of oxygen with increasing metallicity. Although other alpha elements (e.g., Mg, Si, Ca, Ti) show a smaller range of [X/Fe] than O, it could be argued that for Si, Ca, and Ti this is due to some small synthesis in SNIa. However, Mg is not produced in significant qualities by SNIa (e.g., Nomoto, Thielemann, & Yokoi Reference Nomoto, Thielemann and Yokoi1984; Fink et al. Reference Fink2014) and has no detectable effect on the [Mg/Fe] ratio. Therefore, the decline in [O/Mg] with increasing metallicity indicates a relative decrease in the production of oxygen by SNII progenitors.
Based on the relatively steeper decline of [O/Fe] with [Fe/H] in the bulge, compared to other alpha-elements, MR04 suggested that metal-dependent winds from massive stars (that produce the Wolf–Reyet phenomenon, henceforth WR) may have played an important role in bulge chemical evolution. M08 employed the chemical evolution model of the Galactic bulge constructed by Ballero et al. (Reference Ballero, Matteucci, Origlia and Rich2007), but used the Maeder (Reference Maeder1992) oxygen yields for massive stars that included the effects of mass-loss. Previous work (e.g., Ballero et al. Reference Ballero, Matteucci, Origlia and Rich2007) had used the WW95 SNII yields, where mass-loss was not considered. Although the Maeder (Reference Maeder1992) calculations did not include the SNII explosion, this had no effect on the oxygen yields, because the oxygen is produced in the hydrostatic phase of massive star evolution. The M08 calculations resulted in a slope of [O/Mg] versus [Mg/H] that matched the slope from the bulge abundances of FMR07 and Lecureur et al. (Reference Lecureur2007), as well as the MW thin and thick disks. However, a zero-point shift in the computed [O/Mg] ratios, compared to the observations, was evident, which may be accounted for with a slightly different bulge IMF.
A difficulty with the M08 calculations is that the Maeder (Reference Maeder1992) mass-loss rates are a factor of 2 to 3 higher than subsequent observations of massive stars indicated. In this regard, episodic mass-loss from single massive stars may be involved and the time-averaged mass-loss higher than from steady-state winds. However, it is also likely that mass-transfer in massive binary systems plays a significant role. Notwithstanding these issues, the winds from WR stars are radiatively driven and do depend on metallicity. In that case, it seems possible that oxygen yields are reduced at high metallicity due to shorter WR lifetimes. I refer the reader to the review by Smith (Reference Smith2014) for a detailed discussion of stellar wind mass-loss. Also relevant, the downward revision in the FMR07 [Mg/Fe] ratios for SMR bulge stars, discussed here, would make the [O/Mg] slope shallower at high [Fe/H] than considered in MB08; thus, the metal-dependent oxygen yield reduction in the bulge is less than previously thought, and less severe mass-loss rates from massive stars would be required to match the observed [O/Mg] slope with [Mg/H] or [Fe/H] than in MB08.
Relevant to the issue of the effects of stellar winds and WR stars on the chemical evolution of the bulge, Cescutti et al. (Reference Cescutti, Matteucci, McWilliam and Chiappini2009) employed the oxygen abundances from MRF10 and carbon and nitrogen abundances for the same bulge stars by Meléndez et al. (Reference Meléndez2008) to estimate the original [C/O] ratios of bulge stars, considering that C + N is roughly conserved through dredge-up onto the RGB. A plot of original [C/O] versus [O/H] for the bulge was compared to four chemical evolution models; notably, the comparison to [O/H] minimised consideration of SNIa contributions in the chemical evolution models. Three of the models included the effects of mass-loss and rotation on the yields of C and O from massive stars, from Maeder (Reference Maeder1992) and Meynet & Maeder (Reference Meynet and Maeder2002). An additional model was computed, using nucleosynthesis yields from massive stars taken from WW95, that did not include mass-loss. Whilst the observational data showed a strong increase in [C/O] above [O/H] ~ −0.2 dex, only the models including yields affected by mass-loss from massive stars could reproduce this behaviour, and indicated mass-loss rates somewhere between the Maeder (Reference Maeder1992) and Meynet & Maeder (Reference Meynet and Maeder2002) predictions. On the other hand, the model including WW95 yields, which did not include mass-loss, completely failed to match the observations. Thus, the bulge [C/O] ratios indicate an important role for metallicity-dependent mass-loss from massive stars on the chemical evolution of the bulge, as suggested by M08 based on the observed [O/Mg] trend with metallicity. On the other hand, Ryde et al. (Reference Ryde2010) suggest that carbon enhancements should result from this WR mass-loss scenario, which they do not find in their bulge [C+N/Fe] ratios.
Measurements of the fluorine abundance in bulge stars have been made by Cunha, Smith, & Gibson (Reference Cunha, Smith and Gibson2008) and Jönsson et al. (Reference Jönsson2014), using high-resolution K-band spectra of HF lines in bulge K and M giants. Both studies found a metal-dependent increase in [F/O] and [F/Fe] with [Fe/H] that cannot be explained by neutrino spallation in SNII, nor AGB s-processing alone; instead, they conclude that WR stars are an important source of fluorine in the galactic bulge.
3.5. Explosive alpha-elements: Si, Ca, and Ti
I now discuss trends of the average of Si, Ca, and Ti: three alpha elements, mainly produced during the explosive nucleosynthesis of SNII events (WW95). Small amounts of these explosive alpha-elements are also thought to be made during SNIa events; however, the predicted SNIa yields, relative to iron, are quite low (e.g., Nomoto et al. Reference Nomoto, Thielemann and Yokoi1984; Fink et al. Reference Fink2014). We average these three explosive alpha-elements because FMR07 showed that their trends follow each other closely. The average explosive alpha-element abundances, ⟨SiCaTi⟩, discussed here are based only on results from neutral lines (Si I, Ca I, and Ti I).
FMR07 measured [⟨SiCaTi⟩/Fe] with [Fe/H] in their sample of bulge and MW disk stars; however, they did not identify the thick/thin disk sub-populations. The disk giant abundances were compared to the Bensby et al. (Reference Bensby, Feltzing, Lundström and Ilyin2005) thin and thick disk dwarf star results; whilst Ca and Ti from the disk giants followed the Bensby et al. (Reference Bensby, Feltzing, Lundström and Ilyin2005) abundances, FMR07 found that their [Si/Fe] ratios were higher than the Bensby et al. (Reference Bensby, Feltzing, Lundström and Ilyin2005) disk giants by 0.09 dex. Thus, a correction of − 0.09 dex must be added to the FMR07 [Si/Fe] ratios to put them on the MW disk dwarf scale.
Following the finding, by Meléndez et al. (Reference Meléndez2008) that the bulge [O/Fe] ratios follow the MW thick disk trend (confirmed in the re-analysis of FMR07 data by MFR10), Alves-Brito et al. (Reference Alves-Brito, Meléndez, Asplund, Ramírez and Yong2010) used the EWs of FMR07, plus a sample of MW thick disk giants, and found that Mg, Si, Ca, and Ti abundances also followed the MW thick disk trend.
Although it is easy to compare bulge abundances with thick disk stars near [Fe/H]= − 0.6 dex, and thin disk stars near solar [Fe/H], a comparison with thick disk stars near solar [Fe/H] is uncertain, because of the paucity of solar metallicity thick disk stars. Although the Bensby et al. (Reference Bensby, Feltzing, Lundström and Ilyin2005) and Reddy et al. (Reference Reddy, Lambert and Allende Prieto2006) studies do include putative MW thick disk stars near solar [Fe/H], there are only a handful of such relatively metal-rich thick disk stars, and their [α/Fe] ratios more closely resemble thin disk than the metal-poor thick disk stars. Thus, the solar-metallicity thick disk stars are either mis-identified thin disk members, or the [α/Fe] ratios of the thick disk merges with the thin disk by [Fe/H]=0.00 dex. To resolve this uncertainty requires a sample of reliable solar-metallicity thick disk stars.
As evident from Figure 9, the bulge [⟨SiCaTi⟩/Fe] trend is slightly different when derived from RGB stars than the lensed dwarf bulge stars of B13.
Top panel: [⟨SiCaTi⟩/Fe] versus [Fe/H] for the lensed turnoff bulge stars of B13 (filled blue squares), compared to the MW thin and thick disk dwarf stars from Bensby et al. (Reference Bensby, Feltzing, Lundström and Ilyin2005), filled black circles and black crosses, respectively. Bottom panel: [⟨SiCaTi⟩/Fe] versus [Fe/H] for bulge giants from Gonzalez et al. (Reference Gonzalez2011; filled cyan circles), FMR07 (filled red triangles), and Alves-Brito et al. (Reference Alves-Brito, Meléndez, Asplund, Ramírez and Yong2010; open blue squares). Filled black triangles are the disk giants analysed by FMR07.

The top panel of Figure 9 shows the B13 lensed dwarf bulge stars, with [⟨SiCaTi⟩/Fe]= + 0.06 dex at solar [Fe/H], but constant for stars above solar metallicity. The bulge trend is certainly higher than the MW thin disk stars. Near [Fe/H] ~ −0.6 dex, the bulge dwarfs show similar [⟨SiCaTi⟩/Fe] to the top of the range for Bensby et al. (Reference Bensby, Feltzing, Lundström and Ilyin2005) MW thick disk stars, near + 0.28 dex, above the thin disk by ~ 0.15 dex.
The lower panel of Figure 9 shows the Gonzalez et al. (Reference Gonzalez2011) bulge giant [⟨SiCaTi⟩/Fe] ratios with filled cyan circles; these are in quite good agreement with the FMR07 bulge RGB stars, represented by filled red triangles. At solar metallicity, the Gonzalez et al. (Reference Gonzalez2011) results suggests [⟨SiCaTi⟩/Fe]= + 0.13 dex, but the FMR07 results suggest a slightly higher intercept near between + 0.15 and + 0.17 dex. At the metal-rich end [⟨SiCaTi⟩/Fe]=0.00 at [Fe/H] ~ +0.3 dex; the metal-poor plateau occurs below [Fe/H] ~ −0.6 to − 0.8 dex at a value of [⟨SiCaTi⟩/Fe] ~ +0.39 dex. These fiducial points indicate that, to within the measurement uncertainties, the trend of [⟨SiCaTi⟩/Fe] with [Fe/H] is the same as the [Mg/Fe] trend for bulge giant stars.
The FMR07 disk giants, indicated by filled black triangles in the lower panel of Figure 9, fall well below the bulge trend, but mostly similar to the thin disk points (filled black circles) in the upper panel. However, the cluster of three FMR07 disk giants with [Fe/H] ~ −0.6 dex have thick disk ratios; thus, they could reasonably be thick disk stars. It appears that at [Fe/H]= − 0.6, the Gonzalez et al. (Reference Gonzalez2011) trend is slightly higher than the apparent trio of FMR07 thick disk giants, but they are in reasonable agreement with the FMR07 bulge giants. Clearly, the FMR07 disk sample is too small to define the thick disk near [Fe/H]=0.00 dex.
The Aves-Brito et al. (Reference Alves-Brito, Meléndez, Asplund, Ramírez and Yong2010) points in the lower panel (represented by blue open squares) are ~ 0.10 dex lower than the FMR07 and Gonzalez et al. (Reference Gonzalez2011) results. Gonzalez et al. (Reference Gonzalez2011) have traced this back to a difference in the stars used to define the zero-point of the Alves-Brito et al. (Reference Alves-Brito, Meléndez, Asplund, Ramírez and Yong2010) scale. Because the independent FMR07 and Gonzalez et al. (Reference Gonzalez2011) abundance scales are both higher than Alves-Brito et al. (Reference Alves-Brito, Meléndez, Asplund, Ramírez and Yong2010), by about 0.10 dex, it appears that Alves-Brito et al. (Reference Alves-Brito, Meléndez, Asplund, Ramírez and Yong2010) [⟨SiCaTi⟩/Fe] results may be erroneously low. Furthermore, abundances for the FMR07 zero-point standard star, Arcturus, are in excellent agreement with the work of Ramírez & Allende Prieto (Reference Ramírez and Allende Prieto2011); both give [⟨SiCaTi⟩/Fe]= + 0.24 dex, whilst [Fe/H] for FMR07 and Ramírez & Allende Prieto (Reference Ramírez and Allende Prieto2011) give are close, at − 0.50 and − 0.52 dex, respectively.
It is important to note that, the Alves-Brito et al. (Reference Alves-Brito, Meléndez, Asplund, Ramírez and Yong2010) finding that the bulge RGB stars overlap with their thick disk RGB star abundance trends, is not affected by potential zero-point errors. Indeed, the Gonzalez et al. (Reference Gonzalez2011) re-analysis of the Alves-Brito et al. (Reference Alves-Brito, Meléndez, Asplund, Ramírez and Yong2010) thick disk giants found the same similarity to the bulge as Alves-Brito et al. (Reference Alves-Brito, Meléndez, Asplund, Ramírez and Yong2010).
The [⟨SiCaTi⟩/Fe] ratios of the bulge dwarf stars in Figure 9 lie slightly above the thick disk trend in the range − 0.3⟨[Fe/H]⟨0.0 dex; but, this is partly because thick disk appears to merge with the thin disk trend. However, this merger may simply be due to mis-identification of the thick disk stars. The RC stars in Figure 9 lie above the trend established by the thick disk dwarf stars, but this might be due to an atmosphere effect.
It is probably best to give more weight to the dwarf comparison, and assume that the bulge and thick disk alpha-element trends are probably coincident in [⟨SiCaTi⟩/Fe]; at best, the bulge is slightly higher. Notably, the bulge reaches much higher [Fe/H] than the thick disk. However, the Alves-Brito et al. (Reference Alves-Brito, Meléndez, Asplund, Ramírez and Yong2010) bulge results for Ca and Ti lie above their thick disk points, whilst Si follows the same trend. The differences could easily be due to T eff errors, although they should cancel in the ⟨SiCaTi⟩ average, to some degree. Whilst the Gonzalez et al. (Reference Gonzalez2011) re-analysis of Alves-Brito et al. (Reference Alves-Brito, Meléndez, Asplund, Ramírez and Yong2010) thick disk giants agrees well with the Gonzalez et al. (Reference Gonzalez2011) bulge results, there are very few thick disk stars at the critical metallicity in the comparison. Although the similarity of bulge and thick disk giant [⟨SiCaTi⟩/Fe] trends in Gonzalez et al. (Reference Gonzalez2011) very compelling, there are only four thick disk giant comparison stars near solar metallicity. The fact that putative thick disk dwarfs show thin disk compositions, and are not alpha-enhanced, unlike the small sample of thick disk giants, raises additional concerns regarding the comparison.
Non-LTE over-ionisation of neutral Si, Ca, and Ti atoms in dwarf stars provides a plausible explanation for the ~ 0.10 dex difference in [⟨SiCaTi⟩/Fe] between bulge dwarf and giant star trends in Figure 9. The competition between collisional and radiative excitation and ionisation rates may result in departures from LTE for the relatively hot dwarf stars, due to the presence of ionising radiation, and especially at lower metallicity, where stellar atmospheres become more transparent at UV wavelengths, due to reduced line blanketing. On the other hand, the atmospheres of red giant stars are typically heavily blanketed in the UV, and cool enough that the ionising flux is low; for these reasons, conditions close to LTE may exist, despite the reduced collisional rates in the low-density giant atmospheres.
Non-LTE corrections have been computed for a variety of elements, but not all, for restricted ranges of stellar parameters (but mostly for dwarf stars), and clearly can affect alpha-element abundances (e.g., Gehren et al. Reference Gehren, Shi, Zhang, Zhao and Korn2006; Lind, et al. Reference Lind, Bergemann and Asplund2012; Bergemann Reference Bergemann2011) at the level of interest here. The review by Bergemann & Nordlander (Reference Bergemann, Nordlander, Niemczura, Smalley and Pych2014) gives the recent status of such calculations; more needs to be done.
Finally, it is worthwhile noting that a dispersion in [Ca/Fe] in the results of G15 suggests the possibility of a sub-population of Ca-rich bulge stars. These are may be due to errors in the microturbulent velocity parameter for the rather strong Ca I lines available for abundance analysis in near-solar metallicity bulge giants. However, it would be very significant if Ca-rich bulge stars were confirmed.
4 COMMENTS ON HELIUM, SODIUM, AND 12C/13C
The identification of an X-shape morphology for the Galactic bulge, by McWilliam & Zoccali (Reference McWilliam and Zoccali2010), was based on an adopted distance calibration for RC stars. However, the voracity of the X-shape was challenged by Lee, Joo, & Chung (Reference Lee, Joo and Chung2015), who claimed that enhanced helium fractions near Y ~ 0.4, similar to some sub-populations seen in a few globular clusters, could explain the RC magnitudes and colours without an X-shaped structure. Unfortunately, due to its atomic structure, it is very difficult to measure the photospheric abundance of helium in the relatively cool RC stars.
However, it is well known that globular clusters with enhanced helium mass fractions, Y, show strong Na enhancements, typically + 0.5 dex but up to + 0.9 dex, and oxygen deficiencies; this results in and [Na/O] ratios up to ~ 1.0 dex, and a steep Na–O anti-correlation. In this regard, Na abundances for lensed bulge dwarfs were measured by B13, who found [Na/Fe] ~ 0.1 dex for nearly all metallicities (see Figure 10), and no O deficiencies. Interestingly, the location of the B13 lensed bulge dwarf sample was heavily weighted to the positive longitude side of the bulge, where Lee et al. (Reference Lee, Joo and Chung2015) required high helium abundance. Thus, if there is an He enhancement in the bulge, it does not seem to be related to the mechanism seen in some MW globular clusters that also results in the strong Na–O anti-correlation.
[Na/Fe] versus [Fe/H] for the thin and thick disks (filled black circles and crosses, respectively) from Bensby et al. (Reference Bensby, Feltzing and Oey2014), compared with lensed bulge dwarf stars (filled blue squares) from Bensby et al. (Reference Bensby2013) and bulge RC stars (filled green circles) of Johnson et al. (Reference Johnson, Rich, Kobayashi, Kunder and Koch2014). The zig-zag trend line in the dwarfs is qualitatively consistent with Na produced by SNII progenitors with a metallicity-dependent yield, in the SNIa time-delay scenario of Tinsley (Reference Tinsley1979) and Matteucci & Brocato (Reference Matteucci and Brocato1990).

Figure 10 compares measured [Na/Fe] ratios in MW thin/thick disk dwarfs with the lensed dwarfs of B13 and the RC giants in J14. Notably, the disk and bulge dwarf stars show identical trends, with [Na/Fe] following a zig-zag pattern. This unusual zig-zag trend can be understood if Na is produced by massive stars (SNII or their progenitors) but with a yield that increases with increasing [Fe/H]. In the SNIa time-delay scenario of Tinsley (Reference Tinsley1979) and MB90, used to explain the [O/Fe] trend with [Fe/H], SNIa iron is added above [Fe/H] ~ −1, which produces declining ratios of both [O/Fe] and [Na/Fe]; however, as [Fe/H] increases the production of Na increases strongly, leading to a muted decline in [Na/Fe] compared to the decline of [O/Fe]. Finally, above about solar metallicity, the metal-dependent Na yields have increased so much that [Na/Fe] increases with increasing [Fe/H], producing the observed zig-zag locus. I note, however, that for metal-rich stars saturation effects and blends can cause systematic errors that increase the derived abundances.
Figure 10 shows that the bulge RC stars have lower [Na/Fe] at low [Fe/H] and a much larger scatter than the lensed bulge dwarfs. These differences might be partly due to non-LTE effects in RC giants; indeed, Lind et al. (Reference Lind, Asplund, Barklem and Belyaev2011) provide theoretical non-LTE corrections near − 0.10 dex for Na I lines in the J14 bulge RC stars. On the other hand, the control sample of MW disk RGB stars in FMR07 showed no difference in measured [Na/Fe] ratios compared to the Bensby et al. (Reference Bensby, Feltzing, Lundström and Ilyin2005) thin and thick disk dwarf stars.
I note that measured 12C/13C ratios in bulge red giant stars (e.g., Uttenthaler et al. Reference Uttenthaler2015) are similar to ratios seen in the solar neighbourhood red giants (e.g., Smith & Lambert Reference Smith and Lambert1990). If the bulge helium abundance had been strongly increased due to CNO cycle processing, the 12C/13C ratios of all bulge stars would be expected to be lower than the disk; for the RGB stars, at least, there is no significant, obvious, difference between the bulge and disk. Thus, it does not appear that proton burning products of the CNO cycle are enhanced in the bulge. A useful test of this result could be obtained from the lensed bulge dwarf stars, whose 12C/13C ratios should be near 90. Thus, there is currently no indirect chemical composition evidence favouring enhanced bulge helium abundance; if Y is enhanced it likely resulted from the p–p chain.
5 IRON-PEAK ELEMENTS
5.1. Chromium
The abundance of Cr has been measured for bulge RGB stars by J14 and for lensed bulge dwarf stars by B13. Both of these studies found that Cr scales with Fe, i.e., [Cr/Fe]=0.0 dex, at all metallicities probed, ranging from [Fe/H] ~ −1.5 − 1 to + 0.5 dex. In this regard, the bulge [Cr/Fe] trend resembles that in both the thin and thick MW disks.
5.2. Manganese
The trend of [Mn/Fe] with [Fe/H] is either a probe of nucleosynthesis and chemical evolution, or it reflects metal-dependent non-LTE effects in stellar atmospheres.
Deficiencies of [Mn/Fe] in nearby G-dwarf stars were originally found by Wallerstein (Reference Wallerstein1962) and later also seen by Wallerstein et al. (Reference Wallerstein, Greenstein, Parker, Helfer and Aller1963) in MW halo giants. A significant finding came from a study of MW halo and disk, giant and dwarf stars, by Gratton (Reference Gratton1989). Gratton (Reference Gratton1989) found a low [Mn/Fe] plateau, at − 0.34 dex, for stars below [Fe/H] ~ −1, with a linear rise in [Mn/Fe] above this metallicity, towards the solar composition. This trend is the inverse of the α-elements (e.g., see Figure 11).
LTE [Mn/Fe] versus [Fe/H] abundance ratios in the bulge from McWilliam et al. (Reference McWilliam, Rich and Smecker-Hane2003; red stars) and Barbuy et al. (Reference Barbuy2013; green targets), compared to Reddy et al. (Reference Reddy, Tomkin, Lambert and Prieto2003, Reference Reddy, Lambert and Allende Prieto2006) MW thin disk (open black circles), thick disk (filled black circles), halo globular clusters from Sobeck et al. (Reference Sobeck2006; open black squares), and metal-rich thin disk stars from Feltzing & Gustafsson (Reference Feltzing and Gustafsson1998; black crosses). The trend of [Mn/Fe] versus [Fe/H] in the bulge and MW disks/halo appear identical to within the measurement uncertainties.
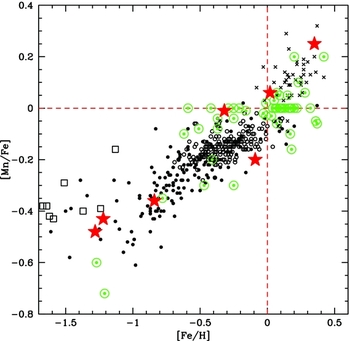
Subsequent studies of [Mn/Fe] trends in the MW disks and halo (e.g., Feltzing & Gustafsson Reference Feltzing and Gustafsson1998; Reddy et al. Reference Reddy, Tomkin, Lambert and Prieto2003, Reference Reddy, Lambert and Allende Prieto2006; Sobeck et al. Reference Sobeck2006; Mishenina et al. Reference Mishenina, Gorbaneva, Pignatari, Thielemann and Korotin2015) continued to show and extend the trend found by Gratton (Reference Gratton1989), with the metal-poor plateau appearing closer to [Mn/Fe]= − 0.40 dex.
Notable observational challenges for Mn abundance measurement include very strong hyperfine splitting of Mn I lines; and, for absolute abundances, a difference of 0.14 dex between the photospheric and meteoritic Mn abundance in the sun (e.g., Grevesse & Sauval Reference Grevesse and Sauval1998); although, the difference is now only 0.05 dex (e.g., Lodders, Palme, & Gail Reference Lodders, Palme, Gail and Trümper2009; Asplund et al. Reference Asplund, Grevesse, Sauval and Scott2009).
Based on the observed inverse-alpha trend, Gratton (Reference Gratton1989) suggested that the [Mn/Fe] increase with [Fe/H] could be due to over-production of Mn by SNIa.
In this scenario, as the [O/Fe] ratio declines due to the late addition of iron from SNIa, the [Mn/Fe] ratio increases, from Mn over-production by the same SNIa events. Another way to view it is that as the SNIa/SNII ratio increases at late times extra Fe and Mn from SNIa reduce [O/Fe] and increase the [Mn/Fe] ratio.
If this idea is correct, then the [Mn/Fe] ratios provide a consistency check for the SNIa time-delay scenario of chemical evolution, can be used as a probe of the SNIa/SNII ratio in different systems, and to provide constraints on the progenitors and mechanism of SNIa.
Observational evidence for Mn over-production by SNIa was recently identified, by means of X-ray spectroscopy, for the supernova remnant 3C 397 (e.g., Yamaguchi et al. Reference Yamaguchi2015).
On the theoretical side, early nucleosynthesis calculations of core-collapse supernovae indicated that SNII produce metallicity-dependent Mn yields that largely explain the observed [Mn/Fe] trends in the MW (WW95; Timmes et al. Reference Timmes, Woosley and Weaver1995), and that completely overwhelm any Mn contributions from SNIa events. However, more recent supernova nucleosynthesis calculations (e.g., Kobayashi et al. Reference Kobayashi, Umeda, Nomoto, Tominaga and Ohkubo2006; Sukhbold et al. Reference Sukhbold, Ertl, Woosley, Brown and Janka2016) indicate that SNII under-produce manganese at all metallicities, with [Mn/Fe] at roughly − 0.3 to − 0.6 dex.
Theoretical element yields for Chandrsekhar-mass deflagration SNIa events (e.g., Nomoto et al. Reference Nomoto, Thielemann and Yokoi1984, Reference Nomoto1997; Fink et al. Reference Fink2014; Yamaguchi et al. Reference Yamaguchi2015) give enhanced [Mn/Fe] ratios near + 0.3 dex, with Mn yields that are insensitive to the progenitor metallicity. On the other hand, sub-Chandrasekhar-mass SNIa (e.g., Woosley & Kasen Reference Woosley and Kasen2011; Seitenzahl et al. Reference Seitenzahl, Cescutti, Röpke, Ruiter and Pakmor2013) result in deficient [Mn/Fe] ratios, but with Mn yields that increase with metallicity (Yamaguchi et al. Reference Yamaguchi2015; Kobayashi, Nomoto, & Hachisu Reference Kobayashi, Nomoto and Hachisu2015).
From these theoretical results, it is clear that [Mn/Fe] ratios are sensitive to the SNIa/SNII ratio, sensitive to the SNIa mechanism and sub-type, and sensitive to metallicity in the case of sub-Chandrasekhar SNIa.
Apparently, only Chandrasekhar-mass SNIa over-produce Mn, relative to Fe, so the high [Mn/Fe] ratio in 3C 397, from Yamaguchi et al. (Reference Yamaguchi2015), indicates a Chandrasekhar-mass SNIa.
The above observational and theoretical results suggest that the increasing [Mn/Fe] trend with [Fe/H] is consistent with the delayed addition of Mn from Chandrasekhar-mass SNIa, as expected from the time-delay scenario of Tinsley (Reference Tinsley1979) and MB90 that explains the [O/Fe] trend by the delayed addition of SNIa iron.
In stark contrast to the apparent observational consistency noted earlier, Feltzing, Fohlman, & Bensby (Reference Feltzing, Fohlman and Bensby2007) found a flat, barely sub-solar, trend with [Fe/H]. Recently, Battistini & Bensby (Reference Battistini and Bensby2015) measured LTE abundances in agreement with the inverse-alpha trend seen by others, but the non-LTE abundance corrections of Bergemann & Gehren (Reference Bergemann and Gehren2008), when applied, resulted in a flat [Mn/Fe] trend with [Fe/H], at roughly the solar value for all metallicities. Interestingly, it seems possible that the non-LTE corrections could resolve the difference between solar photospheric and meteoritic Mn abundances. On the other hand, smaller non-LTE corrections, near ~ +0.1 dex, were found by Cunha et al. (Reference Cunha, Smith, Bergemann, Suntzeff and Lambert2010) for the red Mn I lines in three Omega Cen RGB stars, at [Fe/H] ~ −1 dex; these corrections would not erase the inverse α-trend of [Mn/Fe] with [Fe/H].
Somewhat contrary to the theoretical non-LTE corrections of Bergemann & Gehren (Reference Bergemann and Gehren2008), Sneden et al. (Reference Sneden2016) measured 19 Mn I and 10 Mn II lines in the metal-poor dwarf star, HD84927, and found the Mn II abundance higher by only + 0.04 dex, much smaller than the predicted non-LTE correction, near + 0.35 dex. In particular, Sneden et al. (Reference Sneden2016) found [Mn II/Fe II]= − 0.27 dex, consistent with the trend derived from the neutral species; this is important, because the singly ionised lines do not suffer severe non-LTE effects.
If the Mn I non-LTE abundance corrections of Bergemann & Gehren (Reference Bergemann and Gehren2008) are correct, then the abundance of Mn scales with Fe in the MW halo, thick and thin disks, and there is no probe of Mn nucleosynthesis or chemical evolution. Unfortunately, such a flat [Mn/Fe] trend leads to an inconsistency with the time-delay scenario explanation (Tinsley Reference Tinsley1979; MB90), for the decline of [α/Fe] with increasing [Fe/H], arising from increased contributions of Fe from SNIa at late times. The iron from delayed SNIa reduce the [O/Fe] ratio, but should also increase [Mn/Fe] from Chandrasekhar-mass SNIa.
I conclude that, if the Mn I non-LTE corrections Bergemann & Gehren (Reference Bergemann and Gehren2008) are approximately correct, then either the time-delay chemical evolution scenario, or the theoretical supernova nucleosynthesis yields are wrong and/or incomplete.
On the other hand, if there is an inverse-alpha trend of [Mn/Fe] with [Fe/H] in the MW halo, thick and thin disks, due to Mn over-production by SNIa, then we expect enhanced [Mn/Fe] ratios in α-poor systems, like dwarf galaxies, where SNIa material is thought to dominate, and deficient [Mn/Fe] in α-enhanced systems, like the MW bulge, where SNII material is thought to be enhanced. Thus, if Mn is over-produced in SNIa, the enhanced [Mg/Fe] and [O/Fe] ratios in the bulge should be accompanied by low [Mn/Fe] ratios.
LTE abundance measurements of Mn in bulge stars have been performed by McWilliam, Rich, & Smecker-Hane (Reference McWilliam, Rich and Smecker-Hane2003) and Barbuy et al. (Reference Barbuy2013), as shown in Figure 11 and compared with the [Mn/Fe] trend for MW disk stars, measured by Reddy et al. (Reference Reddy, Tomkin, Lambert and Prieto2003, Reference Reddy, Lambert and Allende Prieto2006) and Feltzing & Gustafsson (Reference Feltzing and Gustafsson1998). It is evident from Figure 11 that the [Mn/Fe] trends for both bulge studies agree and are consistent with the MW disk trend, to within the measurement uncertainties. Thus, there is no evidence for a Mn deficiency in the bulge, as expected from the observed enhanced [Mg/Fe] and [O/Fe] ratios. For this reason, McWilliam et al. (Reference McWilliam, Rich and Smecker-Hane2003) concluded that Mn cannot simply be over-produced in all SNIa, but rather there must be a metallicity-dependent yield of Mn from both SNII and SNIa, with increasing [Mn/Fe] ratios to higher [Fe/H]. Such a strong metallicity effect is not supported by current supernova nucleosynthesis theory.
In addition to the unexpected [Mn/Fe] ratios, Barbuy et al. (Reference Barbuy2013) noted that the bulge [Mn/O] trend with [O/H] is enhanced compared to the MW thick disk, and showed that, in this way, the bulge is chemically distinct and likely evolved differently.
Of course, the alternate (and trivial) explanation for the similar [Mn/Fe] trends in the bulge and MW disk stars is that the trend simply reflects the metal-dependence of the non-LTE corrections to the LTE Mn I abundances.
In summary, the observed LTE [Mn/Fe] trend with [Fe/H] in the bulge is similar to the MW thin and thick disks; but, this is contrary to expectations of the SNIa time-delay scenario of chemical evolution, given the enhanced [α/Fe] ratios for the same bulge stars. The combination of non-LTE corrections, theoretical supernova nucleosynthesis yields, and the time-delay chemical evolution scenario are unable to explain the measured [Mn/Fe] versus [Fe/H] trends in the MW disks or bulge; one of these inputs must be wrong or incomplete.
5.3. Cobalt
Bulge abundances for Co have only been measured for the sample of RGB stars studied by J14. They found roughly constant [Co/Fe] ratios with [Fe/H], albeit with a slight overall enhancement, near + 0.15 dex, and a 1σ scatter of about 0.1 dex, presumably due to measurement error.
Whilst this small [Co/Fe] enhancement lies above the MW thin disk values (e.g., Reddy et al. Reference Reddy, Tomkin, Lambert and Prieto2003, Reference Reddy, Lambert and Allende Prieto2006), it resembles the ~ +0.15 dex enhancement of [Co/Fe] in the MW thick disk found by Reddy et al. (Reference Reddy, Lambert and Allende Prieto2006) and the ~ +0.2 dex value for the thick disk stars in Battistini & Bensby (Reference Battistini and Bensby2015). These elevated [Co/Fe] ratios might be related to the ~ +0.5 dex [Co/Fe] enhancements seen in extremely metal-poor MW halo stars (e.g., McWilliam et al. Reference McWilliam, Preston, Sneden and Searle1995), thought to be due to hypernovae (e.g., Nomoto et al. Reference Nomoto, Maeda, Umeda and Nakamura2001). However, hypernova nucleosynthesis models also produce enhanced [Zn/Fe] and deficient [Cr/Fe] ratios. Johnson (Reference Johnson1999) found enhancements of Zn in extreme metal-poor stars, later confirmed by Cayrel et al. (Reference Cayrel2004), that also show enhanced Co and low Cr, consistent with the hypernova origin at very low metallicity. As mentioned below, although a small [Zn/Fe] enhancement is seen in somewhat metal-poor bulge stars, near [Fe/H]= − 0.8 dex, Zn enhancements are not seen in the solar-metallicity or metal-rich bulge stars where the Co enhancement is found. Furthermore, the solar [Cr/Fe] ratios measured in the bulge are quite normal, and so inconsistent with the theoretical hypernova nucleosynthesis yields. Thus, it is difficult to ascribe the small [Co/Fe] enhancement in bulge stars to hypernova nucleosynthesis. The enhancement is not likely due to stellar atmosphere, non-LTE effects, since the non-LTE corrections of Bergemann, Pickering, & Gehren (Reference Bergemann, Pickering and Gehren2010) would only increase the [Co/Fe] over-abundance.
5.4. Nickel
The abundance of nickel in the bulge has been measured by J14 for red giant branch stars and by B13 for lensed dwarf stars.
The B13 results show flat [Ni/Fe]=0.0 dex below solar metallicity; above [Fe/H]=0.0 dex a small increase in [Ni/Fe] with increasing [Fe/H] is present, reaching [Ni/Fe] ~ +0.1 dex at [Fe/H]= + 0.5 dex. Curiously, whilst the flat trend is similar to [Ni/Fe] results for the MW thin and thick disk in both Reddy et al. (Reference Reddy, Tomkin, Lambert and Prieto2003, Reference Reddy, Lambert and Allende Prieto2006) and Bensby et al. (Reference Bensby, Feltzing and Lundström2003), the upward rise in [Ni/Fe] above solar metallicity is seen only in the MW thin disk results of Bensby et al. (Reference Bensby, Feltzing and Lundström2003). Notably, the analysis of SMR thin disk stars by Feltzing & Gustafsson (Reference Feltzing and Gustafsson1998) found flat [Ni/Fe]=0.0 dex for all their stars: from solar metallicity to [Fe/H]= + 0.40 dex. Thus, the up-turn in [Ni/Fe] for SMR thin disk and bulge stars, found by Bensby et al. (Reference Bensby, Feltzing and Lundström2003, Bensby et al. Reference Bensby2013), is not confirmed.
The J14 RGB bulge stars also show a flat trend of [Ni/Fe] below solar metallicity, but slightly enhanced, at [Ni/Fe] ~ +0.1 dex. Above solar [Fe/H], and up to + 0.5 dex, the same ~ 0.1 dex in [Ni/Fe] enhancement persists; although, a handful of points might be consistent with a rise at the highest [Fe/H]. Given the disagreement with the bulge dwarf stars, it is likely that the small [Ni/Fe] enhancement in J14 is due to systematic error (for example, due to line blends, gf values, saturation effects).
Notwithstanding the inconclusive observational case for a small [Ni/Fe] enhancement in the bulge, Ni deficiencies have been claimed for some dwarf galaxies and α-poor halo stars (e.g., Letarte Reference Letarte2007; Nissen & Schuster Reference Nissen and Schuster2010). Since these systems are deficient in SNII nucleosynthetic products, somewhat opposite to the bulge, it is possible that the small [Ni/Fe] enhancement claimed by J14, may be due to a relative excess of SNII material. At present, however, I assume that there is no strong evidence for Ni enhancement in the bulge and that the [Ni/Fe] ~ +0.1 dex value in J14 is probably due to systematic error.
5.5. Copper
Whilst deficiencies of Cu, relative to Fe, were found in studies of small numbers of metal-poor MW halo stars (e.g., Cohen Reference Cohen1978, Reference Cohen1979; Peterson Reference Peterson1981; Luck & Bond Reference Luck and Bond1985; Sneden & Crocker Reference Sneden and Crocker1988), the large-scale trend of [Cu/Fe] with [Fe/H] in MW disk and halo stars was first clearly delineated by Sneden, Gratton, & Crocker (Reference Sneden, Gratton and Crocker1991). Subsequent studies (e.g., Mishenina et al. Reference Mishenina, Kovtyukh, Soubiran, Travaglio and Busso2002; Simmerer et al. Reference Simmerer2003; Reddy et al. Reference Reddy, Tomkin, Lambert and Prieto2003, Reference Reddy, Lambert and Allende Prieto2006) have improved the accuracy, metallicity coverage, number of stars, and added halo globular clusters.
As can be seen from Figure 12, the MW disk/halo trend is roughly flat from solar [Fe/H] down to about [Fe/H]= − 0.7 dex; below that, [Cu/Fe] declines roughly linearly with decreasing [Fe/H], until reaching a flat plateau of [Cu/Fe]= − 0.6 to − 0.7 dex at a metallicity below [Fe/H] ~ −1.5.
[Cu/Fe] versus [Fe/H] in the bulge from Johnson et al. (Reference Johnson, Rich, Kobayashi, Kunder and Koch2014; filled green circles), compared to the MW stars from Reddy et al. (Reference Reddy, Lambert and Allende Prieto2006; mostly thick disk and halo: black crosses), Reddy et al. (Reference Reddy, Tomkin, Lambert and Prieto2003; thin disk: filled black circles), Mishenina et al. (Reference Mishenina, Kovtyukh, Soubiran, Travaglio and Busso2002; halo and thick disk: open black circles), and Simmerer et al. (Reference Simmerer2003; halo globular clusters: filled black squares). The bulge [Cu/Fe] trend continues to high values above [Fe/H] ~ −0.5 dex and exceeds the MW disk trend by up to ~ 0.5 dex. Notice the large dispersion in [Cu/Fe] near solar metallicity.

A non-LTE analysis of copper in turn-off dwarfs, by Yan, Shi, & Zhao (Reference Yan, Shi and Zhao2015), indicated that the metal-poor plateau lay near [Cu/Fe]= − 0.4 dex, based on two stars (assuming collisions with hydrogen atoms scaled to S H=0.1). For solar-metallicity stars, they found small non-LTE corrections to the LTE Cu I abundances, at most + 0.05 dex, but this increased to + 0.15 dex by [Fe/H]= − 1.5 dex. Notably, non-LTE effects for Fe I lines were not computed in the analysis of Yan et al. (Reference Yan, Shi and Zhao2015). Non-LTE corrections for Fe I lines, using the on-line tool, INSPECT, by Lind et al.Footnote 2 gives values of 0.02–0.03 dex. It is not known whether the non-LTE over-ionisation effect for Cu I levels is smaller or larger in the cool RGB globular cluster stars of Simmerer et al. (Reference Simmerer2003).
Bihain et al. (Reference Bihain, Israelian, Rebolo, Bonifacio and Molaro2004) studied [Cu/Fe] in extreme metal-poor stars and employed one of the Cu I resonance lines at 3273Å. They found [Cu/Fe] roughly solar above [Fe/H]= − 1, but with a linear decline down to [Fe/H] ~ −2.5 dex and a plateau at [Cu/Fe]= − 1.0 dex. A reasonable assumption is that the non-LTE corrections for the most metal-poor stars in Bihain et al. (Reference Bihain, Israelian, Rebolo, Bonifacio and Molaro2004) exceed those found by Yan et al. (Reference Yan, Shi and Zhao2015) for more metal-rich stars; thus, the plateau below [Fe/H]= − 2.5 is probably higher than the Bihain et al. LTE value. Notably, Bonifacio, Caffau, & Ludwig (Reference Bonifacio, Caffau and Ludwig2010) concluded that the Cu I resonance lines were not reliable abundance indicators, likely due to departures from LTE.
Although, many astrophysical sites of copper nucleosynthesis have been proposed, it is now generally accepted that copper is mostly produced in the hydrostatic He- and C-burning phases of massive stars, ( > 8 M⊙ which ultimately become SNe II), via weak s-process neutron-capture, driven by 22Ne(α,n)25Mg. For extensive discussion of the evolution and details of this idea, see Prantzos, Hashimoto, & Nomoto (Reference Prantzos, Hashimoto and Nomoto1990), Raiteri et al. (Reference Raiteri, Busso, Picchio, Gallino and Pulone1991, Reference Raiteri, Gallino, Busso, Neuberger and Käppeler1993), The, El Eid, & Meyer (Reference The, Eid and Meyer2000), Bisterzo et al. (Reference Bisterzo, Gallino, Pignatari, Pompeia, Cunha and Smith2004), Pignatari et al. (Reference Pignatari, Gallino, Meynet, Hirschi, Herwig and Wiescher2008, Reference Pignatari, Gallino, Heil, Wiescher, Käppeler, Herwig and Bisterzo2010), and Pumo et al. (Reference Pumo, Contino, Bonanno and Zappalá2010). Since the solar number ratio of iron to copper is ~ 1 600, the addition of only a few neutrons to the iron-peak elements can greatly increase the copper abundance. Obviously, the actual Cu enhancement depends on the details of the s-process environment and the neutron-capture cross-sections.
In this scenario, the Cu yield increases with increasing metallicity (e.g., Bisterzo et al. Reference Bisterzo, Gallino, Pignatari, Pompeia, Cunha and Smith2004; Kobayashi et al. Reference Kobayashi, Umeda, Nomoto, Tominaga and Ohkubo2006), as expected from the metallicity dependence of the s-process, but also increases with the mass of the massive star, presumably due to the size of the He- and C-burning regions.
A minor component of the Cu is thought to be produced during SNII explosive nucleosynthesis via the alpha-rich freeze-out (e.g., Woosley & Hoffman Reference Woosley and Hoffman1992; WW95). On the other hand, negligible copper production ([Cu/Fe] ~ −3 dex) resulted from the Chandrasekhar-mass deflagration model of SNIa by Fink et al. (Reference Fink2014).
Based on the above ideas, we can understand that [Cu/Fe] increases with [Fe/H] because the s-process yield of Cu increases with metallicity. The flattening of the [Cu/Fe] ratios above [Fe/H] ~ −0.8 can be ascribed to the addition of Fe from SNIa events, which produce iron but no copper. Thus, although the yield of Cu from SNII increases with metallicity the increasing addition of SNIa Fe, above [Fe/H] ~ −1 dex, serves to maintain the [Cu/Fe] ratio at a roughly constant value. In this way, the abundance of copper provides a nice consistency check on the SNIa time-delay effect used to explain the [α/Fe] trends with [Fe/H]. In Figure 12, the mostly thick disk stars of Reddy et al. (Reference Reddy, Lambert and Allende Prieto2006) lie at slightly higher [Cu/Fe] than the mostly thin disk stars of Reddy et al. (Reference Reddy, Tomkin, Lambert and Prieto2003), suggesting that the SFR in the thick disk was slightly higher/faster than the thin disk.
It seems possible that the [Cu/Fe] plateau below [Fe/H] ~ −1.5 dex may be dominated by α-rich freeze-out composition; thus, chemical composition of stars in plateau may provide a useful nucleosynthesis diagnostic of the alpha-rich freeze-out. Another nucleosynthetic clue is provided by the abnormally deficient [Cu/Fe] ratios observed in some dwarf galaxies, that also show greater deficiencies of hydrostatic alpha-elements (e.g., O, Mg) than the explosive alphas (e.g., Ca, Ti): for example, LMC (Pompéia et al. Reference Pompéia2008) and Sgr dSph (McWilliam & Smecker-Hane Reference McWilliam and Smecker-Hane2005). The low hydrostatic/explosive element abundance ratios in these two dwarf galaxies suggests a deficiency of the most massive stars (McWilliam et al. Reference McWilliam, Wallerstein and Mottini2013). Despite such low [Cu/Fe] ratios, the trend of [Cu/O] versus [Fe/H] is the same in Sgr and the MW disks, suggesting that Cu production is correlated with O production, but with a metal-dependent yield, as expected from a neutron-capture origin in massive stars. Similar Cu-deficiencies, combined with α-element deficiencies, have been seen in a sub-class of MW halo stars by Nissen & Schuster (Reference Nissen and Schuster1997; Reference Nissen and Schuster2011), that may have originated from one, or more, dwarf galaxies accreted by the MW halo. These chemical evolution clues support the idea that Cu is produced in SNII progenitors, tracing massive stars, but with a metallicity-dependent yield.
To date, the only reported abundance measurements for Cu in bulge stars was performed by J14. Figure 12 shows that the bulge [Cu/Fe] ratio increases from low to high [Fe/H], similar to the MW disk trend below [Fe/H]= − 0.8 dex; however, instead of the flattening in the [Cu/Fe] slope above this metallicity, the bulge [Cu/Fe] trend continues to rise, such that most points above [Fe/H]= − 0.6 dex lie well above the MW thin and thick disk values. Clearly, the bulge has a distinct [Cu/Fe] trend with [Fe/H], very different than the MW disks and halo. A large scatter in [Cu/Fe], for these more metal-rich stars, is also apparent. An important question is whether this scatter in [Cu/Fe] is real, or due to measurement errors.
Remarkably, the [Cu/O] versus [Fe/H] plot, shown in Figure 13, for the same bulge stars has much less scatter than the [Cu/Fe] versus [Fe/H] diagram. The small scatter in [Cu/O] versus [Fe/H], and the great similarity to the MW halo/disk values, provides a qualitative check that Cu is produced by massive stars (the oxygen producers) with a yield that increases with both metallicity and mass. I note that abundance ratios for stars in the LMC (Pompéia et al. Reference Pompéia2008) and the Sgr dwarf galaxy (McWilliam et al. Reference McWilliam, Wallerstein and Mottini2013) fall on the same locus, despite their low oxygen abundances. The tight scatter suggests that both the Cu and O abundances are roughly correct, or at least any error in one is cancelled by a similar error in the other; this is despite the different sensitivities of Cu I and [O I] lines to stellar atmosphere parameters.
[Cu/O] versus [Fe/H] in the bulge and MW disks and halo; symbols have the same meaning as in Figure 12. The bulge [Cu/O] trend is much tighter than for [Cu/Fe], and continues to super-solar metallicity, supporting the idea that synthesis of Cu and O are more closely related than that of Fe. The Cu–O trend is consistent with copper production via the weak s-process in SNII progenitors, as proposed by Raiteri et al. (Reference Raiteri, Busso, Picchio, Gallino and Pulone1991, Reference Raiteri, Gallino, Busso, Neuberger and Käppeler1993) and Pignatari et al. (Reference Pignatari, Gallino, Meynet, Hirschi, Herwig and Wiescher2008, Reference Pignatari, Gallino, Heil, Wiescher, Käppeler, Herwig and Bisterzo2010); in this case, the Cu yield depends on both the mass and metallicity of the progenitor star.

If the apparent large scatter in the [Cu/Fe] ratios of Figure 12 is real, this may be due to inhomogeneous chemical evolution, and the fact that Cu and O are co-produced in the same mass SNII progenitors, whereas Fe is produced in much lower-mass SNII, as well as SNIa. However, it may be that the [Cu/Fe] versus [Fe/H] diagram can be explained by normal measurement errors plus a trend that is slightly more complex than initially expected. It is also possible that a small number of foreground disk stars are present, with lower [Cu/Fe] ratios, and serve to increase the apparent dispersion.
Figure 14 shows an expanded portion of the [Cu/Fe] versus [Fe/H] plot, with a trend for the underlying metallicity-dependent [Cu/Fe] ratios indicated by a chocolate-coloured zig-zag swath. In this expansion, the same linear, metal-dependent, increasing [Cu/Fe] trend that is seen in the MW thick disk can be seen in the bulge; but, the bulge trend continues, linearly, to [Cu/Fe] ~ +0.45 dex by [Fe/H] ~ −0.2 dex. Above [Fe/H]= − 0.2 dex, the bulge [Cu/Fe] ratio declines with increasing [Fe/H], similar to the slopes displayed by the thin and thick disks.
A zoomed-in portion of [Cu/Fe] versus [Fe/H] in the bulge, MW disks and halo; symbols have the same meaning as in Figure 12. The chocolate-coloured strip indicates the bulge trend adopted in this work. The rise in [Cu/Fe] with increasing [Fe/H], above [Fe/H] ~ −1 dex, results from the metallicity-dependent Cu yield from SNII progenitors. A subsequent decline in bulge [Cu/Fe] above [Fe/H] ~ −0.2 dex is likely due to the delayed addition of Fe from SNIa; similar declines are seen for the MW thick and thin disks, but at lower [Fe/H] and [Cu/Fe] than the bulge. The final, uncertain, rise in bulge [Cu/Fe] above solar metallicity (marked by a dashed chocolate strip), if real, indicates the rising metal-dependent Cu yield overwhelming the SNIa Fe for super metal-rich stars. The [Cu/Fe] trend seen here, based on the abundances of Johnson et al. (Reference Johnson, Rich, Kobayashi, Kunder and Koch2014), are qualitatively consistent with a higher SFR in the bulge than the MW disks, as concluded from the bulge [O/Fe] and [Mg/Fe] ratios. The zig-zag shape is likely due to metal-dependent Cu yields from massive stars and the late addition of SNIa iron.

The rise to high [Cu/Fe] in the bulge could be explained by the lack of Fe from SNIa, which reduces [Cu/Fe] in the MW disks; instead, the [Cu/Fe] trend continues to increase with metallicity, due to the weak s-process in massive stars. The subsequent decline in the [Cu/Fe] ratio in the bulge can then be due to the addition of SNIa Fe beginning at a higher [Fe/H] in the bulge than in the disks. The scatter of points about the chocolate-coloured swaths in Figure 14 may reasonably be due to measurement uncertainty, and so there would be no need to appeal to inhomogeneous chemical enrichment of the bulge. For this reason, it would be profitable to re-visit the Cu abundances of bulge stars with improved accuracy.
The dashed chocolate-coloured swath in Figure 14, followed by a question mark, indicates a further speculation that would explain the bulge points near [Cu/Fe] ~ +0.5 and [Fe/H] ~ 0.4 dex. At such high [Fe/H], it is possible that those points are be due to blended Cu I lines. However, an alternative explanation is that after the decline in [Cu/Fe], due to the late addition of Fe from SNIa, the metal-dependent Cu yield continues to increase, into the SMR regime, and these higher copper yields from SNII progenitors eventually overwhelm the SNIa iron. In this way, the [Cu/Fe] ratio for SMR bulge stars again increases with increasing [Fe/H]. If this is true, then one should expect a similar turn-around in the MW disks. A few of the most metal-rich disk stars in Reddy et al. (Reference Reddy, Lambert and Allende Prieto2006) trend to higher [Cu/Fe], but the number of points is insufficient for a solid conclusion; also, these stars may suffer from blends with the Cu I lines. Remarkably, the chemical abundance study of stars within 15pc of the sun, by Allende Prieto et al. (Reference Prieto, Barklem, Lambert and Cunha2004) found a clear trend of rising [Cu/Fe] with increasing [Fe/H] for thin disk stars above the solar [Fe/H]; below solar [Fe/H] the Allende Prieto et al. (Reference Prieto, Barklem, Lambert and Cunha2004) results agree with thin disk [Cu/Fe] compositions of Reddy et al. (Reference Reddy, Lambert and Allende Prieto2006). Support for this rising [Cu/Fe] trend in thin disk stars above solar [Fe/H] is also evident in Figure 3 of the chemical abundance study of Feltzing & Gustafsson (Reference Feltzing and Gustafsson1998). I note that the slope of the SMR [Cu/Fe] versus [Fe/H] is consistent between these three thin disk studies, at ~ 0.1 dex dex−1, and also in rough agreement with the slope of the SMR rise of [Cu/Fe] in the bulge proposed here.
Interestingly, the zig-zag shaped [Cu/Fe] trend with [Fe/H] is similar to, but larger amplitude than, the [Na/Fe] trend. Both are consistent with metal-dependent yields from massive stars and the late addition of iron from SNIa.
These conclusions about the bulge [Cu/Fe] trend are qualitatively consistent with the idea that the bulge SFR was higher than the MW disks, and the SNIa time-delay scenario, proposed by Tinsley (Reference Tinsley1979) and MB90, to explain the trend of [O/Fe] in the MW. A detailed chemical evolution model for [Cu/Fe] needs to be consistent with the [O/Fe] trend in the bulge, and should provide constraints on the metal-dependent Cu yields and/or the bulge SFR. I note that Ga, Ge, and Se are also expected to be over-produced by the weak s-process, and these would provide a check on the conclusions drawn from Cu; unfortunately, these elements are spectroscopically challenging at solar [Fe/H]. Moderate enhancements of Rb and 25Mg are also expected from the weak s-process, and may also form the basis of a consistency check on Cu. These species should be measurable through the lines of Rb I at 7 800 and 7 947 Å and MgH in the 5 100–5 150 Å region.
I conclude that the enhanced [Cu/Fe] ratios in bulge stars suggests a greater role for SNII nucleosynthesis in the bulge than the MW disks, due to a higher SFR in the bulge.
5.6. Zinc
Similar to copper, zinc also thought to be produced by a combination of alpha-rich freeze-out during core-collapse SNe and the weak s-process in SNII progenitor stars (see Bisterzo et al. Reference Bisterzo, Gallino, Pignatari, Pompeia, Cunha and Smith2004; Pignatari et al. Reference Pignatari, Gallino, Meynet, Hirschi, Herwig and Wiescher2008, Reference Pignatari, Gallino, Heil, Wiescher, Käppeler, Herwig and Bisterzo2010; WW95). However, the alpha-rich freeze-out is thought to be much more important for zinc, relative to the weak s-process, compared to the situation for copper (Bisterzo et al. Reference Bisterzo, Gallino, Pignatari, Pompeia, Cunha and Smith2004).
The earliest attempted Zn measurements for metal-poor stars includes studies by Cohen (Reference Cohen1978; Reference Cohen1979) and Luck & Bond (Reference Luck and Bond1985). However, Sneden & Crocker (Reference Sneden and Crocker1988) and Sneden et al. (Reference Sneden, Gratton and Crocker1991) were the first to firmly establish the [Zn/Fe] abundance trend with [Fe/H] in the MW halo and disks. Modern MW disk/halo Zn abundance studies, with larger samples and smaller measurement uncertainties, include the work of Bensby et al. (Reference Bensby, Feltzing and Lundström2003; Reference Bensby, Feltzing, Lundström and Ilyin2005) and Reddy et al. (Reference Reddy, Tomkin, Lambert and Prieto2003; Reference Reddy, Lambert and Allende Prieto2006).
These studies have employed the 4 722 and 4 810 Zn I lines, which are fairly strong, so better for lower than higher metallicities. Allende Prieto et al. (Reference Prieto, Barklem, Lambert and Cunha2004) reported that the 4 722 Å line has strongly damped wings, larger than predicted by the Unsöld approximation. Inspection of the Arcturus Atlas (Hinkle et al. Reference Hinkle, Wallace, Valenti, Harmer, Hinkle, Wallace, Valenti and Harmer2000) suggests to me that the line is blended in both wings. The 6 362 Å Zn I line is also employed, but this line lies within a broad Ca I auto-ionisation feature, which should be properly included in the analysis; to me, the red wing of this line appears to be blended with a V I line in the spectrum of Arcturus.
The above abundance studies indicate [Zn/Fe] roughly flat with [Fe/H] for the MW disks, but with a mean [Zn/Fe] ~ +0.10 to + 0.15 dex for stars below [Fe/H] less than ~ −0.4 dex. Whilst the thick disk stars appear slightly enhanced compared to the thin disk, this seems to be due to a subtle slope of declining [Zn/Fe] with increasing [Fe/H] above [Fe/H]= − 0.4 dex. For stars greater than solar [Fe/H], the results of Bensby et al. (Reference Bensby, Feltzing and Lundström2003; Reference Bensby, Feltzing, Lundström and Ilyin2005) suggest a small increase in [Zn/Fe] with [Fe/H], whilst the Reddy et al. (Reference Reddy, Tomkin, Lambert and Prieto2003, Reference Reddy, Lambert and Allende Prieto2006) results show a flat trend at [Zn/Fe]=0.0 dex. Notably, the Reddy et al. (Reference Reddy, Tomkin, Lambert and Prieto2003, Reference Reddy, Lambert and Allende Prieto2006) samples have many fewer stars with super-solar [Fe/H] than the Bensby et al. (Reference Bensby, Feltzing and Lundström2003; Reference Bensby, Feltzing, Lundström and Ilyin2005) studies.
The study of solar neighbourhood of stars within 15 pc, by Allende Prieto et al. (Reference Prieto, Barklem, Lambert and Cunha2004), found strongly increasing [Zn/Fe] for stars above solar metallicity, up to [Zn/Fe]= + 0.5 dex for [Fe/H]= + 0.5 dex, based on only the 4810 Å Zn I line. Whilst such a strong increase in [Zn/Fe] is not supported by Bensby et al. (Reference Bensby, Feltzing and Lundström2003; Reference Bensby, Feltzing, Lundström and Ilyin2005), the fact that both studies find increasing [Zn/Fe] with increasing [Fe/H] above solar suggests that there is a real trend. Interestingly, this would be consistent with a nucleosynthetic component from the weak s-process, as suggested by Bisterzo et al. (Reference Bisterzo, Gallino, Pignatari, Pompeia, Cunha and Smith2004).
To date, only two bulge abundance studies have measured zinc: B13 and Barbuy et al. (Reference Barbuy2015). These two studies are in approximate agreement below solar [Fe/H], with a ~ +0.1 dex enhancement in [Zn/Fe]. Above solar metallicity, and up to [Fe/H]= + 0.5 dex, the lensed dwarfs of B13 show a similar ~ +0.1 dex [Zn/Fe] enhancement; however, the RGB stars of Barbuy et al. (Reference Barbuy2015) show a strong decline in [Zn/Fe] up to their most metal-rich star.
My interpretation of the Barbuy et al. (Reference Barbuy2015) result is that the decline in [Zn/Fe] begins near [Fe/H]= − 0.2 dex, with [Zn/Fe] starting near + 0.1 dex, and declining to [Zn/Fe]= − 0.4 dex by [Fe/H] ~ +0.3 dex. This indicates a maximal slope in the [Zn/Fe] versus [Fe/H] trend, that can only occur by adding Fe but no Zn. Since SNIa make iron but effectively no zinc, one way to reproduce the Barbuy et al. (Reference Barbuy2015) bulge [Zn/Fe] trend is in the case of iron enrichment dominated by SNIa above [Fe/H] ~ −0.2 dex.
At the moment, we can say that either the bulge [Zn/Fe] trend is identical to the MW disks, to within the measurement uncertainty, according to Bensby et al. (Reference Bensby, Feltzing and Lundström2003; Reference Bensby, Feltzing, Lundström and Ilyin2005; Reference Bensby2013), or that the stars above [Fe/H]= − 0.2 dex show the maximum possible decline in [Zn/Fe] with [Fe/H], according to the results of Barbuy et al. (Reference Barbuy2015). This latter possibility requires addition of Fe without Zn, as might be expected from material dominated by SNIa ejecta; this would have implications for understanding other elements. The putative paucity of Zn in SMR bulge stars would also suggest a sudden absence of the weak s-process contribution from SNII progenitors.
Clearly, further chemical abundance studies are required to resolve the differences between extant conclusions about the basic trends of [Zn/Fe] in the MW disks and the bulge. A new study on [Zn/Fe] in SMR disk dwarf stars would also be profitable. Furthermore, it might be helpful to measure [Zn/Fe] for a sample of disk red giant stars, in order to check the results from the dwarfs. For bulge stars, higher S/N spectra would be valuable.
6 NEUTRON-CAPTURE ELEMENTS
All elements beyond the iron-peak are made by neutron-capture, typically from a combination of both rapid, r-, and/or slow, s-, processes (e.g., Burbidge et al. Reference Burbidge, Burbidge, Fowler and Hoyle1957). However, a few rare proton-rich isotopes may result from a variety of other mechanisms occurring in special circumstances; for example, the γ process (e.g., Howard, Meyer, & Woosley Reference Howard, Meyer and Woosley1991) rp-process (e.g., Wallace & Woosley Reference Wallace and Woosley1981) and νp-process (Fröhlich et al. Reference Fröhlich2006).
Elements in the s-process peaks (e.g., Sr, Y, Zr, Ba, La, Ce), resulting from their small neutron-capture cross-sections as a consequence of nuclear shell structure, are often referred to as ‘s-process’ elements, even though, in the sun, the r-process contributes 15 to 28% of these (Simmerer et al. Reference Simmerer, Sneden, Cowan, Collier, Woolf and Lawler2004). Notably, at low metallicity and in metal-poor s-process rich stars these same elements are made mostly by the r-process (e.g., Sneden et al. Reference Sneden1996).
Similarly, elements commonly referred to as ‘r-process’, such as I, Pt, Au, Eu, Tb, Gd, Dy, and Ho range from 3 to 18% s-process in the solar composition (e.g., Simmerer et al. Reference Simmerer, Sneden, Cowan, Collier, Woolf and Lawler2004). The only 100% r-process elements are those beyond Bi/Pb; all of these are radioactive, although U and Th have very long half-lives.
6.1. The solar neighbourhood
It is surprising that the abundance trends [X/Fe] of all the neutron-capture elements, in the MW thick and thin disks are not yet fully explored. Chemical abundance measurements for neutron-capture elements in solar neighbourhood stars have been investigated for the last 56 yr, beginning with Baschek (Reference Baschek1959) and Aller & Greenstein (Reference Aller and Greenstein1960), with increasingly sophisticated analysis and ever larger samples of stars.
For the current discussion of neutron-capture elements in the MW thin and thick disks, it is expedient to rely on a few, relatively recent, high-precision chemical abundance studies. In particular, I shall rely on the chemical abundance studies for hundreds of MW disk dwarf stars, performed by Edvardsson et al. (Reference Edvardsson, Andersen, Gustafsson, Lambert, Nissen and Tomkin1993), Koch & Edvardsson (Reference Koch and Edvardsson2002), Bensby et al. (Reference Bensby, Feltzing, Lundström and Ilyin2005, Reference Bensby, Feltzing and Oey2014), and Reddy et al. (Reference Reddy, Tomkin, Lambert and Prieto2003, Reference Reddy, Lambert and Allende Prieto2006), Mishenina et al. (Reference Mishenina2013), and very recently by Battistini & Bensby (Reference Battistini and Bensby2016). Together, these studies encompass Sr, Y, Zr, Ba, La, Ce, Nd, and Eu; lines of other neutron-capture elements are not easily detected in dwarf turn-off stars.
Other useful studies encompassing MW disk stars include: RGB stars by Fulbright (Reference Fulbright2000, Reference Fulbright2002) for Y, Zr, Ba, and Eu; Simmerer et al. (Reference Simmerer, Sneden, Cowan, Collier, Woolf and Lawler2004) for La and Eu in dwarf and RGB stars; Feltzing & Gustafsson (Reference Feltzing and Gustafsson1998) for Y, La, Nd (and noisy measurements of Zr, Mo, and Hf) for metal-rich dwarf stars above [Fe/H]= + 0.1 dex, and Koch & Edvardsson (Reference Koch and Edvardsson2002) for Eu in disk dwarfs. This list is necessarily incomplete; I apologise to those excellent researchers whose work I have not mentioned here, but who’s efforts were important for our current understanding.
For barium, Edvardsson et al. (Reference Edvardsson, Andersen, Gustafsson, Lambert, Nissen and Tomkin1993), Bensby et al. (Reference Bensby, Feltzing, Lundström and Ilyin2005), and Reddy et al. (Reference Reddy, Lambert and Allende Prieto2006) found a flat trend of [Ba/Fe] with [Fe/H] in the thick disk, but slightly deficient, at [Ba/Fe]= − 0.1 dex over the range [Fe/H]= − 1 to + 0.0 dex; see Figure 15 for the Reddy et al. (Reference Reddy, Tomkin, Lambert and Prieto2003, Reference Reddy, Lambert and Allende Prieto2006) results.
[Y/Fe] and [Ba/Fe] in the MW thin disk (filled circles), thick disk (crosses), and Halo (open circles) from Reddy et al. (Reference Reddy, Tomkin, Lambert and Prieto2003, Reference Reddy, Lambert and Allende Prieto2006). The [Y/Fe] trend is roughly flat, whilst [Ba/Fe] is deficient by ~ 0.1 to 0.2 dex in the thick disk, or metal-poor stars and rises with [Fe/H] in the thin disk.

For the thin disk, Edvardsson et al. (Reference Edvardsson, Andersen, Gustafsson, Lambert, Nissen and Tomkin1993) found [Ba/Fe] mostly flat, near the solar ratio; but, the youngest stars showed slightly higher [Ba/Fe] near [Fe/H] ~ −0.2 dex and a slight deficiency near [Fe/H]= + 0.2 dex, suggesting a small downward trend. The Bensby et al. (Reference Bensby, Feltzing, Lundström and Ilyin2005) results show some scatter in the thin disk [Ba/Fe] at these metallicities, roughly consistent with the Edvardsson et al. (Reference Edvardsson, Andersen, Gustafsson, Lambert, Nissen and Tomkin1993) results. On the other hand, Reddy et al. (Reference Reddy, Tomkin, Lambert and Prieto2003) found a flat trend of [Ba/Fe] with [Fe/H] at [Ba/Fe] ~ 0.0 dex for the thin disk at all metallicities, as seen in Figure 15.
Figure 15 also shows Yttrium with a flat trend, at [Y/Fe]=0.0 dex, for both the thick and thin MW disks for Reddy et al. (Reference Reddy, Tomkin, Lambert and Prieto2003, Reference Reddy, Lambert and Allende Prieto2006). This is consistent with the results of Edvardsson et al. (Reference Edvardsson, Andersen, Gustafsson, Lambert, Nissen and Tomkin1993) and Bensby et al. (Reference Bensby, Feltzing, Lundström and Ilyin2005) in dwarf stars, and the giants analysed by Fulbright (Reference Fulbright2002). Note that, Reddy et al. (Reference Reddy, Tomkin, Lambert and Prieto2003, Reference Reddy, Lambert and Allende Prieto2006) also show a flat [Ce/Fe] trend at the solar value, similar to the Battistini & Bensby (Reference Battistini and Bensby2016) results shown in Figure 16.
Neutron-Capture elements in the MW disks from Battistini & Bensby (Reference Battistini and Bensby2016). Shallower slopes suggest larger s-process fractions. The [Eu/Fe] decline with [Fe/H] is similar to the α-elements and presumably due to the increasing importance of Fe from SNIa. Note the average [Eu/Fe] ~ 0.05 dex at solar [Fe/H].

Data from Edvardsson et al. (Reference Edvardsson, Andersen, Gustafsson, Lambert, Nissen and Tomkin1993) indicate a flat [Zr/Fe] trend with [Fe/H] with a possible enhancement of + 0.10 dex, similar to the giant stars of Fulbright (Reference Fulbright2002).
However, the 311 stars analysed by Battistini & Bensby (Reference Battistini and Bensby2016) show a clear increasing trend in [Zr/Fe] with decreasing [Fe/H], reaching [Zr/Fe] ~ +0.4 dex near [Fe/H]= − 1.0 dex (see Figure 20). In this way, the [Zr/Fe] trend in the MW disk appears to be similar to the behaviour of the α-elements, suggesting a strong r-process component for zirconium, or at least significant Zr production on short time scales. This is inconsistent with the 96% Main-s component assignment for Zr by Bisterzo et al. (Reference Bisterzo, Gallino, Straniero, Cristallo and Käppeler2011), the 81% s-process adopted by Simmerer et al. (Reference Simmerer, Sneden, Cowan, Collier, Woolf and Lawler2004), and even the 66% s-process adopted by Travaglio et al. (Reference Travaglio, Gallino, Enrico Arnone, Cowan, Jordan and Sneden2004) and Bisterzo et al. (Reference Bisterzo, Travaglio, Gallino, Wiescher and Käppeler2014).
Lanthanum abundances from Simmerer et al. (Reference Simmerer, Sneden, Cowan, Collier, Woolf and Lawler2004), and references therein, show a flat [La/Fe] trend, particularly at thick disk metallicities; a hint of a downward trend towards solar [Fe/H] is present. However, this putative decline in [La/Fe] is not maintained for the SMR stars of Feltzing & Gustafsson (Reference Feltzing and Gustafsson1998), which show [La/Fe]=0.0 dex up to [Fe/H] ~ +0.4 dex; thus, it appears that [La/Fe] is roughly flat at the solar ratio for all stars above [Fe/H] ~ −1. However, the results of Battistini & Bensby (Reference Battistini and Bensby2016), shown in Figure 16, suggests a shallow negative [La/Fe] slope with [Fe/H]. It is not clear whether this La decline is due to increased Fe from SNIa, metallicity-dependent s-process yields from AGB stars (e.g., Busso, Gallino, & Wasserburg Reference Busso, Gallino and Wasserburg1999; Cristallo et al. Reference Cristallo, Straniero, Gallino, Piersanti, Domínguez and Lederer2009, Reference Cristallo2011), or from systematic errors in the abundance measurements.
For MW disk dwarf stars, the studies of Woolf, Tomkin, & Lambert (Reference Woolf, Tomkin and Lambert1995), Koch & Edvardsson (Reference Koch and Edvardsson2002), Reddy et al. (Reference Reddy, Tomkin, Lambert and Prieto2003, Reference Reddy, Lambert and Allende Prieto2006), Bensby et al. (Reference Bensby, Feltzing, Lundström and Ilyin2005), and Mishenina et al. (Reference Mishenina2013) show that the [Eu/Fe] trend with [Fe/H] is much like the α-elements: enhanced by ~ +0.4 dex below [Fe/H] ~ −1, then declining linearly with increasing metallicity through the solar composition.
Whilst the Reddy et al. (Reference Reddy, Tomkin, Lambert and Prieto2003, Reference Reddy, Lambert and Allende Prieto2006) results include a number of stars with low [Eu/Fe] ratios, the mean trend appears to go through [Eu/Fe] ~ 0.0 dex at solar [Fe/H]. On the other hand, the mean Bensby et al. (Reference Bensby, Feltzing, Lundström and Ilyin2005) points intersect [Fe/H]=0.0 dex at [Eu/Fe] ~ +0.1 dex (see Figure 17); furthermore, the recent results of Battistini & Bensby (Reference Battistini and Bensby2016) also show an enhanced average [Eu/Fe] ratio, near ~ 0.05 dex, at solar metallicity. A small Eu-enhancement is also seen in the results of Mishenina et al. (Reference Mishenina2013), indicating the average [Eu/Fe] ~ +0.03 dex, at solar iron abundance.
[Eu/Fe] versus [Fe/H] in the Milky Way thick and thin disks, reported by Bensby et al. (Reference Bensby, Feltzing, Lundström and Ilyin2005) and Reddy et al. (Reference Reddy, Tomkin, Lambert and Prieto2003, Reference Reddy, Lambert and Allende Prieto2006). Open black squares: thick disk stars from Reddy et al. (Reference Reddy, Lambert and Allende Prieto2006); filled black squares: disk/halo stars from Reddy et al. (Reference Reddy, Lambert and Allende Prieto2006); black crosses: thin disk stars identified in Reddy et al. (Reference Reddy, Tomkin, Lambert and Prieto2003); open red squares: thick disk stars from Bensby et al. (Reference Bensby, Feltzing, Lundström and Ilyin2005); red crosses: thin disk stars from Bensby et al. (Reference Bensby, Feltzing, Lundström and Ilyin2005). Note that Bensby thin disk stars are higher than Reddy et al. (Reference Reddy, Tomkin, Lambert and Prieto2003, Reference Reddy, Lambert and Allende Prieto2006) by ~ 0.1 dex in [Eu/Fe].

If the [Eu/Fe] enhancement seen in Bensby et al. (Reference Bensby, Feltzing, Lundström and Ilyin2005) is real, then the sun is Eu-deficient relative to other solar-metallicity stars by ~ 0.1 dex. However, composition studies of solar twins (e.g., Ramírez, Meléndez, & Asplund, Reference Ramírez, Meléndez and Asplund2009) show very small element abundance scatter, and no obvious zero-point offsets, in neutron-capture element abundances; although the logic of this argument is somewhat circular.
For solar [Fe/H] MW disk stars in Battistini & Bensby (Reference Battistini and Bensby2016), the average Sr, La, and Ce lie slightly below the solar [X/Fe] ratio, whilst Sm and Eu lie slightly above, and the mean [Zr/Fe] and [Nd/Fe] are at roughly solar composition. The inconsistency across different elements, the scatter between studies, and the + 0.03 to + 0.05 dex level of the putative zero-point offsets all suggest that they are due to measurement error. Furthermore, an [Eu/Fe] trend that passes through the solar composition fits the reported abundances to within the abundance measurement errors.
On the other hand, the existence of a real zero-point abundance offset in [Eu/Fe] should be considered in the context of the MB90 chemical evolution scenario, used to explain the trend of [O/Fe] in the MW. The α-like decline of [Eu/Fe] with [Fe/H] suggests that, like oxygen, the r-process is associated with short-timescale progenitors. Presently favoured sites for the r-process include low-mass (8–10 M⊙) O-Ne-Mg SNII (Wanajo et al. Reference Wanajo2003) and merging neutron stars (Lattimer & Schramm Reference Lattimer and Schramm1974; Symbalisty & Schramm Reference Symbalisty and Schramm1982), recently resurrected (e.g., Goriely, Bauswein, & Hans-Thoms Reference Goriely, Bauswein and Hans-Thoms2011; Wanajo et al. Reference Wanajo, Sekiguchi, Nishimura, Kiuchi, Kyutoku and Shibata2014).
Consistent with this explanation for the α-like trend of Eu is the decline in [Nd/Fe] with increasing [Fe/H], which shows a shallower slope than Eu; Nd is thought to be roughly half r- and half s-process, whereas ~ 94% of Eu is attributed to the r-process.
In summary, the current data indicates that the classical s-process elements, Sr, Y, Ba, La, and Ce, show roughly flat trends with [Fe/H], near the solar [X/Fe] value, whilst the r-process element Eu exhibits a steep decline, from [Eu/Fe] ~ +0.4 dex down to 0.0 dex at solar [Fe/H], similar to the trend seen for the α-elements.
Neutron-capture elements with significant r-process contributions show declining [X/Fe] ratios with increasing metallicity, like the α-elements, but the larger the s-process contribution, the shallower the slope. The s-process component is the likely reason that Nd shows a slope declining from [Nd/Fe] of only + 0.25 dex in the halo, compared to the 0.4 dex decline for [Eu/Fe]. The decline in Sm is greater than for Nd, as one might expect from the smaller s-process contribution to Sm. However, the samarium trend closely resembles the slope of the Eu and the α-element trends, suggesting that Sm has a higher r-process fraction than the value of 66% to 69%, suggested by Burris et al. (Reference Burris, Pilachowski, Armandroff, Sneden, Cowan and Roe2000), Simmerer et al. (Reference Simmerer, Sneden, Cowan, Collier, Woolf and Lawler2004), and Bisterzo et al. (Reference Bisterzo, Travaglio, Gallino, Wiescher and Käppeler2014).
Alternatively, a steeper than expected decline in [Sm/Fe] could be due to the metallicity-dependent yield of heavy s-process elements, as detailed by Busso et al. (Reference Busso, Gallino and Wasserburg1999). In this case, the number of iron-peak seed nuclei increase with increasing metallicity, whilst the neutron irradiation is roughly constant; thus, at higher [Fe/H] each seed nucleus captures fewer neutrons, and the s-process production of the heaviest nuclei is reduced, whilst the production of light s-process elements is increased.
The α-like slope of Zr, as measured by Battistini & Bensby (Reference Battistini and Bensby2016), may lead one to conclude that it, too, is dominated by the r-process at [Fe/H] ~ −1, despite the strong s-process component in the solar composition. Alternatively, the strong Zr slope may be due to other nucleosynthetic processes associated with short timescales, and massive stars, such as the alpha-rich freeze-out, or other light element production process (e.g., Woosley & Hoffman Reference Woosley and Hoffman1992).
The fact that the classical s-process elements show flat [X/Fe] ratios, even though the chemical evolution scenario of MB90, indicates that the delayed addition of iron from SNIa cause the [α/Fe] ratios to decline by ~ 0.4 dex, shows that the production of the s-process elements must have increased along with the delayed injection of SNIa iron. This is qualitatively consistent with the idea that the main component of the s-process is due to relatively low-mass stars, at 2–3 M⊙ (e.g., see summary in Busso et al. Reference Busso, Straniero, Gallino, Abia, McWilliam and Rauch2004), whose lifetimes are not too dissimilar to the delayed SNIa progenitors. Thus, elements produced by the main s-process may use used to infer long formation timescales.
6.2. Neutron-capture elements in the bulge
Whilst a number of bulge chemical abundance studies have reported results for various neutron-capture elements, the situation is not yet in a satisfactory state, due to measurement errors, number of stars, and number of elements studied; in particular, key diagnostic abundance ratios remaining poorly constrained.
The neutron-capture element abundance studies considered here include the RGB stars of MR94 and work performed by Fulbright (unpublished) appearing in the MFR10 (henceforth MFR10/Fu), the RC giants studied by Johnson, McWilliam, & Rich (Reference Johnson, McWilliam and Rich2013) and van der Swaelmen et al. (Reference van der Swaelmen, Barbuy, Hill, Zoccali, Minniti, Ortolani and Gomez2016), and the lensed dwarfs of B13.
The main result is that the bulge neutron-capture abundances are roughly similar to the MW thin and thick disks. However, results for the [Eu/Fe] trend are most consistent with a slight enhancement at solar [Fe/H], similar to the observed bulge α-element enhancements (see Section 3). Furthermore, the [La/Eu] ratios indicate that the rise of the s-process component starts at a higher [Fe/H] in the bulge than the MW disks. In the context of the MB90 chemical evolution scenario, both of these observed abundance trends are consistent with the idea that the SFR in the bulge was higher than in the MW thin and thick disks.
6.2.1. The r-process and [Eu/Fe]
To date, europium is the only nearly pure r-process element whose abundances have been measured in the bulge; although, bulge abundance measurements for neodymium (roughly half r-process in the sun) are available.
Very noisy europium abundance measurements were first attempted, for 11 bulge RGB stars, by MR94, who concluded that [Eu/Fe] appeared slightly enhanced, comparable to the trend with [Fe/H] seen in solar neighbourhood disk stars; but the MR94 Eu measurements were very noisy.
MFR10/Fu reported [Eu/Fe] EW abundance measurements for 25 bulge RGB stars (filled red triangles in Figure 18), where abundances from Fe II lines were employed to ratio with the Eu II line at 6645 Å. The bulge MFR10/Fu [Eu/Fe] trend with [Fe/H] is identical, within the errors, to the α-like downward trend with [Fe/H] seen in the MW disk data of Bensby et al. (Reference Bensby, Feltzing, Lundström and Ilyin2005). As previously noted, the [Eu/Fe] versus [Fe/H] trend for MW disk stars, by Bensby et al. (Reference Bensby, Feltzing, Lundström and Ilyin2005), does not pass through the solar composition, but is europium-rich, with [Eu/Fe] ~ +0.1 dex at [Fe/H]=0.0 dex; thus, either there is a zero-point error in Bensby et al. (Reference Bensby, Feltzing, Lundström and Ilyin2005), or the sun is Eu-deficient. I note that the three most metal-rich stars in MFR10/Fu, near [Fe/H] ~ +0.5 dex (see Figure 18), lie above the extrapolated bulge trend, possibly signalling unaccounted blending of the Eu II line at high metallicity.
[Eu/Fe] versus [Fe/H] in the bulge compared to the MW disk data of Battistini & Bensby (Reference Battistini and Bensby2016; filled black circles). Filled red triangles: MFR10/Fu, normalised with Fe II line abundances. Filled green circles represent [Eu II/Fe I] from Johnson et al. (Reference Johnson, Rich, Kobayashi and Fulbright2012), showing overall deficient [Eu/Fe] at all [Fe/H]. Filled blue squares indicate [Eu II/Fe I] from van der Swaelmen et al. (Reference Wallerstein2016), with stars mostly above solar [Fe/H].

Even excluding the most metal-rich stars, the MFR10/Fu [Eu/Fe] trend (shown in Figure 18) indicates enhanced [Eu/Fe] near ~ 0.1 dex at solar [Fe/H]. In the MFR10/Fu data, the bulge reaches the solar [Eu/Fe] ratio at [Fe/H]= + 0.2 dex. Whilst noisy, and based on relatively few stars, the use of Fe II lines for the [Eu/Fe] ratios makes the MFR10/Fu results robust against systematic errors in the adopted model atmosphere gravities and [α/Fe] ratios.
Europium abundances measured for 39 and 56 mostly RGB stars by Johnson et al. (Reference Johnson, Rich, Kobayashi and Fulbright2012) and van der Swaelmen et al. (Reference van der Swaelmen, Barbuy, Hill, Zoccali, Minniti, Ortolani and Gomez2016), respectively, show considerable scatter in Figure 18. At least some of this noise was probably due to the relatively low resolution (R ~ 25 000) spectra of the Johnson et al. (Reference Johnson, Rich, Kobayashi and Fulbright2012) Blanco Hydra fibre data; van der Swaelmen et al. (Reference van der Swaelmen, Barbuy, Hill, Zoccali, Minniti, Ortolani and Gomez2016) employed VLT/UVES spectra at R ~ 45 000. The Johnson et al. (Reference Johnson, Rich, Kobayashi and Fulbright2012) S/N was significantly higher than van der Swaelmen’s, such that the overall spectral quality was similar. By comparison, the spectra used for the MFR10/Fu abundances were based on Keck/HIRES R ~ 45 000 to 60 000 spectra and S/N ~ 45–100 per pixel. An additional source of noise results from the use of iron abundances from Fe I lines, instead of Fe II lines, to compare with Eu II abundances for the [Eu/Fe] ratio in the studies of Johnson et al. (Reference Johnson, Rich, Kobayashi and Fulbright2012) and van der Swaelmen et al. (Reference van der Swaelmen, Barbuy, Hill, Zoccali, Minniti, Ortolani and Gomez2016). Because [Eu II/Fe I] ratios are sensitive to the H− opacity, significant systematic errors in the ratio can result from errors in the adopted logg, [Fe/H], and [α/Fe] ratios.
The Johnson et al. (Reference Johnson, Rich, Kobayashi and Fulbright2012) [Eu/Fe] ratios show a declining trend with increasing [Fe/H], but the points lie 0.1 to 0.2 dex below the MW disk ratio at all [Fe/H]. Notably, points below [Fe/H] ~ −0.8 dex are roughly 0.2 dex lower than MFR10/Fu. If we choose to employ these metal-poor points to set and correct a systematic zero-point error, then the more metal-rich [Eu/Fe] trend lies above the MW disk trend, roughly consistent with the MFR10/Fu results, and indicating an enhanced [Eu/Fe] ratio at solar [Fe/H].
The van der Swaelmen et al. (Reference van der Swaelmen, Barbuy, Hill, Zoccali, Minniti, Ortolani and Gomez2016) [Eu/Fe] ratios also show an α-like decline with [Fe/H], similar to the MW disk, but higher than Johnson et al. (Reference Johnson, Rich, Kobayashi and Fulbright2012) with a large scatter above solar [Fe/H]. For the few points at low metallicity, the [Eu II/Fe I] values show no offset relative to MFR10/Fu or the MW disk results, and therefore there is no case for an overall zero-point shift. The van der Swaelmen et al. (Reference van der Swaelmen, Barbuy, Hill, Zoccali, Minniti, Ortolani and Gomez2016) sample is heavily weighted to super-solar [Fe/H]; for these metal-rich stars, the range of [Eu/Fe] at roughly fixed [Fe/H] is ~ 0.8 dex, suggesting a 1σ dispersion of ~ 0.2 dex.
Whilst all studies of [Eu/Fe] in the bulge show an α-like decline with [Fe/H], the detailed study-to-study differences makes it difficult to determine whether the bulge [Eu/Fe] is slightly enhanced relative to the MW disks, as one would expect based on the slightly enhanced bulge [O/Fe] and [Mg/Fe] ratios. Comparison with the MW disk is complicated by the reported enhanced disk [Eu/Fe] ratios at solar [Fe/H]; this is most likely due to zero-point errors in the disk star measurements, but could be due to a europium deficiency in the sun.
Taking these issues into consideration, I think that MFR10/Fu provide the most robust estimate of the bulge [Eu/Fe] trend with [Fe/H], due to the higher resolution spectra employed and the use of Fe II lines in the normalisation.
I assume that the variance in reported [Eu/Fe] values, for MW disk stars at solar-metallicity, indicate the presence of small zero-point measurement errors, rather than a genuine deficiency of europium in the sun. Thus, the bulge [Eu/Fe] data are consistent with a small enhancement in [Eu/Fe], roughly + 0.1 dex at solar [Fe/H], relative to the MW disk trend. This is in qualitative agreement with expectations from the measured enhancements of [O/Fe] and [Mg/Fe] in the bulge, suggesting that the SFR was higher than the MW thin and thick disks.
The scatter in reported bulge [Eu/Fe] abundance ratios leaves open the possibility that the [Eu/Fe] trend with [Fe/H] might not be consistent with the measured [O/Fe] and [Mg/Fe] enhancements. In that case, it would be necessary to add complexity to the chemical evolution scenario of MB90.
Clearly, more Eu abundance work is required for both disk and bulge stars, with the goal of reducing the measurement uncertainties. This may be achieved by the acquisition of higher S/N, higher resolution, spectra of RC bulge stars, and including additional Eu II and Fe II lines, for line-by-line differential, profile-matching, spectrum synthesis abundance analyses.
Whilst europium is the most pure r-process element measured in bulge stars, at 94% r-process in the solar composition (Bisterzo et al. Reference Bisterzo, Travaglio, Gallino, Wiescher and Käppeler2014), neodymium has a significant solar r-process component, at 43%.
The trend of [Nd/Fe] with [Fe/H] in the bulge, as reported by Johnson et al. (Reference Johnson, Rich, Kobayashi and Fulbright2012) and van der Swaelmen et al. (Reference van der Swaelmen, Barbuy, Hill, Zoccali, Minniti, Ortolani and Gomez2016) shows a strong downward sloping trend, suggesting a dominant r-process component for Nd. The overall trend from both studies is lower than the MW disk by 0.15 to 0.20 dex. This deficiency might be real, say due to a low s-process component for Nd, or could be due to systematic error, resulting from an improper model atmosphere gravity and the fact that Nd II line abundances were ratioed with Fe I line abundances, instead of Fe II. However, since the bulge Y and Ba abundance trends for lensed dwarf stars (see Section 3) are similar to the MW disks, and because of similar deficiencies in the [Eu/Fe] trend for these studies, we assume that the low bulge [Nd/Fe] ratios from Johnson et al. (Reference Johnson, Rich, Kobayashi and Fulbright2012) and van der Swaelemen et al. (Reference van der Swaelmen, Barbuy, Hill, Zoccali, Minniti, Ortolani and Gomez2016) are likely due to systematic error, perhaps to the adopted model atmosphere parameters. The very large scatter in measured bulge Nd abundances shows that more work on this element is required, employing superior spectra and more robust analysis techniques.
6.2.2. An r-process rich bulge star
Johnson et al. (Reference Johnson, Rich, Kobayashi and Fulbright2012) found [Eu/Fe]= + 0.93 dex for their most metal-poor bulge star, at [Fe/H]= − 1.54 dex. A follow-up study of this star, by Johnson et al. (Reference Johnson, McWilliam and Rich2013), employed a MIKE-Magellan spectrum with higher S/N spectra and twice the resolving power, at R = 40 000. The new abundance analysis included Fe II lines, which enabled a gravity-insensitive [Eu/Fe] ratio to be measured; the improved spectrum yielded [Fe/H]= − 1.67 and [Eu/Fe]= + 0.99 dex. Thus, [Eu/Fe] for this star is ~ 0.6 dex higher than the typical for the MW halo. Furthermore, Johnson et al. (Reference Johnson, McWilliam and Rich2013) found that the heavy-element abundance distribution in this star was well fit by the solar r-process pattern. Thus, this star appears to be a mild version of the r-process rich stars in the MW halo (e.g., Sneden et al. Reference Sneden, McWilliam and Searle1994, Reference Sneden1996), but with [Fe/H] more than 1.0 dex higher than the halo r-process rich stars.
The explanation for the halo r-process rich stars is that the neutron-capture elements come from a single r-process event and that such events are rare, at most 1/40 of the total SN population (e.g., McWilliam et al. Reference McWilliam, Preston, Sneden and Searle1995). If Johnson’s bulge r-process rich star resulted from the same mechanism, then at the metallicity of the halo r-process rich stars, the bulge star would have [Eu/Fe]= + 2.0 dex, roughly 0.4 dex higher than the halo r-process stars.
Did the bulge r-process star material result from a single unusually strong r-process event, later diluted by normal material up to [Fe/H]= − 1.67 dex? Alternatively, could the s-process dispersion seen in the MW halo be shifted to higher [Fe/H] in the bulge, perhaps as a result of a faster chemical enrichment timescale for iron, or dilution with less pristine gas in the bulge?
If the bulge r-process dispersion is shifted to higher [Fe/H] than the halo, one expects the slightly more metal-poor bulge stars to show a large dispersion and steeply declining [Eu/Fe] ratios. In this regard, the study of Koch et al. (Reference Koch, McWilliam, Preston and Thompson2016) found the [Eu/Fe] of their four bulge stars with [Fe/H] ~ −2 dex to be near 0.0 dex, roughly 0.4 dex lower than halo stars at the same metallicity. Thus, it is possible that the dispersion in the [r-process/Fe] trend is shifted to higher [Fe/H] in the bulge than the MW halo.
The relatively high [Fe/H] of Johnson’s bulge r-process rich star is similar to three r-process rich stars in the Ursa Minor dwarf galaxy (Sadakane et al. Reference Sadakane, Arimoto, Ikuta, Aoki, Jablonka and Tajitsu2004; Cohen & Huang Reference Cohen and Huang2010), with [Fe/H] between − 1.7 and − 1.5 dex, and [Eu/Fe] ~ +0.9 dex. This raises the possibility that Johnson’s bulge r-process star was captured from a dwarf galaxy.
6.2.3. The s-/r- process ratio and the rise of the s-process
In Figure 19, the classical first and second s-process elements Y and Ba, measured in lensed bulge dwarf stars by B13, show roughly flat trends, and a slight Ba deficiency; this is close to the behaviour of these two elements in the MW disk (appearing in Figure 15), although the comparisons more closely resemble the thick disk trends.
Abundance [X/Fe] trends, as a function of [Fe/H], for classical first and second s-process peak elements (Y and Ba, respectively), for lensed dwarf stars measured by Bensby et al. (Reference Bensby2013). The slight deficiency and flat trend is similar to the MW disks (see Figure 15).

Regarding lanthanum, the bulge results from MFR10/Fu, Johnson et al. (Reference Johnson, Rich, Kobayashi and Fulbright2012), and van der Swaelmen et al. (Reference van der Swaelmen, Barbuy, Hill, Zoccali, Minniti, Ortolani and Gomez2016) all show a subtle decline in [La/Fe] with increasing [Fe/H]. It is notable that the Johnson et al. (Reference Johnson, Rich, Kobayashi and Fulbright2012) [La/Fe] points lie ~ 0.15 dex lower than the MFR10/Fu values, and both trends are lower than the MW disk results of Battistini & Bensby (Reference Battistini and Bensby2016). On the other hand, the MFR10/Fu [La/Fe] trend with [Fe/H] is practically identical to that found by Simmerer et al. (Reference Simmerer, Sneden, Cowan, Collier, Woolf and Lawler2004) for the MW disks and halo. Thus, similar to the situation for Eu, the comparison of the bulge [La/Fe] results with the MW disks is not fully constrained, partly because the MW disk trends have not yet converged at the 0.1 dex level.
One potential cause for the variance in reported MW disk [La/Fe] trends may be related to whether the target stars are red giants or dwarfs. Difficulties for the comparison of the disk and bulge [La/Fe] trends include: the possibility of systematic errors, such as the absence of Fe II line abundances for [X/Fe] ratios in the Johnson et al. (Reference Johnson, Rich, Kobayashi and Fulbright2012) and van der Swaelmen et al. (Reference van der Swaelmen, Barbuy, Hill, Zoccali, Minniti, Ortolani and Gomez2016) studies; difficulties with accounting for blends and continuum, and the small line depths, that characterise the lower resolution studies of Johnson et al. (Reference Johnson, Rich, Kobayashi and Fulbright2012) and van der Swaelmen et al. (Reference van der Swaelmen, Barbuy, Hill, Zoccali, Minniti, Ortolani and Gomez2016); and, possible unaccounted blending affecting the EW method for the most metal-rich stars studied by MFR10/Fu.
At this point, the question of whether the abundance of classical s-process elements, compared to iron, is higher, lower, or the same in the bulge as the MW disk depends entirely on which studies are chosen for the comparison.
Regardless of zero-point uncertainties, [Nd/Fe] and [La/Fe] are lower at high metallicity in both the bulge and the MW disks and in both these Galactic components the slope is steeper for Nd than La.
This metal-dependence may simply be due to the predicted decline in s-process yields from AGB stars with increasing metallicity (e.g., Cristallo et al. Reference Cristallo, Straniero, Gallino, Piersanti, Domínguez and Lederer2009, Reference Cristallo2011), or may be due to the decline in available neutrons per iron-peak seed nucleus: as the number of seed nuclei increase with increasing [Fe/H] (the [hs/ls] effect as described by Busso et al. Reference Busso, Gallino and Wasserburg1999); or the decline may simply be due to an increasing yield of Fe from SNIa as time progressed. It is likely that all three mechanisms were at work.
Regarding the first s-process peak element zirconium, Figure 20 shows the bulge results from Johnson et al. (Reference Johnson, Rich, Kobayashi and Fulbright2012) indicating that the bulge shares the same strong decline in [Zr/Fe] with [Fe/H] seen in the MW disks by Battistini & Bensby (Reference Battistini and Bensby2016); however, the bulge [Zr/Fe] ratios, derived from RC stars, are shifted lower than the disk values, by 0.1–0.2 dex, at all metallicities. Since these [Zr/Fe] ratios were derived from Zr I and Fe I lines, they are not very sensitive to model atmosphere logg or [α/Fe] values, or other H− opacity effects. Whilst it is possible that the putative bulge Zr deficiency has a nucleosynthetic origin, I note that non-LTE over-ionisation of Zr I in MW disk cool RGB stars results in LTE abundance deficiencies of up to ~ 0.4 dex, compared to abundances derived from Zr II lines (Brown, Tomkin, & Lambert Reference Brown, Tomkin and Lambert1983). For the time being, it is best to assume that the apparent relative [Zr/Fe] deficiency in the bulge is simply due to non-LTE effects on Zr I lines.
[Zr/Fe] versus [Fe/H] in bulge Red Clump stars, from Johnson et al. (Reference Johnson, Rich, Kobayashi and Fulbright2012; filled green circles), compared to the Milky Way thick and thin disk F and G dwarf stars (Battistini & Bensby Reference Battistini and Bensby2016; filled black circles). Whilst the deficiency in the measured bulge [Zr/Fe] ratios may be real and require an explanation in nucleosynthesis, differential non-LTE over-ionisation of Zr I in giant relative to dwarf stars may be responsible (e.g., Brown et al. Reference Brown, Tomkin and Lambert1983).

Since 2–3 M⊙ stars are thought to be responsible for the main s-process, and the r-process is associated with SNII events (either directly or from merging neutron stars) with short progenitor lifetimes, the transition from r-process to s-process, effectively the rise of the s-process, provides a probe for the rate of chemical enrichment. Thus, it is possible to gain insight into the formation timescale and SFR in the bulge from the relative proportions of r- and s-process elements.
Ideally, the s- to r-process ratio is best measured from pure s- and pure r-process elements. Common choices for nearly pure s- and r- elements in dwarf stars are Ba and Eu; both elements are represented by ionised lines, which are relatively robust against non-LTE effects. In dwarf stars, the Ba II lines are unsaturated but relatively strong and easy to detect, whilst the Eu II lines are significantly weaker, but measurable with sufficiently high S/N spectra. In RGB and RC giant stars, ionised lines are much stronger than in dwarf stars, resulting in badly saturated Ba II lines near solar metallicity. As a result, the s-process is better measured using La II lines (e.g., McWilliam Reference McWilliam1997) which are typically readily detected but unsaturated in solar metallicity red giant stars. Notably, La II lines have very strong hyperfine splitting, resulting in significant de-saturation to very high EW and, therefore, more precise abundance measurement.
Only the bulge abundance studies of MFR10/Fu, Johnson et al. (Reference Johnson, Rich, Kobayashi and Fulbright2012), and van der Swaelemen et al. (Reference van der Swaelmen, Barbuy, Hill, Zoccali, Minniti, Ortolani and Gomez2016) permit measurement of s-/r-process ratios from [La/Eu] abundances. Fortunately, the [La/Eu] ratio is robust against potential systematic errors due to the use of inappropriate model atmosphere gravities or [α/Fe], because the ratio is computed using ionised lines.
Figure 21 shows that the [La/Eu] ratios from all three bulge studies are systematically lower than the MW disk trend. The Johnson et al. (Reference Johnson, Rich, Kobayashi and Fulbright2012) and MFR10/Fu [La/Eu] results are consistent with halo-like s-/r-process ratios over the entire metallicity range. However, as noted earlier the MFR10/Fu points with [Fe/H] near + 0.5 dex have suspiciously high [Eu/Fe], which may indicate a blend with the single Eu II line used in their analysis; thus, it is probably better to give the points near [Fe/H]= + 0.5 dex lower weight. Certainly, more detailed spectrum synthesis of the Eu II line at 6 645 Å and the use of other Eu II lines would be helpful for understanding the europium content of the most metal-rich bulge stars. If the [Fe/H] ~ +0.5 dex points are ignored, it is possible to interpret both the Johnson et al. (Reference Johnson, Rich, Kobayashi and Fulbright2012) and the MFR10/Fu bulge points as consistent, with a slowly rising [La/Eu] ratio for stars above the solar [Fe/H], although the bulge [La/Eu] ratio still lies well below the disk trend. Extrapolating these remaining bulge points suggests a possible intercept with the solar [La/Eu] ratio near [Fe/H]= + 0.5 dex.
A comparison of [La/Eu] in the MW halo (crosses from Simmerer et al. Reference Simmerer, Sneden, Cowan, Collier, Woolf and Lawler2004) and disk (filled black circles from Battistini & Bensby Reference Battistini and Bensby2016) with bulge points from MFR10/Fu (red filled triangles), Johnson et al. (Reference Johnson, Rich, Kobayashi and Fulbright2012; filled green circles), and medianed van der Swaelmen et al. (Reference van der Swaelmen, Barbuy, Hill, Zoccali, Minniti, Ortolani and Gomez2016; open blue squares). The lower dotted line shows the solar-system r-process value from Simmerer et al. (Reference Simmerer, Sneden, Cowan, Collier, Woolf and Lawler2004) and the upper dotted line shows a strong (neutron exposure of 1.5 mb−1) s-process ratio, from Malaney (Reference Malaney1987). All three bulge studies indicate a larger r-process fraction (smaller s-process) than the MW disk, consistent with a higher SFR in the bulge. The medianed van der Swaelmen et al. (Reference van der Swaelmen, Barbuy, Hill, Zoccali, Minniti, Ortolani and Gomez2016) results, exhibiting the smallest r-process enhancement of the three, shows [La/Eu] shifted to ~ +0.2 dex higher [Fe/H] than the MW disk trend (with a range from + 0.1 to + 0.3 dex).

Individual [La/Eu] ratios from van der Swaelmen et al. (Reference van der Swaelmen, Barbuy, Hill, Zoccali, Minniti, Ortolani and Gomez2016) show significant scatter, roughly 1.0 dex near [Fe/H]= + 0.1 dex; although the bulk of points are fairly consistent. Because of this scatter, each of the van der Swaelmen et al. (Reference van der Swaelmen, Barbuy, Hill, Zoccali, Minniti, Ortolani and Gomez2016) points in Figure 21, indicated by large open blue boxes, represents the median of 5 points, consecutive in [Fe/H]. The trend of these medianed points suggest that the bulge reaches solar [La/Eu] near [Fe/H]= + 0.2 dex, but this intercept may reasonably occur between [Fe/H] + 0.1 and + 0.3 dex.
The low [La/Eu] ratios from all three bulge studies indicates that ejecta from 2–3 M⊙ AGB stars, that produce the main s-process, were less significant in the bulge than the disk. This could be explained by a shorter (i.e., faster) chemical enrichment timescale in the bulge, compared to the MW disk, or equivalently, that the bulge had a higher SFR than the disk, so that higher [Fe/H] was reached before the AGB stars had time to pollute the ISM. Other possible explanations include a heavier IMF in the bulge and/or a smaller rate of pristine gas infall into the bulge than the disk.
In summary, all three studies reached the conclusion that the [La/Eu] ratios in bulge stars contain less s-process material, or equivalently, a higher r-process fraction, than MW disk stars. Figure 21 suggests that the bulge [La/Eu] versus [Fe/H] trend may be shifted to higher [Fe/H], by 0.2 to 0.5 dex, relative to the MW disks, consistent with a SFR 1.6 to 3 times higher in the bulge.
The neutron capture element ratios in the bulge show that it is chemically distinct from the MW halo, thick, and thin disk stars examined in the solar vicinity.
6.2.4. Spinstars?
I should mention a red herring that was initially exciting: Early results for the bulge globular cluster NGC 6522, based on relatively low-dispersion GIRAFFE spectra (Barbuy et al. Reference Barbuy2009; Chiappini et al. Reference Chiappini2011) found evidence for strong [Y/Fe] and [Sr/Fe] abundances, near + 1.0 dex; in particular, the [Y/Ba] ratios were so strong that they were inconsistent with main s-process AGB nucleosynthesis. It was suggested that s-processing in rapidly rotating, metal-poor, massive stars, known as spinstars, may reproduce the measured abundances. In such objects, 12C is transported by rotational mixing from the He-burning core into hydrogen-rich layers, undergoes proton burning, and later returns to the He-core. By this mechanism, primary 22Ne is ultimately produced, followed by s-processing via the 22Ne(α,n)25Mg chain. The most abundant predicted elements from this s-processing are Sr, Y, and Zr (e.g., Pignatari et al. Reference Pignatari, Gallino, Meynet, Hirschi, Herwig and Wiescher2008).
More recent work on this globular cluster, by Barbuy et al. (Reference Barbuy2014), with significantly higher resolving-power spectra and much greater wavelength coverage than the original study, did not support their earlier findings. Indeed, the heavy element abundances in Barbuy et al. (Reference Barbuy2014) fit nicely with the trends now established for the bulge field stars. Thus, at present, there is no strong evidence for spinstar nucleosynthesis in the bulge.
7 SUMMARY AND DISCUSSION
7.1. Metallicity distribution function
Measurements of the bulge MDF, indicated by [Fe/H], show a convergence for RC stars and lensed dwarf stars. As measured by RC giants, at a latitude of b = −4°, the results of Hill et al. (Reference Hill2011) and G15 have an average and median [Fe/H] of + 0.06 and + 0.15 dex, respectively. The difference between these two measures results from a skew in the IDF. These [Fe/H] values for the bulge exceed the solar neighbourhood, mostly thin disk, stars within 15 pc from the study of Allende Prieto et al. (Reference Prieto, Barklem, Lambert and Cunha2004), where the mean and median [Fe/H] values are both − 0.13 dex. Thus, the b = −4° bulge is more metal-rich than the solar neighbourhood thin disk, on average, by almost 0.2 dex, whilst the peak of the two IDFs differ by nearly 0.3 dex. A higher T eff scale for dwarf stars, by Casagrande et al. (Reference Casagrande, Ramírez, Meléndez, Bessell and Asplund2010), would increase the solar neighbourhood IDF by ~ 0.10 dex, and give a mean [Fe/H] close to solar composition, similar to the Stromgren photometry survey of Casagrande et al. (Reference Casagrande2011). Including these adjustments, the bulge RC IDF is ~ 0.10 dex higher than the solar neighbourhood thin disk.
The MDF measured by Mg, whose production is overwhelmingly dominated by SNII progenitors, shows a difference between solar neighbourhood and bulge at b = −4° of ~ 0.33 dex, for the same studies as the [Fe/H] comparison. These comparisons show that the yield of Fe and Mg are higher in the bulge than the solar neighbourhood thin disk. This difference between bulge and solar neighbourhood average [Mg/H] distributions is much larger than could result from the potential systematic temperature uncertainties. Clearly, a composition study of RC giant stars in the solar neighbourhood, using an identical T eff scale to the bulge RC would be useful for such MDF comparisons.
Given the average thick disk [Fe/H], near − 0.7 dex (e.g., Gilmore et al. Reference Gilmore, Wyse and Jones1995), the average bulge [Fe/H], at b = −4°, is about 0.7 dex more metal-rich; clearly, the two populations are not very similar in iron abundance (nor overall metallicity).
Recalling that, in chemical evolution, the yield is simply the ratio of mass of metals produced to mass locked-up in low-mass stars, possible explanations for relatively higher Fe and Mg yields in the bulge include (but are not limited to): extensive mass-loss from the MW thin disk, or greater retention of SN ejecta in the bulge; a bulge IMF strongly under-representing low-mass stars; or inward, radial, flows within the MW thin disk feeding metals into the bulge.
The bulge vertical metallicity gradient, found by Terndrup (Reference Terndrup1988) and Minniti et al. (Reference Minniti1995) and confirmed by numerous others, was explained by Hill et al (Reference Hill2011) and later Ness et al. (Reference Ness2013) as due to the super-position of [Fe/H] sub-populations, whose proportions change with Galactic latitude. Whilst each sub-population is seen at different latitudes, the higher [Fe/H] sub-populations occur closer to the Galactic plane. Hill et al. (Reference Hill2011) proposed two populations, at [Fe/H] centred at − 0.30 and + 0.32 dex, both [Fe/H] distribution functions well fit by the Simple model, concordant with Rich (Reference Rich1990), indicating no G-dwarf Problem, unlike the MW disk, and therefore no evidence of prolonged infall into the bulge, either vertically or radially. Thus, the relatively high mean metallicity of the bulge is unlikely to be due to radial inflow.
The bi-model [Fe/H] distribution was explained by Hill et al. (Reference Hill2011) as indicating the presence of an old metal-poor, spheroidal bulge component combined with a more metal-rich population at lower latitudes, formed on much longer timescale, and whose evolution was driven by a bar.
Of the three most notable sub-populations found by Ness et al. (Reference Ness2013), near [Fe/H] + 0.11, − 0.28, and − 0.70 dex, the [Fe/H] ~ −0.70 dex is associated with the thick disk. The populations at [Fe/H] ~ +0.11 and − 0.28 dex are attributed to instability-driven bar/bulge formation from the thin disk, similar to the kinematically cold stars of the thin disk today. They claimed no obvious evidence for a classical bulge component.
Claims of bulge sub-populations evoke questions, such as: do the different mean [Fe/H] values indicate different effective yields, suggesting that the sub-populations were made in different environments? If so, what environmental parameters were responsible for the yield differences? Did retention of SN ejecta vary over the sub-populations? Or are the IDF peaks simply due to temporary peaks in the SFR during an overall evolution? Perhaps, the sub-populations reflect the time evolution of yields: the [Fe/H]= − 0.7 dex peak due to SNII only; the − 0.25 dex peak from yields of SNII plus prompt SNIa, and the + 0.11 dex population from SNII, prompt SNIa, and delayed SNIa.
Such questions motivate the need for more precise chemical abundance measurements of bulge stars, similar to the disk study of Bensby et al. (Reference Bensby, Feltzing and Oey2014), showing small-amplitude, but distinct, different chemical paths for the thick and thin disks. Perhaps, future bulge abundance plots, similar to Figure 2, will show distinct loci in [α/Fe] for the [Fe/H] sub-populations.
Presently, the continuity of the [α/Fe] trends suggests a chemical connection between the [Fe/H] sub-populations of Hill et al. (Reference Hill2011) and Ness et al. (Reference Ness2013).
The scale heights, kinematics, bimodal MDF, and [α/Fe] ratios of the bulge MDF sub-populations in Hill et al. (Reference Hill2011) are reminiscent of the local thin and thick disks, but at higher average [Fe/H]; the Ness et al. (Reference Ness2013) MDF peaks are roughly similar, but with a contamination by local thick disk metallicities near [Fe/H]= − 0.7 dex.
7.2. [α/Fe]
For low [Fe/H] bulge stars, below ~ −0.5 dex, the bulge [O/Fe], [Mg/Fe], and [⟨SiCaTi⟩/Fe] trends with [Fe/H] appear very close to the MW thick disk, although [Mg/Fe], and possibly [⟨SiCaTi⟩/Fe], seem to be slightly larger in the bulge. Both the bulge and the thick disk have enhanced [α/Fe] ratios compared to the thin disk.
The knee in the bulge [α/Fe] trends occur near [Fe/H]= − 0.6 ± 0.1 dex, similar to the MW thick disk. The bulge [α/Fe] ratios, defined by bulge giant stars, continues a linear decline and passes through solar [Fe/H] with [α/Fe] ~ +0.15 dex, and finally reaches solar [α/Fe] ratios at [Fe/H] near + 0.2 to + 0.3 dex.
There is evidence in the thick disk [α/Fe] results of Bensby et al. (Reference Bensby, Feltzing and Oey2014) for exactly the same behaviour as the bulge, if we accept that a number of supposed thin disk stars with high [α/Fe] are really thick disk, and that most of the putative thick disk stars near solar [Fe/H] are actually misidentified thin disk objects. The issue is shown in Figure 2 and described in Section 2. Perhaps, kinematic mixing of the thick and thin disk may have been involved in potential mis-identification.
On the other hand, the actual location of the kinematically identified thick disk points, with [Fe/H] slightly below solar, lies closer to the thin disk, as if the thick disk [α/Fe] ratios suddenly declined and merged with the thin disk trend.
If this latter description is correct, the solar neighbourhood thick disk [α/Fe] ratios lie well below the bulge ratios above about [Fe/H]= − 0.2 dex. To understand what the alpha-rich thin disk stars are and which of the above best describes the [α/Fe] ratios of solar metallicity thick disk requires further investigation. Again, we are confronted by our imperfect understanding of the MW disk composition!
The comparison of bulge and thick disk compositions is also complicated by the fact that most of the bulge studies have examined red giants, whereas the thick and thin disk chemical composition trends have been defined, almost entirely, from dwarf stars. Only a handful of thick disk red giant stars were employed in the comparison of Alves Brito et al. (Reference Alves-Brito, Meléndez, Asplund, Ramírez and Yong2010) and Gonzalez et al. (Reference Gonzalez2011); and, only four near solar metallicity. Accurate chemical abundance studies for hundreds of thick disk red giants would be helpful for the comparison.
In this regard, abundance differences between disk dwarfs and a handful of, mostly thin disk, red giant standards in FMR07 indicated corrections for Si I and Al I of nearly 0.1 dex. It is possible that these giant-dwarf differences are due to non-LTE effects in either the red giants or the dwarfs; although, abundance differences with standard 1D-LTE results may result from 3D hydrodynamic atmospheres and even non-plane parallel geometry (in giants). For this reason, extensive non-LTE corrections for many lines, of many elements, in a variety of stellar atmospheres, would be very useful. See Bergemann & Nordlander (Reference Battistini and Bensby2014), and references therein, for a review of the current status of non-LTE corrections.
Given these difficulties with dwarf-giant comparisons, and the, hopefully, more robust results of Alves Brito et al. (Reference Alves-Brito, Meléndez, Asplund, Ramírez and Yong2010), Gonzalez et al. (Reference Gonzalez2011), and B13, it is probably best to assume that the bulge [α/Fe] trends are the same as the MW thick disk. However, the putative local thick disk stars with [Fe/H] slightly below the solar value have low [α/Fe] ratios characteristic of the thin disk. Until these stars can be robustly excluded from the thick disk, there is a non-negligible probability that the solar neighbourhood thick and thin disk [α/Fe] trends merge near [Fe/H] ~ 0.0 dex.
If the thick disk and bulge [α/Fe] trends are the same, then both the IMF and SFR of the bulge and thick disk are similar. At the very least, the bulge SFR was higher than for the thin disk.
The observation that the bulge [α/Fe] trends reach the solar value near [Fe/H]= + 0.3 dex indicates that the bulge SFR was crudely twice that of the thin disk and, if all else is assumed equal, the formation timescale roughly half that of the thin disk; however, a more robust estimate would require a detailed chemical evolution model.
Besides the well-known alpha-elements O, Mg, Si, Ca, and Ti, the bulge shows an alpha-like trend for [Al/Fe] with [Fe/H]. This is expected, since, apart from relatively minor proton-burning re-arrangements, Al production occurs in post carbon-burning hydrostatic phases of massive stars that end as SNII events. This picture is corroborated by the Al deficiencies in dwarf galaxies (e.g., McWilliam et al. Reference McWilliam, Wallerstein and Mottini2013), that also show deficiencies of other hydrostatic alpha elements (O, Mg). Indeed, the comparison of [Al/Fe] in bulge, MW disks, and Sgr dwarf galaxy by FMR07 shows startling differences. However, nucleosynthesis predictions (e.g., Nomoto et al. Reference Nomoto, Tominaga, Umeda, Kobayashi and Maeda2006, WW95) suggest that the Al yields also depend on progenitor metallicity. If there is a mild increase in Al yields with SNII metallicity we would expect to see a slightly lower amplitude of the alpha-like trend.
Whilst the SNIa time-delay scenario can explain the similarity of declines in [X/Fe] for most of the alpha-elements by the simple addition of Fe from SNIa events, oxygen shows a steeper decline than the other alphas, starting from a higher [O/Fe] plateau in metal-poor stars. This suggests that there must be a decline in the yield of oxygen with increasing [Fe/H]. This effect is also revealed in the trends of [O/Mg] and [C/O] with [Fe/H] in the bulge and MW disks. Chemical evolution models (M08; Cescutti et al. Reference Cescutti, Matteucci, McWilliam and Chiappini2009) for SNII element yields without stellar wind mass-loss fail to reproduce the observed [O/Mg] and [C/O] ratios, whereas models including stellar winds match the shape of the observed abundance trends. However, estimated stellar wind mass-loss rates have declined in recent years, resulting in some uncertainty. These issues are connected with the production of WR stars and the importance of episodic mass-loss in massive stars.
An important observation is that the [α/Fe] trends with [Fe/H] are the same for all locations within the bulge, as established by Johnson et al. (Reference Johnson, McWilliam and Rich2013). This has recently been confirmed for Galactic latitudes, b, of 0°, − 1°, and − 2°, by Ryde et al. (Reference Ryde2016), based on near-IR spectroscopy of bulge M giants, who’s alpha-element trends were identical to those of G15 and Hill et al. (Reference Hill2011), for b = −4° RC giants.
It is remarkable that the [α/Fe] trends in the bulge and thick disk are so similar, suggesting a similar SFR and formation timescale to solar [Fe/H], despite the vastly different overall metallicities. Perhaps, the difference in metallicity simply reflects different efficiencies in retaining SN ejecta.
An interesting characteristic of the bulge alpha-elements, first noticed by FMR07, is that the trends of [O/Fe], [Mg/Fe], and [⟨SiCaTi⟩/Fe] show tight relations below [Fe/H] ~ −1 dex, quite unlike the halo, for example seen in Figure 2. In this regard, the bulge also resembles the thick disk: The large dispersion in halo [α/Fe] ratios below [Fe/H] ~ −1 is due to an inhomogeneous halo, probably resulting from accretion of dwarf galaxies with a variety of star-formation histories. On the other hand, both the MW thick disk and bulge appear to have been much more homogeneous.
7.3. Notable iron-peak elements
The trend of [Cu/Fe] with [Fe/H] in the bulge, only measured by J14, is very different than the MW thin and thick disks. At low metallicity, the slope of increasing [Cu/Fe] with [Fe/H] continues to higher [Cu/Fe] than the MW disks, near [Cu/Fe] of + 0.4 to + 0.5 dex; whereas, the MW thick and thin disks flatten-out near [Fe/H] ~ −0.7 dex, presumably due to the addition of SNIa Fe. The bulge [Cu/Fe] trend declines from ~ +0.4 dex, near [Fe/H]= − 0.2 dex, down to [Cu/Fe]= + 0.2 dex, as if the addition of SNIa Fe occurred much later in the bulge than the MW disks. Finally, near [Fe/H]= ~ +0.2 dex, the [Cu/Fe] trend starts to increase again. This is similar to the zig-zag shape of the very small amplitude trend of [Na/Fe] with [Fe/H].
If the Cu measurements of J14 are correct, these results are qualitatively consistent with the time-delay scenario of Tinsley (Reference Tinsley1979) and MB90, for Cu produced by massive stars with a metal-dependent yield, as expected for the weak s-process in massive stars (e.g., Pignatari et al. Reference Pignatari, Gallino, Heil, Wiescher, Käppeler, Herwig and Bisterzo2010); but, the delayed SNIa Fe began at a higher [Fe/H] in the bulge, suggesting involvement of massive star ejecta to higher [Fe/H], probably due to a higher SFR. In fact, the unusual bulge [Cu/Fe] trend, if real, is consistent with the SNIa time-delay scenario.
Whilst this suggests that the bulge chemistry, and therefore evolution, was very different than the MW thick disk, it may still be that the bulge [Cu/Fe] trend follows the trajectory that the thick disk would have produced if it had not run out of gas.
Interestingly, the bulge and thick disk [Cu/Fe] trends differ at [Fe/H] ~ −0.7 dex, right where the thick disk MDF starts to decline, presumably due to gas-loss. This may relate to the low [α/Fe] in putative thick disk stars just below solar metallicity. It may indicate that the MW thick disk really did decline in [α/Fe] after the MDF peak, whereas the bulge had plenty of gas to maintain its [α/Fe] trend and produce plentiful amounts Cu.
Clearly, it is important to check the [Cu/Fe] results of J14, for both bulge dwarfs and giants; in particular, more non-LTE calculations are desperately needed.
Notably, zinc is expected to share some similarities in its nucleosynthetic origin (alpha-rich freeze-out plus weak s-process) as copper, and so would provide a useful comparison. The two studies of Zn in the bulge show different measured trends: one identical to the MW disks, and the other showing a decline in [Zn/Fe] above [Fe/H] ~ −0.2 dex, similar to [Cu/Fe] but at a lower enhancement level. It would be useful to determine which of the two measured trends for bulge stars is correct.
The [Mn/Fe] trend with [Fe/H] in the bulge, MW thin and thick disks are identical, to within measurement error. This is contrary to the expectation that Mn is over-produced in SNIa with the rising [Mn/Fe] due to the increasing SNIa/SNII ratio with [Fe/H]. Since the bulge [α/Fe] ratios at solar [Fe/H] are near + 0.15 dex, less SNIa material, and therefore, less, Mn from SNIa is expected; a low [Mn/Fe] ratio is predicted for high [α/Fe], especially compared to the thin disk. If the LTE measurements are correct, then Mn is most likely produced proportional to metallicity, by both SNIa and SNII events.
However, present day non-LTE corrections considerably flatten the steeply increasing [Mn/Fe] trend with [Fe/H] seen in LTE. If correct, then the Mn abundances provide very little constraints on its production in SNIa and SNII events.
7.4. Neutron capture elements
Due to the alpha-like trend of the r-process element europium, the [Eu/Fe] trend with [Fe/H] offers the possibility the compare the SFR in the bulge and disk. Unfortunately, the disk trends are not well defined, or at least not completely converged; thus, how the bulge compares depends upon which MW comparison study is employed. Notwithstanding, if the Battistini & Bensby (Reference Battistini and Bensby2016) MW disk data are employed, then the bulge [Eu/Fe] follows the disk, but without sufficient precision to distinguish between thick and thin components.
A probe into the chemical evolution of the bulge can be obtained from the rise of the s-process, which is normally driven by low-mass (2–3 M⊙) AGB stars. The [La/Eu] ratio measures the s-process/r-process ratio and only increases when the low-mass AGB stars produce s-process (associated with He-shell burning episodes). Although the data possess measurement scatter that is larger than one would like, it appears that the bulge [La/Eu] ratio begins to increase at a higher [Fe/H] than the MW disks, indicating a higher SFR in the bulge. However, these measurements need to be greatly improved upon.
8 CHEMICAL EVOLUTION OF A SECULAR BULGE
Evidence in recent years, including the presence of a bar, a boxy/peanut shape, the X-shape bulge, and disk kinematics (e.g., see Wegg & Gerhard Reference Wegg and Gerhard2013) has led to the conclusion that the bulge was built by the growth of a stellar bar, through accretion of stars from the inner Galactic disk, and was subsequently subject to buckling processes that thickened the bar into the bulge morphology seen today.
Any bulge evolution model should produce these kinematic and morphological features, as well as match the observed vertical metallicity gradient, chemical composition trends, and the multi-, or bi-modal MDF. Here, I provide a sketch of this evolution and how the chemical composition trends might have occurred (but, see Di Matteo Reference Di Matteo2016 for a more detailed discussion of bulge chemodynamics).
First, it is notable that the metal-rich bulge sub-population, which is concentrated towards the Galactic plane, has a mean [Fe/H] in excess of the solar neighbourhood thin disk, with [α/Fe] ratios indicating the presence of nucleosynthesis products from SNIa. Thus, this bulge sub-population shares kinematic and chemical characteristics with the local thin disk, albeit at higher [Fe/H].
On the other hand, the [Fe/H] ~ −0.3 dex bulge sub-population shows a relatively large vertical scale height and [α/Fe] ratios indicating higher SFR and more rapid formation than the local thin disk, but similar or slightly faster than the local thick disk; these chemical and kinematic characteristics suggests that this population is similar to the local thick disk, but at significantly higher [Fe/H].
If these assumptions are correct, both the thick disk and thin disk are represented in the bulge, but at significantly higher [Fe/H] than at the solar circle (by about 0.3 dex), which suggests radial [Fe/H] gradients for both thin and thick disks, near − 0.04 to − 0.05 dex kpc−1 between the bulge and solar circle. These metallicity gradients might be due to more efficient retention of SN ejecta in the inner galaxy.
High mean bulge MDFs could also be accomplished by a reduction of the mass locked-up in low-mass, unevolved, stars. Whilst this is a modification of the IMF, the bulge [α/Fe] ratios require that the relative proportions of SNII and SNIa be similar to the thick disk, so there can be no large modification of the IMF slope of massive stars, only a reduced number of unevolved stars.
Although radial inflow of gas could increase the overall MDF of the bulge, this would also result in a bulge G-dwarf Problem (a deficiency of metal-poor stars) and slightly lower [α/Fe] ratios compared to the solar circle, but these are not seen.
Since the relatively low [Fe/H] of inner thick disk MDF indicates that it did not reach the yield, chemical evolution terminated before complete consumption of the gas. Thus, this gas must have gone somewhere else, or have been lost from the Galaxy altogether. On the other hand, the inner thin disk gas, represented by the [Fe/H]= + 0.3 dex sub-population, must have come from somewhere.
It seems likely, and logical, that the thick disk gas ultimately settled into the thin disk, both at the solar circle and inner disk region, due to molecular cloud collisions. Stars that formed before the gas settled retained the kinematic signature of the gas at the time of their formation, in particular with disk kinematics and large vertical scale height.
However, at the solar circle, the thick disk gas stopped chemical enrichment at a lower [Fe/H] than for the inner thick disk. The, presumably, higher gas densities in the inner disk region would result in higher SFR and shorter formation timescale compared to the solar neighbourhood thick disk, as suggested by the slightly higher [α/Fe], lower [La/Eu], and higher [Cu/Fe] ratios observed in the bulge.
The inner thin disk would then have formed out of the settling inner thick disk gas, resulting in a continuity of the chemical composition trends, as observed. Finally, instabilities in the thin disk (e.g., as outlined by Athanassoula & Misiriotis Reference Athanassoula and Misiriotis2002; Wegg & Gerhard Reference Wegg and Gerhard2013) led to a stellar bar and its thickening, by buckling processes, into the boxy/peanut/X-shape morphology with disk-like kinematics seen today. The inner thick and thin disk stars entrained into the X-shape morphology by the bar retained vertical scale heights similar to their original values, resulting in the vertical [Fe/H] gradient and bimodal MDF.
The scenario sketched above suggests a number of consistency checks and questions. For example, if radial gas inflow were responsible for higher [Fe/H] in the inner regions, lower [α/Fe] ratios might be expected, but the opposite is observed. The metal-rich bulge sub-population should be slightly younger than the metal-poor population, with a longer formation timescale, consistent with the observed low [α/Fe] ratios and high [La/Eu] ratios. But, what was the actual formation timescale of the inner disk? It might be possible to probe this question using chemical abundance patterns for s-process elements and connecting those to the mass of the s-process sites. For example, most s-process elements in the solar neighbourhood thin disk are thought to be produced by 2–3 M⊙ AGB stars with neutrons provided by the 13C(α, n)16O source. However, the s-process abundance pattern produced by intermediate mass AGB stars is expected to be somewhat different (e.g., Busso et al. Reference Busso, Straniero, Gallino, Abia, McWilliam and Rauch2004); in particular, the 22Ne(α, n)25Mg neutron source and high neutron densities dominates for 5–8 M⊙ AGB stars, and should result in relative enhancements of 25Mg, 26Mg, 96Zr, and 87Rb. These isotopes can be measured in RGB stars, from MgH, ZrO, and Rb I lines, and might provide a constraint on the inner disk-formation timescale.
It would be interesting to measure the [α/Fe] ratios in the bulge to much higher precision. High-precision chemical abundances of local thin and thick disk stars by Reddy et al. (Reference Reddy, Lambert and Allende Prieto2006) show considerable overlap in [Fe/H], but the two populations are separated in [α/Fe] by 0.15 to 0.2 dex. This is clearly related to the evolution of the local thin and thick disks; therefore, it would be useful to know whether the bulge/inner thin and thick disk populations also show similar [Fe/H] overlap and small separations in [α/Fe].
More precise abundance measurements would also permit a better evaluation of the relative SFR for the inner thick disk/bulge compared to the solar neighbourhood thick disk, based on the [α/Fe] and [La/Eu] trends with [Fe/H]. Indeed, a systematic study of the detailed elemental abundances in the thick disk between the solar circle and bulge region would provide a useful test of the above scenario: One expects a general increase in [Fe/H] with decreasing Galactocentric radius, and subtle increases in the SFR, reflected in [α/Fe], [Cu/Fe] and [La/Eu] abundance trends.
9 CONCLUSIONS
The bulge shows a vertical [Fe/H] gradient, at ~ 0.5 dex kpc−1, with more metal-rich stars concentrated towards the plane. The average and median [Fe/H] in Baade’s Window bulge field, at b = −3.9° is + 0.06 and + 0.15 dex, respectively.
Hill et al. (Reference Hill2011) identified two sub-populations, centred at [Fe/H] of − 0.30 and + 0.32 dex, at b = −3.9°, whilst Ness et al. (Reference Ness2013) suggest three sub-populations in the main bulge MDF, with [Fe/H] in their b = −5° field of + 0.12, − 0.26, and − 0.66 dex. Both studies suggest that the vertical gradient is due to changing proportions of these sub-populations.
The higher mean and median [Fe/H] values for the bulge, compared to the local thin and thick disks, indicates a higher yield for the bulge. This could easily be due to more efficient retention of SN ejecta in the bulge, especially SNIa. Other possible explanations include: (1) an IMF deficient in the lowest mass stars in the bulge, so locking-up less gas, or (2) radial gas inflow into bulge from the inner disk, although this should result in a deficit of metal-poor stars, which is not seen.
If these bulge sub-populations originated from inner thick and thin disk stars entrained into a secular bulge through bar formation, then the high mean [Fe/H] values of the bulge sub-populations suggest radial [Fe/H] gradients from bulge to solar neighbourhood of − 0.04 to − 0.05 dex kpc−1 for both thin and thick disks.
The [α/Fe] ratios in bulge, below [Fe/H] ~ −0.5 dex, are much like the local thick disk trends, suggesting similar IMF and SFR; but, the thick disk is metal deficient, compared to the bulge, by more than 0.7 dex. Possible slight enhancement of the bulge [Mg/Fe] and [⟨SiCaTi⟩/Fe]compared to the thick disk may indicate SFR differences, but could be due to measurement errors, or systematic uncertainties in the comparison of abundances for bulge giants with thick disk dwarfs.
Above [Fe/H]= − 0.5 dex, the kinematically identified thick disk stars merge into the thin disk [α/Fe] trends by solar [Fe/H], whereas the bulge [α/Fe] is enhanced compared to the thin disk, by ~ +0.15 dex, indicating a higher SFR in the bulge than thin disk, at least. On the other hand, a small number of kinematically identified local thin disk stars seems to extend the slope established by metal-poor thick disk stars, to solar [Fe/H] and beyond. The status of these high-α thin disk stars should be investigated further.
It is remarkable that the [α/Fe] trends of the thick disk and bulge are so close, suggesting similar SFR, even though their metallicities differ enormously.
The [La/Eu] ratio, indicating the onset of the s-process and presence of ejecta from 2–3 M⊙ AGB stars, is consistent with a slightly higher SFR and shorter formation timescale for the bulge, compared to the MW disks.
The [Cu/Fe] trend, measured by only one study, J14, shows a stunningly different trend than thick disk or thin disk. However, the zig-zag [Cu/Fe] trend is qualitatively consistent with the combination of a high bulge SFR and metal-dependent Cu yields from massive stars (as expected) in the presence of the SNIa time delay scenario. Curiously, the [Na/Fe] ratios in the bulge, whilst close to the solar ratio, shows a small amplitude zig-zag trend, similar to [Cu/Fe], suggesting the presence of metal-dependent Na yields from massive stars.
The trend of LTE [Mn/Fe] ratios are the same in the bulge as the MW thick and thin disks, to within measurement uncertainty. This is contrary to the expectation that SNIa over-produce Mn. Since the ratio of SNIa/SNII material is lower in the bulge than the thin disk, as evidenced from [α/Fe] ratios, lower [Mn/Fe] are expected in the bulge, but are not seen. Predicted non-LTE corrections to the LTE Mn abundances suggest that the trend of this element could be seriously affected by non-LTE effects.
10 RECOMMENDATIONS FOR FUTURE STUDIES
The remarkable bulge [Cu/Fe] trends found by J14 need to be checked. The information may already be present in the lensed dwarf spectra of B13. Since Cu I lines are strong, and possibly vulnerable to saturation effects in K giants, more robust abundances may be obtained from the warmer RC giants and lensed dwarf stars. However, strong hfs effects in Cu I lines are helpful for de-saturating the lines and increasing abundance sensitivity.
High precision abundances are required for bulge alpha-elements. The bulge MDF sub-populations in Ness et al. (Reference Ness2013) and Hill et al. (Reference Hill2011) should be carefully studied, in order to see whether there is a continuous chemical composition trend, or discrete [α/Fe] trends for each sub-population, similar to the [α/Fe] differences between local thick and thin disks (e.g., Figure 2).
Neutron-capture elements, especially Eu, La, should be measured to better precision than heretofore obtained, in order to further identify the [Fe/H] of the nucleosynthetic onset of low-mass AGB stars, for comparison with the MW disks.
Other elements of interest include Rb, which is thought to be made in s-processing driven by the 22Ne(α,n)25Mg neutron source, prevalent in intermediate mass AGB and massive stars. Increased Mg isotopic ratios (25/24 and 26/24) reveal the same neutron source in similar stars; thus, isotopic Mg measurements, based on the MgH lines near 5 130 Å would be of interest.
For all the above abundance goals, it would be best to obtain high-resolving power spectra (R=40 000 to 60 000) in order to separate-out blends, to detect continuum, and for increased line depths and abundance sensitivity. However, for Mg isotopes high S/N, ~ 100 and high resolving power (R ~ 80 000 to 120 000) are best.
Warmer RC giants offer the possibility for superior abundance measurements than the more luminous K giants, due to reduced line blending, greater continuum, and frequently less saturated lines. However, higher S/N is also required. One possibility is to look at metal-normal and metal-rich bulge stars at higher latitudes (e.g., b = −8°), where the extinction is much reduced. This may be effective, as it appears that the [α/Fe] versus [Fe/H] trends are identical over the whole bulge, as if kinematic heating simply brought some of the metal-rich populations into higher latitude orbits.
Temperatures should be based on the excitation of Fe I lines, and measured from line-by-line differential analysis relative to solar neighbourhood standards, like Arcturus (e.g., FMR07, Hill et al. Reference Hill2011).
An impediment to our understanding is the ability to compare the composition of the same types of stars in the bulge and thick and thin disks. Therefore, we need to robustly determine the abundance effects involved with dwarf and giant star comparisons; in this regard, a survey of MW thin and thick disk giants, using the identical abundance analysis methods to the bulge stars would be helpful. The α-rich thin disk stars near solar [Fe/H] in the Bensby et al. (Reference Bensby, Feltzing and Oey2014) study should be examined more closely to verify their validity.
A study of the radial [Fe/H] and composition gradients within the thick disk would provide a useful consistency check on the bulge formation scenario: As Galactocentric radius decreases, gradual increases in the mean [Fe/H], higher [α/Fe] and lower [La/Eu] ratios are expected, consistent with higher SFR and shorter formation timescales towards the bulge.
Finally, we need non-LTE corrections for Cu, alphas, and all other elements of interest in the bulge. These non-LTE corrections should be verified empirically. For example, by studying the composition of dwarf and giant stars in clusters of different metallicity, similar to work done by Korn et al. (Reference Korn2007) for NGC6397.


