

1. Introduction
Malaria remains a major public health challenge, with 263 million cases and 600,000 deaths annually (World Health Organization, 2024). Two-thirds of the global malaria burden is concentrated in 11 African countries—Burkina Faso, Cameroon, the Democratic Republic of the Congo, Ghana, Mali, Mozambique, Niger, Nigeria, Sudan, Tanzania and Uganda—which are the focus of the World Health Organization (WHO)’s “High Burden to High Impact” (HBHI) initiative to accelerate malaria control (World Health Organization, 2024). Substantial progress in malaria control was achieved between 2000 and 2015, particularly among children under five, through widespread distribution of insecticide-treated nets, deployment of seasonal malaria chemoprevention and, more recently, the introduction of promising new vaccines (Bhatt, Reference Bhatt, Weiss, Cameron, Bisanzio, Mappin and Dalrymple2016; World Health Organization, 2024). However, progress has stalled in recent years, with malaria cases and incidence per person at risk increasing between 2022 and 2023 (World Health Organization, 2024).
School-aged children (SAC) (5–15 years old) represent a large, historically overlooked malaria risk group. An estimated 200 million SAC are at risk of malaria, with infection prevalence reaching as high as 50–80% in some settings (Gething et al., Reference Gething, Patil, Smith, Guerra, Elyazar, Johnston, Tatem and Hay2011; Nankabirwa et al., Reference Nankabirwa, Brooker, Clarke, Fernando, Gitonga, Schellenberg and Greenwood2014; Brooker et al., Reference Brooker, Clarke, Fernando, Gitonga, Nankabirwa, Schellenberg, Greenwood, Bundy, de Silva, Horton, Jamison and Patton2017). In this group, malaria causes acute illness and chronic infection, anemia and malaise, which impair cognitive function and physical well-being (Brooker et al., Reference Brooker, Clarke, Fernando, Gitonga, Nankabirwa, Schellenberg, Greenwood, Bundy, de Silva, Horton, Jamison and Patton2017). These effects can reduce educational achievement through increased absenteeism, impaired short-term cognition and hindered long-term cognitive development, ultimately resulting in human capital losses (Fernando et al., Reference Fernando, de Silva, Carter, Mendis and Wickremasinghe2006; Clarke et al., Reference Clarke, Matthew, Njagi, Khasakhala, Cundill, Otido, Crudder, Benson and Brooker2008; Angrist et al., Reference Angrist, Jukes, Clarke, Chico, Opondo, Bundy and Cohee2023b). Despite these negative impacts on both health and education, SAC remain largely overlooked in current malaria control strategies, exacerbating their relative disease burden. Although there are strong associations between malaria and reduced educational attainment (Lucas, Reference Lucas2010; Barofsky et al., Reference Barofsky, Anekwe and Chase2020; Kuecken et al., Reference Kuecken, Thuilliez and Valfort2021), few randomized trials have quantified the human capital causal impacts of malaria on educational metrics, especially on education quality (in addition to education quantity).
Given stalled progress and budget constraints—where malaria funding is, at best, uncertain and, at worst, facing devastating cuts—there is an urgent need to prioritize interventions that maximize both health and broader societal benefits (Burkybile, Reference Burkybile2025). Furthermore, school health has been identified as a key priority for achieving the Sustainable Development Goals (Bundy et al., Reference Bundy, Schulz, Sarr, Banham, Colenso, Drake, Donald, de Silva, Horton, Jamison and Patton2017), and the WHO now officially recommends chemoprevention (the routine administration of full courses of antimalarial drugs at regular intervals regardless of infection status to both clear existing infections and provide a period of prophylaxis against new infection) in SAC for malaria control in certain circumstances (World Health Organization, 2023). Against this backdrop, we conducted the first benefit–cost analysis (BCA) of malaria chemoprevention in SAC, evaluating its potential to improve both health and education outcomes across ten HBHI countries.
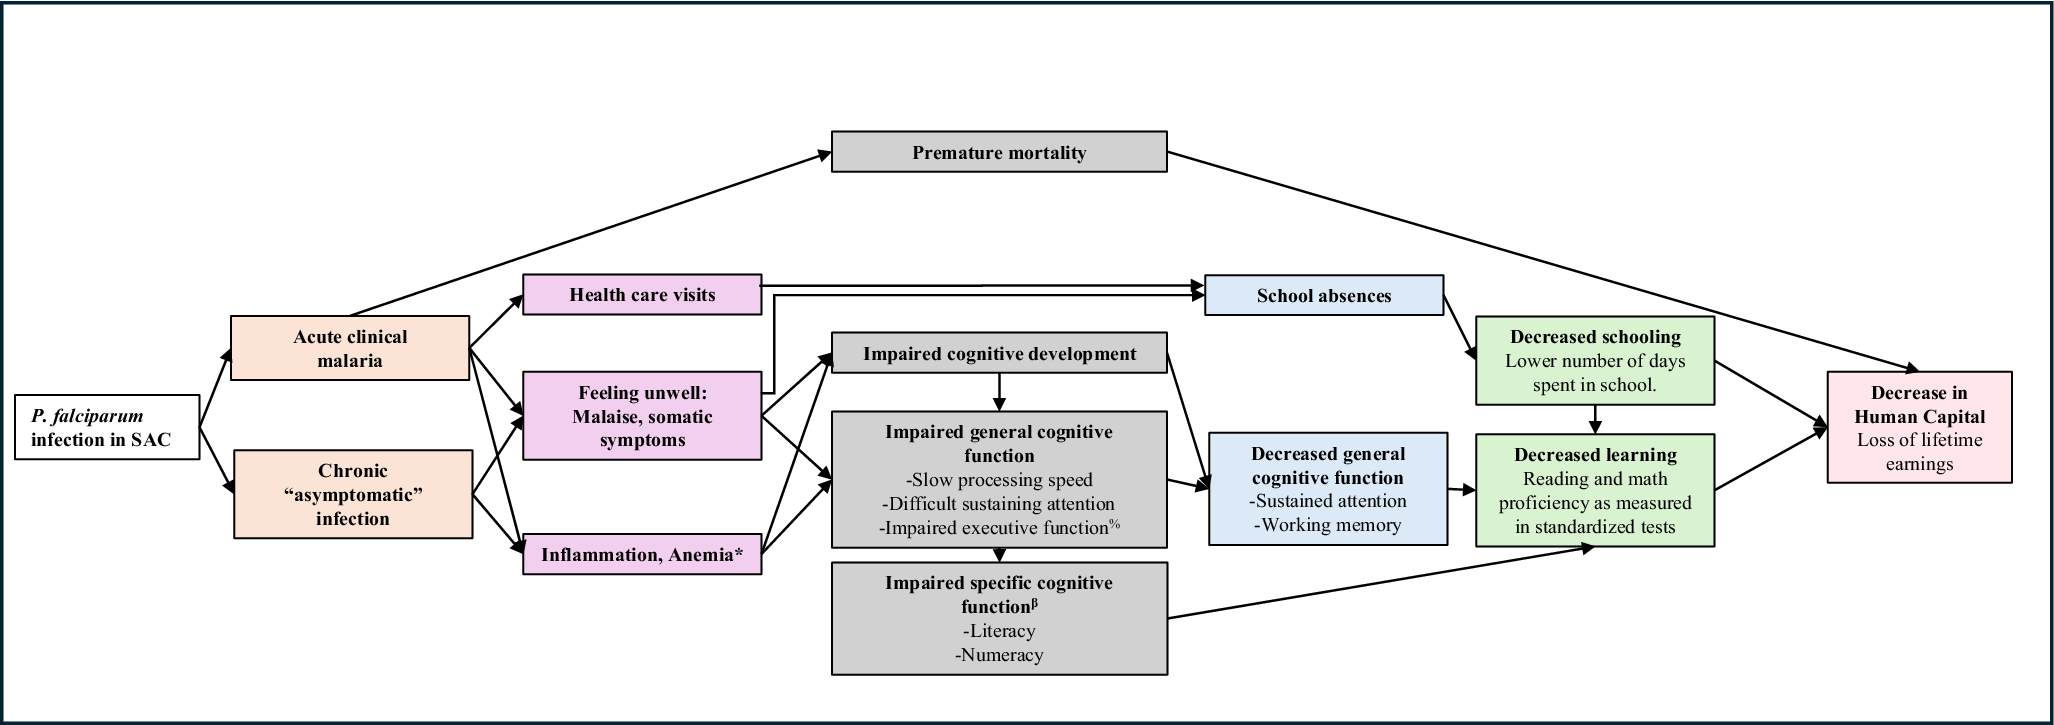
This study makes two primary contributions. First, we estimate the economic impacts of malaria chemoprevention in SAC, using a conceptual framework (Figure 1) that incorporates health benefits (reduced malaria morbidity and mortality) and educational benefits (reduced absenteeism and improved literacy). Second, we advance the literature and methodology in malaria economics by jointly accounting for health gains and human capital accumulation, a dimension often missing from prior BCAs of malaria interventions (Lubell et al., Reference Lubell, Reyburn, Mbakilwa, Mwangi, Chonya, Christopher and Mills2008; Maitra et al., Reference Maitra, Hodge and Soto2016; Korenromp et al., Reference Korenromp, Health, Switzerland, Wong, Dubosse and Muula2021; Shretta & Anye, Reference Shretta and Anye2023).
Conceptual framework of the impact of malaria in school-age children. Note: SAC: school-aged children; * P. falciparum is an independent cause of anemia but also exacerbates other multifactorial causes of anemia, e.g. nutritional deficiencies and helminth infections. % Working memory, attention shifting/cognitive flexibility, inhibitory control, organization/planning. β Reading: phonological awareness, decoding, orthographic processing, semantic processing; Math: number sense, visual–spatial processing, pattern recognition, logical reasoning.

Figure 1. Long description
Flow diagram illustrating the proposed pathways through which Plasmodium falciparum infection in school-aged children affects educational and economic outcomes. The diagram begins with acute clinical malaria and chronic asymptomatic infection. Pathways include feeling unwell, inflammation and anemia, impaired general cognitive function such as reduced attention, working memory and processing speed, and impaired specific cognitive functions including literacy and numeracy. These effects contribute to school absences, reduced learning, lower standardized test performance, decreased schooling, reduced human capital, and ultimately lower lifetime earnings. Premature mortality is also shown as a direct pathway.
Although there is substantive literature demonstrating the cost-effectiveness of malaria interventions (White et al., Reference White, Conteh, Cibulskis and Ghani2011; Conteh et al., Reference Conteh, Shuford, Agboraw, Kont, Kolaczinski and Patouillard2021), cost-effectiveness analysis misses certain potential benefits (and costs) and precludes comparison with other priority global investments, for example, in education, climate and economic development. Benefit–cost analyses are the appropriate economic evaluation method to compare across sectors, yet these remain relatively rare in malaria (n = 7 BCA studies in the past 15 years), with reported benefit–cost ratios (BCRs) (range: <1 to 48) (Mouzin et al., Reference Mouzin, Sedlmayr, Miller, Steketee, Banda, Chiyota and Kabaghe2011; Rajkumar et al., Reference Rajkumar, Guakler and Tilahun2012; Jamison et al., Reference Jamison, Jha, Laxminarayan, Ord and Lomborg2013; Purdy et al., Reference Purdy, Robinson, Wei and Rublin2013; Ezennia et al., Reference Ezennia, Nduka and Ekwunife2017; Korenromp et al., Reference Korenromp, Health, Switzerland, Wong, Dubosse and Muula2021; Shretta & Anye, Reference Shretta and Anye2023) (Supplementary Table S1). Human capital losses have not been incorporated in malaria-focused BCAs, except for Korenromp et al. (Reference Korenromp, Health, Switzerland, Wong, Dubosse and Muula2021), which quantified educational losses due to absenteeism. We advance this work by estimating education effects through two methods: first, education quantity alone and, second, considering both education quantity and quality jointly, estimated via the learning-adjusted years of schooling (LAYS) framework aligned with the World Bank’s Human Capital Index (Angrist et al., Reference Angrist, Evans, Filmer, Glennerster, Rogers and Sabarwal2020).
Our modeling results suggest that malaria chemoprevention in SAC in ten HBHI countries (excluding Sudan) could generate substantial net benefits, potentially averting an estimated 9.1 million malaria cases, 20,367 deaths and 389,765 disability-adjusted life years (DALYs), with mortality risk reduction benefits accounting for most economic benefits. The aggregated societal BCR was 14.28, indicating that every $1 invested generated approximately $14 in benefits. Modeled benefits exceeded costs in all countries analyzed (BCR range: 3.71–39.5), particularly in countries where malaria burden, case fatality rates (CFRs) and gross national income (GNI) per capita levels were higher. Probabilistic sensitivity analysis produced a mean simulated generalized societal BCR of 11.00 (95 per cent confidence interval (95% CI): 10.89–11.11; range: 1.02–79.12), with a >95% probability of being cost-beneficial at a BCR threshold of 3. Sensitivity analyses highlighted that assumptions about mortality valuation and education valuation significantly affect results; when considering school quality (e.g. using literacy measures) with the LAYS approach, this yields BCRs up to one hundred times higher than school quantity (e.g. using absenteeism measures). Educational gains amplify health returns substantially: Malaria chemoprevention in SAC led to 46.3 million additional school days attended and 18.5 million LAYS, placing it among the most cost-effective education interventions globally (Angrist et al., Reference Angrist, Evans, Filmer, Glennerster, Rogers and Sabarwal2020; World Bank, 2020). These results suggest that malaria chemoprevention in SAC is a highly attractive investment for malaria-endemic regions and underscore the value of cross-sectoral strategies that invest in human capital through integrated health and education interventions.
2. Methodology
2.1. Overview
Our methodology drew on BCA (Robinson et al., Reference Robinson, Hammitt, Cecchini, Chalkidou, Claxton, Cropper and Eozenou2019) and cost-effectiveness analysis (Wilkinson et al., Reference Wilkinson, Sculpher, Claxton, Revill, Briggs, Cairns and Teerawattananon2016) reference cases. We adopted a societal perspective, presenting combined costs to both the provider (government) and households, and used a microeconomic approach to estimate the intervention’s benefits and costs. First, we conducted a BCA for each country individually. Second, we combined the ten country-specific point estimates to generate an aggregate result across the ten HBHI countries. Third, we performed a simulated probabilistic generalized BCA and probabilistic sensitivity analysis, to model average conditions across the study settings and explore the impact of parameter variation and uncertainty on BCRs.
2.2. Conceptual framework
In addition to poor health outcomes, malaria is also linked to increased school absenteeism, impaired cognitive development and function and, consequently, reduced learning outcomes. These factors limit the ability of SAC to reach their full potential, affecting both individual academic achievement and broader human capital development. The long-term economic consequences can be substantial. To illustrate these dynamics, we developed a conceptual framework (Figure 1), which highlights the interplay between malaria and education, at the individual pupil level. This framework was designed for settings with high malaria burden and is directly applicable to our study population.
2.3. Intervention
Malaria chemoprevention may be delivered to SAC, either as intermittent preventive treatment or as extended-age seasonal malaria chemoprevention (Morlino et al., Reference Morlino, Byrne, Achan, Baraka, Barry, Bousema and Camara2025). Both involve administering full courses of antimalarials at regular intervals, targeting age groups according to local malaria burden. Delivery can occur in communities or at fixed sites like schools. Our analysis modeled chemoprevention delivered to SAC enrolled in government-funded primary schools using a school-based delivery platform.
For the intervention drug, we assumed the use of sulfadoxine–pyrimethamine plus amodiaquine (SPAQ) in all countries, except Uganda and Tanzania. In these two countries, where either programmatic delivery is underway (Tanzania) or a clinical trial is planned (Uganda), we assumed the use of dihydroartemisinin–piperaquine (DP) (National Institute for Medical Research, 2023). We assumed six rounds of treatment for all countries except Tanzania, where the current practice is to administer malaria chemoprevention in SAC three times per year.
2.4. Decision tree model
We used a decision tree model to evaluate the health outcomes, educational outcomes and associated costs of implementing malaria chemoprevention in SAC. The model estimated the costs of implementing malaria chemoprevention in SAC over one year, capturing associated morbidity-related cost savings within that time frame, while mortality risk reduction and educational benefits were projected over the cohort’s lifespan. We applied a 5% discount rate consistently across both the benefit–cost and cost-effectiveness analyses, in line with the Copenhagen Consensus methodology and recent literature suggesting that 5% better reflects low–middle-income country (LMIC) contexts than the 3% rate recommended in the iDSI reference case (Wilkinson et al., Reference Wilkinson, Sculpher, Claxton, Revill, Briggs, Cairns and Teerawattananon2016; Haacker et al., Reference Haacker, Hallett and Atun2019; Copenhagen Consensus Center, 2021).
Our analysis focused on ten African countries designated as HBHI priority countriesFootnote 1 by the WHO, including Burkina Faso, Cameroon, the Democratic Republic of the Congo, Ghana, Mali, Mozambique, Niger, Nigeria, Tanzania and Uganda (World Health Organization, 2018).
2.5. Data
The population of children in government-funded primary schools in 2024 came from the United Nations Educational, Scientific and Cultural Organization (UNESCO) indicator data of total primary school pupils and percentage enrolled at private schools and using sub-Saharan wide pupil growth rates (UNESCO Institute for Statistics (UIS), 2024). Data on primary school years and the number of primary schools per country were obtained from national sources, varying by country. Where available, country-specific inputs for costs, epidemiological data and educational variables were used. Detailed data sources are provided below and in the parameters table (Supplementary Table S2).
3. Economic evaluation of health outcomes and avoided cases of death
All costs were inflated to 2023 country- and year-specific local currency units using gross domestic product deflators and then converted into 2023 US dollar (USD) using market exchange rates (World Bank, 2025). All costs are presented in 2023 USD.
3.1. Intervention cost
We estimated the economic costs for both households and providers (government), categorizing costs into drugs, supplies and materials, human resources, community sensitization, storage, transportation and monitoring and evaluation. Drug costs were sourced from Global Fund reference pricing, with an additional 5% for wastage and 10% for transportation, customs clearance and insurance (Montresor et al., Reference Montresor, Gabrielli, Diarra and Engels2010, 2024a; Global Fund, 2024b). We assumed 90% intervention coverage for children who are enrolled in government-funded primary schools (GiveWell, 2021). For drug administration, we estimated that six teachers per primary school would each dedicate two hours per round (12 hours total) to administering the drugs to pupils. Additionally, we assumed that 50% of parents would attend a two-hour informational session, with time valued in relation to GNI per capita (World Bank, 2025). Alternative approaches, including statutory minimum wages, informal wage rates and household consumption data, were considered but not applied due to concerns regarding comparability between and data availability across the ten countries. Costs for training, community sensitization (including social behavior change campaigns), monitoring and evaluation and administrative personnel were modeled drawing from cost analyses of interventions in Uganda and Kenya (Zulaika et al., Reference Zulaika, Nyothach, van Eijk, Wang, Opollo, Obor and Mason2023; Gonahasa et al., Reference Gonahasa, Nassali, Maiteki-Sebuguzi, Namuganga, Opigo, Nabende and Okiring2024). Across countries, costs varied by the number of pupils, schools and districts per country and by cost of drugs, teacher salaries and value per lost hour (GNI per capita). Consistent with our one-year analytic time frame, we excluded broader education system costs (e.g. teacher salaries or classroom expansion), as these are considered fixed in the short term and unlikely to be affected by the intervention within this period.
3.2. Estimating health outcomes
3.2.1. Malaria cases and deaths
We obtained country-specific malaria case and death estimates from the World Malaria Report 2024 and applied them to 2024 population estimates (United Nations, 2024; World Health Organization, 2024). To estimate malaria incidence among SAC, we assumed the proportion of malaria cases occurring in this age group based on Ugandan surveillance data (Namuganga et al., Reference Namuganga, Nankabirwa, Maiteki-Ssebuguzi, Gonahasa, Opigo, Staedke and Rutazaana2022). We then applied this proportion to each country’s total expected malaria cases and divided the result by the percentage of the population estimated to be in primary school (United Nations, 2024).
The effect size of malaria chemoprevention in SAC was varied by drug choice and dosing frequency. For DP administered six times annually, we used a 50% reduction in clinical malaria (incidence rate ratio = 0.50; 95% CI: 0.39–0.60), based on a recent meta-analysis (Cohee et al., Reference Cohee, Opondo, Clarke, Halliday, Cano, Shipper and Barger-Kamate2020). For DP administered three times per year, we assumed a 20% reduction (incidence rate ratio = 0.80; 95% CI: 0.71–0.91) in malaria incidence, using trial data from Makenga et al. (Reference Makenga, Baraka, Francis, Nakato, Gesase, Mtove and Madebe2023). In scenarios where SPAQ was administered six times per year, we assumed a proportionally lower protective effect compared to DP, reflecting its shorter duration of protection (4 weeks vs. 6 weeks) (Zongo et al., Reference Zongo, Milligan, Compaore, Some, Greenwood, Tarning, Rosenthal, Sutherland, Nosten and Ouedraogo2015). Accordingly, we applied two-thirds of the impact observed with DP, resulting in an estimated incidence rate ratio of 0.67. These effect sizes were used to estimate the total reduction in malaria cases associated with each chemoprevention regimen. The World Malaria Report estimates that 1–3% of malaria cases progress to severe disease; in our base case analysis, we applied a midpoint estimate of 2% to model this progression. CFRs for all malaria cases were estimated using country-specific malaria deaths-to-cases ratios, which range from 0.13% to 0.44% (World Health Organization, 2024).
3.2.2. Disability-adjusted life years
To compare the cost-effectiveness of malaria chemoprevention in SAC with other malaria interventions, we estimated DALYs using standard methods, no age weighting and assuming deaths occur at age 9 for years of life lost calculations (World Health Organization, 2020). Data inputs are detailed in Supplementary Materials (Tables S2 and S4).
3.3. Valuing morbidity reductions
Using cost-of-illness methods, we modeled costs for three different categories of morbidity from symptomatic malaria cases/episodes: uncomplicated cases that did not seek care from a formal health provider; uncomplicated cases that sought care from a formal health provider; and severe malaria cases that required hospitalization (Larg & Moss, Reference Larg and Moss2011; Jo, Reference Jo2014).
3.3.1. Direct savings to provider
For individuals who sought treatment at public health facilities, the provider incurred all costs related to drugs, diagnostics and consultations. We assume all cases receive a malaria rapid diagnostic test and treatment with Artemether–Lumefantrine, costs from Global Fund reference pricing (The Global Fund, 2023; Global Fund, 2024b). The cost of outpatient consultations for uncomplicated malaria was estimated using WHO Choosing Interventions That are Cost-Effective (WHO-CHOICE) country-specific cost per outpatient visit (World Health Organization, 2011). For inpatient cases, we estimated costs by multiplying the country-specific WHO-CHOICE cost per inpatient bed day by the mean duration of hospitalization (3 days) (White et al., Reference White, Conteh, Cibulskis and Ghani2011; World Health Organization, 2011).
3.3.2. Direct savings to households
For those who sought treatment at private health facilities, we assumed that households incurred all costs related to drugs, test and consultation using the same methods described above. For all cases that sought care, we assumed that the household incurred additional out-of-pocket costs for transportation and food, based on estimates from Uganda (uncomplicated case: $0.50; severe case: $1.00) (Snyman et al., Reference Snyman, Pitt, Aturia, Aber, Gonahasa, Namuganga and Nankabirwa2025).
3.3.3. Indirect benefits to society
We assumed that untreated and treated malaria cases incurred productivity losses associated with time spent away from work due to caregiver time. Productivity losses were valued using the human capital approach (Hodgson & Meiners, Reference Hodgson and Meiners1982; Hansen & Yeung, Reference Hansen and Yeung2009), where annual GNI per capita was divided by 365 and then multiplied by an assumed number of caregiver days lost for untreated and uncomplicated malaria (2 days) (Chima et al., Reference Chima, Goodman and Mills2003; Ayieko et al., Reference Ayieko, Akumu, Griffiths and English2009; Sicuri et al., Reference Sicuri, Vieta, Lindner and Sauboin2011; Snyman et al., Reference Snyman, Pitt, Aturia, Aber, Gonahasa, Namuganga and Nankabirwa2025) and severe malaria (5 days) (White et al., Reference White, Conteh, Cibulskis and Ghani2011). We selected GNI per capita to ensure a standardized approach across countries. We did not quantify productivity losses for school-age children.
3.4. Valuing mortality risk reduction
We translated the estimated reduction in deaths into monetary benefits by multiplying deaths averted by the value of a statistical life (VSL). VSL represents a population’s aggregate willingness to pay for small reductions in mortality risk and is empirically derived from individuals’ willingness to trade income for marginal changes in their own risk of death.
Because most primary VSL studies are conducted in high-income settings, we extrapolated VSL estimates to each study country following the reference case (Pradhan & Jamison, Reference Pradhan and Jamison2019; Robinson et al., Reference Robinson, Hammitt, Cecchini, Chalkidou, Claxton, Cropper and Eozenou2019). Study country-specific VSLs were calculated as
 $$ VS{L}_c= VS{L}_{US}\times {\left(\frac{GN{I}_c}{GN{I}_{US}}\right)}^{\varepsilon } $$
where VSLUS was the U.S. reference value, GNIc was a study country-specific GNI per capita, GNIUS was the U.S. GNI per capita, and ε was the income elasticity of VSL. Income elasticity measures the responsiveness of a change in demand (in this case, willingness to pay for reductions in mortality risk) to a change in income; when elasticity is 1, the change is proportionate, and where it is greater than 1, demand is highly responsive to income changes. Thus, when ε ≠ 1, the VSL to income ratio differed across countries.
The base case used the reference case featured specification, applying an income elasticity of 1.5 to extrapolate the U.S. VSL to lower-income settings. This higher elasticity reflects evidence that willingness to pay for mortality risk reductions increases more than proportionally with income, implying lower VSL-to-income ratios in lower-income settings (Robinson et al., Reference Robinson, Hammitt, Cecchini, Chalkidou, Claxton, Cropper and Eozenou2019).
Sensitivity analyses followed the standardized reference case approach, assuming an elasticity of 1 and applying constant VSL-to-income ratios of 100 and 160 times GNI per capita. These ratios reflect values commonly observed in high-income settings and are recommended to facilitate comparison across studies and to explore uncertainty in extrapolated VSL estimates.
Because malaria deaths in our model occurred at approximately age 9, we derived an age-specific VSL using a value per statistical life year (VSLY) approach. VSLY was calculated as
 $$VSL{Y}_c=\frac{VS{L}_c}{L{E}_{adult}}$$
where LEadult represented the undiscounted remaining life expectancy at the average adult age. Age-specific VSL was then calculated as
 $$VS{L}_{age9}= VSL{Y}_c\times L{E}_{age9}$$
where LEage9 represented the remaining life expectancy at age 9 based on country life tables (World Health Organization, 2025). All costs and deaths averted occurred within a single program year. Because VSL represented a present-value measure of mortality risk reduction, no additional intertemporal discounting was applied. Detailed country-specific calculations are provided in the Supplementary Materials (Table S3).
4. Learning outcomes and economic impact
We used two approaches to model the educational gains from malaria chemoprevention in SAC and their economic impact.
4.1. Education quantity as measured by absenteeism
The base case approach used absenteeism reductions associated with malaria chemoprevention in SAC to estimate gains in earnings. We assumed a linear relationship between attendance and schooling progression, whereby each additional day of school contributes proportionally to overall grade progression. Using estimates of the average number of school days missed due to malaria (uncomplicated case: 5 days; severe case: 10 days) (Korenromp et al., Reference Korenromp, Health, Switzerland, Wong, Dubosse and Muula2021) and modeled estimates of cases averted through malaria chemoprevention in SAC, we calculated the total additional days of schooling gained per child annually. These additional days were then converted into fractions of a school year to estimate total years of schooling gained. To estimate the economic impact, we applied country-specific returns to schooling from the Mincer earnings function – an econometric model that predicts earnings based on education – to translate these gains into increased expected lifetime earnings (Fink et al., Reference Fink, Peet, Danaei, Andrews, McCoy, Sudfeld, Smith Fawzi, Ezzati and Fawzi2016). Earnings were projected across the working lifespan (ages 15–60), discounted to present value and adjusted for expected wage growth.
4.2. Combining education quantity and quality measured by foundational skills in literacy
The second approach translated foundational skills in literacy gains from an intermittent preventive treatment in schoolchildren trial in Malawi (Sixpence et al., Reference Sixpence, Vokhiwa, Kumalakwaanthu, Pitchford, Seydel, Magder, Laufer, Mathanga and Cohee2024) into gains in LAYS and then into lifetime earnings. We calculated Cohen’s d effect size (Baird & Pane, Reference Baird and Pane2019) from observed test score changes and sample size and then converted this into LAYS consistent with the micro-LAYS approach and Human Capital Index standards (Evans & Yuan, Reference Evans and Yuan2019; Angrist et al., Reference Angrist, Evans, Filmer, Glennerster, Rogers and Sabarwal2020). LAYS were then mapped to lifetime earnings gains using country-specific Mincerian returns (Fink et al., Reference Fink, Peet, Danaei, Andrews, McCoy, Sudfeld, Smith Fawzi, Ezzati and Fawzi2016) applied to discounted expected earnings from ages 15–65, adjusting for wage growth.
5. Benefit–cost and cost-effectiveness analyses
5.1. Benefit–cost analysis
The modeled benefits of malaria chemoprevention in SAC intervention included direct cost savings to the health system and households from reduced use of outpatient and inpatient services, indirect savings from reduced morbidity and mortality and human capital gains from improved educational outcomes. These benefits were estimated using the outputs from the decision tree model, which provided estimates of malaria cases and deaths averted and educational gains in malaria chemoprevention in the SAC scenario relative to baseline.
We calculated the BCR, which quantifies the economic return per dollar spent, by dividing the net present value of the incremental health and educational benefits by the net present value of the incremental intervention costs. The Copenhagen Consensus “traffic light” rating system, which categorizes the BCR into four categories: excellent (BCR ≥ 20), good (5 ≤ BCR < 20), fair (1 ≤ BCR < 5) and poor (BCR < 1) (Angrist et al., Reference Angrist, Aurino, Patrinos, Psacharopoulos, Vegas, Nordjo and Wong2023a), was applied to aid interpretation of results. Additionally, the net benefits (total benefits minus total costs) are reported, as relying solely on the BCR can obscure the relative magnitude of the effects.
5.2. Sensitivity analysis
To address uncertainty in both model parameters and model structure, we performed several sensitivity analyses. First, in line with suggestions for standardized sensitivity analysis in BCA (Pradhan & Jamison, Reference Pradhan and Jamison2019; Robinson et al., Reference Robinson, Hammitt, Cecchini, Chalkidou, Claxton, Cropper and Eozenou2019), we performed structural sensitivity analyses, testing different model assumptions for alternative discount rates and varying how educational benefits (reductions in absenteeism vs gains in LAYS due to foundational skills in literacy gains) and health benefits (VSL estimation methods) are monetized. Structural sensitivity analyses were performed for the individual country BCRs.
Second, we conducted a probabilistic sensitivity analysis using XLRisk (Vose Software 2021) to model average conditions across the ten HBHI countries and to assess the impact of parameter variation and uncertainty in the results. Input parameters were derived by taking the mean of fixed values across the 10 HBHI countries or fitting probability distributions to pooled data where appropriate (Supplementary Table S4). This approach produced a simulated country representing average conditions across the study settings. Monte Carlo simulations were used to vary all uncertain parameters across plausible distributions, generating a distribution of benefit–cost outcomes that reflected uncertainty and heterogeneity across the ten countries. The reported confidence interval reflects the precision of the simulated mean estimate given the number of iterations, whereas the full range of possible outcomes is represented by the percentile distribution. From this analysis, we derived a benefit–cost acceptability curve and produced a tornado diagram to illustrate the correlation between the BCR and the sampled input values, using the absolute values of these correlations to highlight influential parameters.
5.3. Cost-effectiveness analysis
We modeled cost-effectiveness over a 1-year intervention period, adopting a provider perspective for both intervention costs and cost savings. Mortality risk reduction benefits and educational gains were not included. Results are presented as incremental cost-effectiveness ratios (ICERs) and compared against cost-effectiveness thresholds based on opportunity cost approaches, which better reflect the health gains that could be achieved if resources were allocated to other competing interventions in LMICs (Pichon-Riviere et al., Reference Pichon-Riviere, Drummond, Palacios, Garcia-Marti and Augustovski2023).
5.4. Limitations
5.4.1. Malaria transmission and modeling assumptions
Firstly, we did not account for seasonality in malaria transmission in relation to the timing of school attendance, which may vary across countries and affect the impact of the intervention. In highly seasonal, high-burden areas, existing seasonal malaria chemoprevention programs targeting younger children may already be in place, and delivery to older children could be integrated through community-based channels even when schools are closed. Secondly, our analysis was limited to the direct benefits experienced by SAC receiving chemoprevention—namely, reductions in malaria cases and deaths and improved educational outcomes. However, SAC are known reservoirs of malaria transmission, and reducing infection in this group may also lower community-wide transmission. As the magnitude of this indirect effect is not yet well quantified in community-based studies, we excluded it from our analysis, likely underestimating total benefits and producing conservative BCRs. We valued time losses using GNI per capita to ensure comparability across countries, and this is an imperfect proxy for opportunity cost, particularly in predominantly rural and informal labor markets where typical earnings may be lower than national averages. Alternative approaches, including statutory minimum wages, informal daily wage rates or household consumption data, may better reflect local opportunity costs but were not consistently available across all ten countries (Setiawan et al., Reference Setiawan, Cassidy-Seyoum, Thriemer, Carvalho and Devine2024). To the extent that GNI per capita exceeds prevailing earnings, productivity losses and therefore net benefits and benefit cost ratios may be modestly overstated. However, productivity effects represent a minority share of total monetized benefits, and sensitivity analyses using lower time values did not materially alter our BCRs.
5.4.2. Educational impact estimation
Educational benefits were restricted to individual-level outcomes and did not account for classroom-level spillovers or broader societal and macroeconomic gains. In addition, we did not capture potential network or general equilibrium effects of long-term improvements in schooling and human capital formation, which likely means our BCR and ICER estimates are conservative. We used two approaches to estimate these benefits, each with strengths and limitations. Calculating LAYS from standardized assessments of foundational skills in literacy/numeracy is a relatively new approach, but we believe it has promise, as it includes a learning adjustment that enables cross-country comparisons (Angrist et al., Reference Angrist, Evans, Filmer, Glennerster, Rogers and Sabarwal2020). However, due to a lack of evidence, our effect size was drawn from a single trial in Malawi (Sixpence et al., Reference Sixpence, Vokhiwa, Kumalakwaanthu, Pitchford, Seydel, Magder, Laufer, Mathanga and Cohee2024). Recent meta-analyses concluded that while there are gains to some cognitive skills such as attention, there was no statistically significant observed increase in literacy or numeracy test scores in the broader literature (Angrist et al., Reference Angrist, Jukes, Clarke, Chico, Opondo, Bundy and Cohee2023b). However, there are few studies rigorously measuring learning. Further studies using standardized metrics for measuring foundational skills in literacy and math are needed. The absenteeism-based approach is supported by more consistent evidence, as the number of school days lost due to malaria is well documented (Halliday et al., Reference Halliday, Witek-McManus, Opondo, Mtali, Allen, Bauleni and Ndau2020; Korenromp et al., Reference Korenromp, Health, Switzerland, Wong, Dubosse and Muula2021). However, this method assumes that rates of return to education, which are typically calculated based on educational attainment (i.e. additional years of schooling), can be applied linearly to smaller units such as months or, in our case, days—a relationship that has not been validated (Mincer, Reference Mincer1974; Fink et al., Reference Fink, Peet, Danaei, Andrews, McCoy, Sudfeld, Smith Fawzi, Ezzati and Fawzi2016; Patrinos & Psacharopoulos, Reference Patrinos and Psacharopoulos2020). Therefore, if more data were available, we would consider the foundational skills in literacy LAYS approach preferable; however, there is currently a weaker evidence base.
5.4.3. Equity and social protection considerations
We do not disaggregate our results by equity-relevant variables such as gender or household wealth, despite known variation in key inputs like school enrollment (UNESCO Institute for Statistics, 2020), health-seeking behavior (Galactionova et al., Reference Galactionova, Smith, de Savigny and Penny2017) and malaria transmission intensity (Tusting et al., Reference Tusting, Willey, Lucas, Thompson, Kafy, Smith and Lindsay2013). These differences may influence both the effectiveness and cost-effectiveness of the intervention. Moreover, while school-based delivery can be efficient, it may overlook out-of-schoolchildren who are often more disadvantaged. Gender-specific benefit–cost analyses may also yield different results; for example, female education is linked to broader health and economic gains, including reductions in child and adult mortality (Pradhan et al., Reference Pradhan, Suzuki, Martínez, Schäferhoff and Jamison2017). Finally, we did not evaluate the role of malaria chemoprevention in promoting social protection or mitigating household economic shocks. Future research should aim to capture these broader impacts and assess how malaria chemoprevention can support more equitable outcomes.
5.4.4. Economies of scope
Our analysis did not account for potential economies of scope that could be achieved by integrating chemoprevention for SAC with existing school-based health interventions, such as deworming or nutrition programs, and with malaria control measures such as bednet distribution. Leveraging existing delivery platforms for SAC could reduce delivery costs and create synergies that further strengthen the value for money of this intervention.
6. Findings
6.1. Cost projections
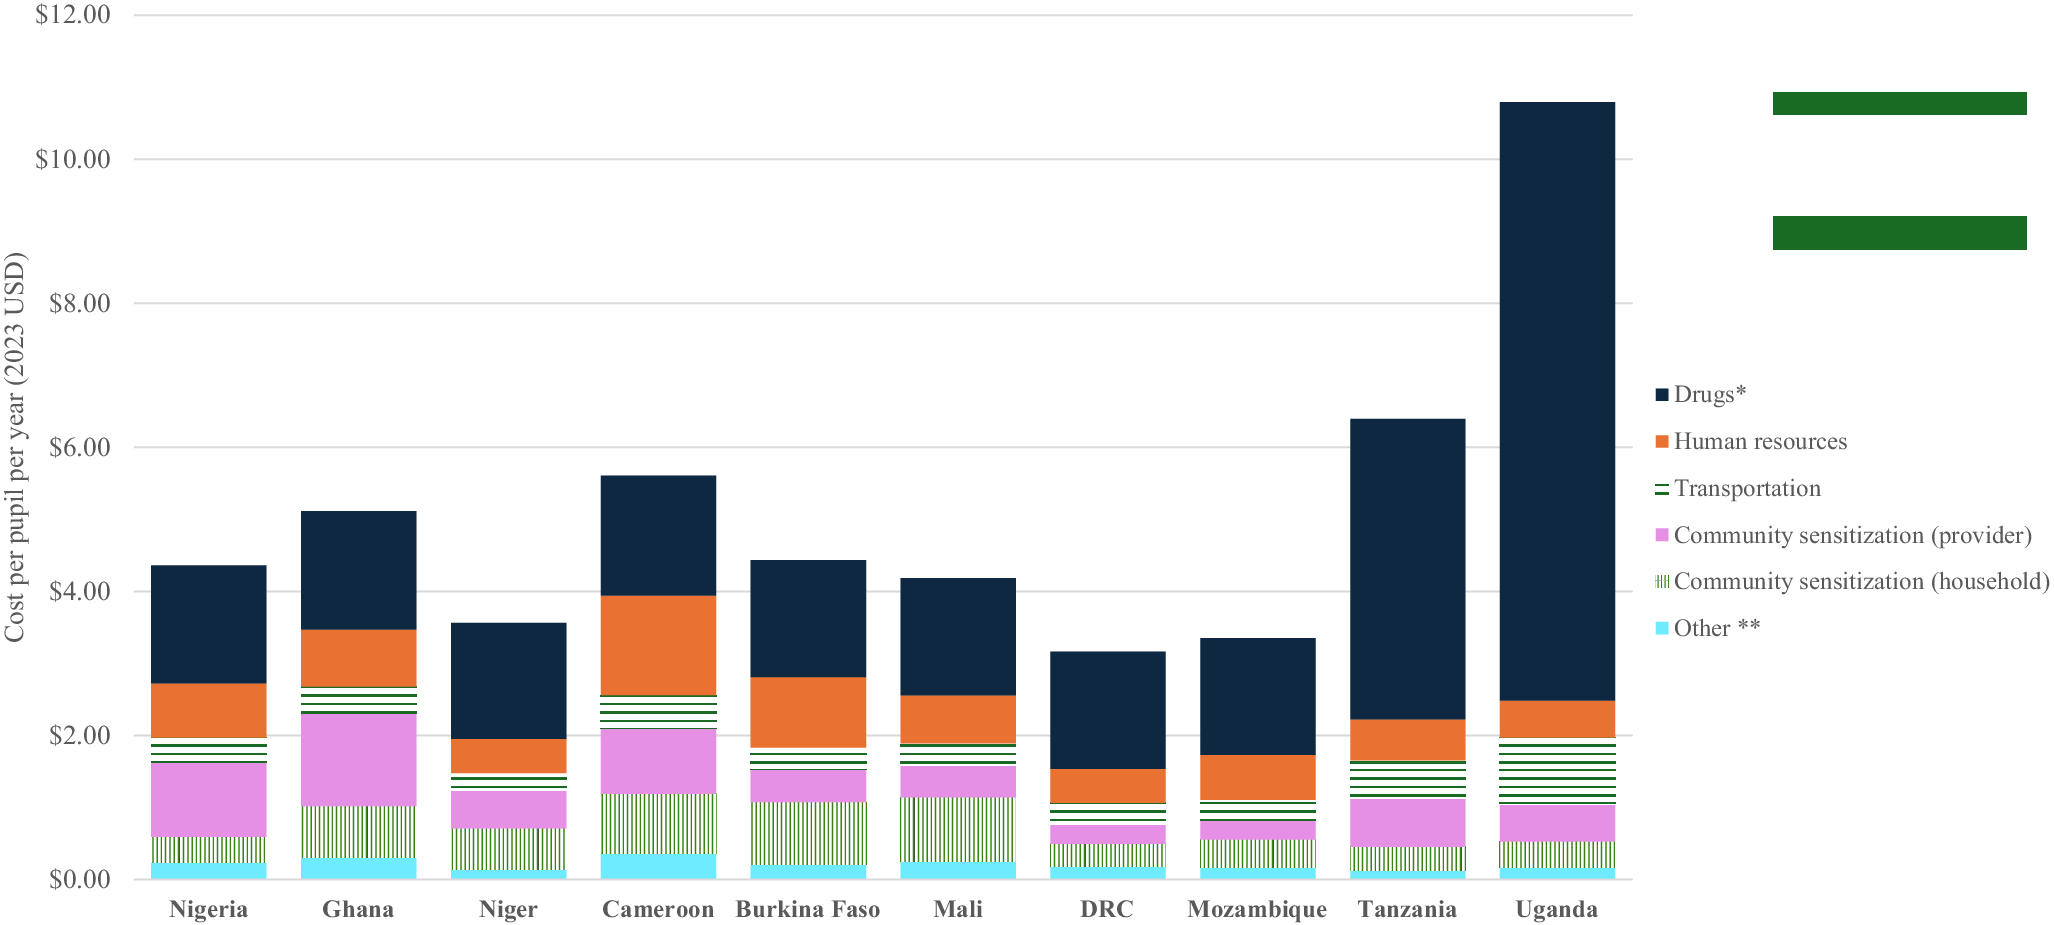
Our model found that the aggregate cost of implementing malaria chemoprevention in SAC for one year in the ten HBHI countries was $422 million, with 13% of total costs incurred by households. The modeled societal annual cost of malaria chemoprevention in SAC delivery ranged from $9 million to $113 million per country (Figure 1, Table 1, Supplementary Table S5). Drug costs were the primary cost driver, accounting for 68–81% of total societal costs in countries using DP, compared to 30–53% in SPAQ-using countries. The cost per dose delivered (excluding drug costs) was similar across countries, ranging from $0.28 in Niger to $0.67 in Tanzania, with the main cost drivers being the mean number of pupils per primary school and number of doses administered (3 vs. 6). These values align with published estimates of the cost per dose delivered (excluding drugs) for school-based deworming programs in Kenya (GiveWell, 2021) and Vietnam (Caesar delos Trinos et al., Reference Caesar delos, Paul, Ng-Nguyen, Coffeng, Clare, Clarke, Traub, Halton, Wiseman, Watts and Nery2023) (Figure 2).
Annual intervention cost per pupil (societal perspective). Note: All costs in 2023 USD. * Includes storage ** Includes supplies and materials and monitoring and evaluation.

Figure 2. Long description
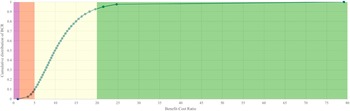
Line graph showing the cumulative distribution of benefit-cost ratios from a probabilistic sensitivity analysis. The x-axis shows benefit-cost ratios ranging from 0 to approximately 80, while the y-axis shows the cumulative distribution from 0 to 1. The curve rises steeply between ratios of approximately 5 and 20 before plateauing near 1.0. The background is shaded in different colours representing interpretation ranges of the benefit-cost ratio, with most of the distribution lying in the region where benefits exceed costs. The figure demonstrates that the majority of simulations produced positive economic returns.
6.2. Health benefit estimates
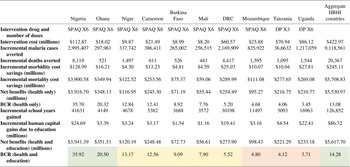
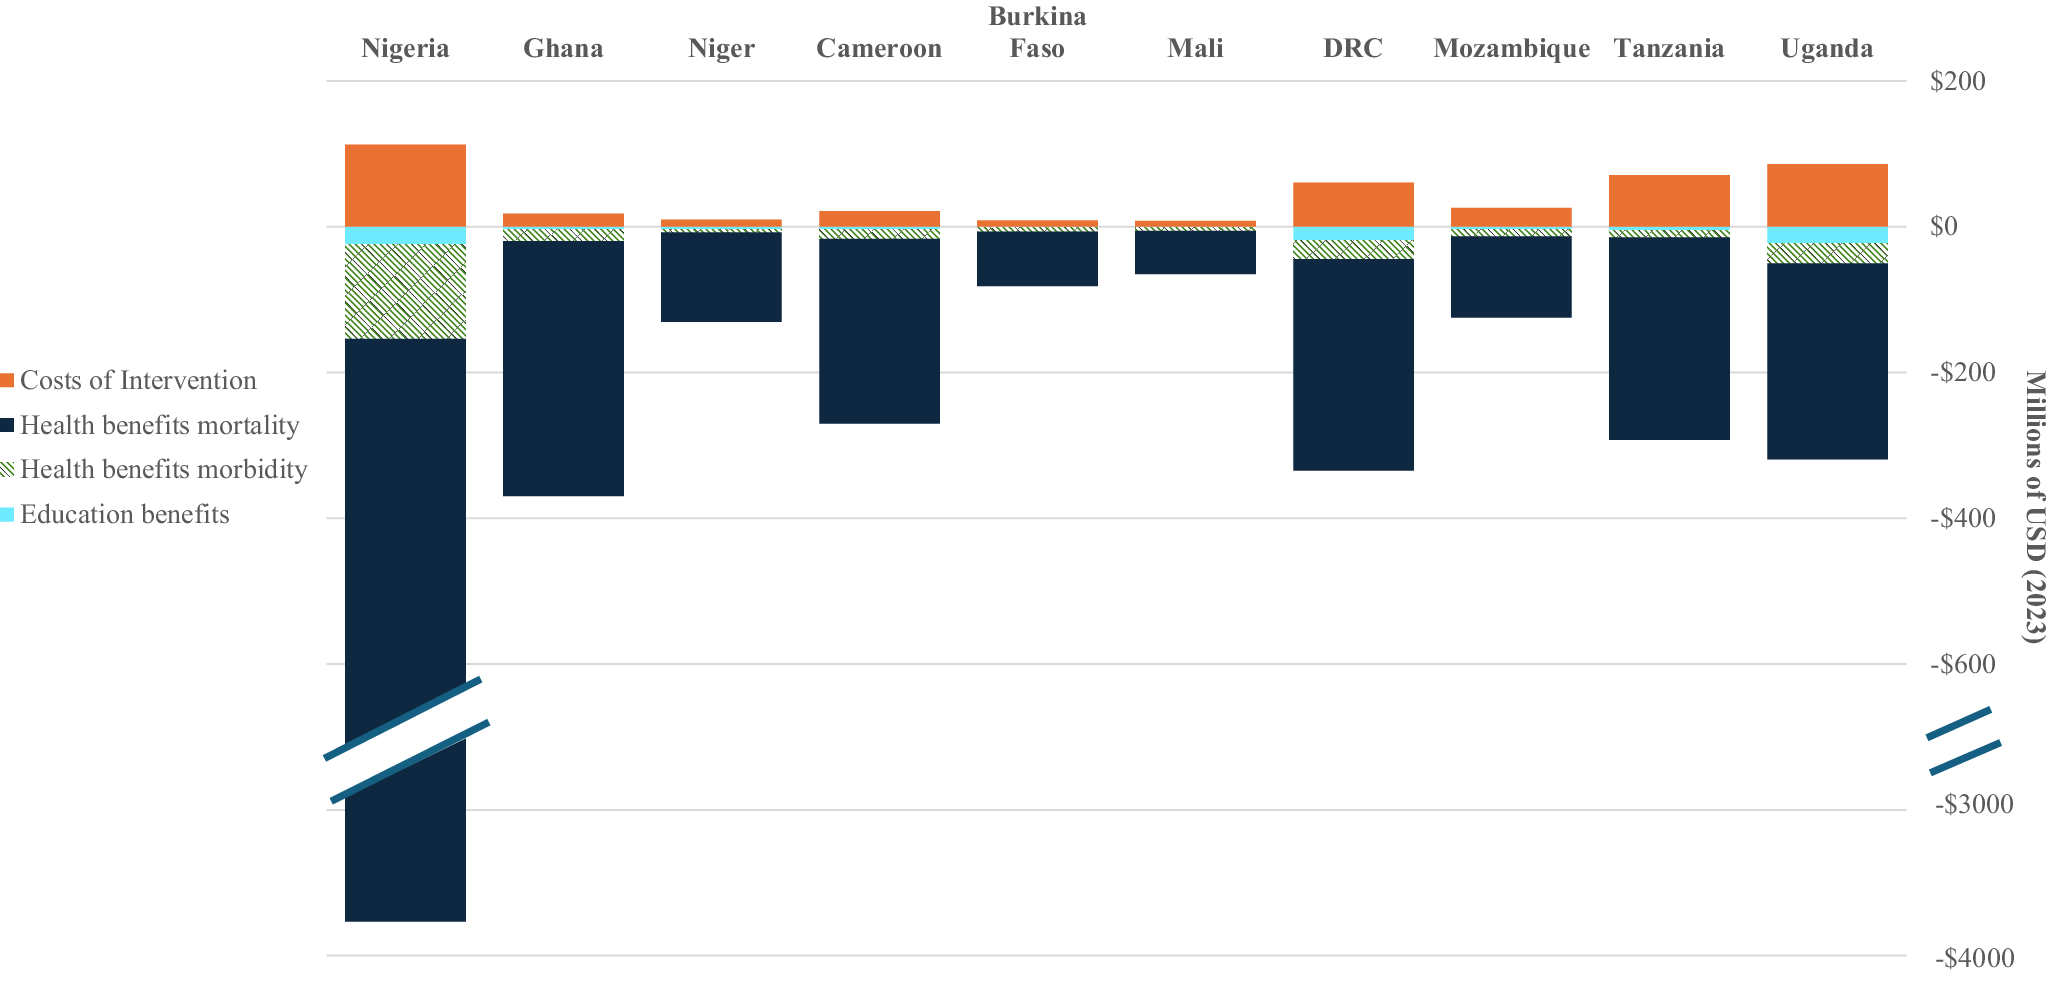
Our model estimated that implementing malaria chemoprevention in SAC aggregated across the ten HBHI countries for one year would avert an estimated 9.1 million malaria cases, 20,367 deaths and 389,765 DALYs. The intervention would generate $245.1 million in morbidity-related savings and $5.53 billion in mortality risk protection benefits. The modeled number of malaria cases, deaths and DALYs averted ranged from 256,515 to 2,995,407 cases, 443 to 8,119 deaths and 8,496 to 155,341 DALYs, with the lowest and highest estimates from Mali and Nigeria, respectively (Table 1, Supplementary Table S6). Mortality risk reduction benefits would consistently outweigh morbidity-related benefits by at least tenfold in all countries, with the ratio approaching 30:1 in Tanzania, Nigeria and Niger.
Incremental costs, health and educational benefits and benefit–cost ratios

Table 1. Long description
Table presenting incremental intervention costs, health and educational benefits, and benefit-cost ratios for malaria chemoprevention in ten high-burden African countries: Nigeria, Ghana, Niger, Cameroon, Burkina Faso, Mali, Democratic Republic of the Congo, Mozambique, Tanzania, and Uganda. Costs are presented in millions of 2023 USD. Interventions used either sulfadoxine-pyrimethamine plus amodiaquine (SPAQ) or dihydroartemisinin-piperaquine (DP) with varying dosing schedules. The table reports intervention costs, malaria cases averted, deaths averted, morbidity and mortality cost savings, net health benefits, benefit-cost ratios, school years gained, human capital gains from education, and combined health and education net benefits. Aggregate intervention costs across countries total approximately 423 million USD, while aggregate net benefits including education exceed 5.6 billion USD. Benefit-cost ratios including education range from approximately 3.7 in Uganda to nearly 36 in Nigeria, indicating positive economic returns across all countries. Educational benefits contribute additional human capital gains beyond direct health benefits. The table also applies Copenhagen Consensus traffic-light ratings to classify interventions as excellent, good, or fair investments.
Note: All costs presented in millions of 2023 USD. Educational gains estimated using the absenteeism approach. Green color: “excellent” rating; yellow color: “good” rating; orange: “fair rating” according to the Copenhagen Consensus “traffic light” rating system. DRC: Democratic Republic of the Congo; HBHI: High Burden to High Impact; DP: dihydroartemisinin–piperaquine; SPAQ: sulfadoxine–pyrimethamine + amodiaquine.
6.3. Educational gains
In the ten HBHI countries, our model found that malaria chemoprevention in SAC reduced absenteeism, resulting in an estimated 126,852 additional years of schooling (equivalent to 46.3 million additional school days) and $86.7 million in projected human capital gains (Table 1).
Based on our modeling of gains in foundational skills of literacy, malaria chemoprevention in SAC was estimated to generate 18.5 million LAYS in the aggregated ten HBHI countries, corresponding to $97 billion in human capital gains (Supplementary Table S6). The model projected that for every $100 invested, malaria chemoprevention in SAC could yield 5.03 LAYS. Among 150 education interventions analyzed globally, only four were estimated to deliver more LAYS per $100, one of which is school-based deworming. Programs that deliver three additional LAYS per $100 per child are considered highly cost-effective (Angrist et al., Reference Angrist, Evans, Filmer, Glennerster, Rogers and Sabarwal2020).
6.4. Benefit–cost ratio and net benefits
From a societal perspective, aggregated across the ten HBHI countries and using the absenteeism-based approach, our model estimated that implementing malaria chemoprevention in SAC would generate $5.7 billion in net benefits, resulting in a BCR of 14.28, classified as “good” according to the traffic light rating system. Two countries were predicted to have BCRs in the “excellent” category, equivalent to the top 20th percentile of interventions evaluated by the Copenhagen Consensus. Five countries fell into the “good” category and three into the “fair” category. Modeled country-level societal BCRs ranged from 3.71 in Uganda to 35.70 in Nigeria. The lowest BCR in Uganda’s DP scenario reflected the high costs of delivering DP six times annually, while Nigeria’s substantially higher BCR was driven by a combination of (1) a high VSL due to higher GNI per capita; (2) a higher malaria CFR; and (3) a higher malaria incidence. Across all countries, mortality risk reduction benefits accounted for most modeled benefits. The importance of drug choice is further explored in the sensitivity analysis found in the Supplementary Materials (Table S7) (Figure 3).
Incremental costs and benefits of malaria chemoprevention in SAC (societal perspective). Note: All costs presented in 2023 USD. Educational gains estimated using the absenteeism approach. A break in the y-axis is included to accommodate Nigeria’s substantially larger benefit values.

Figure 3. Long description
Stacked bar chart comparing intervention costs with estimated health and education benefits across ten countries: Nigeria, Ghana, Niger, Cameroon, Burkina Faso, Mali, Democratic Republic of Congo, Mozambique, Tanzania, and Uganda. Costs are shown as negative values below zero, while benefits are shown as positive stacked values above zero in millions of 2023 USD. Benefits are divided into mortality-related health benefits, morbidity-related health benefits, and education benefits. Education benefits represent the largest share of total benefits in most countries. Nigeria shows the largest absolute benefits and costs. In all countries, total estimated benefits exceed intervention costs.
6.5. Structural sensitivity analysis
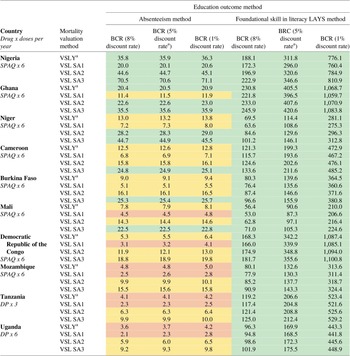
Structural sensitivity analysis revealed that our modeled BCR estimates were highly sensitive to the method used to quantify educational gains. BCRs based on foundational skills in literacy improvements were up to 100 times higher than those based solely on reduced absenteeism. This result was not surprising, as literacy-based gains reflect improvements in test scores across the entire classroom cohort, assuming all children received a benefit from malaria chemoprevention in SAC. In contrast, absenteeism-based estimates capture only the individual-level benefit of additional school days for pupils who would otherwise have missed school due to malaria.
Discount rates had a significant impact on our models that estimated literacy-based BCRs but had little effect on absenteeism-based estimates. The choice of VSL method also influenced our models, in some cases doubling the BCRs, though this effect was modest compared to differences driven by the choice of educational outcome metric. Despite these structural variations, all modeled scenarios produced fair or good BCRs, with literacy-based BCRs consistently falling in the “excellent” range across all countries (Table 2).
Structural sensitivity analysis for discount rate, method of valuing mortality-risk reduction benefits and education benefits
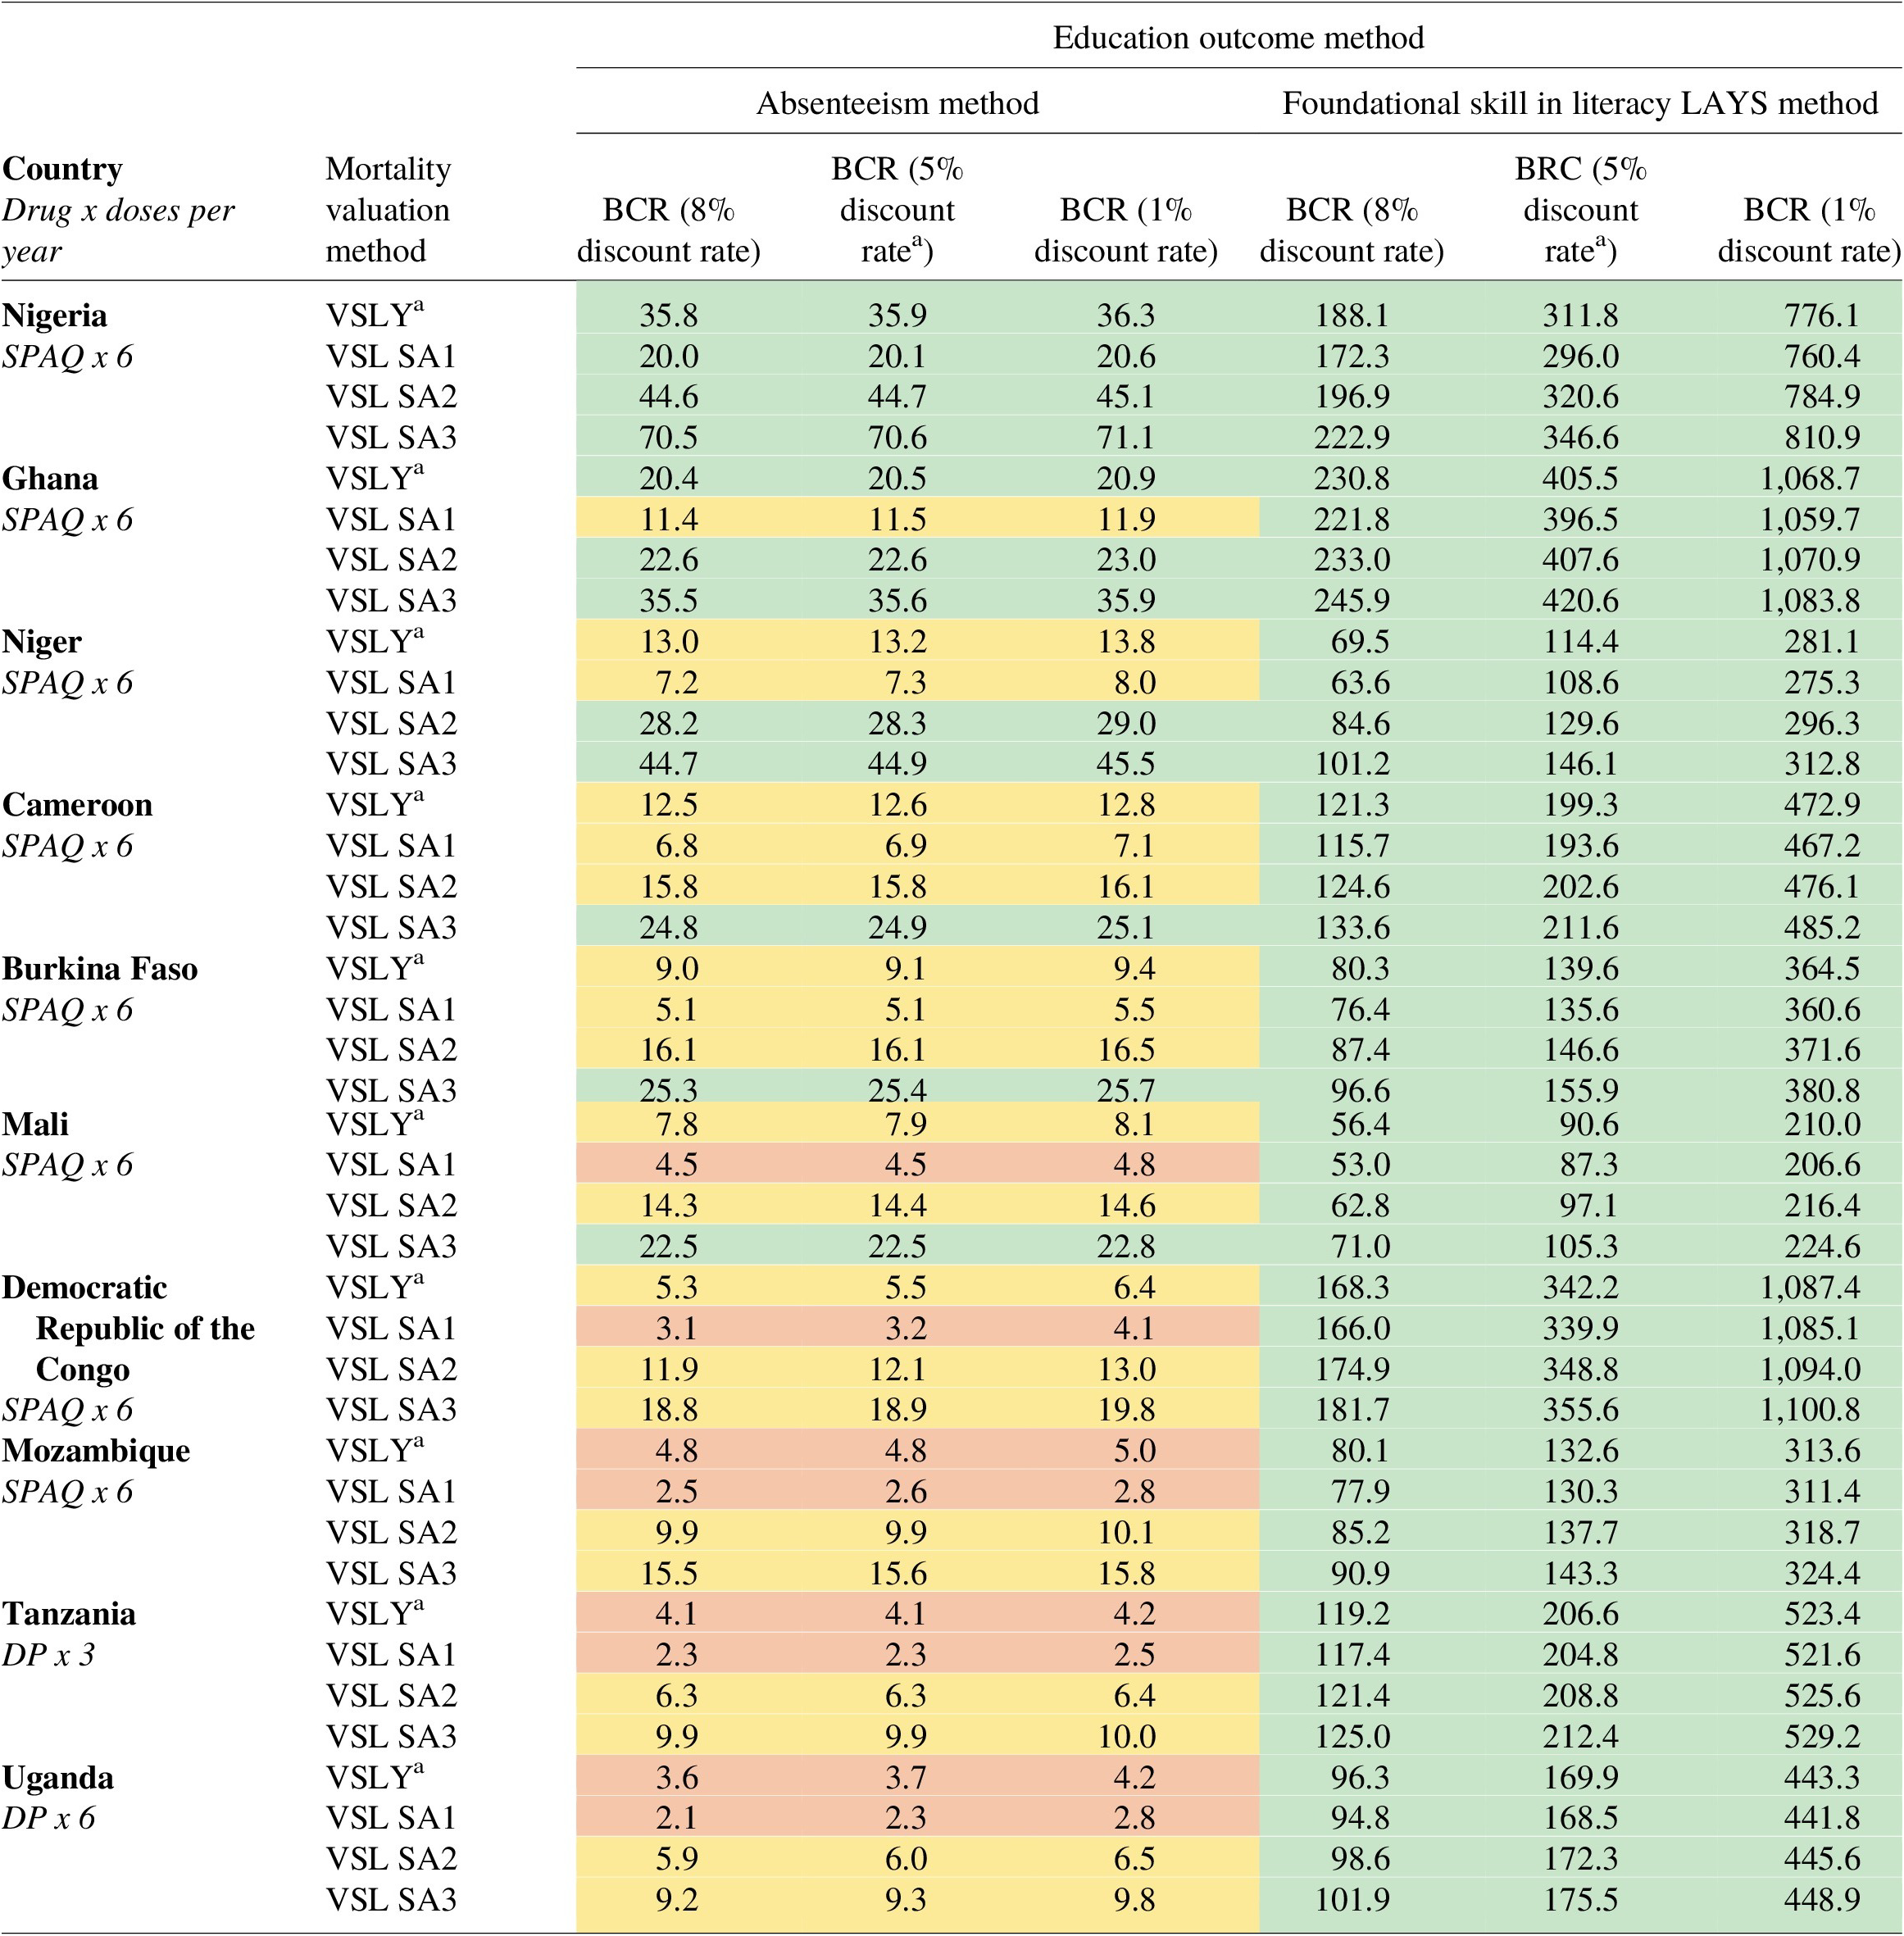
Table 2. Long description
Table presenting structural sensitivity analyses of benefit-cost ratios for malaria chemoprevention across ten African countries under alternative assumptions for discount rates, mortality-risk valuation methods, and education benefit estimation methods. Countries are ordered from most to least cost-beneficial. Analyses compare three discount rates: 8%, 5% base case, and 1%. Mortality-risk reduction benefits are valued using value of a statistical life year (VSLY) and three alternative value of statistical life (VSL) sensitivity analyses labelled SA1, SA2, and SA3. Education benefits are estimated using both an absenteeism approach and a foundational literacy learning-adjusted years of schooling (LAYS) approach. Across all scenarios and countries, benefit-cost ratios remain above one, indicating positive economic returns. Ratios are substantially larger when education benefits are estimated using the literacy LAYS method, with some exceeding 1,000 in Ghana and the Democratic Republic of the Congo under lower discount rates. Nigeria consistently shows the highest benefit-cost ratios among countries, while Uganda and Tanzania show the lowest but still strongly positive returns. Results demonstrate that conclusions remain robust across alternative structural assumptions.
Note: aBase-case analysis. All costs presented in millions of 2023 USD. Green color: “excellent” rating; yellow color: “good” rating; orange: “fair rating” according to the Copenhagen Consensus “traffic light” rating system.
6.6. Probabilistic sensitivity analysis of benefit–cost ratios
Performing a probabilistic sensitivity analysis with 10,000 iterations based on pooled input distributions, the simulated BCR for malaria chemoprevention in SAC across the ten HBHI countries was 11.00 (95% CI: 10.89–11.11), with a median of 9.94 and a range from 1.02 to 79.12. The relatively narrow CI for the “mean country” BCR reflects the design of this analysis: Pooled inputs were used to simulate average conditions, and uncertainty was varied only around this profile. As a result, the CI represents the precision of the simulated mean estimate, rather than the full spread of possible outcomes. The distribution of BCRs was right-skewed (skewness = 1.44), with a kurtosis of 4.81, reflecting the presence of a small number of simulations with very high BCRs. The benefit–cost acceptability curve illustrates the probability that the intervention is cost-beneficial at varying BCR thresholds (Figure 4). While any BCR above 1 indicates that benefits outweigh costs, decision-makers often compare across competing interventions and may apply higher thresholds to prioritize those with the greatest relative returns. In our analysis, the acceptability curve indicated a >95% probability that malaria chemoprevention in SAC is cost-beneficial at a BCR threshold of 3, increasing to nearly 100% at a threshold of 15. The tornado diagram highlighted the CFR, incidence rate and intervention effect size as the most influential drivers of variation in the BCR, underscoring the importance of accurate parameter estimates and the potential to target programs based on these characteristics (Supplementary Figure 1).
Benefit–cost acceptability curve using average input parameters across 10 high-burden-to-high-impact countries. Note: The probabilistic sensitivity analysis was conducted on a simulated country profile to explore the uncertainty in model outputs based on average values or distributions derived from the 10 countries included in the analysis. Educational gains estimated using the absenteeism approach. Green color: “excellent” rating; yellow color: “good” rating; orange: “fair” rating; purple: “poor” rating according to the Copenhagen Consensus “traffic light” rating system.

Figure 4. Long description
Stacked bar chart showing the annual cost per pupil per year in 2023 USD for malaria chemoprevention implementation across ten countries: Nigeria, Ghana, Niger, Cameroon, Burkina Faso, Mali, Democratic Republic of Congo, Mozambique, Tanzania, and Uganda. Costs are divided into categories including drugs, human resources, transportation, provider community sensitization, household community sensitization, and other costs. Total annual costs per pupil range from approximately 2 to 12 USD depending on the country. Drug and human resource costs make up the largest share of total costs in most settings, while transportation and sensitization costs contribute smaller proportions. Uganda and Tanzania show among the highest total per-pupil costs.
6.7. Incremental cost-effectiveness ratios
From a provider perspective and using cost-effectiveness thresholds that range from 15 to 36% gross domestic product per capita (reflecting opportunity costs of health spending in LMICs), our models found that malaria chemoprevention in SAC in the ten HBHI countries had an ICER of $944 (range: $297–2,975) per DALY averted and was not cost-effective compared to no chemoprevention in any HBHI country or in the aggregated analysis (Supplementary Table S6) (Pichon-Riviere et al., Reference Pichon-Riviere, Drummond, Palacios, Garcia-Marti and Augustovski2023). However, these ICERs may underestimate the true value of the intervention, as they do not account for potential reductions in malaria transmission to other age groups. The incremental cost per case averted across the ten HBHI countries ($40 per case averted; range: $26–67 per case averted) was higher than that reported for bednets ($7) and IPTi ($12) but lower than seasonal malaria chemoprevention ($145) (Conteh et al., Reference Conteh, Shuford, Agboraw, Kont, Kolaczinski and Patouillard2021).
7. Conclusion
This modeled BCA of implementing malaria chemoprevention in SAC in ten HBHI countries demonstrated substantial economic value, with estimated societal net benefits of $5.7 billion and a BCR of 14.28. These benefits were primarily driven by averted mortality, with additional gains from improved educational outcomes due to reduced absenteeism. Probabilistic sensitivity analysis yielded a mean simulated generalized societal BCR of 11.00 (95% CI: 10.89–11.11). Although the “mean country” does not represent any single setting, it serves as a benchmark for typical HBHI conditions, complementing country-specific analyses by providing both a generalizable measure of robustness and context-specific estimates for policy. Our findings demonstrated how different approaches to valuing human capital gains from improved education led to varying rates of return, with the LAYS approach yielding BCRs up to 100 times higher, underscoring the importance of further empirical work and stronger data on learning gains to substantiate the LAYS framework. While malaria chemoprevention in SAC was cost-beneficial in all settings, its cost-effectiveness appeared more limited compared to interventions such as bednets. This study fills a critical evidence gap by presenting the first BCA on malaria chemoprevention in SAC and quantifying the broader impacts of malaria prevention. These findings provide policymakers and funders with a strong basis to prioritize chemoprevention targeting SAC as a high-return investment that advances both health and human capital in malaria-endemic regions.
Supplementary material
The supplementary material for this article can be found at http://doi.org/10.1017/bca.2026.10050.
Acknowledgments
We acknowledge Open Philanthropy (GV673604850) for funding this work. We thank Michael Willoughby (RTI International) for his contributions to the development of Figure 1.
Competing interests
The authors declare none.


 Open access

