





Introduction
Nonprofit organizations (NPOs) play vital roles in society, fulfilling multiple functions such as service delivery, advocacy, social integration, and the development of cultural patterns (Maier et al., Reference Maier, Meyer, Burkart and Terzieva2024). Their effectiveness is shaped by political systems that structure regulatory environments and funding mechanisms (Liu, Reference Liu2024), with individual donations constituting a critical component of financial sustainability (Ressler et al., Reference Ressler, Paxton and Velasco2020). Prior research has identified key determinants of charitable giving, including demographic characteristics (De Wit & Bekkers, Reference De Wit and Bekkers2016; Hargaden & Duquette, Reference Hargaden and Duquette2024), intrinsic motivations (Bekkers & Wiepking, Reference Bekkers and Wiepking2010; Winterich et al., Reference Winterich, Mittal and Aquino2013), and trust (Gong & Ye, Reference Gong and Ye2021; Nie et al., Reference Nie, Chan and Lam2023). However, the influence of these factors varies across cultural and institutional contexts (Wiepking, Reference Wiepking2021), underscoring the importance of cross-national research in refining fundraising strategies and enhancing the financial resilience of NPOs.
Despite increasing interest in cross-cultural philanthropy, existing scholarship remains constrained by Western-centric theoretical frameworks that primarily focus on North American and Western European nonprofit regimes, limiting generalizability to other institutional contexts (Wiepking, Reference Wiepking2021). Moreover, global surveys frequently suffer from cultural bias, inadequate translation, and limited sensitivity to local norms. To address these limitations, this study draws on nationally representative data from Taiwan and the United States, extending charitable giving research beyond Western contexts. We examine how institutional contexts condition the relationships between individual characteristics and charitable giving. The analysis integrates three complementary cultural frameworks: Hofstede’s (Reference Hofstede1980) individualism–collectivism dimension, self-construal theory (Markus & Kitayama, Reference Markus and Kitayama1991), and cultural tightness–looseness theory (Gelfand et al., Reference Gelfand, Nishii and Raver2006). These frameworks inform hypothesis development and provide theoretical grounding for observed cross-national differences.
The US’s individualistic culture fosters giving based on personal choice (Hofstede, Reference Hofstede1980), supported by tax incentives and corporate philanthropy. In contrast, Taiwan’s collectivist culture emphasizes social expectations (Hofstede, Reference Hofstede1980) and relies more heavily on government funding and public–private partnerships (Wiepking & Handy, Reference Wiepking and Handy2015). Taiwan’s nonprofit sector, which emerged primarily after 1987 under strict regulation and religious influence, differs markedly from the US’s older, more autonomous sector (Wiepking & Handy, Reference Wiepking and Handy2015). These differences underscore the necessity of accounting for cultural values, regulatory frameworks, and funding structures when analyzing charitable behavior.
Another persistent limitation in the literature on charitable giving is the reliance on simplified linear models that inadequately capture nonlinear dynamics and cultural contingencies (Hargaden & Duquette, Reference Hargaden and Duquette2024). Recent scholarship emphasizes the need for more sophisticated analytical techniques capable of accounting for heterogeneous giving patterns without imposing reductive assumptions (Neumayr & Pennerstorfer, Reference Neumayr and Pennerstorfer2021). Responding to this methodological gap, this study integrates multiple linear regression and machine learning techniques, alongside propensity score matching (PSM) to adjust for covariate imbalance across national samples.
Guided by these theoretical and methodological considerations, four hypotheses are developed and tested within a cross-national framework. This quantitative analysis examines how nonprofit regimes and institutional contexts condition the interactions of key predictors, linking empirical findings to broader cultural interpretations. The findings uncover less intuitive patterns, such as the negative interaction between trust and altruistic motivation in Taiwan, and advance comparative third-sector theory while offering a scalable framework for understanding prosocial behavior and informing context-sensitive fundraising strategies.
Literature review
Individual giving to nonprofit organizations reflects the complex interplay between cultural values, economic structures, and institutional context that define civil society across nations. Hofstede’s (Reference Hofstede1980) framework of cultural dimensions highlights individualism and collectivism as core orientations influencing behavior. Within this framework, the United States is generally characterized as relatively more individualistic, whereas Taiwan is considered more collectivist (Hofstede et al., Reference Hofstede, Hofstede and Minkov2010). Prior research suggests that under more individualistic orientations, charitable giving is primarily facilitated by personal-level incentives such as reputation-building and individual agency, while under more collectivist orientations, giving behavior tends to be more deeply embedded in social relations and reinforced by in-group cohesion (Cui et al., Reference Cui, Jiang, Wang and Zhou2024).
Complementary frameworks, including Self-Construal Theory (Markus & Kitayama, Reference Markus and Kitayama1991) and Cultural Tightness–Looseness Theory (Gelfand et al., Reference Gelfand, Nishii and Raver2006), further clarify how cultural norms shape relational patterns and social expectations. US society is relatively loose and emphasizes individual independence, while Taiwanese society is tighter and emphasizes collective obligations and normative conformity (Gelfand et al., Reference Gelfand, Nishii and Raver2006).
While cultural frameworks offer insight into normative motivations, demographic and institutional factors also shape giving. Variables like income, age, and education often have greater explanatory power than philanthropic infrastructure (Wiepking et al., Reference Wiepking, Handy, Park, Neumayr, Bekkers, Breeze and Yang2021). At the institutional level, factors such as GDP per capita, welfare spending, and tax incentives (Einolf, Reference Einolf2017; Krawczyk et al., Reference Krawczyk, Ezeonu and Mac-Ikemenjima2023), alongside nonprofit sector development (Wiepking, Reference Wiepking2021), further structure opportunities and motivations for philanthropic engagement.
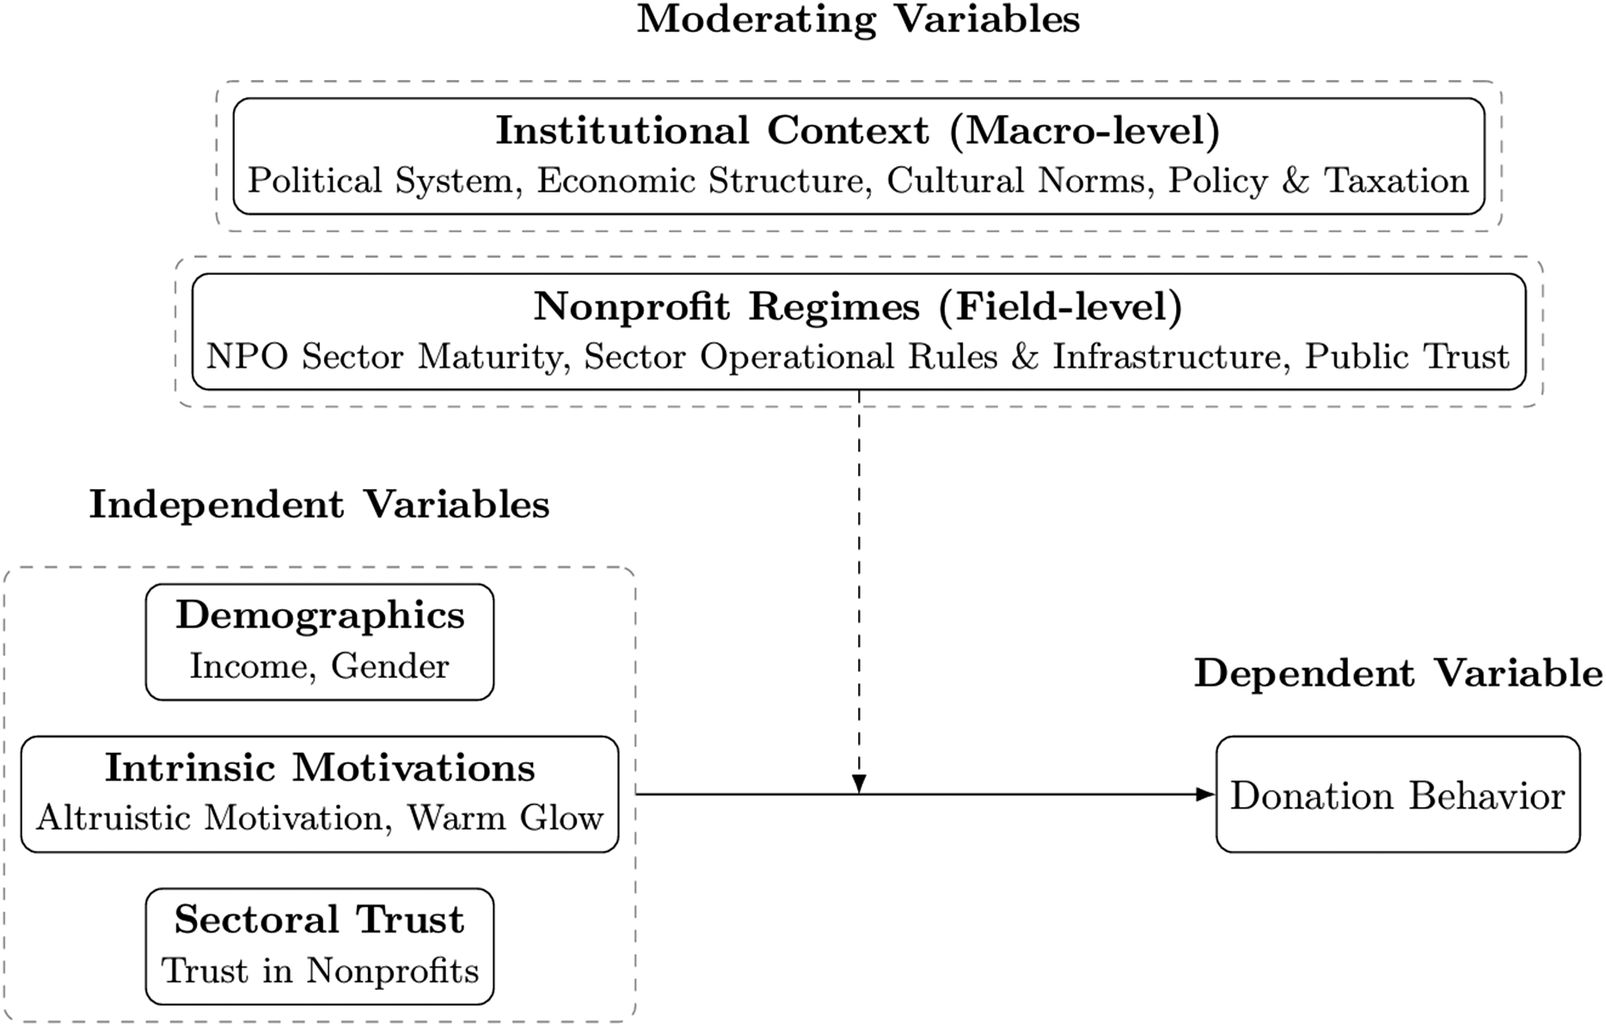
While prior research identifies age as a correlate of charitable giving, its effect operates primarily through other sociodemographic characteristics such as income, religious involvement, and family status rather than as an autonomous mechanism (Bekkers & Wiepking, Reference Bekkers and Wiepking2011). Given these considerations and data limitations, we test four hypotheses concerning income, gender, altruistic motivation, and trust. Our regression models include age as a control variable with interaction and quadratic terms to capture these indirect pathways. Specifically, we examine how income, gender, intrinsic motivations, and trust interact with institutional contexts to explain cross-national variation in giving between Taiwan and the United States. The conceptual framework is presented in Figure 1.
The Interconnection of individual determinants and contextual influences on donation behavior.

Fig. 1. Long description
The flowchart is organized into three main sections.
At the top, under the heading Moderating Variables, are two stacked boxes within dashed outlines. The top box is Institutional Context Macro-level, which includes Political System, Economic Structure, Cultural Norms, and Policy and Taxation. Below it is Nonprofit Regimes Field-level, which includes N P O Sector Maturity, Sector Operational Rules and Infrastructure, and Public Trust. A vertical dashed arrow points downward from these moderating variables toward the main causal path.
On the left side, under the heading Independent Variables, a large dashed box contains three sub-boxes. The first is Demographics including Income and Gender. The second is Intrinsic Motivations including Altruistic Motivation and Warm Glow. The third is Sectoral Trust including Trust in Nonprofits. A solid horizontal arrow points from this group toward the right.
On the right side, under the heading Dependent Variable, is a single box labeled Donation Behavior. The solid horizontal arrow from the Independent Variables points directly to this box, while the dashed arrow from the Moderating Variables intersects the middle of the solid horizontal arrow, indicating an interaction effect.
Demographic variables
Income
While income is widely recognized as a key determinant of charitable giving—given that donations inherently involve financial costs (Bekkers & Wiepking, Reference Bekkers and Wiepking2010)—its effect is neither uniform nor stable across cultural contexts. While higher income often correlates with more donations (Hoffman, Reference Hoffman2011; Meer & Priday, Reference Meer and Priday2020), lower-income individuals may donate a higher share of their earnings (Bennett, Reference Bennett2018), forming a U-shaped pattern (Hargaden & Duquette, Reference Hargaden and Duquette2024; James & Sharpe, Reference James and Sharpe2007). Explanations include stronger egalitarian values and heightened compassion among the poor (Piff et al., Reference Piff, Kraus, Côté, Cheng and Keltner2010) and greater resources among the wealthy. However, households with low income but significant assets, such as retirees, complicate the analysis (James & Sharpe, Reference James and Sharpe2007).
Importantly, national policies and cultural norms further mediate this relationship. Tax incentives, for example, reduce the effective cost of giving and can significantly encourage higher donation levels (Bakija & Heim, Reference Bakija and Heim2010). In the US, donation behavior is closely tied to income and tax-related incentives, consistent with cultural values of autonomy and individualism. In contrast, Taiwan’s collectivist orientation emphasizes group responsibility and relational obligations, which may encourage giving regardless of financial standing. Evidence from Taiwan during the COVID-19 pandemic, where social contact patterns remained resilient even under quarantine conditions, reflects these deeply embedded prosocial norms (Fu & Lee, Reference Fu and Lee2020). These distinctions highlight how institutional and cultural contexts condition the impact of income on giving.
Hypothesis 1: Charitable giving in the US is more influenced by individual financial circumstances than in Taiwan.
Gender
While gender is widely acknowledged as a key factor in charitable behavior, research has overlooked how culturally embedded gender roles shape donation practices across societies. Prior research consistently finds that women are more likely to donate (Mesch et al., Reference Mesch, Brown, Moore and Hayat2011), a pattern commonly attributed to stronger prosocial orientations, particularly empathy and the ethic of care (De Wit & Bekkers, Reference De Wit and Bekkers2016; Willer et al., Reference Willer, Wimer and Owens2015). By contrast, men’s greater access to income, education, and social networks may partially offset lower intrinsic motivation to give (Einolf, Reference Einolf2011). Importantly, these gendered patterns of giving are embedded in broader structural and cultural contexts, as differences in labor market arrangements, welfare regimes, and caregiving expectations shape gender roles within societies (De Wit & Bekkers, Reference De Wit and Bekkers2016).
To contextualize these differences, Hofstede’s Masculinity versus Femininity (MAS) index provides a useful cultural lens. The United States, with a high masculinity score, emphasizes competition and individual achievement, thereby reinforcing giving behaviors grounded in personal autonomy. In this context, gender differences in donation are more likely to operate indirectly through income or other structural advantages. By contrast, low-MAS societies such as Taiwan place greater emphasis on harmony and care, reinforcing relational expectations and interpersonal responsibilities (Hofstede et al., Reference Hofstede, Hofstede and Minkov2010). In Taiwan, women’s higher empathy more directly translates into giving behavior. Individualistic norms in the United States attenuate gender differences through income mediation, while collectivist norms in Taiwan amplify the empathy-to-giving pathway, resulting in more pronounced gender differences. Based on these considerations, we propose Hypothesis 2.
Hypothesis 2: Gender differences in charitable giving are more pronounced in Taiwan than in the United States. Specifically, women donate more than men in Taiwan due to stronger empathy-to-giving pathways, while gender effects in the United States operate primarily through income-mediated mechanisms.
Intrinsic motivations
While altruistic motivation is often treated as a universal driver of charitable giving, few studies examine how its influence varies across cultures or interacts with structural factors like income and trust. Charitable decisions are often shaped by deeply held values and moral worldviews, rather than rational assessments of need or effectiveness (Nilsson et al., Reference Nilsson, Erlandsson and Västfjäll2020). Research underscores the role of intrinsic moral foundations in driving generosity, beyond ideology or demographics.
Intrinsic motivation is commonly conceptualized through two mechanisms: pure altruism and warm glow (Andreoni, Reference Andreoni1989; Crumpler & Grossman, Reference Crumpler and Grossman2008; Harbaugh et al., Reference Harbaugh, Mayr and Burghart2007; List et al., Reference List, Murphy, Price and James2021; Null, Reference Null2011). Pure altruists focus on the provision of public goods and may reduce giving when government support increases (Ribar & Wilhelm, Reference Ribar and Wilhelm2002). In contrast, warm-glow donors derive satisfaction from the act of giving itself, often contributing to multiple causes with less concern for efficiency or impact (List et al., Reference List, Murphy, Price and James2021; Null, Reference Null2011). This study draws on the distinction between altruistic and warm-glow motivations to provide a lens for understanding donation behavior across cultures.
In individualist cultures like the United States, giving behavior often reflects personal circumstances and places greater emphasis on perceived organizational efficiency. In contrast, in collectivist cultures such as Taiwan, donations are more strongly driven by a sense of social responsibility, with altruism viewed as a moral duty to the community. Donors are more likely to prioritize the welfare of others and be motivated by the perceived societal impact of their contributions. While multiple motivations coexist in both contexts, evidence suggests that altruistic concerns play a more prominent role in Taiwan than in the US.
Hypothesis 3: Donation behavior in Taiwan is more strongly influenced by altruistic motivation than in the United States.
Trust
Existing research emphasizes cross-cultural differences in trust levels, yet often neglects how trust interacts with motivation and income, resulting in a fragmented understanding of its role in charitable giving. Trust fosters generosity by raising awareness of giving opportunities and reinforcing prosocial expectations (Glanville et al., Reference Glanville, Paxton and Wang2016). When reliable outcomes are anticipated, individuals are more likely to trust charities, which in turn promotes commitment and sustained giving (Chapman et al., Reference Chapman, Hornsey and Gillespie2021; Liu, Reference Liu2018). Moreover, trust is not uniform across individuals or contexts but is associated with demographic and contextual factors such as age, education, income, and media exposure, reflecting interactions between individual characteristics and broader social environments (Chapman et al., Reference Chapman, Hornsey and Gillespie2020).
In the nonprofit context, prior studies distinguish between organizational trust and sectoral trust (Chapman et al., Reference Chapman, Hornsey and Gillespie2021). Organizational trust refers to trust in a specific nonprofit organization, whereas sectoral trust reflects generalized trust toward the nonprofit sector as a whole. Empirical evidence suggests that these forms of trust exert a more direct influence on giving behavior than broader types of social or institutional trust (Chapman et al., Reference Chapman, Hornsey and Gillespie2021). Building on this distinction, the present study focuses on sectoral trust as a key mechanism through which broader institutional and cultural contexts shape charitable giving behavior.
Donors in both countries rely on observable signals to form sectoral trust, but these signals differ across cultural contexts. In the United States, sectoral trust is established through formal signals such as transparency, accountability, and organizational effectiveness ratings (Ferrara & Missios, Reference Ferrara and Missios2020; Wiepking & Handy, Reference Wiepking and Handy2015). These signals facilitate rational assessment of nonprofit performance, making sectoral trust particularly salient for decisions involving donation amounts.
In Taiwan, trust signals are more relational and network-based, grounded in personal recommendations and social ties (Association of Philanthropic Accountability, 2023). Taiwanese social networks emphasize indirect ties and interpersonal embeddedness (Lee et al., Reference Lee, Chang, Chou, Hwang and Fu2022). Within this context, trust is more closely associated with donation participation than with contribution magnitude. Consequently, sectoral trust more strongly predicts donation amounts in the United States than in Taiwan.
Hypothesis 4: Compared to Taiwan, sectoral trust is expected to have a stronger influence on donation amounts in the United States.
Methodology
Dataset
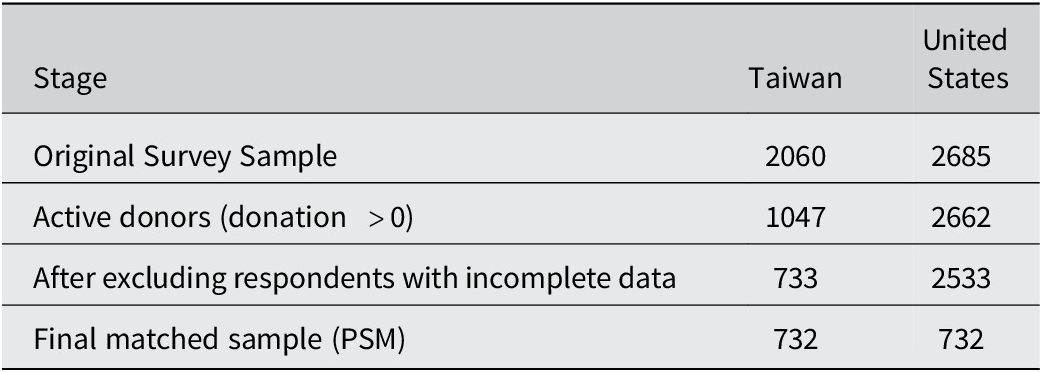
We use harmonized survey items collected in December 2022 in both countries. Both surveys measured annual donation amounts and donation occurrence within the past 12 months using equivalent instruments. The original survey samples consisted of 2,060 respondents in Taiwan and 2,685 respondents in the United States. To restrict the analysis to active donors, we limit the sample to individuals reporting a positive donation amount. In Taiwan, the resulting smaller number of active donors reflects the original survey design, which intentionally balanced the sample to include both donors and non-donors. To address differences in sample size and potential selection bias, all primary analyses are conducted on a final matched sample of 732 respondents per country. Sample sizes at each stage of the study are summarized in Table 1.
Sample size across different analytic stages

Table 1. Long description
The table consists of three columns: Stage, Taiwan, and United States.
* The first row, Original Survey Sample, shows 2060 for Taiwan and 2685 for the United States.
* The second row, Active donors (donation greater than 0), shows 1047 for Taiwan and 2662 for the United States.
* The third row, After excluding respondents with incomplete data, shows 733 for Taiwan and 2533 for the United States.
* The fourth row, Final matched sample (P S M), shows 732 for Taiwan and 732 for the United States.
A note below the table explains that the higher exclusion rate in Taiwan (51 percent non-donors versus 6 percent in the U S) is due to survey design differences.
Note: The higher exclusion rate in Taiwan (51% non-donors vs. 6% in the US) reflects the original survey design, which intentionally balanced donors and non-donors. The US survey focused primarily on active donors.
Variables
To address differences in response formats, categorical intervals, and currencies between the two datasets, a series of harmonization techniques was implemented. Given the strong association between donation behavior and price levels, Taiwan’s currency was converted to US dollars using the 2022 purchasing power parity (PPP) exchange rate of 13.71 to ensure cross-sample consistency.
For interval-based variables, such as donation amount, age, and income, the midpoint of each range was adopted as the representative value. In particular, donation amounts were winsorized to mitigate the influence of extreme values, with outliers adjusted to boundary values based on the inter-quartile range.
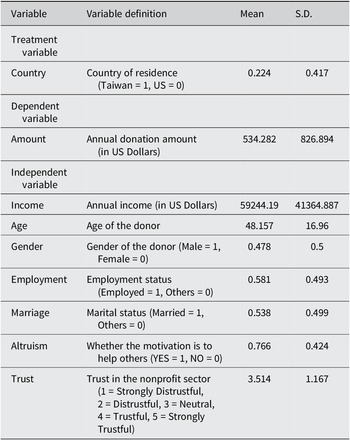
To improve model convergence, categorical variables like marital status and employment status were simplified into binary formats. Additionally, conceptual variables such as trust and altruism were rescaled and logically recoded to ensure cross-cultural comparability. Table 2 presents the pre-matching summary statistics for all variables. Appendix A provides full details on data collection procedures, original survey items, and harmonization processes.
Descriptive statistics of variables before matching

Table 2. Long description
A table with four columns: Variable, Variable definition, Mean, and S D (Standard Deviation). The data is categorized into three sections:
1. Treatment variable:
- Country: Country of residence (Taiwan = 1, U S = 0). Mean 0.224, S D 0.417.
2. Dependent variable:
- Amount: Annual donation amount in U S Dollars. Mean 534.282, S D 826.894.
3. Independent variables:
- Income: Annual income in U S Dollars. Mean 59244.19, S D 41364.887.
- Age: Age of the donor. Mean 48.157, S D 16.96.
- Gender: Male = 1, Female = 0. Mean 0.478, S D 0.5.
- Employment: Employed = 1, Others = 0. Mean 0.581, S D 0.493.
- Marriage: Married = 1, Others = 0. Mean 0.538, S D 0.499.
- Altruism: Motivation to help others (YES = 1, NO = 0). Mean 0.766, S D 0.424.
- Trust: Trust in the nonprofit sector on a scale of 1 (Strongly Distrustful) to 5 (Strongly Trustful). Mean 3.514, S D 1.167.
Figure 2 presents the pre-matching mean differences in key variables across the two regimes. With the exception of trust (Figure 2d), all variables exhibit significant disparities. The US sample shows higher levels of donation amount, income, altruistic motivation, and a greater proportion of female respondents, whereas the Taiwan sample includes more individuals who are married or employed. These systematic differences highlight substantial baseline heterogeneity across the two unmatched samples.
Mean Differences by Country Before Matching. (a)Amount (b)Income (c)Gender (d)Trust (e)Marriage (f)Employment (g) Altruism. Note: Asterisks indicate significance at the 10% (*), 5% (**), and 1% (***) levels.

Fig. 2. Long description
A multi-panel set of seven bar charts labeled a through g. Each chart compares Taiwan represented by a blue bar on the left and the U S represented by a pink bar on the right.
* Panel a Amount. Taiwan is 415.75 and U S is 568.58. A bracket with three asterisks indicates significance at the 1 percent level.
* Panel b Income. Taiwan is 41070.63 and U S is 64503.26. A bracket with three asterisks indicates significance at the 1 percent level.
* Panel c Gender. Taiwan is 0.41 and U S is 0.50. A bracket with three asterisks indicates significance at the 1 percent level.
* Panel d Trust. Taiwan is 3.56 and U S is 3.50. No significance bracket is present.
* Panel e Marriage. Taiwan is 0.64 and U S is 0.51. A bracket with three asterisks indicates significance at the 1 percent level.
* Panel f Employment. Taiwan is 0.69 and U S is 0.55. A bracket with three asterisks indicates significance at the 1 percent level.
* Panel g Altruism. Taiwan is 0.74 and U S is 0.77. A bracket with one asterisk indicates significance at the 10 percent level.
Empirical models
There are two sources of sample imbalance that warrant careful consideration. First, the proportion of active donors differs substantially, with Taiwan having fewer donors due to the original survey design. Second, descriptive statistics reveal notable baseline differences in key sociodemographic and behavioral characteristics between the samples. These imbalances suggest that direct cross-national comparisons of raw donor samples may confound contextual effects with sample composition, introducing selection bias.
To address these biases, PSM was applied prior to multiple linear regression and random forest analyses to identify donation predictors. PSM, widely used for generating credible causal inferences by controlling confounders and improving sample comparability (Austin, Reference Austin2011), enhances the validity of comparing Taiwanese (Country = 1) and the US (Country = 0) donors. It simulates counterfactuals and estimates the Average Treatment Effect on the Treated (ATT) to assess donation differences between matched groups. Matching details, including covariate balance and ATT estimates, are reported in Appendix B.
Subsequent analyses were conducted separately for Taiwan and the US using multiple linear regression and random forest models. The linear regression began with a basic specification and was then extended with interaction and quadratic terms to capture more nuanced effects. Average marginal effects (AMEs) were compared to evaluate the impact of each variable (see Appendix C for details).
To complement regression analysis, random forests were used to capture nonlinear and context-dependent patterns. Shapley values were applied to interpret each variable’s contribution in terms of magnitude and direction. As highlighted by Ma et al. (Reference Ma, Ebeid, de Wit, Xu, Yang, Bekkers and Wiepking2023) and Hofman et al. (Reference Hofman, Watts, Athey, Garip, Griffiths, Kleinberg and Yarkoni2021), computational approaches that combine predictive and explanatory modeling can reveal culturally specific patterns, strengthen causal inference, and provide a robust theoretical grounding. Additional modeling procedures and diagnostics are provided in the Appendix D.
Results
Sample balance evaluation using propensity score matching
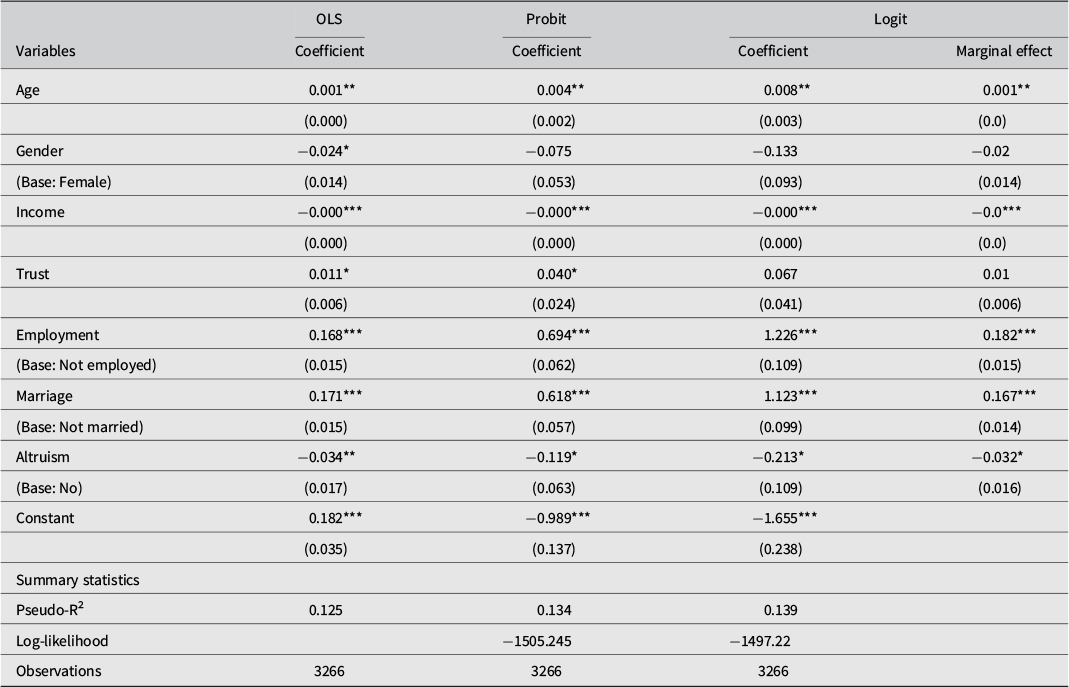
We compare three approaches for estimating propensity scores: Ordinary Least Squares (OLS) provides a baseline linear probability model, while Probit and Logit offer nonlinear specifications with different error distributions. Probit and Logit models are also estimated to examine sensitivity to alternative assumptions about the error distribution.
As shown in Table B1, all three models yield consistent coefficient signs and comparable levels of statistical significance for key predictors, indicating that the main inferences are robust to model specification. Specifically, higher income, unmarried status, unemployment, and altruistic motivation are positively associated with being a US donor.
For the subsequent PSM analysis, we adopt the Logit model to estimate treatment assignment probabilities. Logistic regression is commonly used to estimate propensity scores because it directly models binary treatment assignment and constrains predicted probabilities to the unit interval. Moreover, matching on the logit of the propensity score yields a quantity that is approximately normally distributed, which facilitates effective caliper matching and substantial bias reduction (Austin, Reference Austin2011; Rosenbaum & Rubin, Reference Rosenbaum and Rubin1985).
To evaluate post-matching comparability, we estimated the ATT on donation amount. As shown in Table 3, results across multiple matching methods reveal no statistically significant differences between Taiwanese and the US donors. This finding suggests that, once individual characteristics are balanced through PSM, observed differences in giving levels across nonprofit regime are more likely to reflect institutional and cultural factors than compositional differences in donor populations. Detailed diagnostics and visualizations of matching effectiveness are provided in Appendix B.
Average treatment effects on donation amount by country

Table 3. Long description
The table contains seven columns: Methods, Taiwan, U S, A T T, T-value, P-value, and Change. It evaluates three specific methods:
* Nearest-Neighbor Matching: Taiwan 415.751, U S 365.960, A T T 49.790, T-value 1.538, P-value 0.124, Change 13.61%.
* Caliper Nearest-Neighbor Matching: Taiwan 416.119, U S 366.359, A T T 49.761, T-value 1.535, P-value 0.125, Change 13.58%.
* Kernel-Based Matching: Taiwan 415.751, U S 389.345, A T T 26.406, T-value 1.339, P-value 0.181, Change 6.78%.
Empirical results from regression and random forest models
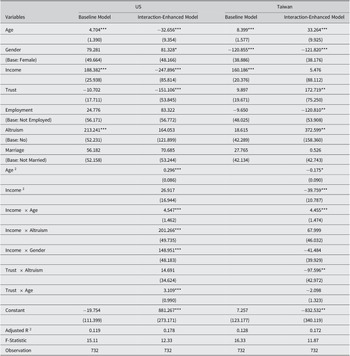
We examine how individual characteristics relate to charitable giving across institutional contexts using regression and machine learning methods. OLS models (Table 4) illustrate how key variables interact to shape donation outcomes, while AMEs (Table C2) show how their effects vary across contexts. Notably, the regression results support our literature-based decision to treat age as a non-primary predictor of donation behavior. Age does not exhibit a stable linear effect, instead showing significant nonlinearity and conditional effects through Age2 and the Income × Age interaction in both countries, as well as the Trust × Age interaction in the US.
ordinary least squares regression models comparing donation behavior in Taiwan and the US: baseline and interaction-enhanced models

Table 4. Long description
A data table with five columns: Variables, US Baseline Model, US Interaction-Enhanced Model, Taiwan Baseline Model, and Taiwan Interaction-Enhanced Model.
Key variables and their coefficients (standard errors in brackets) include:
* Age: US Baseline 4.704***; US Interaction -32.656***; Taiwan Baseline 8.399***; Taiwan Interaction 33.264***.
* Gender (Base: Female): US Baseline 79.281; US Interaction 81.328*; Taiwan Baseline -120.855***; Taiwan Interaction -121.820***.
* Income: US Baseline 188.382***; US Interaction -247.896***; Taiwan Baseline 160.186***; Taiwan Interaction 5.476.
* Trust: US Baseline -10.702; US Interaction -151.106***; Taiwan Baseline 9.897; Taiwan Interaction 172.719**.
* Altruism (Base: No): US Baseline 213.241***; US Interaction 164.053; Taiwan Baseline 18.615; Taiwan Interaction 372.599**.
* Interaction terms (Interaction-Enhanced models only):
- Income times Age: US 4.547***; Taiwan 4.455***.
- Income times Altruism: US 201.266***; Taiwan 67.999.
- Trust times Age: US 3.109***; Taiwan -2.098.
* Model Statistics:
- Adjusted R-squared: US Baseline 0.119; US Interaction 0.178; Taiwan Baseline 0.128; Taiwan Interaction 0.172.
- Observations: 732 for all models.
Asterisks indicate significance levels: * p < 0.05, ** p < 0.01, *** p < 0.001.
Note: The details of interaction selections are in the Appendix C.
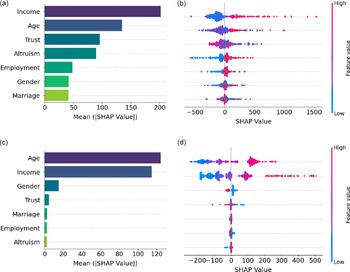
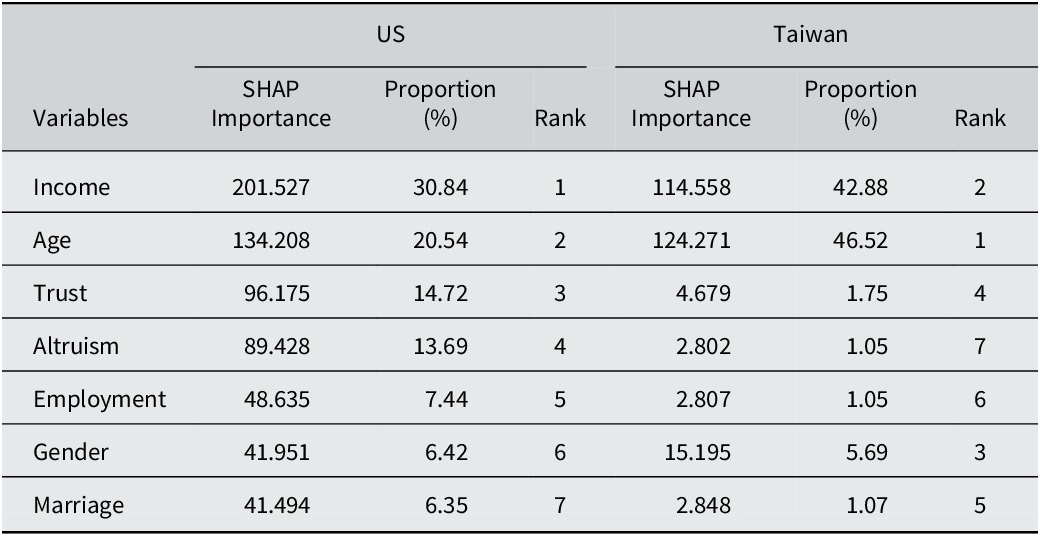
Complementing the regression findings, the random forest model highlights distinct patterns of variable importance across the two samples. As demonstrated in Table D2, the US context shows a more diversified pattern where Age, Income, Trust, and Altruistic Motivation collectively account for 79.79% of predictive importance, while Taiwan exhibits a more concentrated pattern where Age, Income, and Gender account for 95.09%, reflecting distinct institutional logic governing individual giving within each civil society regime. Figure 3 visualizes both the overall importance and the directional influence of each variable, suggesting culturally specific donation drivers.
Feature importance and impact distribution. (a)Overall Feature Importance (US) (b)Feature Impacts Across Samples (US) (c)Overall Feature Importance (TW) (d)Feature Impacts Across Samples (TW).

Fig. 3. Long description
The figure consists of four panels labeled a through d.
Panel a is a horizontal bar chart for the U S dataset. The Y-axis lists features from top to bottom: Income, Age, Trust, Altruism, Employment, Gender, and Marriage. The X-axis measures Mean absolute S H A P Value from 0 to 200. Income has the highest importance at approximately 200, followed by Age at 135, and Marriage at 40.
Panel b is a beeswarm plot for the U S dataset corresponding to the features in panel a. The X-axis shows S H A P Value from negative 500 to 1500. A vertical line at 0 indicates no impact. A color scale on the right indicates feature value from Low (blue) to High (pink). Income shows a wide positive spread for high values. Age shows a dense cluster around zero with outliers extending to 1000.
Panel c is a horizontal bar chart for the T W dataset. The Y-axis features are ordered: Age, Income, Gender, Trust, Marriage, Employment, and Altruism. The X-axis measures Mean absolute S H A P Value from 0 to 120. Age is the most significant feature at approximately 125, followed by Income at 115. Other features show significantly lower importance below 20.
Panel d is a beeswarm plot for the T W dataset. The X-axis shows S H A P Value from negative 200 to 500. For Age, high values (pink) are concentrated around positive 100 to 200, while low values (blue) are concentrated around negative 100 to 200. Income shows a similar but more dispersed pattern with high values reaching positive 500.
Income has a stronger and more nuanced influence on donation behavior in the United States
Income consistently exerts a positive and statistically significant influence on donation behavior in both the United States and Taiwan, though its magnitude and form of influence vary across contexts. In the baseline OLS model, the marginal effect of income is more pronounced in the US, aligning with hypothesis 1. In the interaction-enhanced regression model, income’s effect in the US is further moderated by age, gender, and altruistic motivation, with particularly strong effects among older males who report altruistic motivations. In Taiwan, the regression results reveal a curvilinear relationship, with donation amounts peaking at mid-income levels and declining at the highest income brackets, consistent with an inverted U-shape, along with a significant income–age interaction, indicating a stronger income effect among older individuals. While income remains a significant predictor in Taiwan’s AME estimates (Table C2), its role in the US model appears more complex and context-dependent, shaped by multiple higher-order interaction terms.
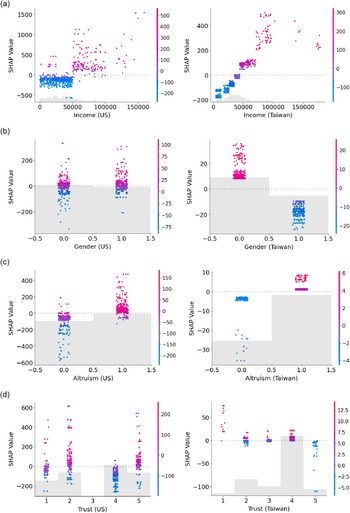
Complementary insights from the random forest model reinforce these findings. SHAP value analysis (Figure 4a) shows that low-income individuals in both countries are associated with lower predicted donation amounts. As income exceeds 50,000, SHAP values become positive, with income ranking first in the US and second in Taiwan. In the US, the positive relationship strengthens with higher income, while in Taiwan, it plateaus around 1,000,000, indicating diminishing marginal returns, consistent with the regression results. Overall, income is a robust predictor in both models, with a stronger and more differentiated impact in the US, supporting Hypothesis 1.
SHAP value distributions for key predictors across countries. (a)Income (US vs Taiwan) (b)Gender (US vs Taiwan) (c)Altruism (US vs Taiwan) (d)Trust (US vs Taiwan).

Fig. 4. Long description
Error
Gender has a stronger and more consistent influence on donation behavior in Taiwan
Gender exerts a stronger and more consistent influence on donation behavior in Taiwan than in the United States across both regression and machine learning models. In the Baseline OLS model, Taiwanese men donate significantly less than women, while no significant gender effect is observed in the US model. The interaction-enhanced model confirms this pattern: in Taiwan, the negative main effect of gender remains strong and significant, with no notable interactions. In contrast, the US model reveals a marginally significant main effect and a significant positive interaction between gender and income, suggesting that high-income men may donate more than women. Average marginal effects analysis further supports this pattern, showing a significant gender effect only in the Taiwanese sample.
Random forest results (Figure 4b) are consistent with the regression findings. Gender contributes to prediction in both countries, ranking sixth in importance in the US and third in Taiwan, but its effect differs across contexts. In the US, predicted donation amounts are similar across genders, indicating minimal substantive difference. In Taiwan, SHAP visualizations reveal a clear gender gap, with males consistently associated with lower predicted donations. Collectively, these results show that gender is a consistent predictor of donation behavior in Taiwan, but not in the US, supporting Hypothesis 2 regarding the stronger influence of culturally embedded gender norms.
Altruistic motivation has a contextual and inconsistent influence on donation behavior
In the Baseline OLS model, altruistic motivation shows a positive and significant association with donation amounts in the US, whereas no such effect is found in Taiwan. However, in the interaction-enhanced model, its main effect in the US becomes non-significant, while a positive interaction with income emerges, indicating that altruistic motivation primarily drives donations among high-income individuals. In Taiwan, the variable is significant as a main effect but interacts negatively with trust, suggesting that greater trust in nonprofit organizations weakens the influence of altruistic motives. Despite these model-specific findings, the average marginal effects analysis reveals no significant average effect in either country.
Complementing the regression-based findings, SHAP value analysis (Figure 4c) highlights distinct national patterns. In the US, altruistic motivation has a pronounced directional effect: individuals with altruistic motives are linked to higher predicted donation amounts, while those lacking such motives are associated with lower contributions. By contrast, in Taiwan, SHAP values cluster near zero, indicating that altruistic motivation plays a minimal role in shaping donation behavior.
This inconsistency suggests that while altruistic motivation may exert influence under specific contextual or interactional conditions, its overall explanatory power remains limited and warrants further investigation.
Trust has an inconsistent influence on donation behavior: Supported only by the random forest model
In the Baseline OLS model, trust does not significantly relate to donation amounts in either the US or Taiwan. However, after introducing interaction terms, the interaction-enhanced model reveals more nuanced effects. In the US, trust exhibits a significant negative main effect, accompanied by a positive interaction with age, indicating that older individuals are more likely to translate trust into donations. In Taiwan, trust has a positive main effect but interacts negatively with Altruistic motivation, suggesting that higher trust may reduce the influence of altruism. Despite these conditional patterns, the average marginal effects analysis shows no significant effect in either country. This inconsistency and context dependence mean that the regression models do not support Hypothesis 4.
By contrast, the random forest model suggests a different conclusion regarding trust’s role (Figure 4d). Trust ranks 3rd in the US and 4th in Taiwan, with larger SHAP values in the US, indicating a stronger overall influence on predicted donations. SHAP distributions in the US vary widely across trust levels, reflecting a dynamic, nonlinear relationship. In Taiwan, SHAP values cluster near zero except at the extremes, where trust shows mixed effects. These results suggest that trust plays a more influential role in the US, supporting Hypothesis 4. However, the contrast with regression findings underscores the model-dependent nature of this conclusion.
Conclusion from regression and random forest analysis
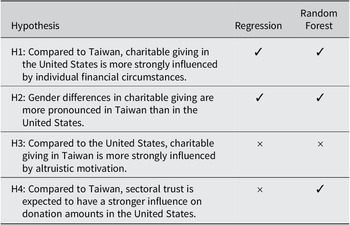
Table 5 summarizes the hypothesis testing results from both the regression and random forest models. These two approaches offer complementary insights: regression models assess directional relationships and interaction effects, while random forest models identify complex, nonlinear patterns and rank variable importance.
Hypotheses and results

Table 5. Long description
Error
Both models support Hypotheses 1 and 2, showing consistent trends for each. Hypothesis 3 is rejected by both models but for different reasons: the regression model finds non-significant interaction effects of altruism across countries, while the random forest model indicates a stronger effect of altruism among the US donors, contrary to the original hypothesis. For Hypothesis 4, the regression model detects varying but non-significant interactions, offering no support, whereas the random forest model finds trust to be more influential among American donors, supporting the hypothesis. These findings underscore the necessity of integrating complementary analytical approaches to elucidate how institutional and cultural contexts within nonprofit regimes condition the impact of individual characteristics on voluntary giving.
Discussion
Our findings demonstrate that institutional contexts systematically condition how individual characteristics relate to charitable giving. The cultural patterns highlighted in the literature review are supported by our hypothesis tests. In societies emphasizing autonomy and loose norms, such as the United States, donation behavior reflects personal values and moral agency (Simpson et al., Reference Simpson, White and Laran2018). In contexts characterized by tighter norms and more relationally embedded hierarchies, such as Taiwan (Gelfand et al., Reference Gelfand, Nishii and Raver2006), charitable giving is closely tied to social expectations and interpersonal networks.
While cultural norms offer a valuable lens for interpreting cross-national differences, they function alongside established structural determinants. In the Taiwanese context, for instance, prior research has primarily attributed donation behavior to demographic and institutional variables, such as strong religious participation, rapid mobilization during disasters (Lo & Wu, Reference Lo, Wu, Wiepking and Handy2015), and the influence of interpersonal networks (Association of Philanthropic Accountability, 2023). Rather than viewing culture as a standalone driver, we situate our cultural interpretation within this broader framework of socioeconomic and institutional influences. By integrating these perspectives, we present culture as a complementary mechanism that helps explain variations that purely structural factors may not fully capture. Accordingly, the following section evaluates each hypothesis, examining how cultural expectations interact with these structural realities to shape charitable giving.
The role of income and gender in shaping prosocial behavior (H1 & H2)
Both models support Hypothesis 1: charitable giving in the United States is more strongly influenced by individual financial capacity. Income predicts higher giving among older individuals, men, and those with stronger altruistic motivation, suggesting that personal traits aligned with cultural values of autonomy amplify the effect of resources. In Taiwan, giving reflects social embeddedness. The inverted U-shaped income pattern suggests that high-income individuals may channel generosity through institutional vehicles such as foundations or corporate donations. Gender and income shape donations, while trust and altruism function as substitutes rather than complements. Across both independent and interdependent cultures, income and age function as stable predictors, representing the material capacity and life-course stage that underpin charitable engagement (Freund & Blanchard-Fields, Reference Freund and Blanchard-Fields2014).
Hypothesis 2 is also supported, with gender differences more pronounced in the Taiwanese context. In the United States, gender effects primarily occur through interactions with income; high-income men give more, aligning with research that links elite philanthropy to status maintenance and cultural capital accumulation (Ostrower, Reference Ostrower1995). In this context, giving appears less as empathic concern and more as an extension of economic and symbolic power. By contrast, in Taiwan, women contribute significantly more than men, even when controlling for income. This finding aligns with studies showing higher empathic concern among women (Andreoni & Vesterlund, Reference Andreoni and Vesterlund2001), while also underscoring how cultural and institutional structures condition the expression of such tendencies.
Taken together, these findings show that demographic factors such as income and gender do not operate uniformly across societies but take on distinct meanings and consequences within different nonprofit regime. This underscores the need for culturally grounded frameworks that account for how generosity is conditioned by institutional contexts and nonprofit regimes in which individuals are embedded.
Altruism and trust as culture-bound motivations (H3 & H4)
Beyond demographic influences, psychological motivations, which are less structurally constrained, offer deeper insight into the cultural dynamics that shape giving behavior. While Hypothesis 3 was not consistently supported across models, the results reveal a context-dependent role of altruism. In the United States, altruism predicted higher donation amounts only among higher-income individuals, suggesting that its effect depends on resource availability (Bekkers & Wiepking, Reference Bekkers and Wiepking2010; Meer & Priday, Reference Meer and Priday2020). This pattern aligns with an independent self-construal, where giving reflects internal values and personal agency. In contrast, in Taiwan, altruism predicts giving across income levels and compensates for low trust, suggesting that in interdependent cultures, charitable behavior is also driven by relational obligations and social expectations. Even when institutional trust is lacking, individuals may give because they perceive helping others as part of their social role.
Hypothesis 4 yielded mixed results. In the US, sectoral trust consistently predicts donations, especially among older adults, who tend to prioritize the public good and show stronger prosocial tendencies than younger individuals (Cutler et al., Reference Cutler, Nitschke, Lamm and Lockwood2021; Freund & Blanchard-Fields, Reference Freund and Blanchard-Fields2014). In Taiwan, however, sectoral trust influences giving only at extreme levels and interacts with altruism, reflecting a more conditional relationship. The negative interaction between sectoral trust and altruism suggests a substitution effect. When sectoral trust in nonprofits is high, donors rely on relationally grounded trust and do not require strong altruistic motives. Conversely, when sectoral trust is low, only donors with strong altruistic motivation are likely to contribute, indicating that altruism provides an alternative pathway, consistent with cultural and relational theories of giving.
Methodological insights: Machine learning and regression in cultural contexts
This study conceptualizes culture as a moderator shaping the direction and strength of donation predictors. To capture these variations, random forests are employed as a flexible alternative to traditional regression, capable of detecting nonlinear relationships and conditional effects. These methods reveal culturally coherent patterns. In the US, altruism and trust are key predictors, while in Taiwan, income, age, and gender play a stronger role, reflecting greater emphasis on social roles that dilute the influence of psychological motivations. These findings demonstrate the value of computational approaches. Machine learning effectively captures how adaptive behaviors and strategic diversity foster collective welfare, even in competitive environments (Lee et al., Reference Lee, Cleveland and Szolnoki2021; Lee & Weng, Reference Lee and Weng2025). Beyond its technical advantages, machine learning offers a theoretically meaningful approach by revealing complex, culturally specific patterns that supplement traditional regression analysis (Ma et al., Reference Ma, Ebeid, de Wit, Xu, Yang, Bekkers and Wiepking2023).
Limitations
Despite its contributions, this study has several limitations. First, data were collected through self-reported surveys, which may be subject to social desirability bias. Second, although cultural contexts were considered in interpreting findings, key cultural values such as collectivism and individualism were not directly measured, limiting explanatory power. Additionally, survey mode bias likely led to under-representation of wealthy respondents, and annual income may not fully reflect financial standing. Third, differences in data collection methods, with online surveys in the US and telephone interviews in Taiwan, as well as variations in questionnaire wording, may have introduced measurement inconsistencies and excluded marginalized groups without internet or telephone access. While both surveys were conducted in December 2022, minimizing acute pandemic effects, longer-term shifts in charitable behavior from COVID-19 may still influence cross-national comparisons.
Conclusion
This study extends charitable giving research beyond Western contexts through rigorous cross-national comparison of Taiwan and the United States. While much of the existing scholarship treats constructs like altruism, trust, and income as universal, this research demonstrates how such predictors acquire different meanings across institutional contexts. By treating Taiwan as a distinct nonprofit regime, the study reveals distinct patterns of giving that are systematically associated with institutional structures and cultural norms, challenging universalist models in behavioral economics and social psychology.
Methodologically, this study develops a robust cross-national framework that utilizes PSM to address sample bias in the two datasets and enhance comparability. At the same time, it combines explanatory modeling via regression with predictive modeling through machine learning to capture both linear and nonlinear relationships. By framing modeling as interpretive rather than purely predictive, the approach links universal behavioral theories with context-specific realities and provides a replicable template for future cross-national research that moves beyond descriptive comparisons.
The findings reveal distinct patterns across institutional contexts. The United States donors respond to income and institutional trust when determining contribution levels. Taiwanese giving reflects social roles and relational norms, with trust and altruism functioning as substitutes. The curvilinear link between income and giving in Taiwan suggests charitable action is shaped not only by financial capacity but by culturally embedded moral reasoning. These findings challenge universalist models of prosocial behavior and highlight the need for context-sensitive definitions of key constructs such as altruism and trust.
Theoretically, this study simultaneously applies multiple cultural frameworks, providing a multi-dimensional validation of how cultural and institutional contexts shape prosocial behavior. By examining charitable giving across distinct nonprofit regimes, the research tests these theories in a concrete social domain, thereby extending their external validity and demonstrating how key cultural constructs operate in real-world settings.
Future research should move beyond cultural proxies and incorporate validated constructs such as individualism–collectivism, power distance, or relational mobility into empirical designs. Broader financial indicators and context-specific events, including disasters or public campaigns, should also be considered. In parallel, this study offers practical guidance for fundraising. In the US, appeals to transparency and sectoral trust may prove more effective, while in Taiwan, strategies that emphasize relational values and community obligations are likely to resonate more strongly.
Funding statement
This research was supported by Lehigh University.
Competing interests
The authors declare that they have no conflict of interest.
Ethical standard
This study used publicly available, anonymized survey data, and did not involve human subjects research as defined by institutional review boards. Therefore, ethics approval was not required.
Appendix A Data collection and variable harmonization
This study uses survey data from Taiwan and the United States, each collected independently to capture individual-level charitable behavior. The Taiwanese data come from a telephone survey commissioned by the Association of Philanthropic Accountability, conducted in December 2022 using random digit dialing (RDD) for both landline and mobile phones. The US data were obtained from GivingPulse, an online panel survey supported by the Fidelity Charitable Catalyst Fund, which employs quota sampling based on recent US Census statistics. The target population in both countries consists of adults aged 18 and above. In both surveys, participants were randomly selected and were not restricted to donors. For our analysis, we limited the sample to respondents reporting a positive donation amount, ensuring that all included individuals were actual donors.
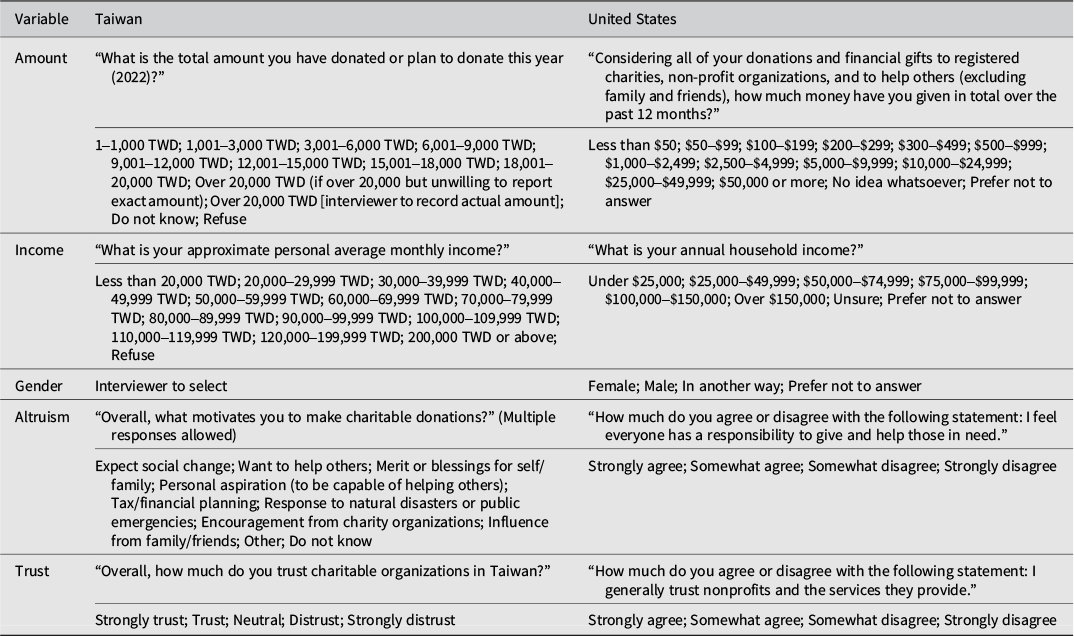
To harmonize variables across the Taiwanese and US datasets, a three-phase approach was adopted: standardizing numerical measures, recoding categorical variables into consistent binary formats, and aligning conceptually sensitive variables to ensure cross-cultural comparability. See Table A1 for the original survey items of both questionnaires.
Survey questions and response options

Table A1. Long description
Error
For numerical variables, midpoints were used for interval-based donation amounts, while exact values were retained when available. Taiwanese income data, originally reported on a monthly basis, were converted to annual figures to match the format used in the US dataset. Categorical variables such as marital and employment status were recoded into binary indicators to improve model convergence and interpretability. Marital status, which included categories such as single, married, separated/divorced, and widowed in both datasets, was recoded as 1 for married and 0 for all other categories. Employment status, which encompassed broader classifications such as unemployed, retired, student, and other, was simplified into a binary indicator, with 1 indicating employed respondents and 0 representing all others.
Attitudinal variables were rescaled and recoded to ensure conceptual equivalence across contexts. For trust, the Taiwanese survey utilized a five-point Likert scale, whereas the US version employed a four-point agreement scale without a neutral midpoint. To enhance comparability, both measures were standardized to a 1–5 scale, acknowledging the absence of a true midpoint in the US instrument. Altruistic motivation was likewise measured using differing formats: Taiwanese respondents selected reasons for donating from a multiple-choice list, with those indicating “to help others” coded as 1. In contrast, the US respondents answered a binary question—“I feel everyone has a responsibility to give and help those in need”—with affirmative responses also coded as 1.
Appendix B Propensity score matching
In this study, propensity score matching (PSM) was employed to approximate counterfactual comparisons across nonprofit regimes by matching individuals with similar observable characteristics. Taiwanese donors were designated as the treatment group (Country = 1), and US donors as the control group (Country = 0), with annual donation amount as the outcome variable. Propensity scores, representing the estimated probability of treatment assignment conditional on observed covariates, were computed to facilitate causal inference across regions. These scores were estimated using age, gender, income, trust, employment status, marital status, and altruistic motivation as predictors. To evaluate model suitability, we estimated propensity scores using OLS, Probit, and Logit regressions. Table B1 reports the corresponding estimates; based on comparative model performance, the Logit specification was selected for subsequent analysis (Equation B1).

After estimating propensity scores, treated and control units were matched to improve covariate balance and reduce selection bias. To ensure robustness, three widely used matching algorithms were implemented and compared: Nearest-Neighbor Matching (NNM), Caliper Nearest-Neighbor Matching, and Kernel-Based Matching (KBM). NNM pairs each treated unit with the nearest control; Caliper Matching excludes treated units lacking a comparable control within a predefined distance; and KBM applies weighted averages based on kernel functions. As shown in Table B2, all three methods substantially reduced covariate imbalance, as indicated by lower Pseudo-R2 values. Caliper matching with a radius of 0.03 achieved the best performance by yielding the lowest mean bias and LR Chi2, and was therefore adopted for subsequent analysis. This radius was selected after evaluating multiple thresholds to optimize balance.
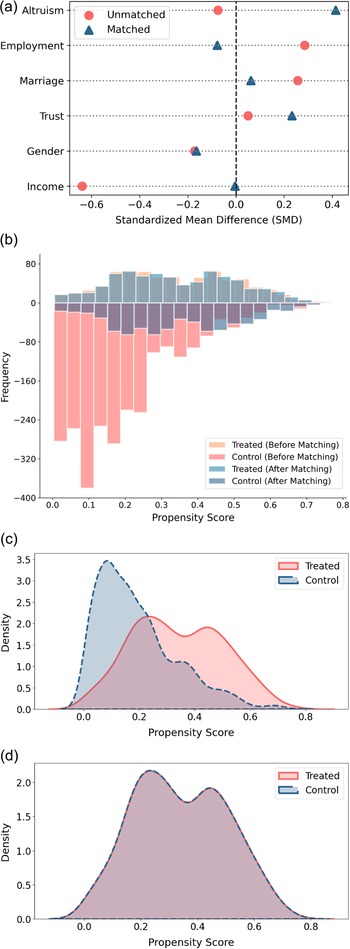
Figure B1 illustrates the effectiveness of Caliper Matching: the standardized mean differences (SMD) for covariates were reduced (Figure B1a), propensity score distributions between groups converged post-matching (Figure B1b), and kernel density plots show improved overlap and comparability (Figure B1c,d). To quantify regional differences in giving behavior, the Average Treatment Effect on the Treated (ATT) was estimated. As shown in Equation B2, the ATT represents the expected difference in donation amounts for Taiwanese donors under the US institutional context.

Pre-matching covariates by model: OLS, Probit, and Logit

Table B1. Long description
Error
Note: Asterisks indicate significance at the 0.10 (*), 0.05 (**), and 0.01 (***) levels.
Balancing property across matching approaches

Table B2. Long description
Error
Effectiveness of caliper nearest-neighbor matching. B1 (a) Standardized Mean Differences (b) Propensity Score Distributions (c) Kernel Density (Before Matching) (d) Kernel Density (After Matching).

Fig. B1. Long description
Panel a is a dot plot showing Standardized Mean Difference S M D on the x-axis from minus 0.6 to 0.4 and six variables on the y-axis. Red circles represent Unmatched data and blue triangles represent Matched data. For variables Altruism, Employment, Marriage, Trust, and Income, the blue triangles are significantly closer to the zero dashed line than the red circles. Gender remains balanced in both.
Panel b is a mirrored histogram of Propensity Scores on the x-axis from 0.0 to 0.8 against Frequency on the y-axis. The top half shows Treated groups and the bottom half shows Control groups. Before matching, the Control group has a massive peak near 0.1, while the Treated group is more evenly distributed. After matching, the blue bars for Treated and Control are nearly identical in height and distribution.
Panel c is a kernel density plot before matching. The x-axis is Propensity Score and the y-axis is Density. The Control group, shown as a blue dashed line with grey shading, has a sharp peak at 0.1. The Treated group, shown as a solid red line with pink shading, has a bimodal distribution with peaks at 0.2 and 0.45.
Panel d is a kernel density plot after matching. The Treated and Control density curves are perfectly overlaid, forming a single bimodal distribution with peaks at approximately 0.25 and 0.45, indicating successful balance.
Appendix C Multiple regression
To investigate how key variables and their interactions influence donation amounts, we constructed an interaction-enhanced regression model and evaluated multiple strategies for selecting appropriate predictors and interaction terms. The model with interaction terms is specified as follows, where Y represents the dependent variable Amount, X denotes variables such as Income, Gender, Age, etc., and k is the number of variables.

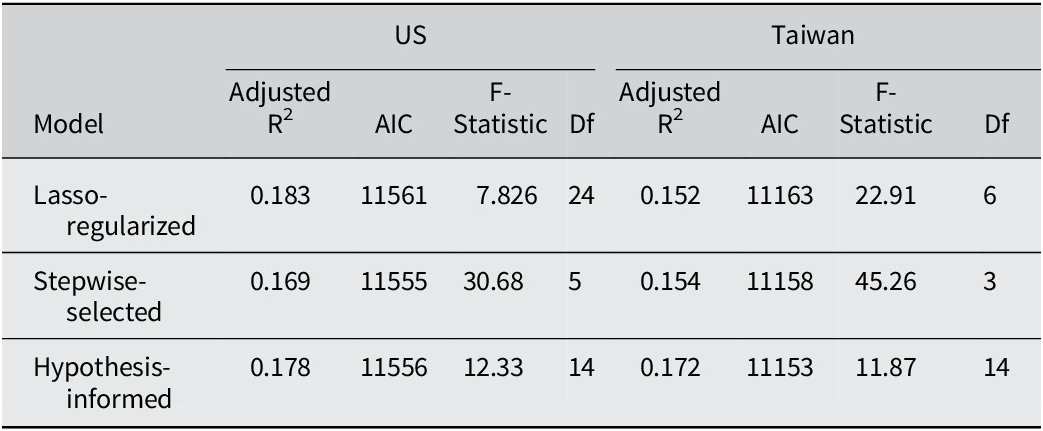
To ensure model stability, interpretability, and appropriate selection of interaction terms in the interaction-enhanced model, three modeling strategies were evaluated, as summarized in Table C1: (1) Lasso-based variable selection; (2) bidirectional stepwise regression following Lasso preselection; and (3) a hypothesis-informed model incorporating theoretically relevant variables and interactions.
Evaluation of OLS regression models

Table C1. Long description
Error
While the Lasso model yielded the highest adjusted R2 in the US sample, its inclusion of numerous variables raised concerns about overfitting and the interpretability of interaction effects. Stepwise regression produced a more parsimonious specification but often excluded theoretically important variables, resulting in weaker performance relative to the hypothesis-informed model across both samples. Considering the trade-off between explanatory power (adjusted R2) and model simplicity (degrees of freedom), the hypothesis-informed model was selected for subsequent analysis.
Average marginal effects (AMEs) of the interaction-enhanced model

Table C2. Long description
Error
Note: Asterisks indicate significance at the 10% (*), 5% (**), and 1% (***) levels.
Appendix D Random forest
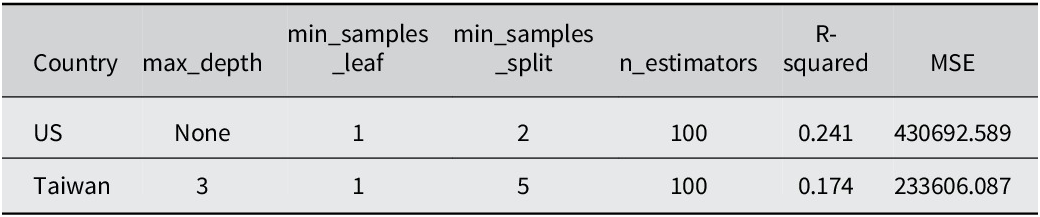
To ensure the random forest model was both accurate and generalizable, a systematic tuning process was implemented. The dataset was first divided into training and testing sets: the training set was used to build the model, while the testing set served to evaluate its predictive performance.
Grid Search with fivefold cross-validation (cv = 5) was employed to identify the optimal combination of hyperparameters. The parameter grid included the following ranges: max_depth = (3, 5, 7, None), min_samples_leaf = (1, 2, 4), min_samples_split = (2, 5, 10), and n_estimators = (50, 100). The selected hyperparameter combinations that achieved the best performance are summarized in Table D1.
Optimal random forest parameters and performance metrics

Table D1. Long description
Error
SHAP importance ranking of variables

Table D2. Long description
Error





 Open access

