


1 Introduction
Humanity’s success as a biological species is due in large part to our ability to engage in collaborative activities that produce outcomes far greater than what can be achieved by any individual acting alone. From monumental achievements like sending a human to outer space to something as trivial as carrying a heavy object across a room, joint actions — i.e., “any form of social interaction whereby two or more individuals coordinate their actions in space and time to bring about a change in the environment” (Reference Sebanz, Bekkering and KnoblichSebanz et al., 2006, p. 70) — are ubiquitous in all forms of human endeavour. While there are a number of perspectives taken on the nature and processes of joint action (Reference McGrathMcGrath, 1984, Reference Sebanz, Bekkering and KnoblichSebanz et al., 2006, Reference SteinerSteiner, 1972), they all involve an assumption that when people engage in a joint action their participation is intentional. However, how people come to form this intention to participate remains an open question.
The "mindreading"Footnote 1 literature is concerned with understanding how people reason about the beliefs, desires, and intentions of others, and, via this reasoning process, predict their behaviour. It is clear that this is intimately linked with the study of joint action; in order to cooperate with another person, one must be able to infer what the other is intending to achieve, predict the action they will take in order to achieve the goal, and execute the appropriate complementary action(s) (Reference ApperlyApperly, 2012). In this paper, we aim to apply work in the mindreading literature to the study of human cooperation in social dilemma games, with the belief that combining the two literatures can deliver important insights about how humans reason — successfully or otherwise — about the intentions of others.
1.1 The stag hunt as a model of the joint action decision problem
The problem of the "Stag Hunt", originally described by Rousseau and written about extensively by Skyrms and others, neatly captures the complexity and pitfalls of forming and maintaining joint intentions so that joint actions can be successfully undertaken (deBoer, 2013, Reference RousseauRousseau, 2018, Reference SkyrmsSkyrms, 2004, Reference SkyrmsSkyrms, 2010, Reference SkyrmsSkyrms, 2014).
To illustrate the problem, take two hunters named Alice and Bob who can both see a stag in the distance, with no other game nearby. In order to capture the stag together, they initially need a way to signal their intentions to each other. In this simple scenario, a meaningful glance towards the stag — a "gaze signal" — could suffice. When Alice sees Bob gaze towards the stag, she infers that he intends to hunt it, and begins to coordinate her actions with his; once Bob sees Alice return his gaze and make some initial movements towards the stag, there is a shared understanding that they have formed a joint intention to hunt the stag together and the hunt can proceed.
However, the situation is more complicated if there is also a hare nearby. A hare can be caught by one person alone, obviating the risk involved in cooperating with another person. The temptation facing the two hunters is described thus by Rousseau: "[I]f a hare happened to pass within reach of one of them, we cannot doubt that he would have gone off in pursuit of it without scruple…" (Reference RousseauRousseau, 1984).
This potential for defection from the joint action makes Alice’s task of inferring Bob’s intention when he gazes towards the stag more difficult. Bob’s signal might be genuine, or he might be trying to deceive Alice into pursuing the stag on her own so that he’ll be free to catch the hare for himself. One possibility is for Alice to just assume that Bob’s signal towards the stag is genuine and proceed as if the hare weren’t there. However, she might also think more carefully about her decision and consider whether Bob is trustworthy enough to believe in the circumstances. If Alice trusts Bob, she might conclude that his actual intention matches his signal; but if she doesn’t, she might decide to avoid the risk of pursuing the stag and go for the hare herself.
The stag hunt is a useful example because it succinctly captures the interactions between the key elements involved in real-world joint action decision making. It shows how the process of inferring a joint action partner’s intentions can be influenced by three distinct cues: signals, environmental payoffs, and the apparent reliability of the partner in the endeavour. It also demonstrates how the complexity of the mindreading process can vary with the context in which the joint action occurs, the nature and availability of cues, and the extent to which decision makers choose to integrate them. For example, if Alice is prepared to simply assume that Bob’s intentions match his signals, her mindreading task is simple (and perhaps even automatic). And if Alice and Bob participate in many joint hunts together, they might reach the point where they don’t even need to check each other’s signals because they can make a safe assumption about how the other is going to behave. However, if Alice has reason to think that Bob’s signals might be deceptive, inferring his true intention might involve a more cognitively demanding process of deliberation, in which the various cues are weighed against each other (Reference Apperly and ButterfillApperlyButterfill, 2009, Reference Jekel, Glöckner and BröderJekel et al., 2018, Reference PacheriePacherie, 2013, Sebanz et al., 2006).
1.2 The stag hunt in the lab — social dilemma games
There is a huge literature investigating the way that people make decisions in joint action problems like the stag hunt via experimental games known as "social dilemmas". A major class of these games is two-player mixed-motive games, the most well-known of which is the Prisoners’ Dilemma. In these games, the rewards associated with a decision maker’s options (to cooperate or defect from the joint action) are represented as payoffs in a simple two-by-two matrix. The structure of the payoff matrix creates a tension between cooperating with a partner to achieve the best collective result, or pursuing an individualistic option, which delivers a higher individual payoff to the decision maker, and/or involves less risk. Research with social dilemma games has delivered many important insights into joint action resolution and human cooperative behaviour more generally — but gaps still remain, and in this paper we seek to address two areas where the literature is still largely undeveloped:
-
1. Given that resolving social dilemmas optimally involves inferring and responding to the intentions of others, one might expect mindreading to play an important role in the decision making process. Evidence that it does can be found in the neuroscience literature, where a number of studies have shown activity in areas of the brain associated with mindreading in participants playing social dilemmas (Reference Rilling, Sanfey, Aronson, Nystrom and CohenRilling et al., 2004, Reference Rilling and SanfeyRillingSanfey, 2011, Reference Stallen and SanfeyStallenSanfey, 2015, Reference Yoshida, Seymour, Friston and DolanYoshida et al., 2010); there is also evidence that participants form mental models of others’ decision processes from sequential-move games (Reference Goodie, Doshi and YoungGoodie et al., 2012, Reference Hedden and ZhangHeddenZhang, 2002). However, current major models of the decision-making process in social dilemmas generally do not explicitly consider the role that mindreading might play (though see (Reference Yoshida, Dolan and FristonYoshida et al., 2008)).
-
2. While there is a large body of research on the independent effects of signals (Reference BallietBalliet, 2010, Reference SallySally, 1995), environmental incentives (Reference KollockKollock, 1998, Reference RapoportRapoport, 1967, Reference Schmidt, Shupp, Walker and OstromSchmidt et al., 2003, Reference Van Lange, Joireman and Van DijkVan Lange et al., 2013), and partner reliability (Balliet, 2010, Reference Frank, Gilovich and ReganFrank et al., 1993, Reference Jaeger, Evans, Stel and van BeestJaeger et al., 2019, Reference MilinskiMilinski, 2002) on choices in social dilemma and other games, there is very little work on how these cues interact to affect choices (and, by extension, mindreading processes). For a similar observation, see (Reference Declerck, Boone and KiyonariDeclerck et al., 2014); for examples of work investigating interactions between some, but not all three of, signals, environment, and reliability, see Reference Balliet(Balliet, 2010), Reference Balliet and Van Lange(BallietVan Lange, 2013), Reference Boone, Declerck and Kiyonari(Boone et al., 2010), Reference Boone, Declerck and Suetens(Boone et al., 2008)). This limits the types of mindreading strategies that are available to participants. For example, in many one-shot social dilemma experiments participants are only given information about payoffs; in an experiment like this, a player can only infer his/her partner’s intention by considering the payoffs from the partner’s perspective and making general assumptions about others’ preferences for distribution of those payoffs. There is no potential for attempts at deception and thus no need for players to deal with this possibility in their mindreading strategies.
In the rest of this introduction, we will examine the role of mindreading in some existing models of decision making in social dilemma games. We will then introduce our model, the Hierarchichal Mindreading Model (HMM), which classifies various decision-making strategies according to the type and complexity of mindreading that they involve, and discuss how this model fits within the existing literature. We finish by describing our method for testing some key implications of the HMM across the series of experiments that are presented in this paper.
1.3 The role of mindreading in some existing models of decision making in joint action problems
While most existing models of the decision process in social dilemmas do not explicitly address mindreading, they clearly imply that some form of mindreading will occur; that is, they contemplate that participants will use all or some of the available information to infer how their partner in the game is likely to play. As we outline below, some models contemplate only one type of mindreading (e.g., orthodox game theory), while others define multiple strategies that involve very different types of mindreading (e.g., dual process theories). However, we suggest that none of these models cover the full range of mindreading strategies that are available to Alice in the stag hunt example above.
1.3.1 Emphasising payoffs - orthodox game theory
Decisions about whether or not to participate in a joint action in the context of social dilemma resolution have historically been conceptualized within a game theoretic framework (VonNeumannMorgenstern, 2007). Orthodox game theory rests on the assumption that decision makers are rational in the sense that they seek to maximise their own payoff and assume that their partner in the game is seeking to do the same. Taking this approach to a game like the one-shot Prisoners’ Dilemma implies that:
-
1. Signals are meaningless, because an assessment of the game’s payoffs leads to the conclusion that one’s partner will signal an intention to pursue the cooperative option regardless of what their actual intention is (Reference AumannAumann, 1990); and
-
2. Participants will never cooperate, because their payoff is maximised by defecting regardless of the decision their partner makes.
Orthodox game theory models, then, imply a mindreading strategy in which only payoffs are relevant, and mindreading is explicit — e.g., "My partner is going to choose X because that maximises her payoff; in response I should choose Y in order to maximise my payoff." The signals of others, and hence any information about how likely those signals are to be reliable, are not a factor in the decision-making process (in a PD-like situation, at least). This is not to suggest that, as a result, payoff-based mindreading is simple; on the contrary, there is ample evidence to suggest that interpreting incentives from the perspective of another is a cognitively demanding task (Reference Allred, Duffy and SmithAllred et al., 2016, Reference Duffy and SmithDuffySmith, 2014, Reference Evans and KruegerEvansKrueger, 2011). Rather, the observation allows us to suggest that a similar mindreading strategy underlies a large number of different models based on orthodox game theory.
1.3.2 Including signals and reliability — models of social preference
Of course, the non-trivial amount of cooperation observed in both the lab and the real world in Prisoners’ Dilemma-like situations belies the second prediction above (Reference Camerer and FehrCamererFehr, 2006, Reference ColmanColman, 2003a, Reference DawesDawes, 1980, Reference Fehr, Fischbacher and GächterFehr et al., 2002, Reference Gintis, Bowles, Boyd and FehrGintis et al., 2003, Reference JonesJones, 2008, Reference ListList, 2006, Reference OlsonOlson, 2009, Reference Tversky and ShafirTverskyShafir, 1992), and there is also research showing that signals are indeed effective in increasing rates of cooperation in the Prisoners’ Dilemma and other social dilemma games (Balliet, 2010, Reference Ellingsen and OstlingEllingsenOstling, 2010, Sally, 1995).
A number of alternatives to orthodox game theory have been proposed to explain this “irrational” cooperative behaviour. Pursuant to social value orientation (SVO) and team reasoning, participants may not interpret the payoffs associated with joining or avoiding a joint action from a purely individualistic perspective; rather, prosocial or team-based participants may transform a social dilemma’s payoff matrix by placing some weight on other players’ outcomes (Reference Balliet, Parks and JoiremanBalliet et al., 2009, Reference Bogaert, Boone and DeclerckBogaert et al., 2008, Reference Messick and McClintockMessickMcClintock, 1968, Reference Van Lange, Otten, Bruin and JoiremanVan Lange et al., 1997), or participants may calculate payoffs from the perspective of the collective (Reference BacharachBacharach, 1999, Reference Colman, Pulford and RoseColman et al., 2008, Reference Colman and GoldColmanGold, 2018, Reference GoldGold et al., 2012). Other theories (well supported by empirical findings) emphasise participants’ concerns with notions of fairness, reducing inequality, and social welfare to explain cooperation in social dilemmas (Reference Bolton and OckenfelsBoltonOckenfels, 2000, Reference Charness and RabinCharnessRabin, 2002, Reference Fehr and SchmidtFehrSchmidt, 1999).
These models expand the type of mindreading strategies available to decision makers, because signals and reliability information — should they be available — are now relevant to the decision process. If Alice is going to risk being left empty-handed by pursuing the stag even though a hare is nearby, she needs reassurance that Bob is going to join her. Those who are inclined to cooperate can rely on the signals of their prospective partner to reassure themselves that their partner is similarly inclined; and reliability information can be used to determine whether those signals are likely to be genuine or deceptive, and/or whether a partner is likely to have a similarly cooperative outlook on the situation.
While there are important differences across these models, taking a mindreading-based approach to the literature reveals a common foundation; in all of them, the intentions of others are inferred by explicitly considering the structure of the payoff matrix and their likely preferences for how those payoffs are distributed. This observation also applies to other models that are somewhat conceptually different, but still seek to explain cooperation rates with reference to payoffs and social preferences, like the cooperative equilibrium model (Reference CapraroCapraro, 2013, Reference Halpern and RongHalpernRong, 2010). As with an orthodox game theoretic approach, mindreading in these models is explicit; participants deliberate on the other player’s likely choice and make a choice that maximises their own utility function in response.
1.3.3 Dual process models and the role of heuristics
Recent work addresses the role of intuition and heuristic processing in social dilemma resolution. Perhaps most prominently, Rand and colleagues have proposed that some participants in N-person Prisoners’ Dilemmas (also known as Public Goods Games) intuitively cooperate rather than deliberating on a game’s payoffs (Reference Bear and RandBearRand, 2015, Reference Rand, Greene and NowakRand et al., 2012, Reference Rand, Peysakhovich, Kraft-Todd, Newman, Wurzbacher, Nowak and GreeneRand et al., 2014, Reference Zaki and MitchellZakiMitchell, 2013). While there has been considerable discussion around the interpretation and replicability of these results (Reference BouwmeesterBouwmeester et al., 2017, Reference Krajbich, Bartling, Hare and FehrKrajbich et al., 2015, Reference KvarvenKvarven et al., 2020, Reference RandRand, 2017, Reference Stromland, Tjotta and TorsvikStromland et al., 2016, Reference TinghögTinghög et al., 2013), and further work indicating that intuitive cooperation might apply only to prosocial participants (Reference Andrighetto, Capraro, Guido and SzekelyAndrighetto et al., 2020, Reference Konovalov and KrajbichKonovalovKrajbich, 2019, Reference Mischkowski and GlöcknerMischkowskiGlöckner, 2016, Reference Yamagishi, Matsumoto, Kiyonari, Takagishi, Li, Kanai and SakagamiYamagishi et al., 2017), evidence for heuristic-based decision making in social dilemmas (and social decision making more broadly (Reference Hertwig and HoffrageHertwigHoffrage, 2013)) is apparent in other paradigms as well. For example, Reference Capraro, Jordan and Rand(Capraro et al., 2014) report evidence that participants in a Prisoners’ Dilemma with endowments use an "equality heuristic", consistently contributing half of their endowment regardless of changes in the game’s incentive structure (see also Reference Allison and Messick(AllisonMessick, 1990), Reference Messick(Messick, 1993), (Reference Roch, Lane, Samuelson, Allison and DentRoch et al., 2000)). Reference Evans and Krueger(EvansKrueger, 2016) describe the use of an "egocentric" heuristic in trust games, whereby participants initially focus on the game’s payoffs from their own perspective while neglecting to consider the incentives affecting the other player (EvansKrueger, 2011, EvansKrueger, 2016). Other work proposes that participants assume — despite clear instructions to the contrary in anonymous, one-shot games — that their decisions are not completely opaque to other players; this "translucency" of decisions makes them reluctant to defect (Reference Capraro and HalpernCapraroHalpern, 2015, Reference Halpern and PassHalpernPass, 2018).
While the precise nature of these reported heuristics vary, and are to some extent determined by the experimental paradigm adopted (e.g., the equality heuristic can’t be used in a binary choice Prisoners’ Dilemma as there is no endowment), they are broadly equivalent from a mindreading perspective in that the decision maker does not give any conscious consideration to the specific intentions of his/her partner(s) in the context of the experimental game being played. Rather, some intuitive response that has been honed by repeated experiences in everyday life — for example, the fact that cooperation generally leads to favourable long-term outcomes (at least for participants from developed, western nations) (Reference Rand, Peysakhovich, Kraft-Todd, Newman, Wurzbacher, Nowak and GreeneRand et al., 2014); or that a reputation for stinginess can be harmful (Reference Capraro, Jordan and RandCapraro et al., 2014); or that it’s generally safest to assume that our decisions and actions are not completely private (CapraroHalpern, 2015) — leads to decisions that systematically diverge from the predictions of payoff-based models in which participants’ decisions are reached via explicit mindreading processes.
Some of the models outlined above (whether labelled "dual process" or otherwise) contemplate that these heuristic strategies exist alongside strategies that involve more deliberation, and that participants can move between them. In Rand and colleagues’ work, this involves participants shifting from intuitive cooperation (which involves an assumption about how the other is likely to behave without any explicit mindreading) to a "rational", self-maximising strategy that involves explicit, payoff-based mindreading when they are given more time to deliberate, or when they have more experience with social dilemma games (Reference RandRand, 2018). In Reference Evans and Krueger(EvansKrueger, 2011), participants shift from an egocentric heuristic of focussing solely on their own potential outcomes to assessing the other player’s incentives (i.e., explicit mindreading) only when the risk of trusting is sufficiently low.
In this way, these models extend the range of possible mindreading strategies beyond the type of explicit mindreading implied by models based on game theory and social preferences. For example, a dual process model can describe two of Alice’s available strategies for resolving the stag hunt above; either blindly pursuing the stag and assuming that Bob will join her based on previous experiences, or carefully assessing his incentives (i.e., the presence or absence of a hare in the environment) in order to infer his likely action, and choosing an optimal response. However, they don’t capture the full range of information that is available in many joint action endeavours (i.e., signals and reliability information in addition to payoffs), nor do they involve intermediate levels of mindreading between strategies involving no context-specific mindreading at all, and strategies involving explicit deliberation on the other’s likely choice based on payoff incentives.
1.3.4 Level-k reasoning and related hierarchical models
In contrast to much of the work discussed above, level-k models contemplate a hierarchy of strategies for reasoning about the intentions of others in social dilemma games, and investigate how these strategies might be distributed across participants (Reference Stahl and WilsonStahlWilson, 1994, Reference Stahl and WilsonStahlWilson, 1995). The essence of level-k models is that players maximise their own payoffs by doing one additional inferential step beyond what they assume their partner in the game is doing. A level-k model might specify that a level 0 player doesn’t consider the intentions of the other player at all, and simply makes a random choice. A level 1 player assumes that her partner is choosing randomly, and responds optimally (from an individualistic, payoff-maximising perspective) to a random choice. A level 2 player assumes that she is playing with a level 1 player and responds optimally to the optimal response to random choice. And so on.Footnote 2 Work in this area suggests that human reasoning tends to be restricted to one or two levels of strategic depth (Reference Camerer, Ho and ChongCamerer et al., 2004, Reference ColmanColman, 2003b, StahlWilson, 1995, Reference Zhang and HeddenZhangHedden, 2003), perhaps reflecting "bounded reasoning", a result of the limitations of human cognitive capacity (Reference SimonSimon, 1957). Cognitive hierarchy models extend level-k models by allowing for players at level 2 and above to best respond to some distribution of players across lower levels (Reference Camerer, Ho and ChongCamerer et al., 2004) Footnote 3.
However, these models generally assume that participants are rational in the game-theoretic sense (i.e., they seek only to maximise their own payoffs and assume that others are doing the same; see Reference Crawford, Costa-Gomes and Iriberri(Crawford et al., 2013)). As a result, the mindreading in these models is focussed on how participants think other participants are going to respond to payoff incentives. While signals can also play a role in level-k models, there is no scope in any of the models that we are aware of for interaction between signals and the apparent reliability of the person sending them (Reference Crawford, Costa-Gomes and IriberriCrawford et al., 2013).
Hedden and Zhang take an approach similar to level-k models in their analysis of sequential move games, but their model considers mindreading processes even more explicitly (HeddenZhang, 2002, ZhangHedden, 2003). In Zhang and Hedden’s model, level 0 reasoning involves only considering one’s own intentions and desires; level 1 reasoning expands to include the intentions and desires of the other player; and level 2 reasoning accounts for the other player’s anticipation of one’s own intentions and desires (Reference Zhang, Hedden and ChiaZhang et al., 2012).
While Hedden and Zhang’s work does not involve signals or reliability information, their approach can be extended and applied to the stag hunt example above more readily than standard level-k/cognitive hierarchy models can. If Alice were a level 0 hunter, she would simply pursue whichever animal she preferred — presumably the stag, since it is larger and associated with a higher payoff. At level 1, Alice would consider Bob’s signals and assume that they accurately reflect his intentions; if he gazes towards the stag, it is because he intends to hunt it. At level 2 and above, Alice would incorporate Bob’s beliefs about her into her model of his decision process; at this level, she can begin to contemplate the possibility of manipulation and deception (i.e., "Bob is looking at the stag because he believes that I will then choose to hunt it in response").
1.4 The Hierarchical Mindreading Model — a descriptive model of mindreading strategies in the joint action decision process
Drawing on the approaches outlined above, the present paper presents a novel experimental task based on the stag hunt that allows us to investigate the mindreading processes people use when making a decision about joint action participation. We propose that these decisions involve a hierarchy of mindreading processes from no mindreading at all, to implicit mindreading in which inferences about intention are based on automatic processes, to the sort of explicit, proposition-based mindreading that underlies deliberate decision-making strategies (ApperlyButterfill, 2009, Pacherie, 2013, Sebanz et al., 2006). We refer to our system for classifying joint action decision-making strategies based on the type of mindreading they involve as the ’Hierarchical Mindreading Model’ (HMM).
1.4.1 Confusion and random choice — no strategy
In real-world situations like the stag hunt, we assume that most people will be aware when they are facing a decision about whether or not to participate in a joint action. However, there is a substantial body of research indicating that a non-trivial proportion of participants in lab-based social dilemmas are confused by the game they are playing and are thus not capable of making an informed choice about their action (Reference AndreoniAndreoni, 1995, Reference Burton-Chellew and WestBurton-ChellewWest, 2013, Reference Burton-Chellew, El Mouden and WestBurton-Chellew et al., 2016). Inevitably, there will also be some participants who do not pay attention to instructions or become distracted while playing the game. Random choice is the only approach available to these participants.
1.4.2 Level 0 strategies - Unconditional cooperation or unconditional defection
For those who understand that a situation or game involves a choice about participating in a joint action, there are two simple strategies that don’t involve any consideration of the other’s behaviour or an attempt to infer the other’s intention from the available information (i.e., signals, payoffs, and reliability information); either always join, or always defect. The choices of players adopting a Level 0 strategy will thus be invariant to signals, payoffs, and reliability information.
As discussed above, Rand et al.’s social heuristics hypothesis (SHH) (Reference Rand, Peysakhovich, Kraft-Todd, Newman, Wurzbacher, Nowak and GreeneRand et al., 2014) indicates that Level 0 participants from industrialized, western nations will be likely to join (rather than avoid) a collective action like the stag hunt. Similarly, extending the equality heuristic to a context like the stag hunt favours joining a collective action by default as it implies that both participants will be performing the same action. In both cases, there is no role for mindreading specific to a given partner; the decision maker simply assumes that all others cooperate in a situation like the one s/he is facing, and that it is always best to cooperate in response.
1.4.3 Signal-based mindreading — the Level 1 strategy
Where signals from a partner are available to a decision maker, these signals can be used to engage in what we suggest is the simplest form of context-specific mindreading — assuming that the other’s signals accurately represent his/her intentions. This is because signals can be directly linked to inferred actions, and may — depending on the signal type and the potential joint action — even be interpreted as part of the action itself (e.g., one cannot hunt a stag without looking at it; (Reference Downing, Dodds and BrayDowning et al., 2004), Reference Frischen, Bayliss and Tipper(Frischen et al., 2007), (Reference Madden, Ellen and AjzenMadden et al., 1992), (Reference RogersRogers et al., 2014)). Not only do signals convey (apparent) intentions directly, they are also generally accurate (see Reference Levine(Levine, 2014)’s truth-default theory for a recent discussion); our ability to trust that others are actually going to do what they tell us they are going to do is what allows society to function smoothly. They are thus a very good candidate for making a quick assessment of another person’s intentions (Reference Bago, Rand and PennycookBago et al., 2020, Reference Gigerenzer and GoldsteinGigerenzerGoldstein, 1996).
There are two ways in which signals can be used to infer another’s intention. Firstly, the signal can act as a direct predictor of behaviour; e.g., Alice infers that Bob is looking towards the stag because he is about to begin pursuing it, or has actually started to pursue it. Consistent with Reference Apperly and Butterfill(ApperlyButterfill, 2009), we refer to this as implicit Level 1 mindreading because it does not involve inferring behaviour via explicit, proposition-based reasoning about the other’s mental state. Indeed, in the case of gaze signals at least, the process can occur automatically (Downing et al., 2004, Frischen et al., 2007). This type of implicit, signal-based mindreading is widespread and supports completion of everyday joint tasks (like moving an object with another person) efficiently and without a high level of cognitive effort Reference Pacherie(Pacherie, 2013), (Reference Sebanz, Bekkering and KnoblichSebanz et al., 2006).
Alternatively, a signal can be interpreted as an indicator of an unobservable mental state that will cause a future behaviour. This form of mindreading involves an explicit consideration of the other’s intention — similar to the type of mindreading underlying performance in a false belief task (Reference Baron-Cohen, Leslie and FrithBaron-Cohen et al., 1985, Reference Perner and WimmerPernerWimmer, 1985). For example, Alice might reason that "Bob is looking at the stag because he has decided to hunt it, and he will therefore start pursuing it; I will cooperate by joining the hunt too." We refer to this as explicit Level 1 mindreading.
Payoff information cannot be implicitly processed or directly linked to an action in the same way that signals can. In order to infer an action from payoff information, a decision maker must first interpret the possible payoffs from the other’s perspective, compare the different options, and then, given an assumption about the other’s preferences for distribution of the payoffs, infer which option they are likely to choose. This process cannot occur via implicit mindreading and, we suggest, is clearly more cognitively demanding than interpretation of a signal via explicit mindreading (DuffySmith, 2014, Reference Milinski and WedekindMilinskiWedekind, 1998, Rand et al., 2014) — particularly given that participants show a bias for considering their own outcomes rather than those of others (EvansKrueger, 2011, EvansKrueger, 2016).
Assessments of reliability, unlike payoff information, can be processed automatically — see, for example, work on judging others’ trustworthiness based on their appearance (Reference Willis and TodorovWillisTodorov, 2006). However, a judgement that another person is trustworthy or otherwise does not straightforwardly imply anything about their action in a context like the stag hunt (or a social dilemma game). One could postulate a heuristic that untrustworthy others will always defect from joint actions and thus should never be cooperated with. This heuristic could underlie an implicit link between another’s appearance and an inference about their behaviour. However, such a heuristic only makes sense if untrustworthy others are assumed to be competitive, because those who are merely self-interested can be expected to participate in joint actions where mutual cooperation maximises both individual and collective payoffs. Since the literature suggests that a competitive orientation is uncommon both in the lab and the real world (Reference Fiedler, Glöckner, Nicklisch and DickertFiedler et al., 2013, VanLangeKuhlman, 1994, VanLange et al., 2007), we think it unlikely that such a heuristic would be widespread (if it exists at all).
For similar reasons (i.e., that reliability information can’t be directly linked to an action in the way that signals can), we also consider that reliability information alone is unlikely to underlie an explicit mindreading process. Rather, it is more likely to be used to qualify other sources of information; e.g., to judge how likely another person’s signal is to be accurate, or to infer their preferences for distribution of payoffs.
To summarise, then, we propose that when signals are available, they offer the shortest path to a context-specific inference about another person’s intentions, regardless of whether the process is implicit/automatic, or explicit/deliberative. In implicit Level 1 mindreading, a signal is linked to a behaviour without an (explicit) intervening inference about a mental state. In explicit Level 1 mindreading, on the other hand, a signal is used to explicitly infer a mental state, which in turn is used to predict behaviour. This is consistent with level-k models of games with communication, in which Level 0 reasoning is defined as literal interpretation of messages (though compare Reference Ellingsen and Ostling(EllingsenOstling, 2010)).Footnote 4
We have previously suggested that unconditional cooperation and the equality heuristic could be relied upon by participants doing Level 0 mindreading (i.e., not modelling the other’s intentions at all). However, these heuristics could also play a role in Level 1 signal-based mindreading. If they pay attention to signals, those who are inclined to intuitively cooperate or seek to contribute the same amount as others will tend to follow signals by default. Similarly, a belief that decisions are somewhat translucent might lead players to behave in accordance with their own signals (to avoid being labelled as deceptive), and assume that others will do the same (for the same reason).
1.4.4 Signals in context — Level 2 strategies
Beyond Level 1, decision makers consider the possibility that a partner’s apparent intention (as conveyed by their signal) might not accurately indicate their true intention. This could be the result of a mistake (i.e., the other accidentally sending the wrong signal), noise (i.e., the decision maker misinterpreting an accurate signal), or some other cause; but in a social dilemma context, the potential for deception is the most likely reason for a decision maker to consider a possible mismatch between the other’s apparent and true intentions. As any number of authors have noted elsewhere, an ability to condition cooperation on the likely reciprocity of others is an important mechanism for maintaining the sort of joint endeavours that are central to humanity’s success (Reference BrosigBrosig, 2002, Reference FrankFrank, 1988, Frank et al., 1993, Reference Ohtsuki and IwasaOhtsukiIwasa, 2006, Reference Rand and NowakRandNowak, 2013).
Both a partner’s apparent reliability and a game’s payoffs are relevant to assessing the likelihood of deception in a social dilemma. Trustworthy others — as indicated by appearance (Reference Duarte, Siegel and YoungDuarte et al., 2012, Reference Rezlescu, Duchaine, Olivola and ChaterRezlescu et al., 2012, Reference Sparks, Burleigh and BarclaySparks et al., 2017, Reference Stirrat and PerrettStirratPerrett, 2010, Reference TingleyTingley, 2014, Reference van’t Wout and Sanfeyvan ’t WoutSanfey, 2008), past behaviour, and/or reputational information (Reference CamererCamerer, 2011, Milinski, 2002, Reference Sommerfeld, Krambeck, Semmann and MilinskiSommerfeld et al., 2007, Reference Sommerfeld, Krambeck and MilinskiSommerfeld et al., 2008, Reference Wedekind and MilinskiWedekindMilinski, 2000) — can generally be relied upon to act in accordance with their signalled intentions; i.e., they are unlikely to be deceptive. Similarly, signals are more likely to be considered reliable by default in an environment where mutual cooperation produces the best outcome from both an individual and a collective perspective (e.g., in a stag hunt with Assurance Game-type payoffs) than in an environment where deception and defection maximise individual payoffs (e.g., in a stag hunt with Prisoners’ Dilemma-type payoffs) (EllingsenOstling, 2010). The interaction between reliability and payoffs that this implies has been investigated by Boone and colleagues (though their experiments did not involve signals). They find that perceived trustworthiness is important when a game favours defection and deception (because only trustworthy others can be relied on to reciprocate cooperation), but not when a game favours mutual cooperation (because even untrustworthy others are likely to cooperate) (Boone et al., 2008, Boone et al., 2010, Reference Declerck, Boone and KiyonariDeclerck et al., 2010).
The extent to which a Level 2 decision maker relies upon payoffs and trustworthiness to evaluate a partner’s signals will also be influenced by their (the decision maker’s) preferences for how payoffs are distributed. Here, we distinguish two broad payoff-based orientations: a best-response orientation (L2BR), in which the decision maker is focused on maximising her individual payoff, and an other-regarding orientation (L2OR), in which the decision maker places some weight on other participants’ outcomes, consistent with one of the alternative approaches to orthodox game theory outlined in section 1.3.2 above. An L2BR player in a Prisoners’ Dilemma has no need to consider the other player’s reliability once they have observed the game’s payoffs because they know that they are going to defect regardless of what the other does.Footnote 5 A L2OR player in the same game, however, will want to know that her partner is trustworthy before cooperating. In an Assurance Game, where mutual cooperation also maximises individual payoffs, both types of players might be willing to trust a partner’s signals regardless of their apparent reliability.Footnote 6 Consistent with this, (Reference Fiedler, Glöckner, Nicklisch and DickertFiedler et al., 2013) presents evidence on how information search can vary with SVO type.
1.4.5 Summary of the HMM
Putting the above strategies together leads to the following hierarchy of approaches in a context where information about signals, payoffs, and partner reliability are available to decision makers:
-
• Level 0 players will consistently cooperate or defect regardless of the cues and information they receive;
-
• the behaviour of Level 1 players should be influenced only by signals; and
-
• the behaviour of Level 2 players should change predictably in response to changes in signals, environmental incentives, and partner reliability depending on whether they have a best-response or other-regarding orientation.
1.5 Situating the HMM within the literature
The HMM is intended to provide an organising framework for considering how players are likely to use key sources of information in the context of joint action decisions, and to show how different types of mindreading generate different patterns of information use. The model does not describe how information is processed and ultimately leads to a choice; i.e., it is not a cognitive process model. And while we suggest that Levels 0, 1 and 2 in our model involve distinct types of mindreading, we do not rule out the possibility that they could be part of a single decision process (for some examples of single process models of decision making that could complement the HMM, see (EvansKrueger, 2011), Reference Evans and Krueger(EvansKrueger, 2016) and (Reference Glöckner, Hilbig and JekelGlöckner et al., 2014)).Footnote 7
Similarly, the HMM’s levels are not determined by whether participants are using "intuitive" or "deliberative" processes, and the HMM does not purport to be a dual process model. Take Level 0 strategies for example. The essence of a Level 0 strategy in the HMM is not that it’s intuitive or automatic, but that the decision maker does not rely on signals or contextual information (i.e., payoffs or reliability information) to reach an inference about the intentions of their current partner. Thus, a deliberative decision-making process that is invariant to a partner’s signals and apparent reliability, as well as the game’s payoffs, would fall within Level 0 of our model alongside a strategy like the intuitive cooperation described by Rand and colleagues. In addition, we contemplate that automatic and deliberative processes can both be employed within a single strategy. For example, Level 2 mindreading, which we suggest is likely to involve some degree of conscious deliberation (e.g., "Does my partner’s actual intention match her apparent intention?"), may also involve automatic processes (e.g., assessment of trustworthiness based on appearance as per Reference Willis and Todorov(WillisTodorov, 2006)).
Finally, it is important to emphasise that the hierarchy of the HMM’s levels is based on the type of mindreading involved, rather than the complexity of the decision process; there is some overlap across the two concepts, but it is imperfect. For example, while we would claim that the use of trustworthiness and/or payoffs to qualify another person’s signal via a Level 2 strategy is more cognitively demanding than a Level 0 or implicit Level 1 process, it is less clear that the same distinction could be made between an implicit Level 1 strategy (e.g., deciding to participate in a joint action based on automatic following of a gaze signal) and unconditional participation in a joint action pursuant to a Level 0 strategy. The key difference — and the reason we separate Level 0 strategies and implicit Level 1 strategies in our model — is that the Level 1 process involves an implicit inference about the other’s intention based on a cue (i.e., implicit mindreading as per (ApperlyButterfill, 2009)) whereas the Level 0 process does not.
1.6 Experimental design and hypotheses
The experiments we report in this paper were designed to test for evidence of all three levels of mindreading identified in the HMM. To that end, participants played a social dilemma game modelled on the stag hunt scenario outlined above, and were given access to information in the form of signals, payoffs, and cues as to the reliability of their partner. There were two levels to each of these information sources:
-
• signals could be either cooperative (i.e., indicating an intention to hunt the stag) or non-cooperative (i.e., indicating an intention to hunt the hare);
-
• the game’s payoffs could be more favourable to cooperation (i.e., a stag hunt with Assurance Game payoffs, in which the best result from both an individual and a collective perspective was achieved by jointly pursuing the stag) or defection and deception (i.e., a stag hunt with Prisoners’ Dilemma payoffs, in which the best collective result was jointly pursuing the stag, but the best individual result occurred when the decision maker pursued the hare and her partner pursued the stag); and
-
• the decision maker’s partner appeared either trustworthy or untrustworthy.
For practical reasons (primarily the number of trials we were able to run with each participant), only gaze signals were varied within-subjects. It is therefore important to note that while the HMM can make predictions for how signals, payoffs, and partner reliability will be used at the level of individual participants (as set out in section 1.4.5 above), these individual-level predictions are not being directly tested in this paper. Rather, our experimental design means that our hypotheses operate at the level of the sample. The logic of our approach is that a model predicting individual-level effects can also be used to generate meaningful hypotheses about effects at the level of a sample.
Our broad hypothesis was that we would see sample-level effects consistent with all three levels of mindreading identified in the HMM. Specifically, we expected to observe:
-
• Non-zero levels of cooperation even in conditions where the decision maker’s partner signals that they intend to defect. This effect would be consistent with the use of a cooperative Level 0 strategy by some participants, in which decisions are made without engaging in any context-specific mindreading.Footnote 8
-
• A main effect of gaze signals. This effect would be consistent with Level 1 mindreading, pursuant to which participants cooperate in response to cooperative signals and defect in response to non-cooperative signals regardless of the payoff structure of the game they are playing and the apparent reliability of their partner.
-
• An interaction effect between gaze signals and payoffs. This effect would be consistent with the use of Level 2 mindreading. Both L2OR and L2BR players will cooperate in response to cooperative signals with Assurance Game payoffs even where their partner appears untrustworthy as there is no reason for deception in this environment. However, these Level 2 players will defect when they receive cooperative signals from an untrustworthy-looking partner when Prisoners’ Dilemma payoffs are involved because of the risk of deception.
-
• Interaction effects involving gaze signals and partner reliability. A gaze signal by reliability effect would be consistent with Level 2 mindreading by L2OR players who are prosocially motivated and thus willing to cooperate with trustworthy (but not untrustworthy) others who signal cooperatively in a Prisoners’ Dilemma.Footnote 9
2 Method — Experiment 1
2.1 Measures
2.1.1 Signals
Participants received both cooperative and non-cooperative signals from their ostensible partners in two-player economic games. These signals were received from computer-generated (CG) avatars which represented participants’ partners in the game and took the form of gaze cues towards a picture of a stag (cooperative) or a picture of a hare (non-cooperative). Participants were told that their partner had been allocated to a special condition in which their eye movements were tracked while they played, and that the eye movements of the avatars represented the direction in which their partner had gazed just before they made their choice in the game. Participants were shown a picture of what was purported to be another participant using eye-tracking equipment to demonstrate how the process worked.
We chose gaze cues as the signal in our experiment for a couple of reasons. First, it is well-known that gaze cues are interpreted by and direct the attention of a recipient automatically (Reference Friesen and KingstoneFriesenKingstone, 1998, Frischen et al., 2007, Reference ShepherdShepherd, 2010). This makes them more suitable for investigating differences between implicit and explicit processes than (for example) written messages that require some level of conscious processing (e.g., “I intend to cooperate in this game”). Second, using verbal communication would have involved attempting to control for qualities like the voice’s tone.
2.1.2 Payoff environment
We manipulated the nature of the environment between-subjects by having some participants play a game with Prisoners’ Dilemma (PD)-like payoffs, while others played a game in which the payoffs were modelled on an Assurance Game (AG).
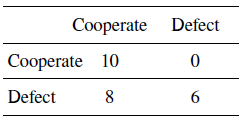
The PD (payoffs shown in Table 1) is the quintessential example of an environment that is not favourable to cooperation because its payoff structure means that both players are incentivised to deceive their partner into cooperating while they themselves intend to defect. This makes the reliability of one’s partner an important consideration for a player who is motivated to achieve the best collective outcome.

The AG (payoffs shown in Table 2) is more favourable to cooperation because mutual cooperation delivers the highest individual payoff to both players. Cooperation is not completely risk-free, however, because cooperating when one’s partner defects still leaves the cooperator empty-handed — the worst possible outcome.
2.1.3 Partner reliability
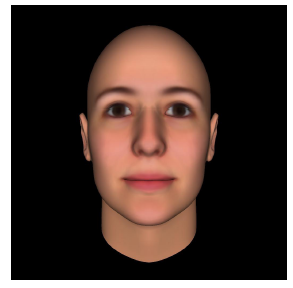
We used the appearance of the CG avatars as a manipulation of partner reliability between-subjects. Todorov and colleagues have developed a system to manipulate computer-generated faces along a number of dimensions such that a face with the same basic features can be manipulated to appear highly trustworthy or untrustworthy (Reference Todorov, Dotsch, Porter, Oosterhof and FalvelloTodorov et al., 2013). Examples of trustworthy and untrustworthy avatars are shown in Figure 1 and Figure 2, respectively.
A trustworthy-looking avatar.
An untrustworthy-looking avatar.

2.2 Experimental procedure
On agreeing to participate in the experiment, participants were asked for basic demographic details, including their level of education, their ethnicity, and whether they had ever studied economics at university level.
Participants began by rating the trustworthiness of a series of CG avatars with neutral expressions taken from a database created by Todorov and colleagues using the FaceGen 3.1 software (Reference Todorov, Dotsch, Porter, Oosterhof and FalvelloTodorov et al., 2013). Participants were either shown versions of the avatars that were manipulated to be highly trustworthy (+3 SD on trustworthiness), or versions that had been manipulated to appear highly untrustworthy (-3 SD). Participants rated the faces on a scale from one (“Not at all trustworthy”) to nine (“Very trustworthy”).
After rating the avatars, participants were given instructions on how to play a social dilemma game; either an Assurance Game (AG) or a Prisoners’ Dilemma (PD). The games were explained to participants in the context of a stag hunt. They were asked to imagine that they were hunting with another participant in a forest, where they could pursue either a stag or a hare. Catching an animal would lead to the participants being granted points. The stag represented the cooperative option; participants were told that both they and the other participant must choose to hunt a stag for it to be successfully captured. Hares, on the other hand, could be successfully hunted by a single participant on his or her own. After reading this description of the game, participants were shown the payoff matrix for the game they had been allocated to and completed a quiz to confirm that they understood its structure. The quiz consisted of four questions along the lines of “If you choose to hunt stag and the other participant chooses to hunt stag, how many points will you receive?” Participants needed to get all four questions right to play the game. If participants got a question wrong, they were shown the payoff matrix again before being asked to make another attempt at the questions. If a participant had still not answered all four questions correctly after 10 attempts, they were allowed to proceed without completing the quiz. The number of quiz attempts taken by participants was recorded.
Participants were informed that their partners in the eye tracking condition had used a response box rather than a mouse to make their selections, such that it was possible for them to gaze at one animal and select the other (i.e., the other participant, who knew that their gaze movements were being tracked, could use their gaze direction deceptively if they wanted to). They were also told that the CG avatar would continue gazing straight ahead if the other participant had not looked towards one of the other options before making their choice. We explained to participants that CG avatars were used rather than actual images of the other participant because we wanted to protect their identities, and to prevent people from making decisions based on age, ethnicity, or gender.
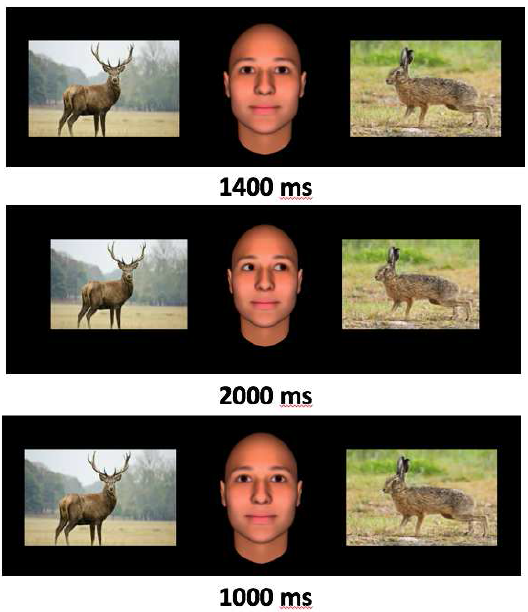
Each participant completed six game trials. In each trial, the participants saw a CG avatar staring straight ahead (i.e., at the participant) for 1400 milliseconds. The avatar then averted its gaze towards the hare, the stag, or remained staring straight ahead for 2000 milliseconds before returning (if it had gazed towards one of the animals) its gaze to the centre for 1000 milliseconds before the participant was asked to choose which animal s/he wanted to hunt. The gaze direction of the CG avatar was counterbalanced across the six trials (i.e., it gazed at the hare twice, the stag twice, and continued to gaze straight ahead twice). The order of the gaze conditions was randomised and the side of the screen on which the two options (hare versus stag) were presented was counterbalanced. Figure 3 shows an example of what participants saw during a game trial.
Stimuli with time of display for a game trial.
After completing the game trials participants were quizzed on their understanding of the purpose of the experiment, before being debriefed on its actual purpose and on the use of deception in the experiment.
2.3 Participants
Participants were recruited via the online platform https://www.microworkers.com/. Participants were told they would be paid a base rate of $USD1.50 for participating and a bonus of $USD0.50 if they accumulated enough points over the game trials. Participants were not told how many points they needed to get the bonus, nor were they updated on how many points they had after each trial. Participants earned between $USD8 and $USD15 per hour depending on how quickly they completed the experiment.
This experiment involved some deception of participants. First, they were not playing with another participant whose eye movements were tracked; the eye movements of the CG faces were generated by the experimenters. Second, they did not need to gain a certain amount of points in the game trials to receive the bonus, and their scores were not tracked; in fact, all participants were paid the base rate plus the bonus. Participants were told about the deception in the debriefing material, and were advised that they could withdraw their results at any time if they wanted to do so. They were also given contact details for counselling services in case the deception had caused them any distress.
3 Results — Experiment 1
All data analysis was undertaken using R version 3.5.1 (R Core Team, 2013). Data cleaning and manipulation was performed using the tidyverse family of packages (Reference WickhamWickham et al., 2019). Plots were made with ggplot2 (Reference WickhamWickham, 2011). Tables were prepared using texreg (Reference LeifeldLeifeld, 2013).
Trials in which participants did not receive a gaze signal (i.e., the CG avatar remained gazing straight ahead) were not analysed because, on reflection, we realised that such signals were potentially ambiguous. We had intended these signals to act as a control condition. However, subsequent to running experiments 1, 2a, and 2b, we realised that these signals could be interpreted as indicating that the other player did not wish to cooperate.Footnote 10 As such, we analysed only participant responses to trials where the avatar either gazed at a stag or gazed at a hare.
3.1 Sample characteristics
A total of 190 participants were recruited for Experiment 1. Average age of participants was 30.8 (SD = 9.2); 48.4% were women; and 74.7% had undertaken some tertiary-level studies. Seven participants failed to correctly complete the quiz within 10 attempts. These participants were retained in the analyses reported below; results of significance tests did not change if they were excluded
3.2 CG avatar ratings
Participants were clearly sensitive to the trustworthiness of the CG avatars. The trustworthy version of each of the six CG avatars used were rated as significantly more trustworthy than the untrustworthy version (all t > 4.0, all p < .001). Overall, trustworthy CG avatars had a mean rating of 6.07 (SD = 1.72) on the trustworthiness scale, compared with 4.73 (SD = 1.71) for untrustworthy CG avatars.
3.3 Choices by condition
The plot in Figure 4 shows the percentage of participants’ choices that were cooperative (i.e., join the stag hunt) grouped by gaze signal, payoff matrix, and CG avatar trustworthiness for each experiment. The two matrices are plotted side by side, while gaze signal (‘Hare’ or ‘Stag’) and CG avatar trustworthiness (‘Trust’ for trustworthy and ‘Untrust’ for untrustworthy) are plotted on the x axis. The labels above each bar give the exact percentage of the cooperation rate for the condition. Error bars give the 95% confidence interval (Reference Clopper and PearsonClopperPearson, 1934).
Cooperation rates by condition in Experiment 1. Results from participants playing the Prisoners’ Dilemma (PD) are shown in the left panel, and Assurance Game (AG) results are shown on the right. Each bar in the plot represents cooperation rates for a unique combination of gaze signal ("Hare" or "Stag") and trustworthiness of other player ("Untrust" or "Trust"). The plots are arranged in accordance with the default levels in the regression model; i.e., the "PD, Hare, Untrust" condition represented by the left-most column in the plot corresponds to the Intercept in the regression model. The coefficient for "Stag gaze" in the regression model represents the difference in cooperation rates between the "PD, Hare, Untrust" condition and the "PD, Stag, Untrust" condition — i.e., the third column from the left in the plot. The coefficient for "AG matrix" in the regression model represents the difference in cooperation rates between the "PD, Hare, Untrust" condition and the "AG, Stag, Untrust" condition — i.e., the fifth column from the left in the plot. And so on.

3.4 Binary logistic regression model
In order to determine the effects of our manipulations, we fit a multi-level binary logistic regression model to each experiment’s results with random slopes and intercepts for the within-subjects variable (gaze signal), and for stimuli across the trustworthy and untrustworthy versions of each cue face (Reference Judd, Westfall and KennyJudd et al., 2012) using the R package lme4 (Reference BatesBates et al., 2018).
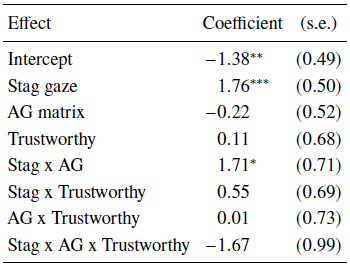
Default factor levels for the regression were the PD matrix, hare gaze signal, and untrustworthy CG face. Results of the regression are shown in Table 3.
*** p <0.001,
** p <0.01,
* p <0.05
In Figure 4, there were non-zero cooperation rates (i.e., joining a stag hunt) in all conditions (all p < .001 with binomial test for proportion of cooperative decisions > 0), including the conditions in which a CG avatar gazed at a hare, suggesting confusion or cooperative Level 0 mindreading strategies (since hunting stag when the other participant hunts hare delivers a payoff of 0 in both payoff matrices).
There were two significant effects in our model: a main effect of gaze signal, and an interaction between gaze signal and matrix.
The main effect of gaze signal indicates that participants were significantly more likely to cooperate (i.e., choose to hunt the stag) when a CG avatar gazed towards the stag than towards the hare. This suggests that Level 1 gaze-following strategies may have been adopted by some participants (see Table 1).
The gaze by matrix interaction indicates that the effect described above was more pronounced in the AG matrix than in the PD matrix. This indicates that some participants used strategies consistent with L2BR mindreading, in which their responses to cooperative signals were moderated by the game’s payoffs.
4 Discussion — Experiment 1
We observed effects consistent with each level of mindreading postulated in the HMM in Experiment 1.
Cooperation in response to non-cooperative signals was consistent with random play by participants who did not understand the game, or a Level 0 strategy that involved cooperation without paying attention to any of the available information sources (i.e., signals, payoffs, and partner reliability).
The positive main effect of cooperative gaze signals indicates that some decision makers used a Level 1 cooperative strategy of following the other’s gaze signal regardless of the game’s payoffs or the other’s apparent reliability. Our observation that this effect of gaze signals was stronger for the AG than for the PD is evidence that some decision makers used a strategy involving Level 2 mindreading, in which payoffs as well as signals were used to infer the other player’s intention and respond accordingly. This type of approach is consistent with a L2BR-type strategy. As there were no interactions involving trustworthiness, we did not observe unique evidence for L2OR-type strategies, in which decision makers were more likely to trust cooperative signals from trustworthy than untrustworthy others.
4.1 Motivation for Experiments 2a-2c
The results of Experiment 1 provided initial support for the HMM and raised issues that called for further testing.
The first was replicability of our results. Given that our experimental method was novel, we wanted to ensure that we could replicate the key effects we observed before drawing any strong conclusions from our results.
The second was concerned with the nature of gaze following in Experiment 1. It can be interpreted as evidence for use of a Level 1 Strategy. However, two interpretive questions arise. If indeed Level 1 mindreading was used, did it involve explicit, proposition-based mindreading or implicit mindreading?
The third was in relation to our failure to observe interactions involving trustworthiness — a hallmark of Level 2 mindreading by those with other-regarding preferences. One possible explanation for this was that our manipulation of partner reliability was not sufficiently strong. Participants knew that the CG avatar was not an actual representation of their partner; thus, we were relying on priming for the appearance of the avatars to have an effect. In retrospect, this was unlikely to have an effect on those using Level 2 mindreading, as this approach to intention inference involves deliberative decision making.
In order to address these issues, we ran three additional experiments.
4.1.1 Experiment 2a
We replicated Experiment 1 to ensure its results could be repeated.
4.1.2 Experiment 2b
In order to investigate the type of mindreading implied by the main effect of gaze sigals in Experiment 1, we ran Experiment 2b, in which participants were told that the gaze signals were meaningless because of an equipment malfunction. That is, we told the participants that the avatar’s gaze direction did not indicate the actual direction of the other participant’s gaze. We considered that continued reliance on these meaningless signals would be evidence for implicit mindreading, whereas a significant reduction in reliance on meaningless gaze signals would imply explicit mindreading.
Rendering signals meaningless also had implications for how we expected Level 2 participants to play. If signals, such as gaze cues, are not available or are meaningless, then mindreading cannot make use of them and payoffs and partner reliability would be expected to influence behaviour directly (rather than by qualifying the effect of signals). Further, the lack of signals was likely to magnify the risk of cooperation for Level 2 mindreaders. In both the AG and the PD, cooperative choices involve the risk of being left empty-handed if one’s partner defects. It is well established that cooperative signals in these games help participants to overcome their aversion to this risk, and for this reason we expected Level 2 players to generally play in a payoff-maximising rather than risk-dominant way (EllingsenOstling, 2010, Sally, 1995) in Experiment 1 and its replication. Without these signals, however, Level 2 participants did not have the additional reassurance that their partner was focussed on the same opportunity that they were (i.e., maximising their collective and/or individual gains as opposed to avoiding risk). As a result, risk-averse Level 2 mindreaders who were willing to cooperate when signals were available may now defect, leading to lower cooperation rates even when payoffs favour cooperation (i.e., in the AG). On the other hand, we expected decision makers relying on Level 0 and Level 1 (implicit) mindreading to play in the same way as they did in Experiment 1.
Although we suspected our trustworthiness manipulation was weak in Experiment 1, we retained it in Experiment 2b because the relative importance of trustworthiness may have been increased in the absence of meaningful signals.
4.1.3 Experiment 2c
In Experiment 2c, we strengthened our trustworthiness manipulation by giving participants information about their prospective partner’s behavior in line with the avatar’s appearance. That is, we told participants that untrustworthy-looking others had often defected after signalling they would cooperate, while trustworthy-looking others generally played in line with their signals. This manipulation had implications for how we expected Level 2 players to play in both game types.
In previous experiments, we expected that both L2OR and L2BR players would assume that others would play in line with their signals in the AG regardless of their apparent reliability, because mutual cooperation maximised individual outcomes and thus the other player did not have to be trustworthy in order for their cooperative signal to be reliable. In Experiment 2c, however, this assumption was undermined by information that untrustworthy-looking others had defected after signalling cooperatively in past games in the AG. We thus expected that both L2OR and L2BR players would only cooperate with trustworthy others in the AG.
In the PD, our expectations remained the same; L2OR players would rely on both signals and partner reliability in order to determine who they could trust to be reciprocally cooperative, while L2BR players would defect regardless. Modelling these patterns of play leads to a significant interaction between signals and trustworthiness (reflecting L2OR conditional cooperation with trustworthy others in the PD), and a three-way interaction between signals, payoffs, and trustworthiness (reflecting cooperation with trustworthy others only in the AG by Level 2 players of both preference types).
In Experiment 2c we also sought to gather some initial evidence for our claim that Level 2 strategies are more cognitively demanding than Level 0 and implicit Level 1 strategies. A number of authors have presented evidence that more complex strategies in resolutions of social dilemmas and other games (e.g., trust games) are more cognitively demanding; and/or that certain types of cues are more demanding to process than others (EvansKrueger, 2011, Fiedler et al., 2013, Rand et al., 2012, Reference Spiliopoulos, Ortmann and ZhangSpiliopoulos et al., 2018). In a similar vein, we consider that Level 2 strategies, in particular, will require more of participants’ cognitive resources than Level 0 and implicit Level 1 strategies. Thus, we expect that placing participants under a cognitive load is likely to reduce the amount of Level 2 play, and increase the amount of Level 0 and Level 1 strategies adopted.
5 Method — Experiments 2a-2c
5.1 Experiments 2a and 2b
These experiments were run together, with respondents randomly allocated to either a replication of Experiment 1 (experiment 2a) or the meaningless gaze experiment (Experiment 2b).
The procedure for Experiment m2b replicated Experiment 1, with one change; after the instructions had been given and the quiz completed, participants saw an additional screen on which they were warned that there had been a technical issue with the eye-tracking equipment. The effect of the purported technical issue was that the gaze direction of the cue faces was not necessarily indicative of where the other participant had been looking when they made their choice. The text of the warning message was as follows:
"Warning!
Technical issue with eye-tracking equipment!
Since this Experiment was placed online, it has come to our attention that the equipment we used to track participants’ eye movements was not working properly. This means that the gaze direction of the computer-generated faces has no relationship with where the other participant looked. In other words, observing the gaze of the computer-generated face does NOT allow you to guess where the other participant was looking when he or she made his or her choice. We apologise for the malfunction. Because the game may be more difficult without accurate gaze cues, the amount of points you need to gain to receive the bonus payment has been adjusted. Please click ’Next’ to begin the experiment."
As a manipulation check, participants in this Experiment were asked whether they believed that the eye movements of the CG avatars accurately represented the eye movements of the other participant after the game trials were complete. Participants were analysed according to their reported beliefs about gaze cue meaningfulness in the results below.
After the game trials were done, participants were also asked to complete a nine-item measure of social value orientation (Reference McClintock and AllisonMcClintockAllison, 1989, VanLangeKuhlman, 1994) and the three-question cognitive reflection test (Reference FrederickFrederick, 2005).
5.2 Experiment 2c
In the reliability information experiment, there were several changes to the procedure. First, participants were no longer asked to rate the trustworthiness of CG avatars prior to beginning the game trials. Second, the condition in which participants did not receive a gaze signal (i.e., the CG avatar continued gazing straight ahead) was removed and the overall number of game trials was increased to eight (with the direction of the CG avatars’ gaze and the side on which the stag/hare were presented continuing to be counterbalanced and presented in random order). Third, we included conditions to explore our ability to manipulate participants’ level of mindreading; a cognitive load condition, in which they were asked to remember a seven-digit number while they made their choice, and a reflection/mindreading prompt condition, in which they were reminded that their payoff would be affected by both their choice and the other’s choice.Footnote 11 Finally, participants were given information about how their ostensible partner had played in their seven other gamesFootnote 12 (i.e., all the games they’d played other than the current one with the participant), as per the screen shot in Figure 5.
Screenshot from Experiment 2c.
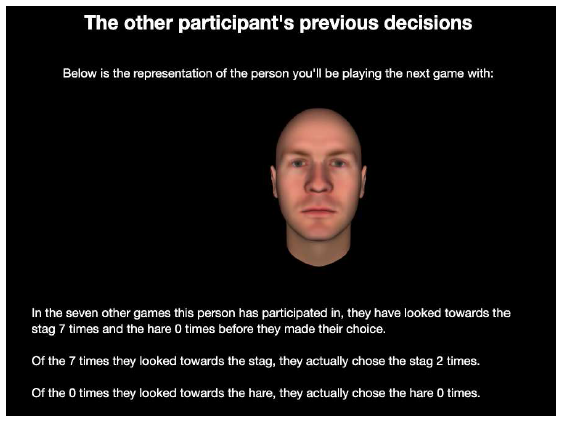
The reliability information was varied such that participants did not see the same information being presented in each trial. Two aspects of the information were varied; the number of times the partner had gazed at the stag/hare, and the number of times they had actually chosen the stag/hare.
Participants were told that their partner had gazed towards the stag either five, six, or seven times in their seven other games (this is described as the ‘nStagGaze’ number in what follows). Each possible nStagGaze number had a probability of 0.33 of being drawn on any given trial. The number of times the partner had gazed towards the hare was then given by 7−nStagGaze.
The number of times the partner had actually chosen the stag (the ‘nStagChoice’ number) in any given trial then depended on both the trustworthiness of the CG avatar and random variation as per Table 4.
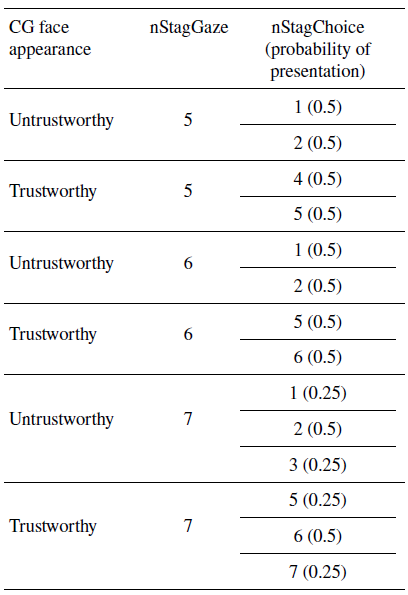
The number of times the partner had chosen the hare always matched the number of times they had gazed at it (i.e., participants were never told that their partner had previously gazed at the hare and then chosen the stag option).
The reliability information was thus in line with the trustworthiness of the CG face; trustworthy-looking cue faces generally chose the option they looked towards, while untrustworthy-looking cue faces frequently looked towards the stag but then chose the hare.
5.3 Participant recruitment and payment
For experiments 2a and 2b, participants were recruited via the online platform Microworkers (www.microworkers.com). Due to slow recruitment through Microworkers, participants in Experiment 2c were recruited via Amazon’s MTurk (www.mturk.com).
In experiments 2a and 2b, the base payment was $USD1.50 with a bonus of $USD0.30, while in Experiment 2c (which involved more trials), the base rate was $USD1.20 with a bonus of $USD0.80. Participants always earned the bonus in each of the experiments. As in Experiment 1, participants earned between $USD8 and $USD15 per hour in each of the follow-up experiments.
6 Results — Experiments 2a-2c
The figures and tables for experiments 2a-2c are presented with Experiment 1 results repeated for ease of comparison.
6.1 Inclusion of measures
As our measurements of participants’ SVO and CRT performance were exploratory and not consistent across all of our experiments, they are not reported below.
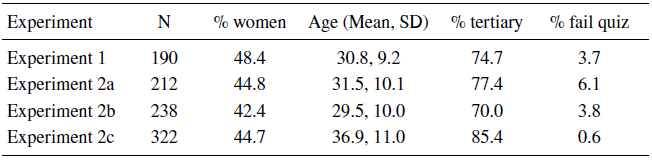
6.2 Participant characteristics
Table 5 below summarises the sample characteristics for each experiment. The ‘% tertiary’ column indicates the percentage of participants who indicated that they had done at least some university-level study. The ‘% fail quiz’ column indicates the percentage of participants who were allowed to proceed with the experiment despite not answering the payoff quiz correctly in 10 attempts.
6.3 CG avatar trustworthiness
Participants were clearly sensitive to the trustworthiness of the CG avatars across the experiments. Across all of the experiments where ratings were collected, the trustworthy version of each of the six CG avatars used were rated as significantly more trustworthy than the untrustworthy version (all t > 4.0, all p < .001). Overall, trustworthy CG avatars had a mean rating of 6.02 (SD = 1.70) on the trustworthiness scale, compared with 4.94 (SD = 1.69) for untrustworthy CG avatars.
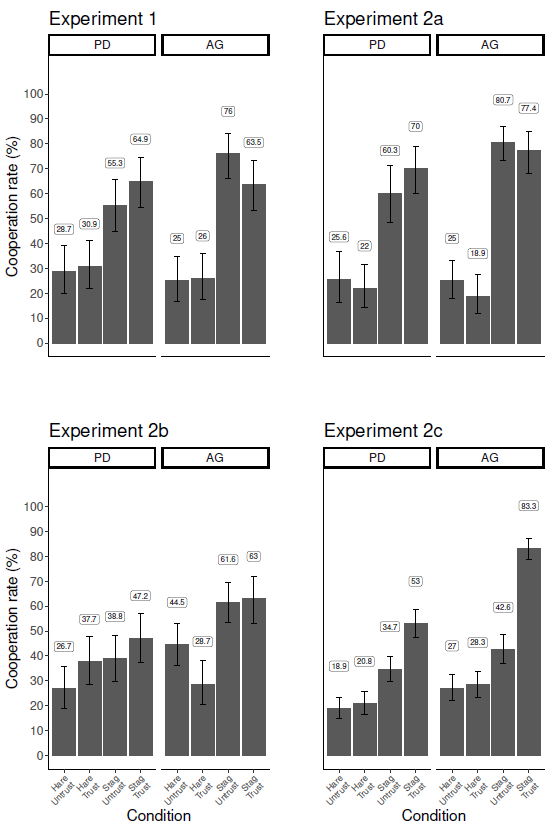
6.4 Cooperation rates
The plots in Figure 6 show the percentage of participants’ choices that were cooperative grouped by gaze signal, payoff matrix, and CG avatar trustworthiness for each experiment. The two matrices are plotted side by side, while gaze signal (‘Hare’ or ‘Stag’) and CG avatar trustworthiness (‘Trust’ for trustworthy and ‘Untrust’ for untrustworthy) are plotted on the x axis. The labels above each bar give the exact percentage of the cooperation rate for the condition. Error bars give the 95% confidence interval (ClopperPearson, 1934). The two conditions of Experiment 2c (cognitive load and reflection/mindreading prompt) are reported together in this plot and in the regression table for simplicity and ease of comparison across experiments. Comparison of these two conditions is discussed below in section 6.6.3.
Cooperation rates by condition — all experiments. In each of the four plots, results from participants playing the Prisoners’ Dilemma (PD) are shown on the left and Assurance Game (AG) results on the right. Each bar represents cooperation rates for a unique combination of gaze signal ("Hare" or "Stag") and trustworthiness of other player ("Untrust" or "Trust"). The plots are arranged in accordance with the default levels in the regression model; i.e., the "PD, Hare, Untrust" condition represented by the left-most column corresponds to the Intercept in the regression model. The coefficient for "Stag gaze" in the model represents the difference in cooperation rates between the "PD, Hare, Untrust" condition and the "PD, Stag, Untrust" condition — i.e., the third column from the left. The coefficient for "AG matrix" in the model represents the difference in cooperation rates between the "PD, Hare, Untrust" condition and the "AG, Stag, Untrust" condition — i.e., the fifth column from the left. And so on.
6.5 Binary logistic regression model
In order to determine the effects of our manipulations, we fit the same multi-level binary logistic regression model used for Experiment 1’s results to each follow-up experiment’s results (Reference BatesBates et al., 2018).
As in the Experiment 1 analysis, default factor levels for the regressions were the PD matrix, hare gaze signal, and untrustworthy CG face. Results of the regressions are shown in Table 6.

*** p<0.001,
** p<0.01,
* p<0.05
6.6 Model summaries
6.6.1 Experiment 2a
Results of experiments 1 and its replication (experiment 2a) were very similar, with the same pattern of significant coefficients.
6.6.2 Experiment 2b
As in experiments 1 and 2a, there was a significant effect of gaze signal in Experiment 2b. This indicated that a significant proportion of participants continued to rely on gaze signals even though they had been told that the signals were meaningless. If the gaze effect included both explicit and implicit Level 1 mindreaders in Experiment 2a (where signals were meaningful), but only implicit Level 1 mindreaders in Experiment 2b, the gaze effect would be greater in Experiment 2a than in Experiment 2b. To test this, we fit an additional cross-experiment model comparing the results of experiments 2a and 2b (note that there was random allocation of participants to these two experiments). This model included an effect of gaze signal meaningfulness (with meaningless signals as the default level). There was a significant, positive, two-way effect of gaze signal by meaningfulness (Beta = 1.47, standard error = 0.70, p = .036), indicating that participants were more likely to respond to cooperative gaze signals when they were meaningful than when they were meaningless.
There was a significant effect of matrix, suggesting that some participants were more willing to cooperate in the AG than in the PD. There was also a negative two-way interaction effect of matrix and trustworthiness. This indicates that participants’ cooperation rates increased more in response to a trustworthy cue face in the PD matrix than in the AG matrix (bearing in mind that the hare signal was meaningless). Footnote 13
6.6.3 Experiment 2c
Once again, there was a simple main effect of gaze signal, indicating that a significant proportion of participants continued to respond to cooperative gaze signals from untrustworthy CG avatars in the PD even when they were told that the other player had frequently defected in previous games.
In addition, there were two higher-order effects involving trustworthiness that were consistent with Level 2 mindreading. A positive, two-way interaction effect of gaze by trustworthiness indicates that, given a cooperative signal in the PD matrix, participants were significantly more likely to cooperate with trustworthy others than with untrustworthy others. This is consistent with decision making by L2OR players who were willing to cooperate in a PD as long as they were confident that the other player’s signals were reliable. There was also a positive, three-way interaction involving all three factors, indicating that the effect of trustworthiness given a cooperative gaze signal was stronger in the AG than in the PD. This is indicative of L2BR (in addition to L2OR) players conditionally cooperating in the AG.Footnote 14
When the cognitive load and reflection/mindreading prompt conditions within Experiment 2c were compared, there were no significant interactions indicating a clear difference in the strategies adopted by participants across the two conditions. This was despite the fact that participants generally complied with instructions in the cognitive load condition; participants reported the correct seven-digit number in 84% of trials. Cooperation rates by condition and the full model with cross-condition effects are shown in Appendix 8.3 for completeness).
6.6.4 Non-zero cooperation in hare gaze conditions
Finally, in both experiments 2a and 2c (where signals were meaningful) we again observed non-zero rates of cooperation in all hare gaze conditions (all p < .001 with binomial test for proportion of cooperative decisions > 0).
7 Discussion — Experiments 2a-2c
We again observed effects consistent with each level of mindreading postulated by the HMM. The cooperation in response to non-cooperative signals was consistent with random play by participants who did not understand the game, or a Level 0 strategy of unconditional cooperation. That this phenomenon was observed in all experiments suggests its robustness.
Similarly, we saw a main effect of gaze signals in all experiments. This is consistent with Level 1 play by participants who simply followed their partners’ signals regardless of payoffs and partner reliability. We continued to observe this effect even when participants were told that signals were meaningless (experiment 2b), and when participants were told that the other player had frequently failed to act in accordance with his/her cooperative signals (experiment 2c, untrustworthy CG avatar conditions). This strongly suggests that some participants were engaged in Level 1 implicit mindreading.
On the other hand, the attenuated effect of gaze signals in Experiment 2b compared with its replication indicates that some Level 1 mindreading was explicit, and that some players may have switched to Level 2 strategies when they were told that the signals were meaningless or that they were unlikely to actually reflect the other player’s intention.
We also observed patterns of cooperation consistent with Level 2 mindreading, including effects that suggested L2OR play. Experiment 2a replicated the findings of Experiment 1 and, in particular, found evidence for an interaction between gaze and payoff matrix. The use of an L2BR-type strategy can explain this result, with participants adjusting their response to their partners’ signals according to the environmental incentives. However, as in Experiment 1, there was no clear evidence for L2OR conditional cooperation as there were no interactions involving trustworthiness.
In Experiment 2b, where gaze signals were meaningless, we observed a different pattern of results, consistent with Level 2 participants ignoring gaze signals and relying solely on payoffs and trustworthiness to make decisions about participation in the joint action. In particular, in the absence of meaningful signals, we saw a main effect of payoff matrix, indicating that participants were more likely to cooperate in the favourable AG environment than in the PD. We also saw an interaction between payoffs and trustworthiness. This effect was indicative of L2OR players being willing to cooperate in a PD provided they were comfortable with the trustworthiness of their partner in the game.
Finally, in Experiment 2c, where additional information regarding the trustworthiness was provided and no attempt was made to discredit gaze signals, we saw a two-way interaction between gaze signal and trustworthiness/reliability, and a three-way interaction between gaze, trustworthiness/reliability and payoffs. Together, these effects are consistent with L2OR and L2BR players conditionally cooperating with reliable others and seeking to maximise payoffs respectively. The two-way effect was likely driven by L2OR players who were willing to cooperate in response to cooperative signals in the PD where the other player both looked trustworthy, and had behaved reliably in the past, but not with untrustworthy/unreliable others in that game. The three-way interaction reflects that both L2OR and L2BR players were willing to cooperate with trustworthy/reliable, but not untrustworthy/unreliable, others in the AG.
Experiment 2c also tested for evidence that Level 2 mindreading is more cognitively demanding than lower-level mindreading by including a cognitive load and a reflection/mindreading prompt condition. However, there was no clear evidence for a reduction in Level 2 mindreading across the conditions. Results, however, were in the expected direction; in the cognitive load condition there was a greater reliance on signals, and the size of the three-way interaction between signals, payoffs, and reliability was substantially (though not significantly) reduced (see Appendix 8.3).
8 General discussion
Across four studies involving 962 participants, we found consistent evidence in support of the Hierarchical Mindreading Model. In each of our three unique studies, we observed effects consistent with participants engaging in Level 0, Level 1, and Level 2 mindreading.
We believe that this contributes to existing work in the economic games literature in a number of ways. First, it demonstrates the need for a hierarchy of strategies with at least three levels of mindreading; any model that proposes strategies implementing just one type of mindreading process, or a dual process mechanism, is likely to be mischaracterising a substantial proportion of participants. Second, we demonstrate how the availability and evidential value of different types of cues (i.e., signals, payoffs, and reliability information) in an experimental context affects the inferences that can be made about the strategies and types of mindreading being employed by participants. For example, by including a condition in which signals were invalid, we were able to observe evidence for a strategy involving implicit reliance on gaze signals — a strategy which, to our knowledge, has not been reported elsewhere. Finally, we show that even for participants relying on similar types of mindreading (e.g., Level 2 mindreading in our model), there can be a range of different strategies adopted in social dilemma resolution. Our work indicates that participants in social dilemmas engage in multiple forms of mindreading, ranging from none at all, or fast, implicit judgements about their partner’s intention, through to explicit mindreading processes involving multiple types of social cues. To understand social dilemma resolution and joint action processes more generally, this full range of strategies and mindreading types needs to be considered.
As we set out in our introduction, we are far from the first researchers to consider the possibility that participants employ different strategies in social dilemma games, and our model draws on existing work from a number of authors. The work of Rand and colleagues (Rand et al., 2012, Rand et al., 2014) gained prominence by applying a dual process approach to social dilemma decision making. A number of authors have stressed the need to consider the decision strategies that might be employed by participants who do not understand the game they are playing in addition to those who are playing rationally (Andreoni, 1995, Burton-Chellew et al., 2016, Reference Goeschl and LohseGoeschlLohse, 2018, Reference Recalde, Riedl and VesterlundRecalde et al., 2018); others have identified the use of decision heuristics that are consistent across games (Reference Capraro, Jordan and RandCapraro et al., 2014). Reference Poncela-Casasnovas(Poncela-Casasnovas et al., 2016) identified five (non-hierarchical) strategies (including random play) that were consistent across different types of social dilemma games within participants; these strategies showed strong overlap with social value orientation types. And level-k theorists have been taking a hierarchical approach to modelling choices in social dilemmas since the mid-90s. However, we think that our model is a useful addition to the literature because it is able to illustrate links between different models and strategies by situating them within a broader framework that emphasises the role of mindreading and the diversity of ways in which it can be deployed.
Dual process models focus on the two extremes of the mindreading hierarchy – very simple decision strategies that do not involve signal- or context-specific mindreading at one end, and rational, highly deliberative strategies that involve explicit mindreading at the other – while potentially ignoring strategies between and within these levels. For example, Reference Rand, Greene and Nowak(Rand et al., 2012) categorise participants as either intuitive cooperators or rationally individualistic (equivalent to our L2BR players). One reason for this may be their experimental design. In much of the social dilemma dual process literature, participants play an n-person PD in which they do not receive signals from, or reliability information about, the other players (Reference RandRand, 2017). This limits participants’ mindreading strategies to inferring other players’ likely choices from the game’s payoffs alone. Our richer experimental paradigm enabled us to observe not only a greater range of strategies, but also to investigate the full complexity of deliberative decision making involving the integration of multiple sources of information (Reference SkyrmsSkyrms, 2001, Reference RousseauRousseau, 2018, Reference SkyrmsSkyrms, 2004).
Similar limitations apply to the majority of the level-k literature. While these models contemplate the possibility of a broader strategic hierarchy than dual process models, participants at each level of the hierarchy (beyond level 0) are relying on the same information (payoffs) with the same goal (maximising their individual return). While some level-k models investigate a role for signals (EllingsenOstling, 2010), the level-k literature does not consider a role for partner reliability in social dilemma decision making (though see Reference Hedden and Zhang(HeddenZhang, 2002) for an extension). Recent work applying accumulation models to social dilemmas is also focussed on how participants process payoffs only, without accounting for signals or reliability (Reference Golman, Bhatia and KaneGolman et al., 2019, Reference Stewart, Gachter, Noguchi and MullettStewart et al., 2016).
Our work goes beyond this by emphasising the need to consider factors other than payoffs, how these factors might interact with each other, and the extent to which social value orientation can influence the decision-making process (though note that (Reference Golman, Bhatia and KaneGolman et al., 2019) explicitly acknowledge the need to include social preferences in future versions of their model).
Consistent with a number of authors, we have also observed evidence that participants are able to move from one level in the decision-making hierarchy to another (Reference Bhatt and CamererBhattCamerer, 2005, Reference Hyndman, Terracol and VaksmannHyndman et al., 2013, Rand et al., 2012, Yoshida et al., 2010). Rand and colleagues suggest that participants who are prompted to think more carefully about their decisions may switch from intuitive cooperation to a more deliberative individualism. In our studies, we found that the effect of cooperative gaze signals from untrustworthy-looking others in the PD was reduced when participants were told that signals were meaningless. However, we failed to observe clear evidence that participants in a cognitive load condition, compared with those who were reminded that their outcome depended on their partner’s choice as well as their own, shifted to using simpler mindreading strategies. One obvious reason for this is that the key effect we were looking for was a four-way interaction (i.e., that the three-way interaction between signals, payoffs, and reliability was significantly smaller in the cognitive load condition); even with our fairly large sample sizes we needed quite a large effect for this to be significant. Thus, given that our result was in the expected direction (with an observed p value of .08), we do not find this null result particularly surprising, but acknowledge that more investigation is required in order to clearly demonstrate our claim that strategies involving Level 2 mindreading are more cognitively demanding than strategies involving Level 0 or implicit Level 1 mindreading.
An additional contribution of our work is its investigation of a role for implicit mindreading in social dilemma decision making. We found that a significant proportion of participants continued to follow gaze signals from other players represented by an untrustworthy-looking avatar in a PD game, even when they were instructed that the signals were meaningless, or given information which indicated that the signals were likely to be deceptive. We suggest that this is consistent with the type of implicit mindreading processes identified and discussed by authors including (ApperlyButterfill, 2009) and (Reference PacheriePacherie, 2013). To our knowledge, this is the first time that evidence of implicit mindreading in social dilemma games has been reported.
8.1 The HMM and decision processes
As we’ve previously indicated, the HMM is not a decision process model and the levels within it do not directly imply anything about the complexity or nature of the decision process involved (e.g., whether the processes involved are automatic or deliberative). Rather, we consider the HMM to be complementary to existing models of decision processes that have been, or could be, applied to joint action participation and social dilemma games.
For example, Evans and Krueger provide evidence that participants in trust games exhibit a hierarchical decision process in which they first evaluate their own risks and benefits, and only consider the other player’s incentive to defect if they need more evidence for their decision (c.f. the effect of trustworthiness being moderated by the payoff environment); the authors suggest that the reason for this is the demanding nature of perspective-taking (EvansKrueger, 2011, Reference Evans and KruegerEvansKrueger, 2014, EvansKrueger, 2016). They suggest that "errors" occur in this process when decision makers rely on easy-to-process cues and neglect cues that are valid but more difficult to process (EvansKrueger, 2016). There is an obvious parallel here with decision makers assuming that cooperative signals are honest (i.e., Level 1 mindreading) while neglecting to consider whether the person sending the signal might have an incentive to defect.
Similarly, at Level 2, some participants might conditionally cooperate via a hierarchical decision process which proceeds thus:
-
1. Check whether the other’s signals is cooperative. If uncooperative, defect; if cooperative, proceed to next step.
-
2. Assess whether the payoff matrix creates any incentive for the other to defect. If no incentive to defect, cooperate in response; if there is an incentive to defect, proceed to next step.
-
3. Assess information about the partner’s reliability. If partner appears reliable, cooperate; if partner appears unreliable, defect.
(Reference Glöckner, Hilbig and JekelGlöckner et al., 2014) and (Reference Jekel, Glöckner and BröderJekel et al., 2018) also propose a model which could be adapted to cover a decision process in a paradigm like ours. On their approach, participants might exhibit different sensitivities to different types of cues, with subsequent information search being influenced by the valence of information already considered and whether a decision threshold has been reached. The HMM suggests that signals are likely to be the most accessible cue for most participants, and thus likely to be searched first. A Level 1 decision maker would be someone who weights signals heavily relative to other cues and thus generally does not perform any additional information search after viewing a signal, while Level 2 decision makers would place less weight on signals such that additional information is necessary before a decision can be reached. In a similar vein, (Reference Fiedler, Glöckner, Nicklisch and DickertFiedler et al., 2013) present evidence that prosocial and individualistic decision makers don’t use qualitatively different strategies to reach their decisions, but rather show consistent differences in how they search available information.Footnote 15.
8.2 Limitations
There are a number of limitations to acknowledge in the studies we have reported here.
Firstly, while our model describes behaviour at the level of the person (i.e., we suggest that individuals will tend to utilise a particular level of mindreading across joint action decisions), our analyses occur at the level of decisions (i.e., across all of the choices in an experiment, we report observing (for example) a tendency to follow gaze signals). This approach to the analysis was necessary because individual participants didn’t complete trials across enough different conditions for us to distinguish between all of our mindreading levels at the level of the person. Cue face trustworthiness and game type were varied between-subjects, while only signals were varied within-subjects. We adopted this approach because we were concerned that manipulating too many variables within a relatively small number of trials would confuse participants and introduce a lot of noise into our results (e.g., they would forget which game they were playing in a particular trials).Footnote 16
This limitation of our analysis makes our inference less direct than it would be if we had fit individual choices to our model. However, we think our inference remains valid, particularly when it is considered in the context of other work demonstrating that participants employ strategies consistently across trials (Capraro et al., 2014, Poncela-Casasnovas et al., 2016). We were also able to observe consistency at the level of individuals in terms of cooperating across all trials (75 participants or 7.8% of the total sample chose to cooperate (hunt the stag) in all of their trials), and in terms of Level 1 signal following (223 participants or 23.2% of the total sample followed the CG avatar’s gaze signal in all of their trials). Nonetheless, we plan to conduct follow-up work in which signals, payoffs, and reliability information are varied within each participant so that we can do our analysis at the person level, consistent with our model.
Secondly, a common approach to investigating the cognitive complexity of strategies in the context of economic games is to measure, or limit, participants’ response times, with the broad hypothesis being that participants employing more cognitively-demanding strategies will tend to be slower to make their decisions (see, e.g., (Reference Rand, Greene and NowakRand et al., 2012), (Reference Spiliopoulos, Ortmann and ZhangSpiliopoulos et al., 2018), though note (Reference Evans, Dillon and RandEvans et al., 2015) and Reference Evans and Rand(EvansRand, 2019), which suggest that decision conflict is what primarily drives reaction times). Being able to present response-time analyses showing that participants employing Level 2 mindreading strategies (i.e., combining signals with payoffs and/or reliability information) tended to be slower to make their choices would thus have been useful convergent evidence for our model. Because of our inability to model Level 2 strategies at the level of the individual as discussed above, we were unable to use this analysis strategy. In addition, our experimental method is not well-suited to response time analysis because participants must wait until the gaze signal is complete — that is, until the avatar has gazed at one of the options then returned its gaze to straight ahead for 1000 milliseconds — until they can make their decision. In future work we plan to include experiments that yield useful response-time data to complement participants’ decisions.
Thirdly, the lack of clear evidence that fewer participants employed Level 2 strategies in the cognitive load condition of Experiment 2c is somewhat surprising. Further work with the present experimental paradigm (with even larger sample sizes, given that the key effect involves a four-way interaction) is required to clarify how cognitively demanding different types of mindreading are relative to each other. The use of response times (as noted above) will also be an important aspect of elucidating the relative complexity of the types of mindreading identified in our model.
Finally, the HMM as it is currently framed is specific to two-person, matrix-based social dilemmas. Given the importance of this class of games, we do not think this is a major issue. However, we also think that the HMM could be extended to cover other types of games; for example, the types of trust games studied by Evans and colleagues, and for which they have also proposed a hierarchical model of decision making (EvansKrueger, 2011, EvansKrueger, 2014, EvansKrueger, 2016), could include signals and reliability information and be analysed pursuant to the HMM.
8.3 Future work and conclusion
Our research suggests a number of avenues for further work in addition to those we’ve raised in response to this work’s limitations. As well as response-time analysis, use of alternative techniques to determine which sources of information participants are relying on to make their decisions would provide further convergent evidence for our model. For example, in an eye-tracking Experiment we might predict that participants adopting Level 0 or Level 1 strategies will not direct their attention toward a payoff matrix, and that L2BR players will not pay attention to partner reliability information where defection is payoff-dominant. Alternatively, an experimental design in which participants chose whether or not to reveal particular cues prior to each trial (e.g., the game’s payoffs, a partner’s previous decisions, and/or the partner’s signal) would achieve a similar result. Finally, more work is required to determine how consistent participants are in their use of strategies, and when they are flexible (BhattCamerer, 2005, Hyndman et al., 2013, Yoshida et al., 2010).
In this paper we have proposed and presented initial evidence for a hierarchical mindreading model of decision making in social dilemma games. Our model is novel in a number of ways, and we also report a novel finding that some participants will continue to utilise gaze signals even when they are explicitly told that the cues are meaningless, indicating that implicit mindreading might play a role in social dilemma resolution for some participants. Further work is required to validate our model, but in the meantime we suggest that an increased focus on the role that mindreading plays in social dilemma resolution will be a generally productive avenue for future research.
Appendix A
Results with the straight gaze condition for experiments 1, 2a, and 2b are shown below.
Cooperation rates by condition in Experiments 1 and 2a, including straight gaze condition.

Cooperation rates by condition in Experiments 2b, including straight gaze condition.
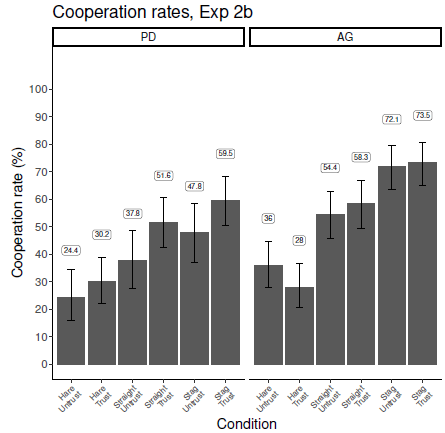
Appendix B
Results and regression table for Experiment 2c including effects for cognitive load and reflection/mindreading prompt conditions are shown below.
Cooperation rates by condition in Experiment 2c, including cognitive load and reflection/mindreading prompt conditions.
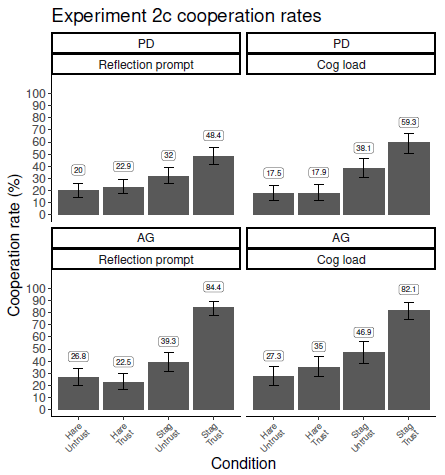

*** p<0.001,
** p<0.01.


 Open access