


Introduction
Subvalvular aortic stenosis is a progressive CHD and the second most common type of left ventricular outflow obstruction. It accounts for 15–20% of all fixed obstructions in the left ventricular outflow tract and 1% of all CHD. Reference Mulla1,Reference Uysal, Bostan, Signak, Semizel and Cil2 The three primary subtypes of subvalvular aortic stenosis are characterised by a 1) thin, crescent-shaped membrane (membranous subaortic stenosis), representing 75–85% of all cases, (2) fibromuscular ridge, and 3) diffuse fibromuscular tunnel-like narrowing. Reference Devabhaktuni, Chakfeh, Malik, Pengson, Rana and Ahsan3 Various pathophysiological mechanisms are thought to contribute to the development of membranous subaortic stenosis, including anatomical factors that increase turbulence and shear stress. A genetic predisposition may also exist. Reference Cape, Vanauker, Sigfússon, Tacy and del Nido4
Diagnosis of subvalvular aortic stenosis typically utilises echocardiography for visualisation of morphology and includes Doppler for estimation of pressure gradients . Reference Aboulhosn and Child5,Reference Frommelt, Snider, Bove and Lupinetti6 Time of diagnosis varies across clinical centres, with the most common age-range being between 1 and 5 years. Reference Choi and Sullivan7,Reference Pickard, Geva, Gauvreau, del Nido and Geva8 With a growing availability of echocardiography, which enables earlier diagnosis, most current cases are asymptomatic at the time of diagnosis aside from the possible presence of a systolic murmur. The range of symptoms associated with late diagnosis includes dyspnoea, angina, fatigue, syncope, palpitations, arrhythmias, heart failure, and may, in rare cases, result in death. Reference Devabhaktuni, Chakfeh, Malik, Pengson, Rana and Ahsan3,Reference Aboulhosn and Child5
There are no current guidelines for the paediatric population concerning indications and ideal timing for surgical intervention. Surgery is the only definite treatment of subvalvular aortic stenosis and may include simple resection of the membrane, complementary myectomy, or the more complex Ross-Konno procedure. Reference Devabhaktuni, Chakfeh, Malik, Pengson, Rana and Ahsan3,Reference Freedom ERM YE.-j and Williams9 While surgery often is effective in reducing pressure gradients, early postoperative complications can occur. These include atrioventricular block, ventricular septal defect, damage to the aortic or mitral valve, and infective endocarditis.
Long-term complications following surgical correction of subvalvular aortic stenosis include a high rate of recurrence and progression of aortic regurgitation. The risk of disease recurrence is estimated to range from 6 to 35%, but has varied between studies, partly due to differing definitions of what constitutes a recurrence. Reference Uysal, Bostan, Signak, Semizel and Cil2,Reference Massé, Shar, Brown, Keswani, Grande-Allen and Sucosky10 Depending on the severity of the relapsing subvalvular aortic stenosis, patients may require surgical reinterventions. Previously identified predictors of disease recurrence and the need for surgical reintervention include younger age at primary surgery, presence of aortic regurgitation, higher pre- and postoperative peak-gradient, short distance between the aortic valve and the subaortic membrane, anatomical variations of the outflow tract as well as presence of other CHDs. Reference Uysal, Bostan, Signak, Semizel and Cil2,Reference Choi and Sullivan7,Reference Pickard, Geva, Gauvreau, del Nido and Geva8,Reference Massé, Shar, Brown, Keswani, Grande-Allen and Sucosky10–Reference Ramoğlu, Karagözlü and Uçar17 Given the severity of the condition, identifying and validating predictors for disease recurrence would hold significant clinical importance.
Materials and method
Study population and data collection
A systematic retrospective chart review was conducted to identify patients that had undergone either primary or reintervention corrective surgery for membranous subaortic stenosis at the Queen Silvia’s Children’s Hospital in Gothenburg between 1st of January 1994 and 31 of December 2019 (n = 44). Since 1994, paediatric cardiac surgery has been centralised to two centres in Sweden (Gothenburg and Lund), each covering 50% of the population. Patients were excluded if the primary diagnosis was not membranous subaortic stenosis or if the performed surgery was not primarily aimed at correcting membranous subaortic stenosis, thereby also excluding other subtypes of subvalvular aortic stenosis. Furthermore, patients with a primary diagnosis of supravalvular AS and valvular AS were excluded. Presence of cardiomyopathy or complex combined defects that required a heart-transplantation were also excluded. After exclusions, the final study sample consisted of 38 patients. The review included medical records at initial diagnosis, pre- and postoperation, as well as the latest (if the patient had not reached adulthood) or last follow-up before reaching 18 years of age.
Outcomes, variables and definitions
The clinical decision of surgical intervention was reached following holistic consideration by the team of clinicians involved in the care of each patient. Indications for both primary and recurring surgery in this cohort of patients included a peak-/mean gradient > 64/40 mmHg measured by Doppler as well as presence and severity of aortic regurgitation and/or left ventricular hypertrophy. Disease recurrence was defined as an increase in the peak gradient by > 50% at the last follow-up compared to the postoperative peak gradient. Additionally, a peak gradient > 16 mmHg at follow-up was required.
The primary outcomes of this study were recurrence of membranous subaortic stenosis, need for reintervention, and mortality. Secondary outcomes included the identification of potential predictors of recurrence and reintervention.
Information on demographics, associated cardiac conditions, comorbidities, clinical signs, symptoms, echocardiography, ECG findings and surgical reports were extracted from the charts. Class of functionality was rated from 1 to 4 according to a modified version of the New York Heart Association classification, in which symptoms varied between 1 (asymptomatic) and 4 (suffering from symptoms even at rest). Symptoms included dyspnoea, chest pain, palpitations/arrhythmia, syncope, and fatigue. Aortic, mitral, and tricuspid valve regurgitation were graded from 0.5 (minimal) to 4 (severe) with increments of 0.5 points (i.e. 0, 0.5, 1, etc.). Accentuation of aortic, mitral, and tricuspid regurgitation was, respectively, defined as an increase of at least 0.5 points postoperative compared to preoperative.
M-mode echocardiography data on dimensions and wall thickness were collected. Z-scores for left ventricular systolic and diastolic dimensions as well as intraventricular septal and left ventricular posterior wall thickness were calculated using algorithms derived from the data published by Lester et al. Reference Lester, Sodt, Hutcheon and Arcilla18 A Z-score > 2 for septal and/or left ventricular posterior wall thickness was used to define hypertrophy.
Statistical analysis
Statistical tests were calculated using SPSS v. 27 (IBM, New York, NY, USA). Graphs were constructed using Graph Pad Prism v. 9 (San Diego, CA, USA). Basic statistical measurements including the median, range etc. were calculated using Microsoft Excel v.16 (Microsoft, Redmond, WA, USA).
Continuous variables (except for Z-scores) were log-transformed prior to data analysis, to achieve a close-to-normal data distribution, as well as homogeneity of variance between groups. The study groups were compared using either independent samples or paired T-tests. Non-parametric Mann–Whitney tests were calculated where assumptions of parametric tests were violated based on histograms, Q-Q plots, as well as Levene’s test for homogeneity of variances. For categorical variables, the difference between groups was analysed using continuity corrected Chi-squared tests. Fisher’s exact test was used when the expected number of cases was below 5 for any cell of the contingency table. Statistical significance was defined as a p-value < 0.05. Linear correlation analyses were conducted for pairwise analyses of continuous variables.
Kaplan–Meier survival-analysis was conducted based on the overall survival-rate from reintervention, followed by comparative analysis through Mantel–Cox testing of patients ≤ 5 and > 5 years of age at primary intervention.
Results
Basic characteristics and surgical outcomes (Table 1)
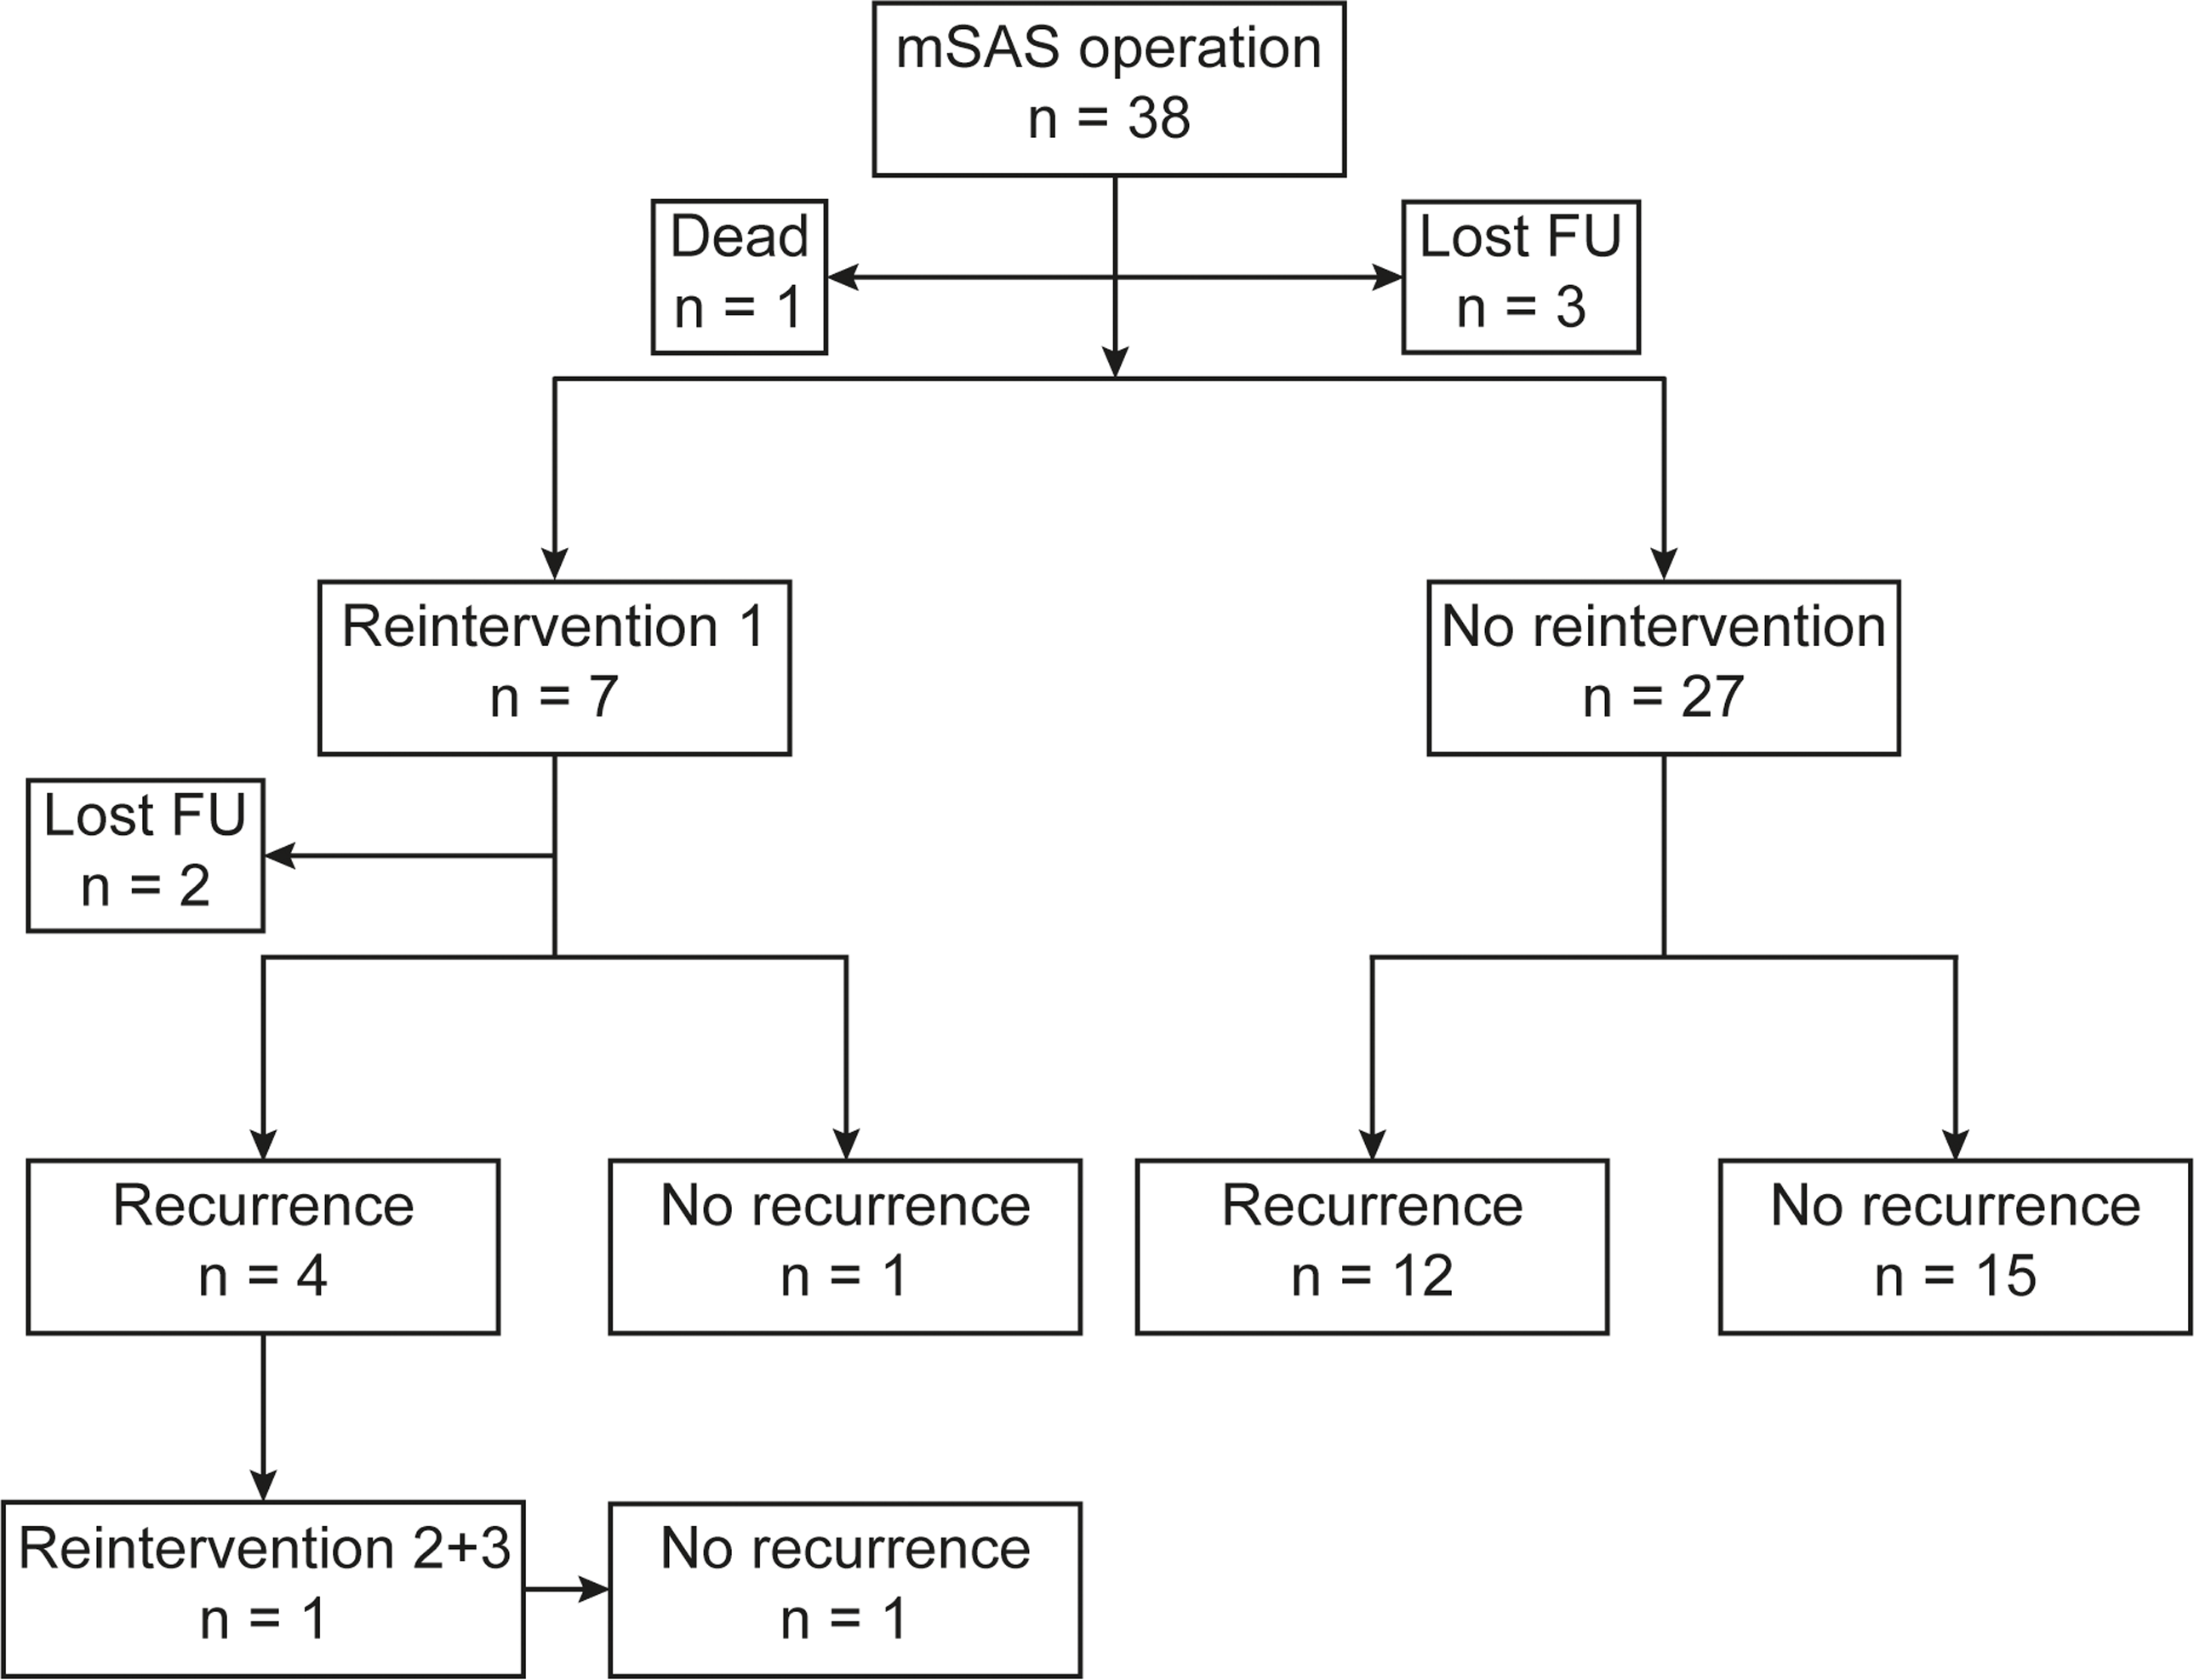
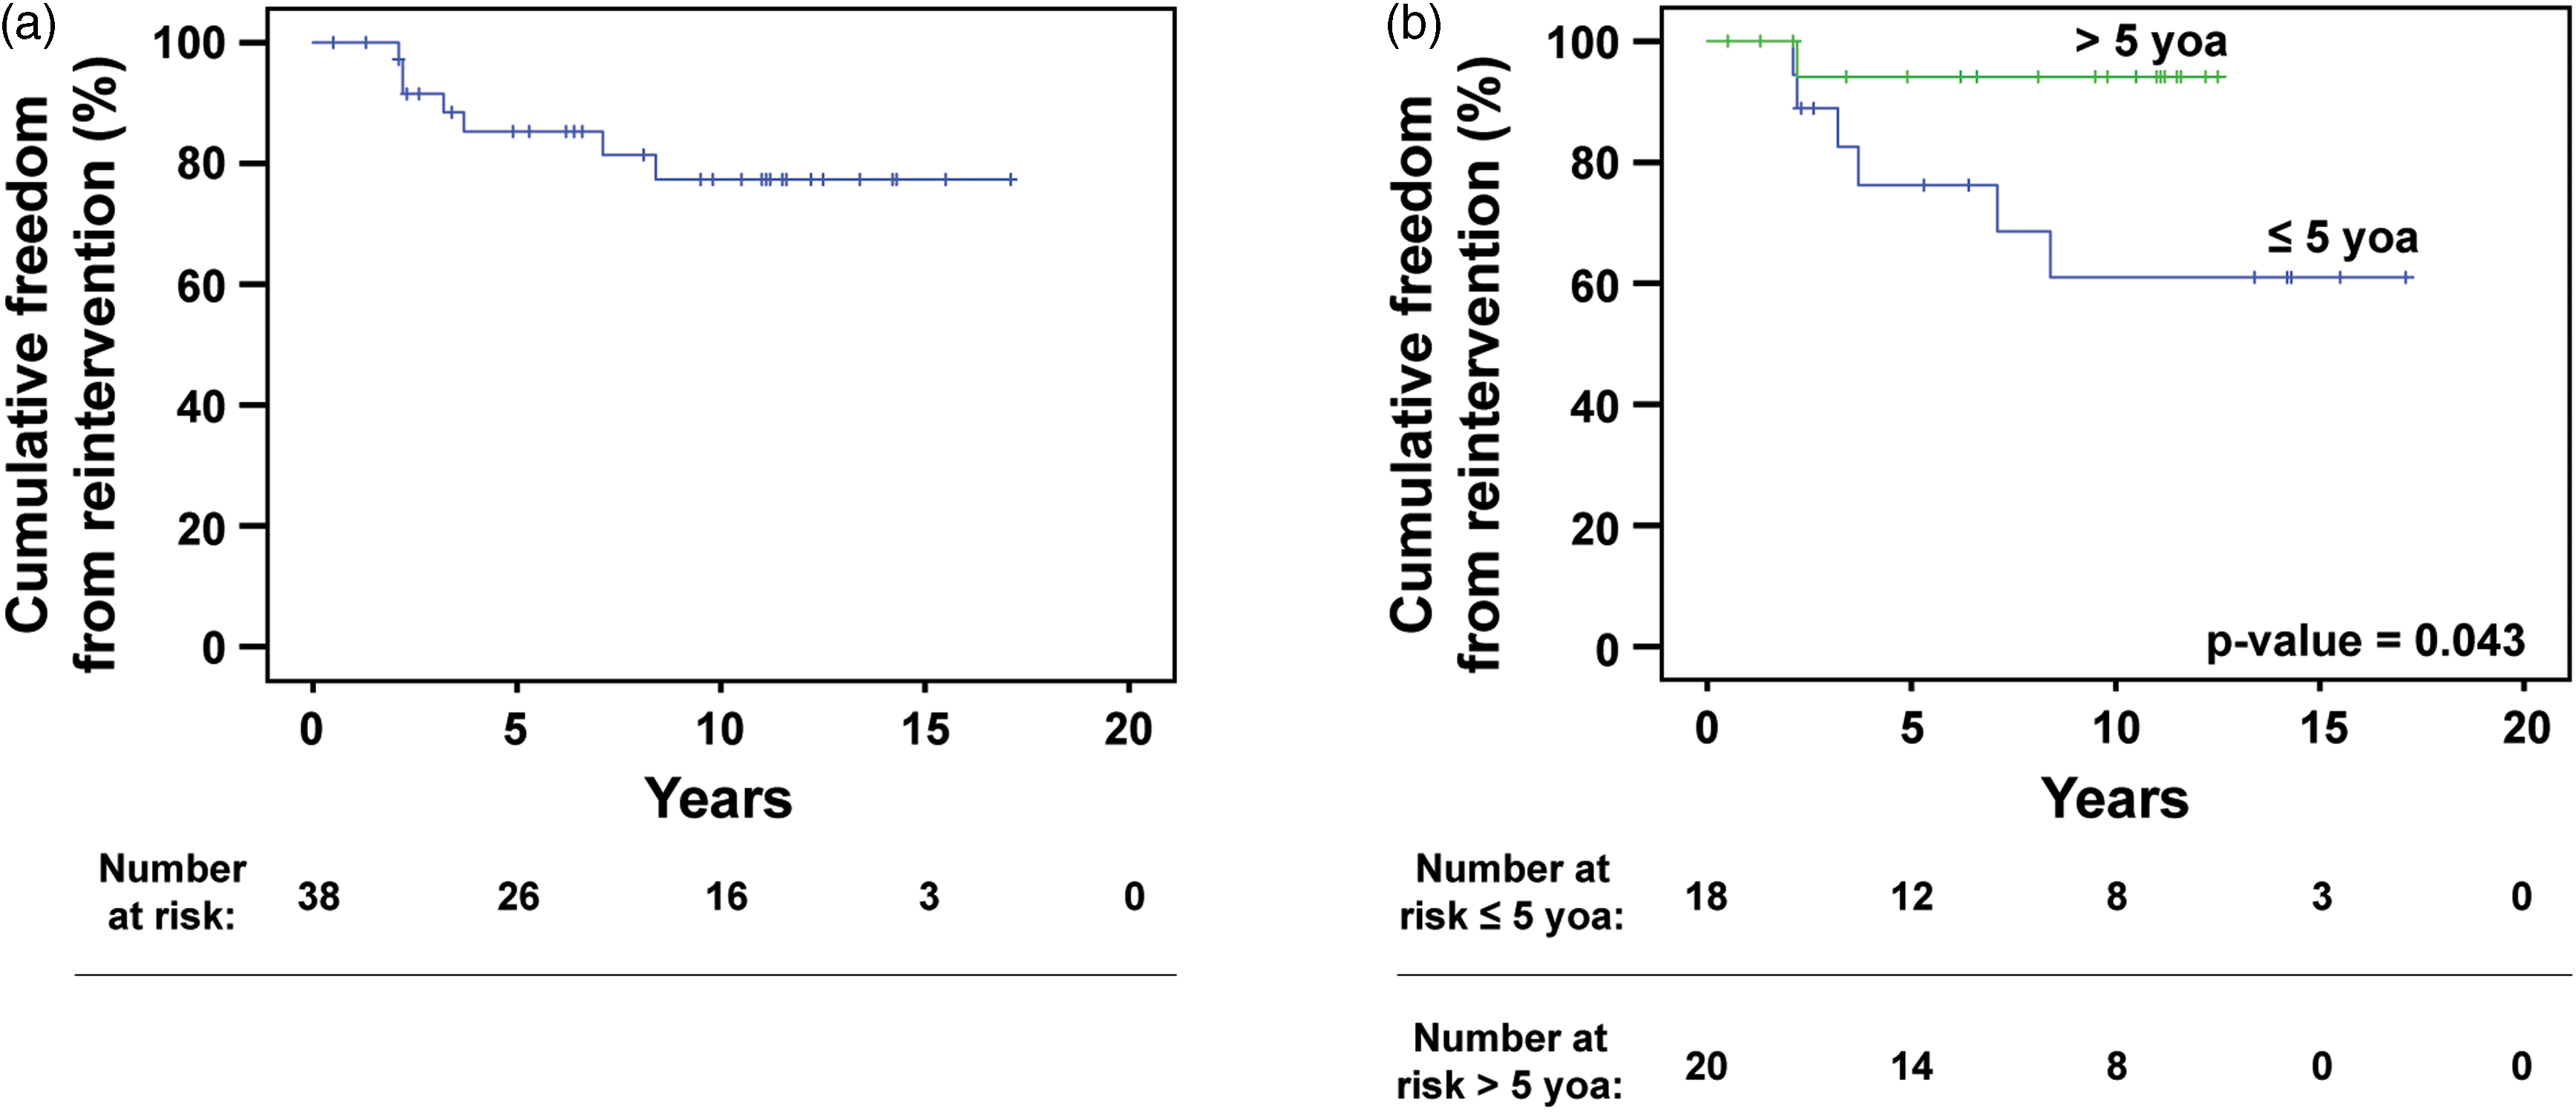
A total of 38 patients met the inclusion criteria (61% male). An associated CHD was found in 20 patients (53%), while 19 (50%) had an extra-cardiac condition. 11 (29%) patients had developmental delay and/or a genetic syndrome. Eight patients (21%) had undergone cardiothoracic surgery prior to the primary membranous subaortic stenosis surgery. The median age at diagnosis was 2.3 years (0.003–17.2 years), at primary surgery 5.3 years (0.03–17.5), and at reintervention 6.9 years (4.2–12.6). The median time from primary surgery to last or latest follow-up was 9.9 years (range 0.01–19.5 years). During follow-up, 19 (56%) developed disease recurrence and 7 (21%) underwent reintervention (Figure 1). One patient had additional reinterventions and underwent 3 surgeries in total. Kaplan–Meier-derived estimated freedom of reoperation was 82% at a mean follow-up of 9.4 years (Figure 2a).
Demographics, comorbidity, thoracic intervention and outcome for Gothenburg’s surgically treated mSAS-patients
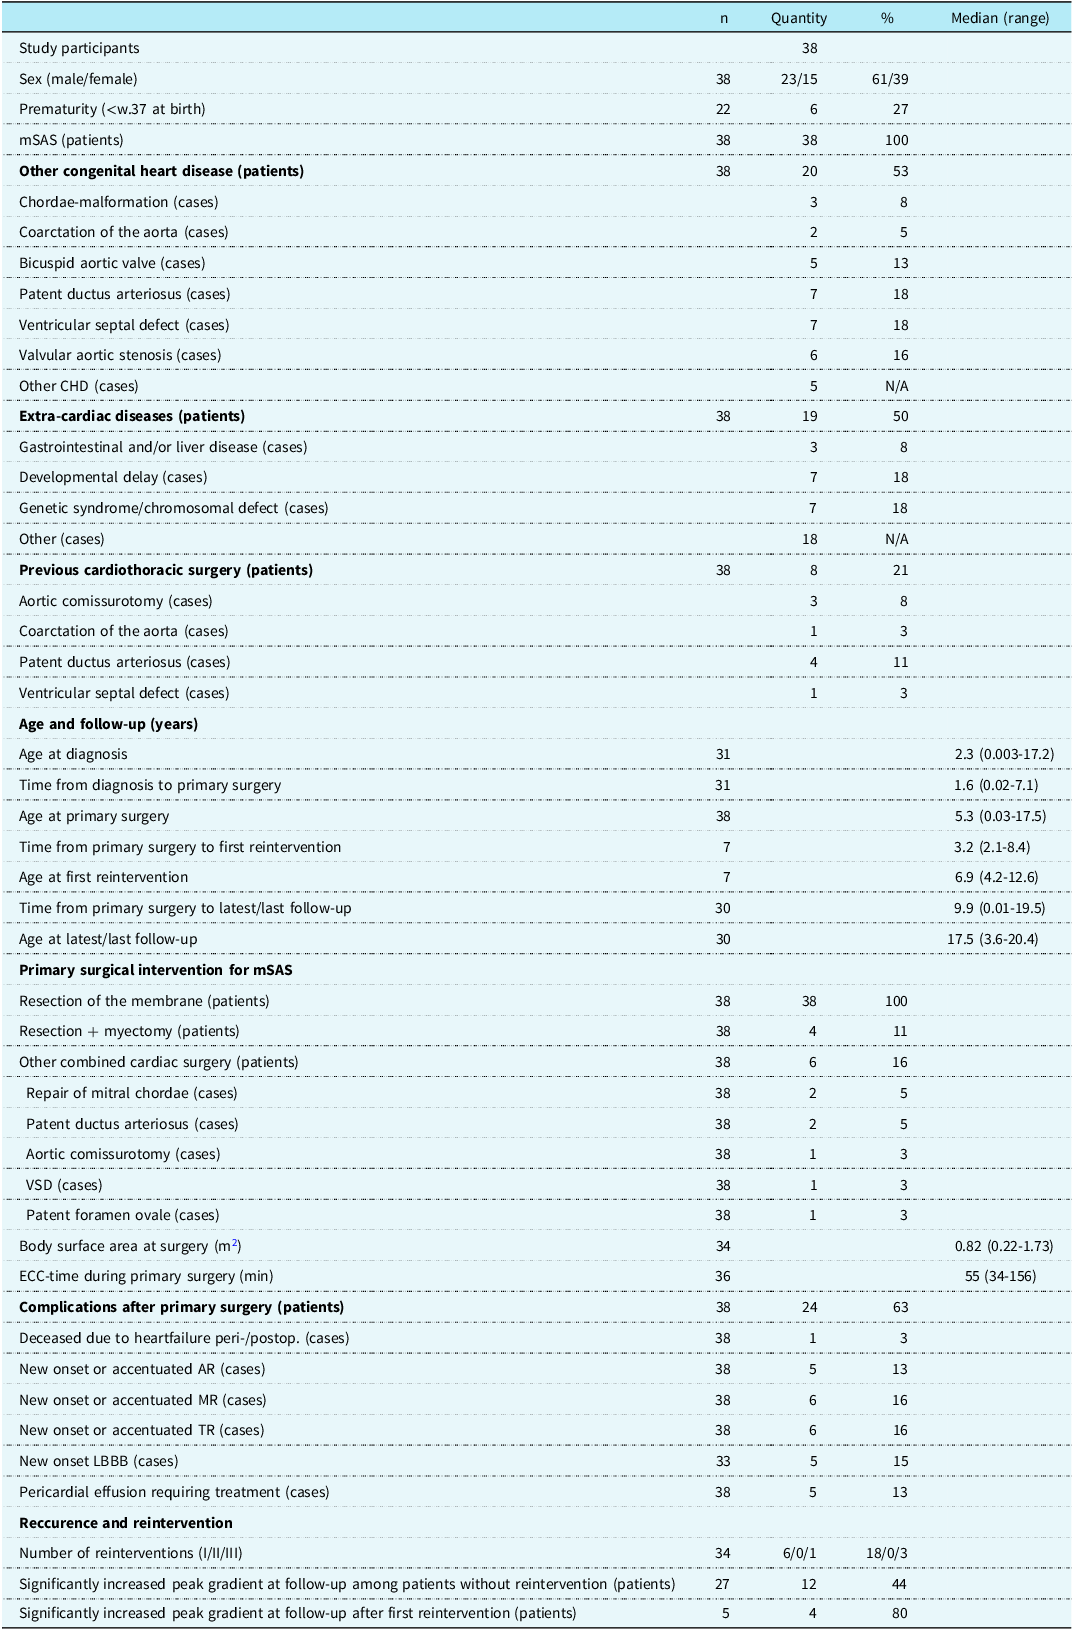
Abbreviations: mSAS = membranous subvalvular aortic stenosis; n = participants without missing data; VSD = ventricular septal defect; ECC = extracorporeal circulation; peri- = perioperative; postop., postoperative; AR = aortic regurgitation; MR = mitral regurgitation; TR = tricuspid regurgitation; LBBB = left bundle branch block.
Flowchart of surgical interventions and follow-up. Abbreviations: mSAS = membranous subaortic stenosis; n = number of patients; FU = follow-up.
Cumulative freedom from reintervention. ( a ) Kaplan–Meier curve demonstrating the overall freedom from reintervention. One patient > 5 years of age died postoperatively following primary surgery. Seven patients required reintervention before reaching 18 years of age. ( b ) Kaplan–Meier curves comparing freedom from reintervention between patients who underwent primary surgery before (blue) and after (green) 5 years of age. Patients younger than 5 years at their initial operation were significantly more likely to require reintervention before reaching adulthood (6 and 1 cases of reintervention, respectively, p ≈ 0.043).
All patients underwent membrane resection during their primary surgery, and 4 (11%) had a combined resection with myectomy. Furthermore, 6 patients (16%) had concomitant cardiac surgery. Peri-and/or postoperative complications occurred for 24 patients (63%). One case (3%) of peri-operative death occurred, due to suspected air embolism causing myocardial infarction and subsequent fatal ischaemic brain damage during ECMO-treatment. Most complications were of mild severity with newly onset or accentuated aortic, mitral, or tricuspid regurgitation, and 5 patients (15%) had newly onset left bundle branch block. An additional 3 patients displayed left bundle branch block after reintervention, one of which had confirmed persisting left bundle branch block.
Clinical characteristics (Table 2)
Most patients were asymptomatic at diagnosis (75%) and preoperatively (73%). All patients displayed preoperative systolic murmurs, while only 4 (11%) patients had a diastolic murmur. At last follow-up, 15 patients (68%) had a persistent systolic murmur, while diastolic murmur was observed for 2 patients (8%).
Symptoms, clinical signs and ECG of Gothenburg’s surgically treated mSAS-patients
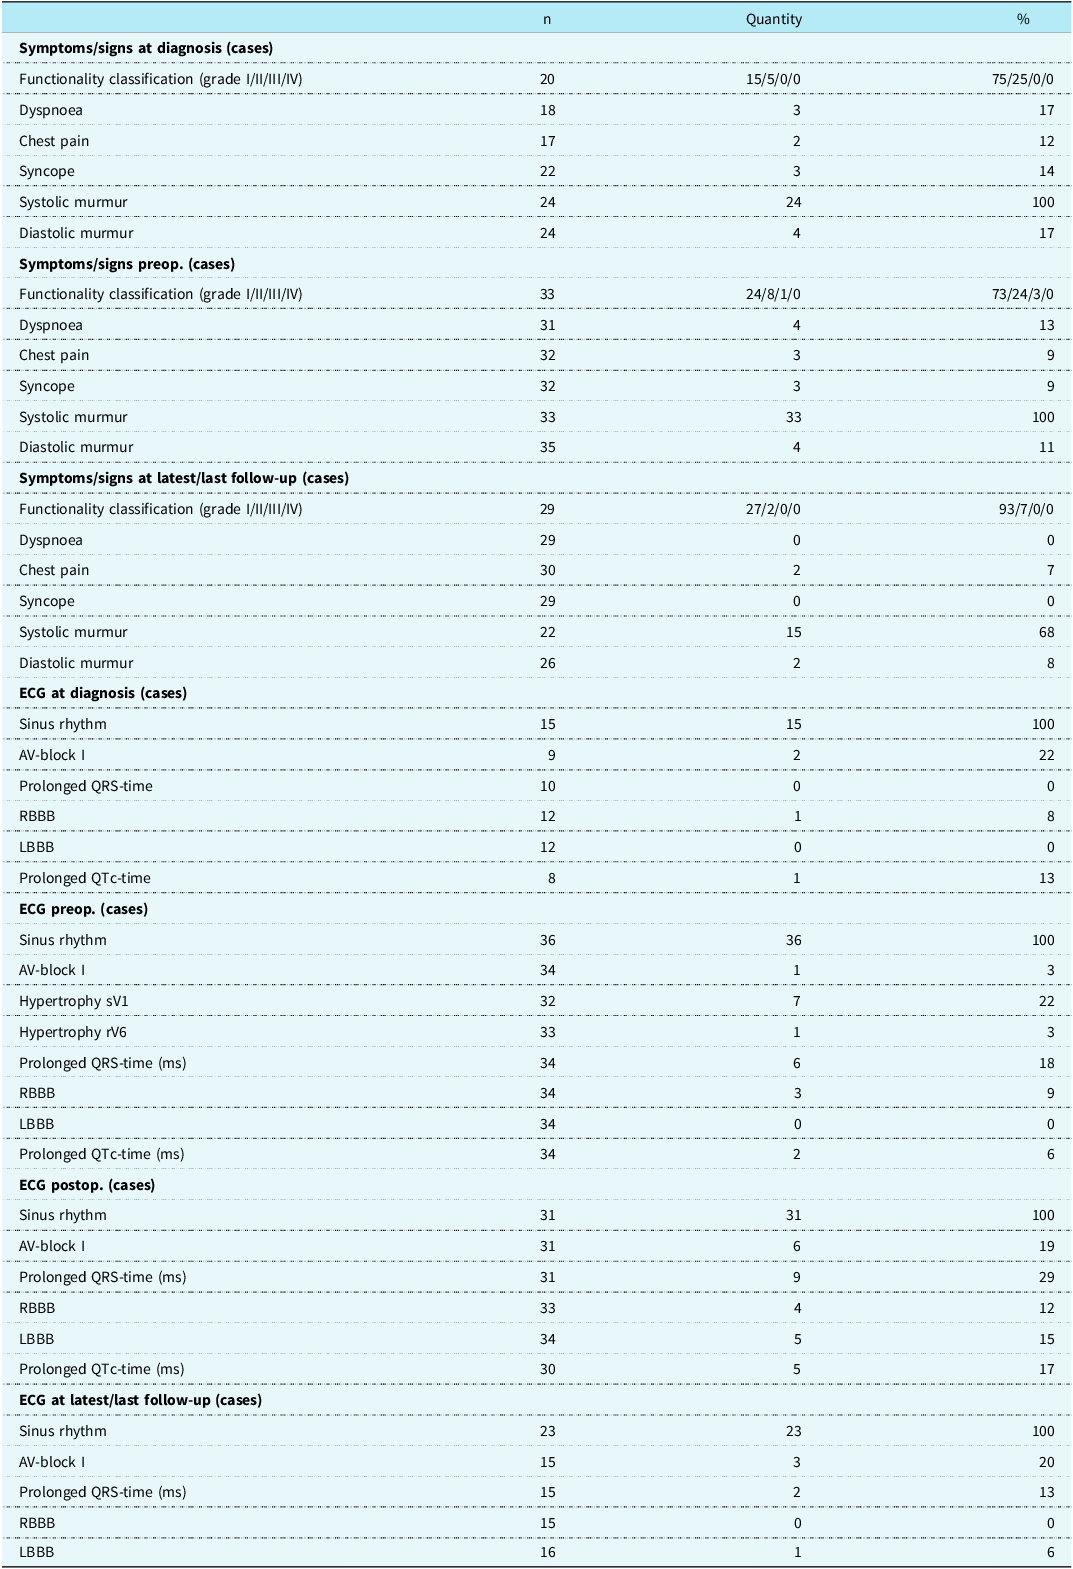
Abbreviations: ECG, electrocardiogram; mSAS, membranous subvalvular aortic stenosis; n, participants without missing data; preop; preoperatively; AV-block, atrioventricular block; RBBB, right bundle branch block; LBBB, left bundle branch block; sV1, s-wave in V1; rV6, r-wave in V6; postop, postoperatively.
All patients had sinus rhythm during all ECG recordings. Preoperative ECG showed signs of left ventricular hypertrophy in 7 (22%) and 1 (3%) of patients based on sV1 and rV6, respectively. Only 3 (14%) patients with left ventricular hypertrophy showed concordant signs of hypertrophy in both ECG sV1 measurements and echocardiographic diastolic septal examinations.
Echocardiographic characteristics (Table 3 and 4)
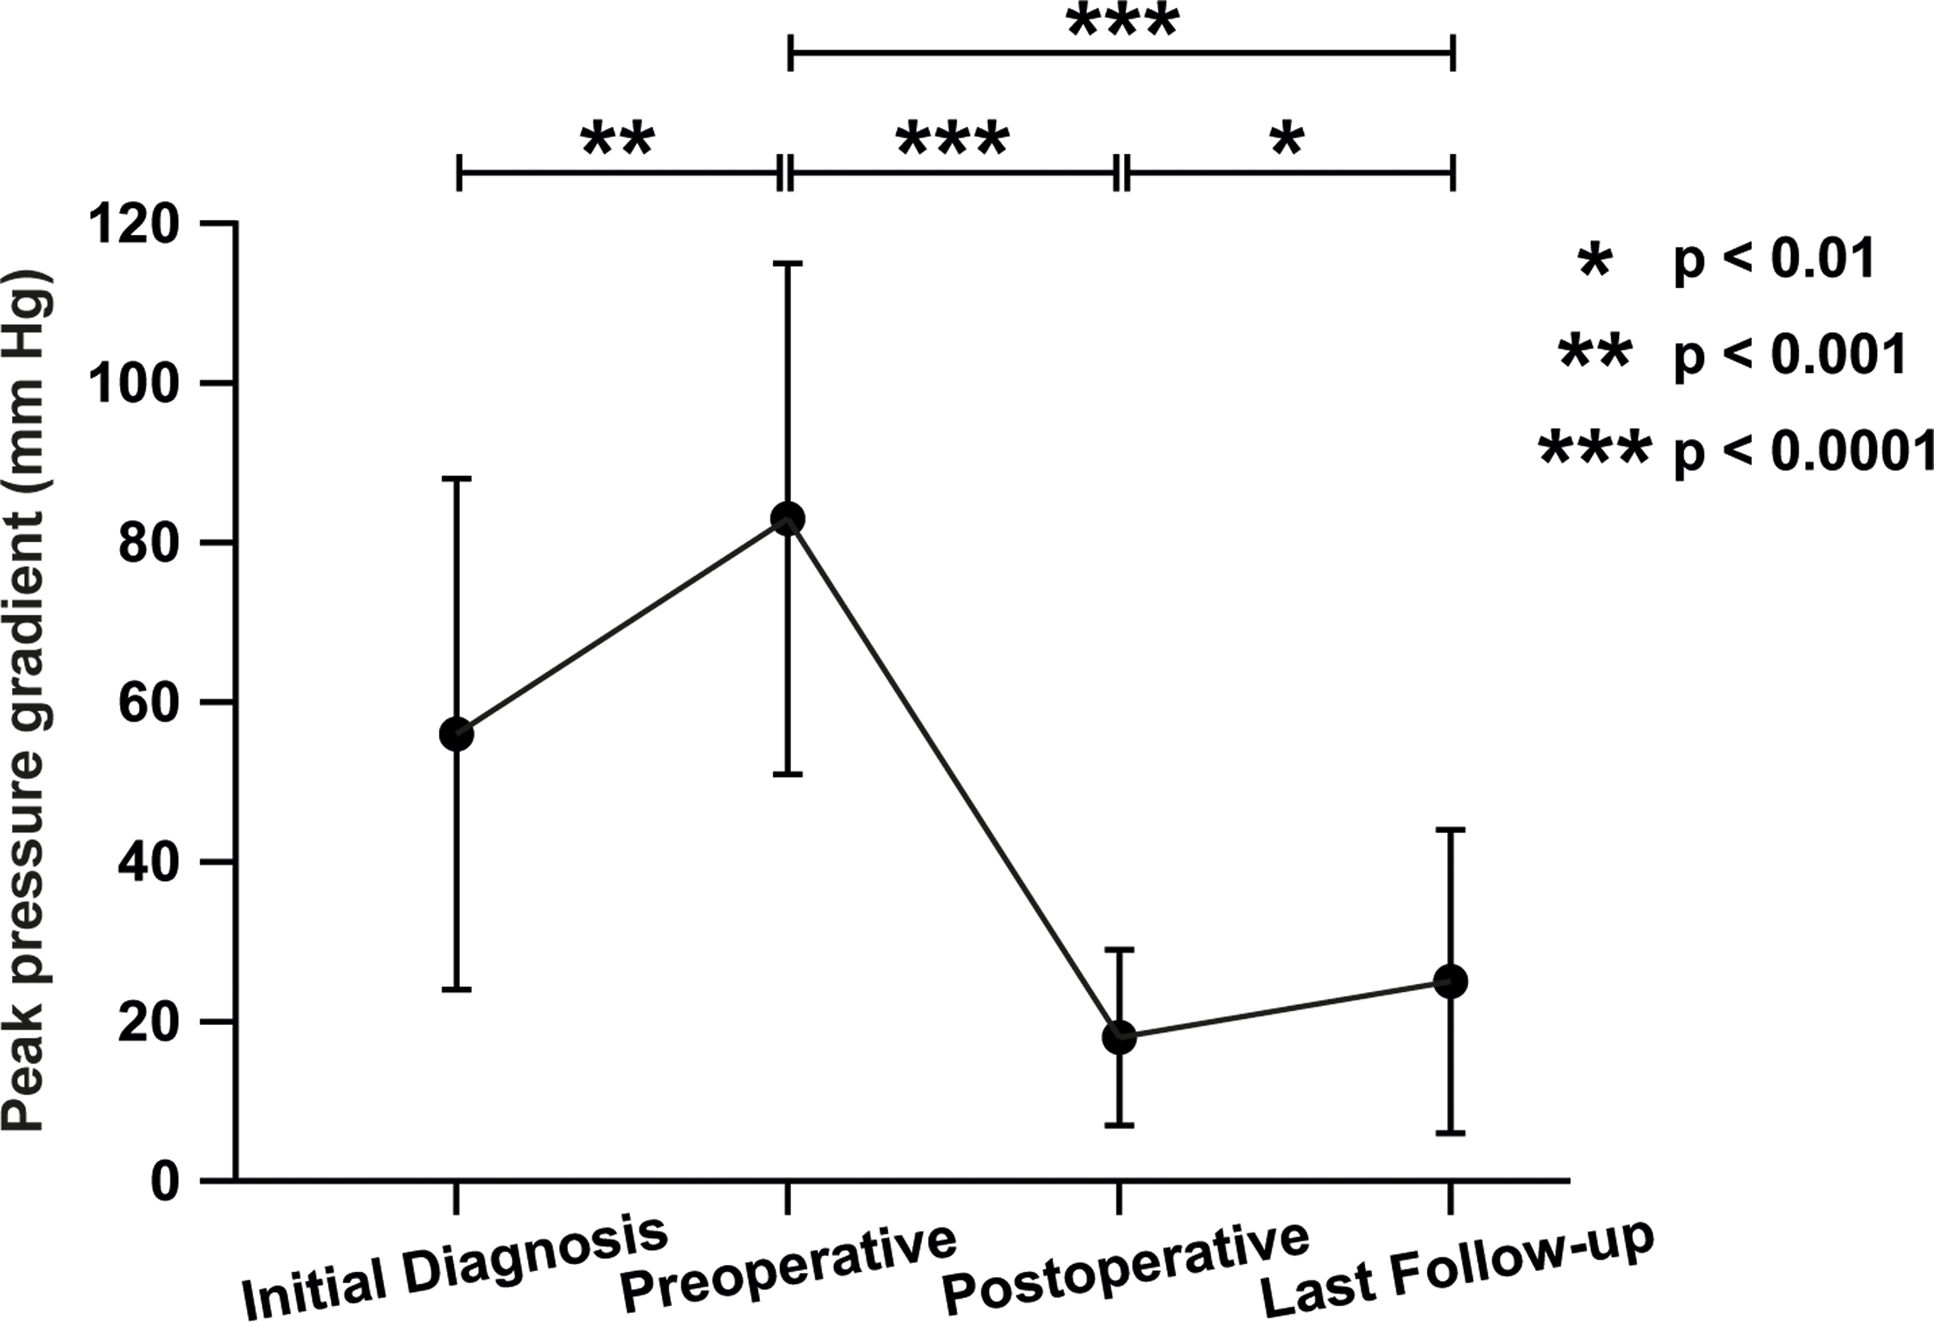
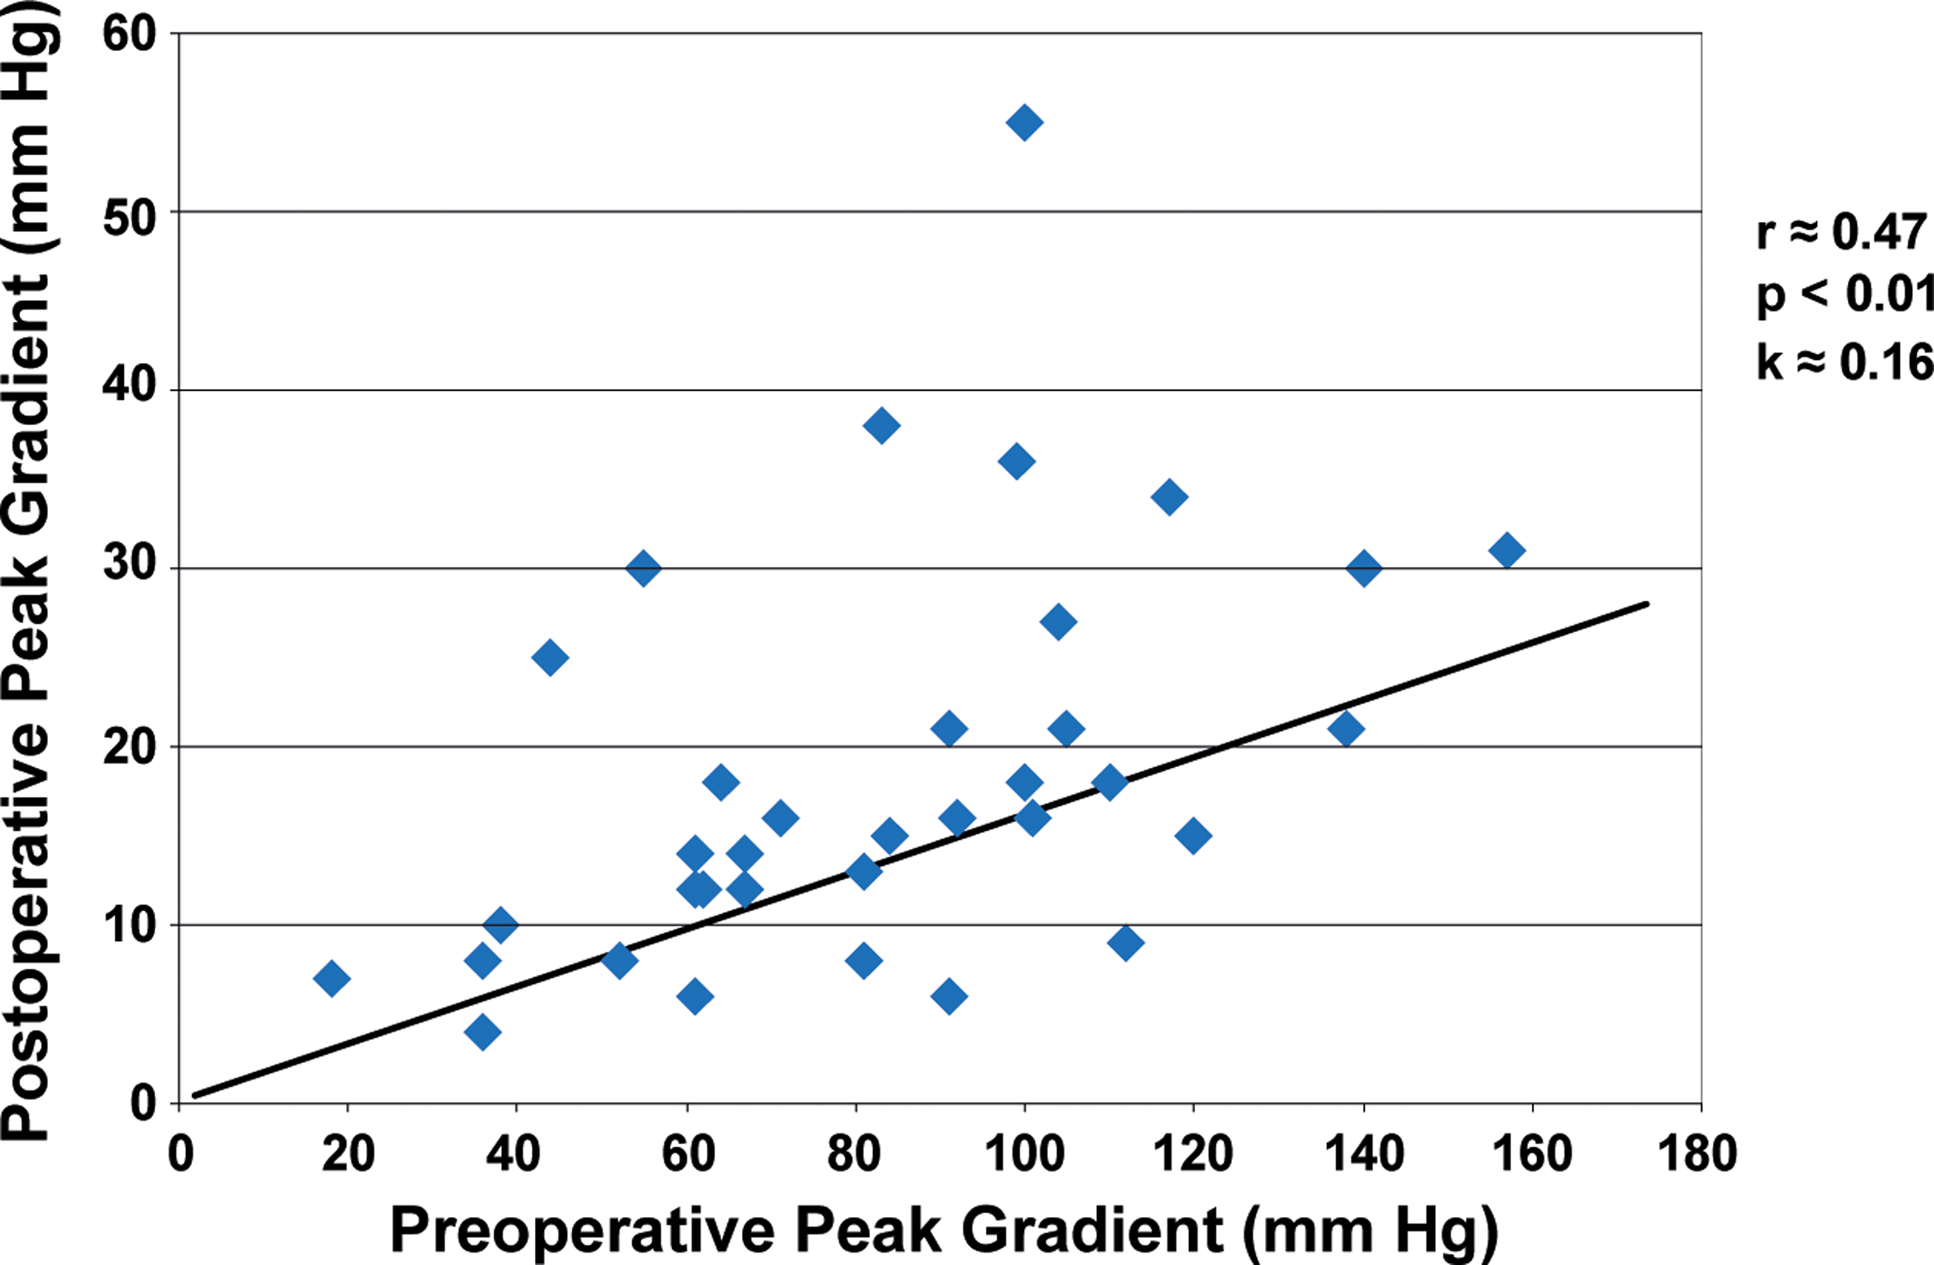
The median peak gradient progressed from 61 mmHg at diagnosis to 83 mmHg preoperatively, 16 mmHg post-operatively, and 19 mmHg at follow-up (Table 3, Figure 3). Preoperative function-class and preoperative peak-gradients were positively associated (Table 4, p < 0.001). All patients (10/34) with functional class > 1 had preoperative peak gradients ≥ 90 mmHg. The mean value peak gradient for patients with functional class > 1 was significantly higher compared to patients with functional class 1 (113 and 73 mmHg, respectively, p < 0.001). The pre-and postoperative peak gradients were positively linearly correlated (Table 4, Figure 4, r ≈ 0.47, k ≈ 0.16, p < 0.01). A negative correlation was observed between the preoperative peak gradient and the distance between the subaortic stenosis membrane and the aortic valve. A shorter distance was overall associated with a higher preoperative peak gradient (Table 4, r ≈ −0.44, p < 0.01).
Progression of peak pressure gradients from diagnosis until follow-up. Mean value of the peak pressure gradient ± standard deviation at each time point. Number of patients with available data were 28 at diagnosis, 37 preoperatively, 36 postoperatively and 32 at last follow-up. Paired student’s T tests: * p-value < 0.01, ** p-value < 0.001, *** p-value < 0.0001.
Correlation between pre- and postoperative peak gradients. A positive linear correlation between pre- and postoperative peak pressure gradients was observed, r ≈ 0.47, p < 0.01 and k ≈ 0.16.
Echocardiographic data of Gothenburg’s surgically treated mSAS-patients
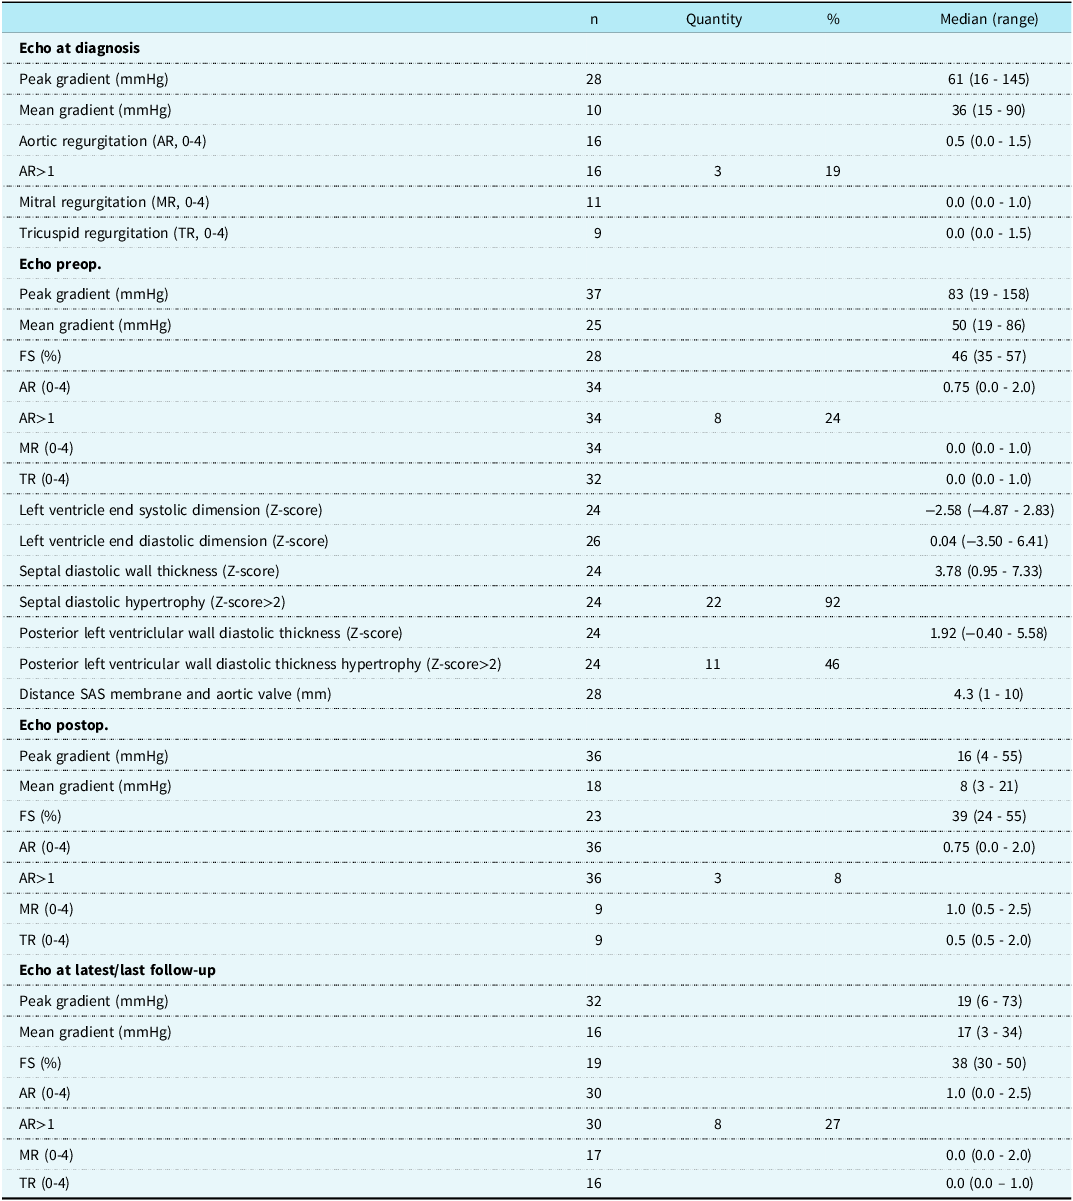
Abbreviations: mSAS, membranous subvalvular aortic stenosis; n, participants without missing data; Echo, echocardiography; AR, aortic regurgitation; MR, mitral regurgitation; TR, tricuspid regurgitation; preop, preoperatively; FS, fractional shortening; SAS, subvalvular aortic stenosis; postop, postoperatively.
Primary intervention. Continuous variables analysed by Pearson’s correlation, categorical variables by Chi-square-tests

Abbreviations: preop = preoperative; postop = postoperative; AoV = aortic valve.
Septal diastolic wall thickness Z-score > 2, indicative of left ventricular hypertrophy, was observed for 22 (92%) patients preoperatively (Table 3), while left ventricular posterior wall diastolic thickness Z-score > 2 was present for only 11 (46%) patients. Diastolic septal and left ventricular posterior wall thickness were positively correlated (Table 4, r ≈ 0.57, p < 0.01). No significant correlation was, however, observed between the septal Z-score and the preoperative peak-gradient.
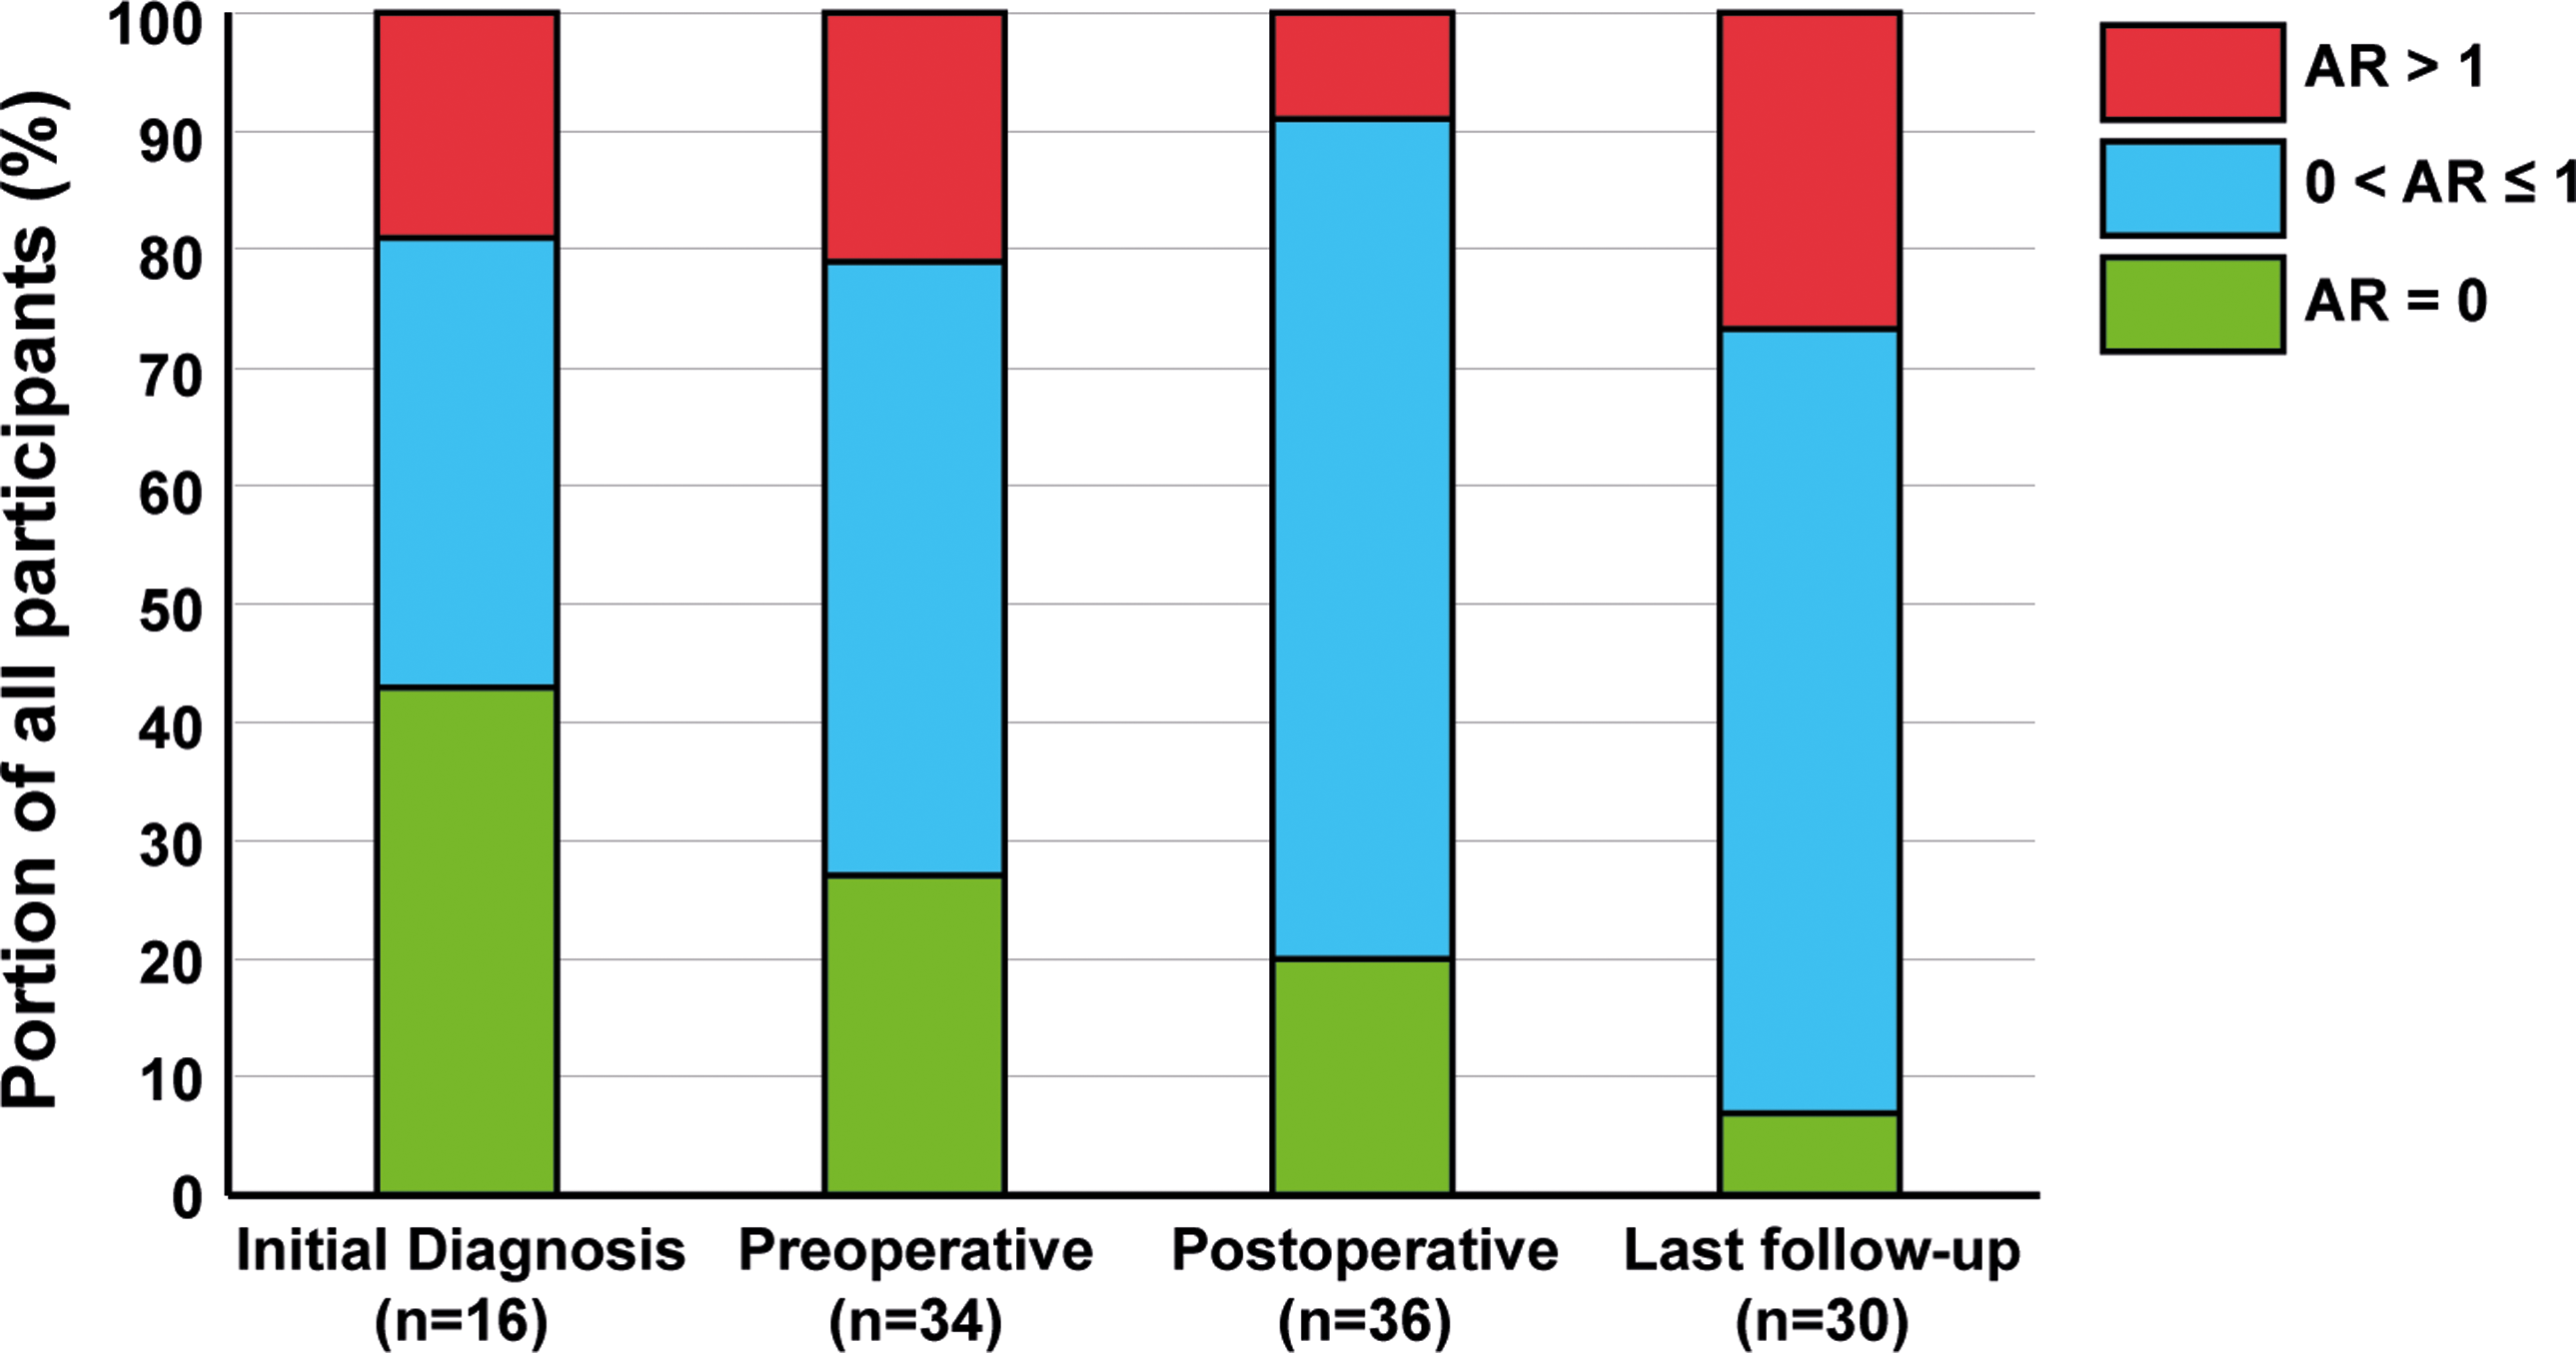
Aortic regurgitation > 1 was observed in three (19%) patients at diagnosis (Table 3), 8 patients (24%) preoperatively, 3 patients (8%) postoperatively, and 8 patients (27%) at last follow-up. A significant increase in aortic regurgitation was observed when comparing the absence (aortic regurgitation = 0) to the presence (aortic regurgitation > 0) of aortic regurgitation preoperatively and at last follow-up (Table 4, Figure 5, p < 0.05).
Progression of aortic regurgitation from initial diagnosis until last follow-up. AR = 0 (green) constitutes no aortic regurgitation (AR), 0 < AR ≤ 1 (blue) constitutes aortic regurgitation of mild severity and AR > 1 (red) constitutes aortic regurgitation of at least moderate severity.
Predictors of recurrence and reintervention (Table 5)
Predictors of recurrence were analysed by comparing patients in the recurrent group (n = 19) to those in the non-recurrent group (n = 15). Due to missing follow-up data, 3 patients that had not undergone reintervention were excluded from the analysis. Both the postoperative peak gradient and the postoperative mean gradient were significantly higher (p < 0.05) in patients who developed recurrence. Additionally, valvular AS tended to be more common in patients which developed disease recurrence (p ≈ 0.053). Most other variables did not differ significantly between patients with and without recurrence, including sex, newly debuted left bundle branch block, distance between the subaortic stenosis membrane/aortic valve, preoperative peak gradient, preoperative mean-gradient, septal diastolic wall thickness, and presence of aortic regurgitation.
Differences between patients with and without recurrent mSAS

Abbreviations: mSAS, membranous subvalvular aortic stenosis; sd, standard deviation; LBBB, left bundle branch block; postop, postoperatively; SAS, subvalvular aortic stenosis; preop, preoperatively; ECC, extracorporeal circulation.
In terms of reintervention, patients who underwent primary surgery before 5 years of age had a significantly higher risk of reintervention compared to patients that had undergone surgery after 5 years of age (Figure 2b, p ≈ 0.043), as determined by Kaplan-Meier survival-analysis and Mantle–Cox testing.
Discussion
The major findings of this retrospective review of surgically treated paediatric membranous subaortic stenosis patients were that a majority of patients developed recurrence, resulting in a need of reintervention for 21%. Mortality was rare and occurred in only one case. Postoperative peak and mean pressure gradients were elevated in patients who ultimately developed recurrence. Furthermore, patients who underwent primary surgery before 5 years of age had a significantly higher risk of reintervention.
Membranous subaortic stenosis surgery is relatively safe but is associated with high recurrence rate
Based on our study’s definition of recurrence (peak gradient increase > 50% compared to the postoperative peak-gradient and a minimum peak gradient of > 16 mmHg), we observed a recurrence rate of 56% in this retrospective cohort. This is relatively high compared to what has been reported in other studies, Reference Uysal, Bostan, Signak, Semizel and Cil2,Reference Devabhaktuni, Chakfeh, Malik, Pengson, Rana and Ahsan3,Reference Massé, Shar, Brown, Keswani, Grande-Allen and Sucosky10 which might be due to varying definitions of recurrence. Frequent recurrence, despite successful surgical intervention, highlights the progressive nature of membranous subaortic stenosis. Reference Lopes, Lourenço, Gonçalves, Cruz and Maciel19 In contrast, only 21% of patients in this study required reintervention, which is consistent with findings from previous studies. Reference Donald, Naimo and d’Udekem12,Reference Geva, McMahon, Gauvreau, Mohammed, del Nido and Geva16,Reference Abushaban, Uthaman, Selvan, Al Qbandi, Sharma and Mariappa20,Reference Anderson, Tingo, Glickstein, Chai, Bacha and Torres21 Residual cell populations derived from the subaortic membrane, damaging blood jets causing shear stress, as well as the existence of different genetical disease subtypes might explain the temporary improvement following surgery.
A positive correlation between preoperative and postoperative peak-gradient was observed. Furthermore, high residual postoperative peak- and mean pressure gradients were identified as potential predictors of recurrence, as postoperative pressure gradients were significantly higher in the group of patients that eventually suffered disease recurrence. This was in agreement with previous studies. Reference Pickard, Geva, Gauvreau, del Nido and Geva8,Reference Massé, Shar, Brown, Keswani, Grande-Allen and Sucosky10,Reference Brauner, Laks, Drinkwater, Shvarts, Eghbali and Galindo11,Reference Theocharis, Viola, Papamichael, Kaarne and Bharucha13 Our findings suggest that delaying surgery for “too long”—e.g. until the preoperative peak gradient exceeds 40 mmHg—could prevent reaching a normal postoperative peak-gradient < 10 mmHg. Reference Hatle LaA22 The importance of achieving a low postoperative peak-gradient has been discussed since Attie et al Reference Attie, Ovseyevitz and Buendia23 suggested that moderately elevated post-op peak gradient did not predict disease recurrence. However, several subsequent studies, e.g. Brauner et al, Reference Brauner, Laks, Drinkwater, Shvarts, Eghbali and Galindo11 have reported and verified that an increased postoperative pressure gradient constitutes a predictor of future reintervention. Reference Theocharis, Viola, Papamichael, Kaarne and Bharucha13 Furthermore, earlier studies have suggested that higher gradients might also potentially increase the risk for sudden death. Reference van der Linde, Takkenberg and Rizopoulos24 Our results support that postoperative peak- and mean gradients may be predictive of disease recurrence. Therefore, it is possible that an aggressive surgical approach aimed at minimising the postoperative pressure gradient Reference Donald, Naimo and d’Udekem12 combined with early intervention before the preoperative peak-gradient has become too elevated (i.e. > 40 mmHg) could be favourable in avoiding future recurrence. It should, however, be noted that even aggressive surgery may not be successful in preventing disease recurrence. Anatomical variations of the left ventricular outflow tract and an architecture which results in turbulent blood flow may constitute factors that are not completely correctable through surgery. Due to the complex pathophysiological nature of membranous subaortic stenosis and the risks associated with surgery, the optimal surgical method and timing for correcting membranous subaortic stenosis need to be further investigated.
Importantly, younger age at the time of primary surgery has been suggested to be predictive of recurrence, which could imply that early intervention results in an increased risk of recurrence. Reference Pickard, Geva, Gauvreau, del Nido and Geva8,Reference Geva, McMahon, Gauvreau, Mohammed, del Nido and Geva16,Reference Abushaban, Uthaman, Selvan, Al Qbandi, Sharma and Mariappa20,Reference Anderson, Tingo, Glickstein, Chai, Bacha and Torres21 In the current study, age < 5 years at initial intervention was a significant predictor for reintervention, corroborating the results of previous studies. Could early surgery itself trigger the recurrence, or do the patients who require surgical intervention at a younger age constitute a distinct, more aggressive disease phenotype Reference Pickard, Geva, Gauvreau, del Nido and Geva8 ? If the latter is true, earlier intervention at lower gradients could potentially be beneficial for these patients, in order to minimise the risk of a residual pressure gradient. A more aggressive surgical technique, however, also increases the risk of perioperative complications and is no guarantee for avoiding disease recurrence. Reference Devabhaktuni, Chakfeh, Malik, Pengson, Rana and Ahsan3,Reference Abushaban, Uthaman, Selvan, Al Qbandi, Sharma and Mariappa20 Notably, we did not find preoperative peak- and mean gradients to be significantly elevated in the patients that developed disease recurrence. Limited sample size and study power may explain this discrepancy in comparison to previous studies, which have demonstrated that preoperative pressure gradients are predictive of reintervention. Reference Uysal, Bostan, Signak, Semizel and Cil2,Reference Pickard, Geva, Gauvreau, del Nido and Geva8,Reference Massé, Shar, Brown, Keswani, Grande-Allen and Sucosky10,Reference Brauner, Laks, Drinkwater, Shvarts, Eghbali and Galindo11,Reference Carlson, Pickard and Gauvreau15,Reference Abushaban, Uthaman, Selvan, Al Qbandi, Sharma and Mariappa20,Reference Anderson, Tingo, Glickstein, Chai, Bacha and Torres21
Other studies have suggested that a shorter distance between the subaortic membrane and the aortic valve is predictive of reintervention. Reference Theocharis, Viola, Papamichael, Kaarne and Bharucha13,Reference Carlson, Pickard and Gauvreau15,Reference Geva, McMahon, Gauvreau, Mohammed, del Nido and Geva16,Reference Abushaban, Uthaman, Selvan, Al Qbandi, Sharma and Mariappa20,Reference Anderson, Tingo, Glickstein, Chai, Bacha and Torres21 No significant difference for the subaortic membrane/aortic valve distance was observed between the recurrence and non-recurrence groups in our study. This may, possibly, be explained by the relatively small sample size of the study. Notably, we observed a negative correlation between the subaortic membrane/aortic valve distance and the preoperative peak-gradient. This suggests that a shorter subaortic membrane/aortic valve distance may lead to a greater obstruction, resulting in a higher preoperative peak-gradient.
The low mortality and rate of complications were in line with other publications. Reference Mukadam, Gordon and Olson14,Reference Abushaban, Uthaman, Selvan, Al Qbandi, Sharma and Mariappa20,Reference Anderson, Tingo, Glickstein, Chai, Bacha and Torres21 Aortic regurgitation has been observed to progress over time in several previous publications, Reference Brauner, Laks, Drinkwater, Shvarts, Eghbali and Galindo11,Reference Donald, Naimo and d’Udekem12,Reference Lopes, Lourenço, Gonçalves, Cruz and Maciel19 irrespective of surgical intervention. Damaging jets caused by the subaortic membrane or residual membrane tissue has been suggested as a possible mechanism for aortic regurgitation progression. Reference Aboulhosn and Child5 The increased portion of patients that had developed aortic regurgitation at last follow-up compared to the preoperative timepoint was therefore to be expected.
Most patients with membranous subaortic stenosis remained asymptomatic until surgical intervention
Most patients in this study of surgically treated patients with membranous subaortic stenosis were asymptomatic and diagnosed due to the initial finding of a systolic murmur. Notably, we observed an association between functional class and the preoperative peak-gradient at a threshold value of 90 mmHg. These findings challenge the conclusions of Brauner et al, Reference Brauner, Laks, Drinkwater, Shvarts, Eghbali and Galindo11 who reported no clear correlation between symptoms and the preoperative peak-gradient. On the other hand, Aboulhosn et al. Reference Aboulhosn and Child5 reported that development of symptoms related to membranous subaortic stenosis was a negative prognostic factor that should prompt surgery. The findings by Alboulhosn et al. suggest that surgery should be performed well before clinical deterioration to the point when symptoms arise, which, according to our study, would be before their peak-gradient exceeds 90 mmHg. It should be noted that all patients who exceed a preoperative peak gradient of 90 mmHg do not report any symptoms. As demonstrated previously, including by Darcin et al. Reference Devabhaktuni, Chakfeh, Malik, Pengson, Rana and Ahsan3,Reference Massé, Shar, Brown, Keswani, Grande-Allen and Sucosky10,Reference Donald, Naimo and d’Udekem12 , most patients with membranous subaortic stenosis remain asymptomatic throughout childhood and adolescence. Nevertheless, the prognostic impact of a symptomatic clinical presentation could be of great practical and clinical value - especially in regions where the availability of echocardiography is limited. By examining presence of function class > 1 and symptoms, patients with a high peak gradient (> 90 mmHg) could plausibly be identified and referred for closer examination with echocardiography and subsequent surgery.
Demographic characteristics, comorbidities, and ECG findings in patients with membranous subaortic stenosis
The current study sample had a male/female ratio consistent with previous studies, Reference Choi and Sullivan7,Reference Pickard, Geva, Gauvreau, del Nido and Geva8,Reference Theocharis, Viola, Papamichael, Kaarne and Bharucha13,Reference Geva, McMahon, Gauvreau, Mohammed, del Nido and Geva16,Reference Lopes, Lourenço, Gonçalves, Cruz and Maciel19–Reference Anderson, Tingo, Glickstein, Chai, Bacha and Torres21 as patients with membranous subaortic stenosis were predominantly boys. Unlike previous studies, we did not observe any overrepresentation of females in the patient group with disease recurrence. Reference Devabhaktuni, Chakfeh, Malik, Pengson, Rana and Ahsan3,Reference Massé, Shar, Brown, Keswani, Grande-Allen and Sucosky10 The age at diagnosis (median 2.3 years) as well as age at primary surgery (median 5.3 years) corresponded well with data from other studies. Reference Pickard, Geva, Gauvreau, del Nido and Geva8,Reference Donald, Naimo and d’Udekem12,Reference Abushaban, Uthaman, Selvan, Al Qbandi, Sharma and Mariappa20
The prevalence of other CHD including valvular AS (53%) was consistent with previous studies, Reference Choi and Sullivan7,Reference Abushaban, Uthaman, Selvan, Al Qbandi, Sharma and Mariappa20 although the reported prevalence of specific diagnoses has varied between studies. Valvular AS tended to be more common in patients who developed recurrence (p ≈ 0.053). Although several patients had both membranous subaortic stenosis and valvular AS, surgical correction of valvular AS through commissurotomy occurred in only 1/6 cases. As membranous subaortic stenosis and valvular AS may preferentially be corrected simultaneously, it would be valuable to explore whether valvular AS is routinely corrected during surgery for membranous subaortic stenosis in other cohorts.
Interestingly, we observed a relatively high prevalence of genetic conditions and/or developmental delay in the patient cohort, which has not been observed in previous retrospective studies of membranous subaortic stenosis. Reference Pickard, Geva, Gauvreau, del Nido and Geva8
Lastly, it seems that there is no strong correlation between left ventricular hypertrophy and ECG-changes in sV1 and rV6. While 92% demonstrated left ventricular hypertrophy based on echocardiographic measurement of the diastolic septal wall thickness, only 22 and 3% exhibited signs of left ventricular hypertrophy based on ECG leads sV1 and rV6, respectively. ECG and echocardiographic measurements were concordant for only 3 patients (14%) with left ventricular hypertrophy. ECG may, therefore, not be considered a sensitive indicator for cardiac hypertrophy in patients with membranous subaortic stenosis.
Limitations
Although all eligible patients, i.e. half of all patients with membranous subaortic stenosis in Sweden surgically treated between 1994 and 2019, were included in the current study, the sample size and study power were limited. Modest, clinically significant differences between groups may therefore have been overlooked. This may, for example, have been the case when patients with and without disease recurrent were compared for a number of putative predictor variables of recurrence. The results of the conducted statistical tests should be considered exploratory.
As patients treated over the span of three decades were included in the study, clinical protocols for echocardiographic examinations and assessment of valvular regurgitation may have changed over the course of the study. Furthermore, the follow-up time was restricted to 18 years of age, resulting in a relatively short follow-up time in some cases.
Lastly, there are different perspectives on how to define recurrence of membranous subaortic stenosis; should it be limited to severe cases requiring reinterventions or should it include milder relapses as well? If so, what threshold-gradients should be used? In this study, we defined recurrence to include both patients who underwent reintervention and those with moderate disease progression after the primary intervention. This broader definition addresses the gap in literature that often focuses only on reinterventions. While predictors for reintervention are important, identifying predictors for less severe recurrences is also vital due to the less favourable prognosis for these patients.
Conclusions
Surgery for membranous subaortic stenosis is an effective therapy but has a high rate of recurrence and reintervention. A clear correlation exists between high pre- and postoperative peak gradients. Development of symptoms is associated with a high preoperative peak gradient. Low postoperative peak gradients may be important for avoiding recurrence.
Acknowledgements
We thank Mrs. Ingegerd Tiblad for excellent secretarial work especially with her continuous work with the local surgical registry over the years.
Financial support
This work was supported by grants from the Swedish state under the agreement between the Swedish government and the county councils, the ALF agreement (SU 2018-0427).
Competing interests
None.
Ethical standard
This study was conducted following approval of the local ethics committee at the University of Gothenburg (DNR 518-16 including supplementary application). The study was limited to retrospective follow-up after surgical treatment of CHD, and all personal data were anonymised and encrypted prior to publication. Patients were, therefore, not individually asked to participate.


 Open access