


Introduction
Skyrocketing youth unemployment during the 2008 Great Recession led Mario Draghi – who was president of the EU Central Bank at the time – to famously declare that ‘the European social model has already gone when we see the prevailing youth unemployment rates in some countries’. Between 2008 and 2012, seventeen EU member states recorded their historically highest rates of youth unemployment, with a 50.6 per cent increase throughout the entire EU-28.
EU institutions came under increasing pressure to tackle the deepening economic and employment crisis and responded by launching a succession of socially orientated ‘pacts’ and ‘packages’, specific policy measures and recommendations (Zeitlin and Vanhercke, Reference Zeitlin and Vanhercke2018). Against this backdrop, a Recommendation of the Council of the European Union established the Youth Guarantee (YG) on April 22nd 2013 (Council of the European Union, 2013), as a political commitment to ensure that all young people under 25 years of age would receive a high-quality offer of employment, continued education, apprenticeship or traineeship within 4 months of becoming unemployed or leaving formal education. To financially support this policy, the EU turned to the European Social Fund and created the Youth Employment Initiative (YEI) as the main financial resource to support the implementation of the YG. YEI funding was made available to member states with NUTS 2 (Nomenclature of Territorial Units for Statistics)Footnote 1 regions where the youth unemployment rate exceeded 25 per cent in 2012. The regional unemployment rate in 2012 served thus as a benchmark, and policy measures were calibrated to respond to the economic challenges associated with that level of youth unemployment.
The establishment of the YG and YEI explicitly addressed youth labour market integration in European regions, with expected impact going beyond the individual level and contributing to European targets regarding employment, NEET rates, early school leaving and social exclusion. The adoption of the YEI, as a dedicated EU fund aimed at strengthening the implementation of the Youth Guarantee, goes beyond the previous ‘regulatory’ approach that had been the norm in EU social policy. For this reason, some scholars consider the Youth Guarantee as ‘one of the most ambitious employment policies’ ever launched by the EU (Andor and Vesely, Reference Andor and Veselý2018, p.4). The Youth Guarantee framework was also amongst the first EU social policy instruments to openly consider regional disparities as a guiding criterion for policy implementation. Despite the specific territorial dimension of the YEI, which affects its design, funding and implementation, this policy has not been systematically assessed at the regional level (NUTS 2) thus far. Most analyses on the YG and the YEI have focused on cross-country comparison (Escudero and Lopez Mourelo, Reference Escudero and López Mourelo2015, Reference Escudero and López Mourelo2017; Dingeldey et al., Reference Dingeldey, Steinberg and Assmann2019); whilst systematic cross-regional investigations have been limited (see EC, 2020b), as scholars rather targeted selected regional case studies (Dhéret and Roden, Reference Dhéret and Roden2016), or regions within one or two EU countries (Emmanouil et al., Reference Emmanouil, Chatzichristos, Herod and Gialis2023).
This paper aims to fill this gap by assessing the impact of the YEI on labour market and educational outcomes of young people in beneficiary EU regions that received funding between 2014 and 2018. We adopt an economic geography perspective that aligns with research advocating for the analysis of subnational disparities in socio-economic and employment outcomes (Ejrnaes et al., Reference Ejrnæs, Jensen, Schraff and Vasilopoulou2024; Kapitsinis et al., Reference Kapitsinis, Poulimas, Emmanouil and Gialis2024; Cefalo and Scandurra, Reference Cefalo and Scandurra2023; Iammarino et al., Reference Iammarino, Rodriguez-Pose and Storper2019; Kazepov and Cefalo, Reference Kazepov, Cefalo, Kazepov, Cucca, Barberis and Mocca2022).We examine the effect of the YEI on regional youth labour market and education outcomes, using regionalised (NUTS 2) data and newly available evidence on EU budget payment data. The analysis therefore covers the EU NUTS 2 regions that received YEI funding between 2014 and 2018. Our assessment focusses on regional outcomes related to youth employment, NEET rates and early school leaving, as officially stated targets of the YG program and of the YEI. Our contribution to the literature is manifold, as we provide comparative, longitudinal and EU-wide evidence that advances the understanding of the territorial impact of social policies on crucial social outcomes at subnational level (Ejrnaes et al., Reference Ejrnæs, Jensen, Schraff and Vasilopoulou2024). The results also have significant implications for policymaking, as they offer the first comparative and regional evidence on the effects of the YEI funding.
The article is structured as follows. The following section provides a brief description of the adoption and regulatory framework of the YG and YEI, it reviews the available evidence on YG implementation and outlines the hypothesis. Section 3 describes the data and methodology, while section 4 presents the findings of the analysis on YEI funding and its impact. Finally, section 5 discusses the results and their significance for EU social and cohesion policies.
Youth Guarantee and Youth Employment Initiative in European regions
Policy provision and regional inequality in Europe
Several authors in recent years observed that comparative social policy and political economy analyses tend to focus on cross-country comparison, thus overlooking subnational variation (Greer et al., Reference Greer, Elliott and Oliver2015; Ciccia and Javornik, Reference Ciccia and Javornik2019). The need of spatially sensitive analysis in comparative research stems instead from the crucial role played by local specificities that constitute the context within which policies are implemented and with which multilevel regulatory jurisdictions must cope (Kazepov and Cefalo, Reference Kazepov, Cefalo, Kazepov, Cucca, Barberis and Mocca2022). Research investigating the complex relationship between policies, spatial contexts and inequalities shows that public policy provision has a territorial reach, and at the same time, is moulded by spatial contexts (Keating, Reference Keating2021). These claims are backed by several contributions that highlight the influence of subnational contexts on key social outcomes such as labour market integration, educational outcomes, economic growth and even olitical discontent (Rodriguez-Pose and Dijkstra, Reference Rodríguez-Pose and Dijkstra2021; Ejrnaes et al., Reference Ejrnæs, Jensen, Schraff and Vasilopoulou2024; Iammarino et al., Reference Iammarino, Rodriguez-Pose and Storper2019). Cefalo and Scandurra (Reference Cefalo and Scandurra2023) found that the impact of national provision in active labour market policies is significantly mediated by regional traits related to the local economic structure. Additional country-based and small-n comparisons also confirm the existence of territorially differentiated effects of social policies and specifically active labour market polices (Bachtler & Begg, Reference Bachtler and Begg2017; Wapler et al., Reference Wapler, Wolf and Wolff2022; Scalise and Hemerijck, Reference Scalise and Hemerijck2024). As for young people, recent investigations found significant variation in youth employment, unemployment and NEET rates at regional level (Cefalo et al., Reference Cefalo, Scandurra and Kazepov2024). Characteristics of the local labour market have a significant impact on youth labour market integration and on the NEET phenomenon (Morris, Reference Morris2023), such as higher levels of regional gross domestic product (GDP), the innovative content of the economy and the degree of sectoral specialisation in high-skilled sectors or in sectors that tend to attract high shares of youth employment (Cinquegrana et al., Reference Cinquegrana, De Luca, Mazzocchi, Quintano and Rocca2023; Scandurra et al., Reference Scandurra, Cefalo and Kazepov2021a,Reference Scandurra, Cefalo and Kazepovb).
Further, a significant tradition of studies on regional inequalities addresses the various components of the EU’s Cohesion Policy and its territorial approach (Mendez, Reference Mendez2013; Bachtler and Egg, Reference Bachtler and Begg2017), emphasising the role played by the local economic context and regional institutions in determining its effectiveness (Fratesi and Wishlade, Reference Fratesi and Wishlade2017). Scholars highlighted the impact of the EU Cohesion funds and regional inequalities on political participation, resilience and employment (Fusaro and Scandurra, Reference Fusaro and Scandurra2023). We know less, instead, on the specific effects of the different component of EU cohesion investments (Bachtler et al., Reference Bachtler, Polverari, Domorenok and Graziano2024). Case in point, the YEI is of specific interest for studying the territorial effects of European social policies, as a supranational EU fund that financed the subnational implementation of the Youth Guarantee in eligible regions within EU member states.
Background of the YG and how the YEI works
Young people were particularly affected by the Great Recession of 2008 and its aftermath, which led to high risks of unemployment, social exclusion and scarring effects on youth biographies (see, for instance, Bell and Blanchflower, Reference Bell and Blanchflower2011); as well as the multiple disadvantages associated with being out of employment and education (Jonsson & Norvell Gustavsson, Reference Jonsson and Norvell Gustavsson2024). After a long political bargaining, a Recommendation of the Council of the European Union established the Youth Guarantee (YG) in 2013, calling on all member states to adopt implementation plans. Articles 16–23 of Regulation (EU) No. 1304/2013 on the European Social Fund established the YEI fund, totalling 8.9 billion euros for the period 2014–2020, to encourage national implementation.
The YEI was integrated in the European Social Fund (ESF) programming and directly targeted young people not in employment, education or training, differently from the ESF, which supports systems and structures. Projects approved under this frame received an allocation from the YEI and a matching allocation from the ESF that was to be co-financed by the member state. The amount allocated from the YEI did not require national financing. Member states were able to invest in the implementation of the YEI from September 1st 2013 onwards, with the opportunity to claim reimbursement of the expenditure after the operational programmes had been formally adopted. Whilst the implementation of the YEI ended in 2020 and was then integrated into the European Social Fund Plus (ESF+), most member states only launched their activities late in 2015 or even in 2016 (ECA, 2017). The funding has been initially committed (i.e. engaged in the EU budget) for the first 2 years of the 2014–2020 implementation period, with the possibility for YEI resources to be revised upwards from 2016 (Regulation (EU) 1311/2013).
Overall, the main objective of the YEI was to increase the employability of NEETs by impacting employment and other related outcomes (Escudero and Lopez Mourelo, Reference Escudero and López Mourelo2015) in the worst-affected EU regions. YEI eligible regions were identified as NUTS 2 regions where the youth unemployment rate for young persons aged 15–24 years was higher than 25 per cent in 2012 and, for member states where the youth unemployment rate has increased by more than 30 per cent in 2012, regions that had youth unemployment rates of more than 20 per cent in 2012 (Regulation (EU) 1304/2013). Resources have been allocated calculating the ratio between the unemployed young persons in every eligible region and the total number of unemployed young persons in all eligible regions. The allocation for each member state was then the sum of the allocations for its eligible regions (Regulation (EU) 1303/2013, Annex VIII). Whilst the amount of allocated funding has been established using regional unemployment rates, funding was transferred to the member states as a support for national implementation of the Youth Guarantee, and not directly to regional governments. Furthermore, member states could decide to allocate an amount not exceeding 10 per cent of the funds under the YEI to regions with high youth unemployment levels that would, however, fall outside the eligible NUTS 2 regions. This aspect implies that the funding that each region received depended was also, to some extent, the result of political negotiations (Fusaro and Scandurra, Reference Fusaro and Scandurra2023) as well as of administrative capacities in spending resources (Tosun, Reference Tosun2014).
Implementation and impact of the Youth Guarantee
Operational national schemes were based on the European Youth Guarantee policy framework and must meet certain criteria, but their design and implementation varied (Escudero and Lopez Mourelo, Reference Escudero and López Mourelo2015). National YG schemes entail three kinds of measures: (i) education and training for employment, including the provision of professional guidance for early school leavers from education and training (ELET) to return to education; (ii) employment intermediation services; and (iii) active labour market policies (ALMPs) such as hiring subsidies, public work programmes and start-up incentives. Whilst most eligible member states presented national plans for the implementation plan for the YG, in some countries territorial implementation was part of the design from the onset: for instance, France presented twelve regional operational programmes in addition to the national one and Belgium’s plan included four distinct sub-plans established at the regional/community level (Wallonia and Brussels). It is important to note that the funding from YEI was directed towards actions directly targeting NEETs, whilst the matching ESF funding would support systems and institutions, such as the Public Employment Services (PES), in accordance with the Council’s Recommendation on Establishing a Youth Guarantee.
The provision and actual spending of funding varied across member states, reflecting disparities in fiscal pledges and administrative inefficiencies that resulted in delayed payment processing throughout most jurisdictions (ibid.). Early reports on implementation provide key information on the procedures of planning, expenditure and delivery of interventions targeting young people in eligible countries. Dingeldey et al. (Reference Dingeldey, Steinberg and Assmann2019) argue that the implementation of the YG has been strongly path dependent, largely reproducing pre-existing approaches to domestic youth unemployment policies. Escudero and Lopez Mourelo (Reference Escudero and López Mourelo2017) show that, 3 years after the launch of the YG, the member states have established eligibility criteria for young people to access YG interventions, developed specific measures targeting the most vulnerable young people and undertaken important steps towards the execution of most of the planned measures (ECA, 2017). Most countries assigned priority to skills upgrading (traineeships and apprenticeships) and to measures aimed at reducing school dropout (Escudero and Lopez Mourelo, Reference Escudero and López Mourelo2017). Likewise, all member states planned to implement labour market intermediation services to facilitate the matching between the supply and demand of labour, whilst the adoption of programmes aimed at increasing labour demand such as hiring incentives, start-up incentives and job creation programmes was more mixed (ECA, 2017). Data on the monitoring of the European YG suggest that a significant share of youth enrolled in a national YG scheme had been registered for several months. The general difficulty to deliver interventions within 4 months might indicate the presence of a higher share of youth that is especially hard to place, together with the lack of an adequate institutional framework to assist them effectively (Escudero and Lopez Mourelo, Reference Escudero and López Mourelo2017). According to Kraatz (Reference Kraatz2017), many young people repeatedly returned to NEET status and to a Youth Guarantee scheme after taking up an offer of temporary employment, often of low quality and short duration.
Notwithstanding the territorial approach to financing and provision, to our knowledge a comparative systematic assessment of YEI impact at the regional level is missing. Most research uses countries as main unit of analysis (Escudero and Lopez Mourelo, Reference Escudero and López Mourelo2015, Reference Escudero and López Mourelo2017; Monti, Reference Monti2022), whilst some reports provide non-systematic insights on selected regional case studies (Dhéret and Roden, Reference Dhéret and Roden2016; Emmanouil et al., Reference Emmanouil, Chatzichristos, Herod and Gialis2023). Evaluations and impact assessments of the 2014–2020 cohesion policy in the EU regions provide a regional perspective but do not allow for singling out the effect of the YEI funding (EC, 2020a, b, 2022). Cross-national reports adopt a comparative perspective – systematic or by selection of a group of significant countries – whilst country reports delve into procedures and outputs for a specific member state. Finally, most reports target the implementation and impact of the YG, but do not focus specifically on the YEI in their analysis.
Macroeconomic impact evaluation of the EU Commission assesses that EU Cohesion Policy funding (including ESF/YEI funding) produce aggregate returns on top of the direct positive results for participants, although at a modest rate (EC, 2022). The YEI evaluation report also suggests that funding was mostly directed to regions in need, although monitoring data on expenditure and participants was organised through larger regional clusters due to limitations in data availability (EC, 2020b). In terms of employment outcomes of the YG and the YEI, the European Commission identifies an overall improvement of young people’s labour market performance 5 years after the Youth Guarantee took off (EC, 2018a,b), with reduced youth unemployment and NEET rates in most EU countries. The European Commission (2020b) also stated that the rate of young participants making the transition to employment generally improved over time, adding that, without EU funding, fewer young people not in employment, education or training would have received support, and the overall NEET population would have been higher. Caliendo et al. (Reference Caliendo, Kluve, Stoeterau, Tübbicke, Dheret, Hadjivassiliou and Pastore2018) claim that the YEI and the European Social Fund played a key role in supporting YG measures financially, especially for countries with high NEET rates and facing significant economic downturns.
Country-based and comparative studies highlighted limitations to YG measures’ effectiveness, such as size of resources, lack of favourable institutional and socio-economic conditions for implementation and difficulties in reaching the most vulnerable groups of the youth population (Selenko and Pils, Reference Selenko and Pils2016). Emmanouil et al. (Reference Emmanouil, Chatzichristos, Herod and Gialis2023) assess the YG policy in Spain and Italy and emphasise institutional inefficiencies related to the offers of temporary employment as well as to the underestimation of the role played by spatial disparities in the demand of labour. Tosun et al. (Reference Tosun, Treib and De Francesco2019) provide an analysis of policy outputs of the YG that yields a mixed picture and emphasises again the crucial issue of implementation networks. Other authors support this position, stating that well-supported PES as well as regional administrative capacities are required for YG measures to reach positive youth employment outcomes (Pastore, Reference Pastore2019). Escudero and Lopez Mourelo (Reference Escudero and López Mourelo2017) found that efforts made to comply with the requirements of the YG have varied across countries, according to the degree of adjustment requested – whether it was creating policies and institutions or adapting existing schemes – and to the characteristics of the work demand. Together with implementation/related factors, the role of concurring macroeconomic and structural factors should therefore be considered (Papadakis et al., Reference Papadakis, Amanaki, Drakaki and Saridaki2020; Scandurra et al., Reference Scandurra, Cefalo and Kazepov2021a) when assessing the impact of the YG and the YEI.
As for the difficulties in reaching out to the most vulnerable groups, this concern refers to studies highlighting that active labour market policies might in fact contribute to rising inequalities through ‘Matthew effects’ that most benefit those who are already better off. Bonoli and Liechti (Reference Bonoli and Liechti2018) showed that Matthew effects are strongest in programmes that require certain levels of cognitive skills, such as in the case of training, which is a prominent feature of YG interventions. Cefalo and Scandurra (Reference Cefalo and Scandurra2023) added a territorial element to the issue, observing that the benefits of training interventions are captured mostly by youth in more specialised and growing regions.
Research hypotheses
The YG, and consequently the YEI, have a broad scope whose impact goes beyond specific measures to affect aggregated outcomes of youth participation in education and labour market integration (Andor and Vesely, Reference Andor and Veselý2018; Escudero, Reference Escudero2018). Accordingly, we expect YEI funding to affect both youth labour market and educational outcomes, formulating the following hypothesis:
-
H1. YEI funding exerted a negative effect on regional NEET rates and regional youth unemployment rates, whilst having a positive effect on regional youth employment rates.
-
H2. YEI funding had a negative effect on regional early school leavers from education and training rates.
Further, a significant body of YG assessment underscores the role played by the regional economic contexts – specifically the demand of work – on youth labour market integration, which can subsequently affect the impact of the YEI. This suggests that better-off regions may benefit more from active labour market measures, potentially leading to unintended consequences of re-enforcing spatial inequalities (Cefalo and Scandurra, Reference Cefalo and Scandurra2023).
We expect that:
-
H3. YEI funding had a more pronounced effect in regions characterised by higher levels of economic development.
-
H4. YEI funding had a reduced impact in regions with higher levels of youth unemployment in the benchmark year used to calibrate the policy effort (i.e. 2012).
Research design and data
This article conducts a systematic investigation of the regional impact of the YEI on youth employment and educational outcomes. Regional data on outcomes and socio-economic contexts were retrieved from Eurostat at Nomenclature of Territorial Units for Statistics (NUTS) level 2. We complemented Eurostat data with data on EU regional expenditures, using as our proxy for YEI the modelled regionalised EU payments of the Youth Employment InitiativeFootnote 2 , between 2014 and 2018.
Our empirical strategy follows a three-step sequence. The first segment provides a descriptive overview of YEI funding allocated at NUTS 2 regions. The second segment investigates the effect of YEI funding (in log) on regional youth outcomes, covering the EU NUTS 2 regions that received YEI funding between 2014 and 2018. Given the limited sample of regions and years, we provide alternative specifications of the model as robustness test, showing that the main relationship of interest maintains the same direction with similar magnitude of the effects estimated. Our model specifications include fixed effects, first difference and autocorrelated feasible general least squares regression (FGLS). Finally, the third segment reports the marginal effects of YEI funding conditioned on regional GDP and problem pressure, that is, the youth unemployment rate level in 2012. Throughout all model specifications we deploy country-fixed effects to control for unobserved time-constant variables at the national level, affecting regional configurations. The empirical evidence reviewed confirms that national governments need to be controlled for in the analysis to avoid replacing methodological nationalism with ‘methodological subnationalism’ (Garritzmann et al., Reference Garritzmann, Röth and Kleider2021).
This brings us to the main limitation of our analysis, as we could not include accurate proxies for implementation structures, such as the capacity of public employment services and the presence of strong regional networks of stakeholders (Kazepov and Cefalo, Reference Kazepov, Cefalo, Kazepov, Cucca, Barberis and Mocca2022; Escudero and Lopez Mourelo, Reference Escudero and López Mourelo2015, Reference Escudero and López Mourelo2017), due to the lack of nuanced institutional data at the subnational level, providing a comparable and longitudinal measure of regional administrative capacity in the provision of ALMPs. Measures of institutional quality, decentralisation and absorption have been used to explain the performance of the EU Cohesion Policy (Charron et al., Reference Charron, Dijkstra and Lapuente2014; Tosun, Reference Tosun2014; Bachtler et al., Reference Bachtler, Polverari, Domorenok and Graziano2024). However, these indicators offer all-encompassing and general measurements that risk suffering from compensation effects and thus hampering interpretation when the goal is to single out specific policy (sub-)sectors (Ciccia and Javornik, Reference Ciccia and Javornik2019), as in the case of the YEI. For this reason, in this study we opt for restricting our focus to the effect of YEI and the regional economic context, leaving the disentangling of sectoral-specific institutional differences for future research endeavours. Along this direction, the fixed-effect specification allows us to control for unobserved time invariants that could confound the relationship between dependent and independent variables of interest, such as different but relatively stable configurations of institutions and stakeholders that may affect the implementation of YG interventions (Emmanouil et al., Reference Emmanouil, Chatzichristos, Herod and Gialis2023).
Dependent variables: measures of youth integration
We assess the effects of YEI on a set of proxies of regional aggregated outcomes of youth labour market integration, which were selected on the basis of the goals of the YG programme (Council of the European Union, 2013). We use the following indicators: NEET rates (age 15–29 years), youth unemployment rates (15–24 years), employment rates (25–34 years) and ELET rates (18–24 years), all aggregated at NUTS 2 level and retrieved from EUROSTAT (European Labour Force Survey). The NEET rate measures the share of young people out of employment, education and training. This indicator is a crucial target of the YEI, as research has shown that being NEET predisposes young people to long-term unemployment, social exclusion and vulnerability to economic shocks (Quintano et al., Reference Quintano, Mazzocchi and Rocca2018; Kapitsinis et al., Reference Kapitsinis, Poulimas, Emmanouil and Gialis2024). The YG originally targeted NEETs aged 15–24, but several countries opted for extending to 15–29 years. For this reason, we used the broader age range in our analysis. We include the youth unemployment rate 15–24 years because it served as the benchmark for calibrating the YEI allocation. Moreover, the ELETs (18–24 years) indicator captures the proportion of young adults whose highest level of education is below the International Standard Classification of Education (ISCED) level 3. Individuals within this category suffer considerable disadvantage as they are more likely to be out of employment and less likely to engage in further education and training than peers with a higher education. We use the employment rate for individuals aged 25–34 years to capture outcomes for young prime-age workers, ensuring comparability across different EU countries. When looking at aggregated youth employment outcomes, later and prolonged age ranges (e.g. 25–34 years instead of 15–29 years) can be recommended to account for different lengths in the transition to work across EU countries (Pastore et al., Reference Pastore, Quintano and Rocca2021), whilst also reducing the influence of different education systems (in terms of length and type of schooling) on employment outcomes. All the indicators we use are widely employed in youth labour market research and the differences in their age ranges reflect their underlying definition.
Independent variable: historic EU payments data at NUTS 2
Eurostat socio-economic statistics at the NUTS 2 level play a role in the calculation of the amount of cohesion policy financing allocated to each member states at the beginning of a ‘programming period’Footnote 3 . Once the national EU funding envelope is calculated by category of region, the member states propose how the financing will be managed through national and/or regional programmes. During implementation, once projects and operations are selected for support, the programmes report on the location of the projects using NUTS codes, meaning that the Commission has information on the ‘programme area’ mapping the NUTS 2 regions to each cohesion policy programme. Normally, the yearly breakdown of the dataset follows the cycle of the European Commission payments to the member states and not the date on which real expenditures took place on the ground. Over the budget periods, EU payments are made predominantly in reimbursement of expenditure actually incurred – with the notable exception of the partial pre-financing for the YE. Therefore, using the date of EU payments may distort the analysis of investments’ effects. To produce a more realistic estimate of the annual profile of expenditures, an estimate of the ‘real’ annual expenditure at NUTS 2 level was developed (EC, 2020a): in 2018 the Commission published a dataset covering multiple funds and programme periods with EU payments made by NUTS 2 regions, where payments by year are broken down by fund and programme period.
Control variables: the regional context
Differences in regional dynamics of economic development, labour market structure and demand have been shown to impact several socio-economic outcomes in literature on economic geography and spatial disparities (Dijkstra et al., Reference Dijkstra, Poelman and Rodríguez-Pose2020). Moreover, regional traits related to the labour market and economic development are relevant drivers of youth labour market integration (Cefalo and Scandurra, Reference Cefalo and Scandurra2021) that moderate the impact of national active labour market policies (Cefalo and Scandurra, Reference Cefalo and Scandurra2023). The role played by the economic cycle and the demand of work is also addressed in research on active labour market policies, although this relationship is not straightforward (O’Higgins, Reference O’Higgins2017): some studies support the idea that ALMPs can mitigate the negative employment effects of a recession (Bassanini and Duval, Reference Bassanini and Duval2006), whilst others identify stronger unemployment reducing effects of ALMPs during expansionary periods and stronger employment enhancing effects in better-off regions with specialisation in innovative service sectors (Escudero, Reference Escudero2018; Cefalo and Scandurra, Reference Cefalo and Scandurra2023). We use longitudinal data on GDP per capita in purchasing power standard in relation to the EU average (st to 100) and gross valued added (GVA) growth rate, as they are widely used in literature on regional inequalities to proxy the economic development of a region (Iammarino et al., Reference Iammarino, Rodriguez-Pose and Storper2019; Di Cataldo and Rodriguez-Pose, Reference Di Cataldo and Rodrıguez-Pose2017). Further, we proxied the regional demand of work, in terms of innovation and sectoral specialisation, with the percentage of high educated employment in science and technology, retrieved from Eurostat – European Regional Accounts, which is associated to innovative performance, regional concentration of technological resources and increased youth employment outcomes (Diemer et al., Reference Diemer, Iammarino and Rodrıguez-Pose2022; Fusaro and Scandurra, Reference Fusaro and Scandurra2023).
Findings
Descriptive analysis: regional traits and YEI funding
The provision of YEI funding was attached to territorial criteria related to regional youth unemployment at one point in time, precisely in 2012. The result is a sample of worst-performing EU regions with degrees of internal variations, because in some regions the aftermath of the economic crisis was lingering on, whilst others started showing signs of partial recovery. The amount of funding for eligible regions was initially calculated as the ratio of unemployed youth in the region and the total number of youth unemployed in all the regions that received funding.
In Figure 1 we plot EU regions according to the intensity of funding, that is, the YEI funding received per unemployed young person. The figure confirms that the disbursement of YEI funding mostly followed the geography of youth unemployment in 2012 (Figure 2 Footnote 4 ) as outlined by initial EU allocationFootnote 5 (Bussi, Reference Bussi2014).
Regions receiving YEI funds by intensity, expressed in EUR per unemployed person (NUTS 2 regions, 2014–2018).
Source: Eurostat online database and cohesion data on historic EU payments.

Regional youth unemployment rate 15–24 years in 2012 (NUTS 2 regions).
Source: Eurostat online database.

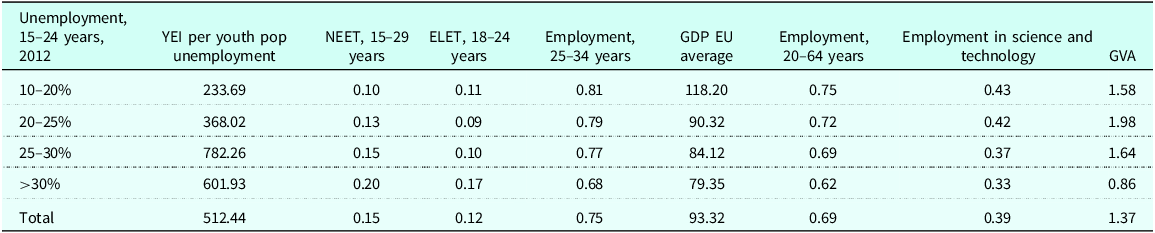
In Table 1, we focus on regions that received YEI funding, differentiating by level of unemployment in 2012. The funding generally decreases as unemployment and NEET rates decrease. Due to the discretionary component of national implementations, seventy-six regions with youth unemployment rate below 25 per cent in 2012 still received YEI funding, though usually with less intensity. Finally, it is worth noticing that the worst-off regions with very high youth unemployment rates tend to exhibit a profile of multiple disadvantages: very low employment and youth employment rates, as well as employment in science and technology and GVA. This is indicative of highly difficult conditions related both to the economy and the (youth) labour market. Further, the linear trend of increase in YEI funding by unemployment does not hold true for particularly disadvantaged regions with more than 30 per cent of youth unemployment in 2012. Interestingly, the regional GDP does not show significant variation across these groups, indicating that economic performance alone does not fully explain the employment disparities.
Regional characteristics of NUTS 2 regions that received YEI funding, by youth unemployment level before YEI implementation (2012)

Source: Author elaboration on Eurostat database and EU cohesion data.
The impact of YEI
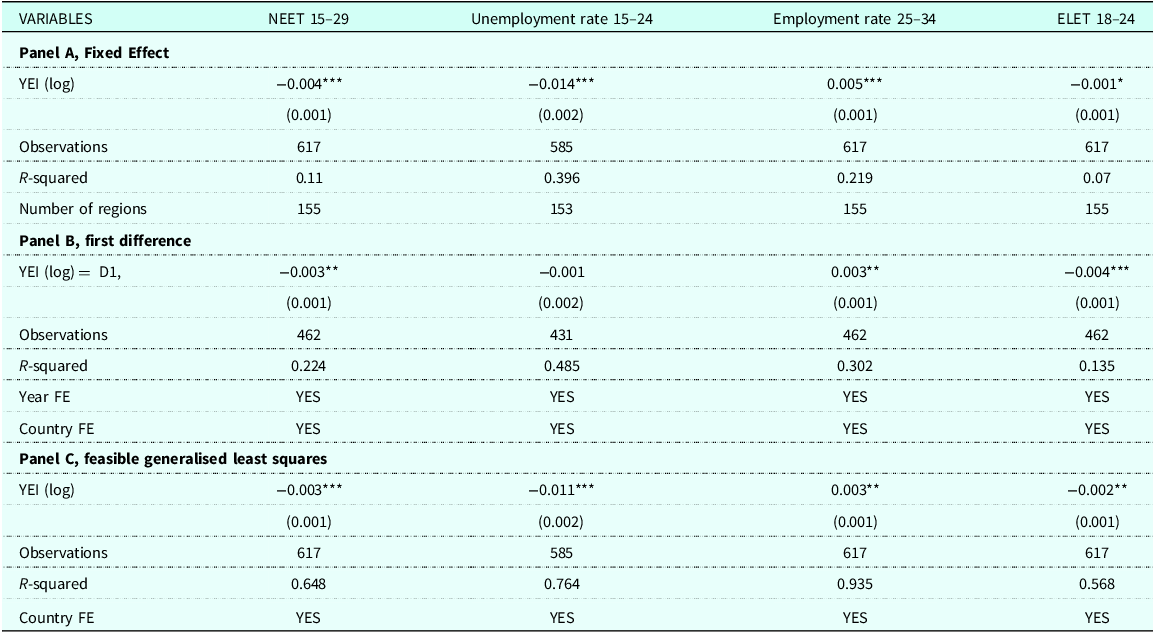
We used different estimates of the impact of regional YEI on pivotal employment and educational outcomes for young individuals within NUTS 2 regions across the EU throughout the timeframe 2014–2018. Table 2 summarises the findings resulting from three different statistical model specifications (fully presented in Tables A1–A3). To start with, a fixed-effects regression model was utilised to elucidate the relationship between YEI and outcomes (panel A). The analysis encompassed 617 observations spanning 155 NUTS 2 regions for the period considered, incorporating robust standard errors to mitigate potential heteroskedasticity. The model also adjusts for several covariates of interest, including GDP per capita, the proportion of tertiary educated in science and technology fields and the real growth rate of GVA. Further, Table 2 reports two different statistical model specifications: first difference (panel B) and feasible generalised least squares (panel C). The consistency of the results across different specifications underscores the robustness of YEI’s impacts on important labour market and educational outcomes for youth. Despite the methodological differences, the direction of the effects remains consistent.
YEI estimates on youth employment and educational outcomes across three model specifications, NUTS 2 regions 2014–2018

Notes: Robust standard errors in parentheses *** p < 0.01, ** p < 0.05, * p < 0.1.
Source: Author elaboration on Eurostat database and EU cohesion data.
Across all three specifications, the logarithm of YEI funding tends to show statistically significant effects. YEI funding has a negative effect on the NEET rates, as the coefficient for YEI (log) is negative and significant in all panels. The findings indicate that an incremental unit increase in the logarithm of YEI funding is concomitant with a statistically significant decrement in the NEET rate. Similarly, YEI (log) has a negative effect on youth unemployment, suggesting a significant decrease in the unemployment rate, particularly notable in panels A and C, though not statistically significant in panel B. The impact of YEI on the employment rate amongst 25–34 year olds is positive and significant across all specifications, signifying a 0.5 percentage point increase in labour market engagement within this cohort (panel A) due to YEI interventions. The effect of YEI on reducing the ELET rate shows statistical significance in panels A and C, with a stronger negative impact observed in panel B, suggesting some variability in the magnitude of the effect across models but a consistent direction of impact.
This evidence posits that YEI interventions had a limited but significant effect that contributed to diminishing the proportion of NEETs and unemployed youth. Furthermore, the analysis reveals a beneficial impact of YEI on enhancing the employment rate (25–34 years) and reducing early school dropout rates. These outcomes confirm hypotheses 1 and 2. Nonetheless, it is imperative to acknowledge that these effects do not exclude limitations of YEI’s efficacy in further decreasing NEET and ELET rates, potentially attributable to implementation flaws and to the inherent challenges in engaging these target demographics due to the multifaceted barriers these groups face, which may not be fully ameliorated through policy activation alone. Overall, the consistency of the results reinforces the credibility of the findings. Further, the R-squared values across the models indicate a good fit, particularly in panel C (feasible generalised least squares).
Interestingly, when considering the set of controls related to the labour market and contextual economic conditions, the direction and significance of the associations appear to be less consistent (Tables A1–A3). The impact of GDP has minimal effects, and the p-test is often not significant. Accordingly, the marginal effect of YEI conditional on GDP does not elicit significant differences amongst groups of regions (Figure 3). Stronger effects are observed for the demand for work, such as the share of tertiary-educated individuals employed in science and technology, which has a negative effect on NEET rates and a positive effect on employment rates, although not always statistically significant.
Marginal effect of YEI on youth employment and educational outcomes (NEET rate, youth unemployment rate, employment rate, ELET rate) by GDP as % of EU average.
Source: Author elaboration on Eurostat database and EU cohesion data.

GDP coefficients could possibly be explained by the selection of regions, limited by the actual provision of YEI funding, which implies a reduced variation in GDP and GVA within the observed period. Additionally, the findings could suggest some sort of anti-cyclical effect of the YEI funding, indicating that the impact of funding and service provision is not heavily dependent on the economic situation. However, the weak effects and composition of the sample make this interpretation tentative and should be verified through specifically focused investigations. All in all, our findings did not find a confirmation of heterogenous effects on the basis of regional GDP and we did not find conclusive evidence confirming hypothesis 3.
Figure 4 presents a visual representation of the relationship between the YEI spending and the outcomes of interest (further explored in Table A4). The graph illustrates the differential impact of the YEI in two groups of regions: those with youth unemployment rates below 30 per cent in 2012 (seventy-five regions) and those with rates exceeding 30 per cent (eighty regions). The expected relationship is that NEET, youth unemployment rate (YUR) and ELET levels decline (negative slope), whilst employment rate (ER) increase. This expectation aligns with the downward slopes for NEET and YUR and with the upward slope for ER. The findings indicate that the effectiveness of the YEI interventions was slightly influenced by the initial level of youth unemployment. In regions where youth unemployment rate surpassed 30 per cent in 2012, YEI funding is associated with a more significant reduction in youth unemployment rates, but also for NEET and ELET rates. On the contrary, in regions with a youth unemployment rate below 30 per cent, the impact of the YEI appears to be less pronounced, with minor decreases in NEET rates and a relatively stable employment rate amongst the 25–34 age group. This divergence in outcomes suggests a slight convergence over the period considered, as disadvantaged territories have a greater need for and are more responsive to the support provided by the initiative. Although we cannot definitively conclude that the YEI has a heterogeneous effect across GDP levels (see Figure 3), these findings suggest some evidence of convergence in youth educational and employment outcomes on the basis of the level of unemployment at the onset of YEI implementation, thus not confirming hypothesis 4.
Relationship between YEI spending (log) and outcomes (NEET rate, youth unemployment rate, employment rate, ELET rate) by the level of youth unemployment rate in 2012.
Source: Author elaboration on Eurostat database and EU cohesion data

Discussion and Conclusions
Since 2013, the Council and the European Parliament agreed to equip the YG with funding through the Youth Employment Initiative, a dedicated budget aimed at providing financial support to regions and individuals struggling the most with youth unemployment and NEETs. This article uses available evidence on the history of EU budget payment data to investigate the impact of the YEI on labour market and educational outcomes of young people in the EU NUTS 2 regions that received funding between 2014 and 2018. We engage with research on the implementation and impact of the YG (EC, 2020b) as well as with the debate on regional inequality (Iammarino et al., Reference Iammarino, Rodriguez-Pose and Storper2019) and youth labour market integration (Kapitsinis et al., Reference Kapitsinis, Poulimas, Emmanouil and Gialis2024; Scandurra et al, Reference Scandurra, Cefalo and Kazepov2021b).
The findings posit that YEI interventions contributed to alleviating youth unemployment during the period 2014–2018. We found positive effects of YEI funding on youth employment and negative effects on NEET, youth unemployment and ELET rates. This is in line with findings on aggregated effects of the YG, as well as the YEI and ESF (EC, 2020b; 2022; Fusaro and Scandurra, Reference Fusaro and Scandurra2023), whilst analysis on implementation and specific interventions points more towards ambiguities that might have hindered the effectiveness of the measures financed by the YEI (Escudero and Lopez Mourelo, Reference Escudero and López Mourelo2017).
Regional economic developments proxied by GDP and GVA were not significant mediators of the main effect. This finding could signify a counter-cyclical effect of the Youth Guarantee through the Youth Employment Initiative: the mix of interventions within the YG programme could enhance skills and employability, as well as participation in some form of subsidised employment-related activity that may act as stabiliser (O’Higgins, Reference O’Higgins2017). A higher qualification of the demand of work was associated with a stronger decrease of exclusion outcomes (NEET, unemployment and ELET) and increase of youth employment, supporting the idea that innovative economic activities are conducive to stronger opportunities for youth labour market integration (Kapitsinis et al., Reference Kapitsinis, Poulimas, Emmanouil and Gialis2024) and may enhance the effect of activation policies. In the case of the YEI, it seems that the advantage of more specialised and growing regions did not translate into territorial Matthew Effects (Cefalo and Scandurra, Reference Cefalo and Scandurra2023). Rather, the impact of YEI funding over time was slightly stronger in most deprived territories with some evidence of convergence (EC, 2022) amongst the EU regions that benefitted from YEI support. These insights may suggest that, in agreement with the European Commission’s latest estimations, the different YG policy interventions activated some labour market transmission mechanisms that supported a slow progress of catching up for regions with higher unemployment rates in 2012.
What we found provides a first systematic, regional and longitudinal assessment of the YEI, which should serve as an evidence basis for evaluating the Youth Guarantee as part of the overall EU cohesion policy and ESF programming. The YEI funding has contributed to the support of unemployed and inactive youth in aggregated terms, especially in the regions that have been most affected by the economic and financial crisis. At the same time, whilst some overall positive effects have been detectable even in the presence of structural flaws in public employment services and stakeholders’ cooperation (Tosun et al., Reference Tosun, Treib and De Francesco2019; Cabasés i Piqué et al., Reference Cabasés i Piqué, Pardell Veà and Strecker2016; Pastore, Reference Pastore2019), these crucial implementation issues should be addressed to increase the effectiveness of YG measures after the programming period 2014–2020. The evidence provided also points towards inherent challenges for the provision of multilevel policies by the European Union and by European countries that relate to the multifaceted barriers young people face in the regions they live or work, which may not be fully ameliorated through policy activation alone. These results support the need for cohesion policy investments in interventions that connect youth to local labour markets, or that help inactive young people to return to education by establishing solid bridges towards training and education providers.
Finally, this study presents some limitations. We are unable to assess the medium-term effect of the YEI since the available data only cover a period of 5 years (e.g. 2014–2018). Further, our focus was on the impact of expenditure on aggregated outcomes, rather than on implementation structures, which we controlled out through fixed effects specifications due to the lack of nuanced institutional data at the subnational level that hampered the possibility of accounting for them through systematic comparative analysis. Beyond aggregate results, further analysis should try to unpack what specific measures and institutional conditions – such as administrative capacity of public employment services – would yield a stronger effect or would amplify the effectiveness of YG measures.
Supplementary material
To view supplementary material for this article, please visit https://doi.org/10.1017/S0047279425101001
Notes on Contributors
Rosario Scandurra (PhD) is a Ramón y Cajal fellow (RYC2022-038527-I) at the Barcelona School of Management - University Pompeu Fabra and a senior researcher of the Globalisation, Education, and Social Policies (GEPS) research centre at the Faculty of Sociology, Autonomous University of Barcelona (UAB).
Ruggero Cefalo (PhD) is a tenure track assistant professor at the University of Firenze, Department of Political and Social Sciences, and a senior researcher fellow at the University of Vienna, Department of Sociology.
Financial Support
Rosario Scandurra is a Ramón y Cajal fellow (RYC2022-038527-I) funded by MICIU/AEI/10.13039/501100011033 and FSE+.
Competing interests
The authors declare none.


 Open access