

The amygdala is a complex brain structure, central to a wide range of mental processes and behavioral functions. While the amygdala historically has been implicated in fear and fear-related learning (Amaral, Reference Amaral2003; LeDoux, Reference LeDoux2003), more recent work suggests that it supports more subtle functions such as distributing the stimulus emotional significance, current value, or relevance (Morrison & Salzman, Reference Morrison and Salzman2010; Ousdal et al., Reference Ousdal, Jensen, Server, Hariri, Nakstad and Andreassen2008; Sander et al., Reference Sander, Grafman and Zalla2003; Zald, Reference Zald2003). Upon activation, the amygdala gives rise to a number of central and peripheral responses to facilitate information processing and appropriate behavioral responses (Davis & Whalen, Reference Davis and Whalen2001). Emotional stimuli are particularly strong instigators of amygdala activity (Sergerie et al., Reference Sergerie, Chochol and Armony2008), and individual variation in amygdala reactivity to negative emotional stimuli is associated with both complex behavioral traits (Etkin et al., Reference Etkin, Klemenhagen, Dudman, Rogan, Hen, Kandel and Hirsch2004; Hariri, Reference Hariri2009) and anxiety-related disorders (Shin et al., Reference Shin, Orr, Carson, Rauch, Macklin, Lasko, Peters, Metzger, Dougherty, Cannistraro, Alpert, Fischman and Pitman2004; Stein et al., Reference Stein, Goldin, Sareen, Zorrilla and Brown2002). As such, sources of individual variability in amygdala reactivity may point to mechanisms involved in the pathophysiology of these disorders.
The notion that variation in functional and structural indices of the amygdala has a genetic basis is supported from a number of studies. Twin studies of humans revealed that structural measurements of the amygdala have high heritability; in particular focal grey matter density has a heritability estimated at over 80% (Hulshoff Pol et al., Reference Hulshoff Pol, Schnack, Posthuma, Mandl, Baare, van Oel, van Haren, Collins, Evans, Amunts, Burgel, Zilles, de Geus, Boomsma and Kahn2006; Peper et al., Reference Peper, Schnack, Brouwer, van Baal, Pjetri, Szekely, van Leeuwen, van den Berg, Collins, Evans, Boomsma, Kahn and Hulshoff Pol2009). Other work has implicated common functional genetic variants in monoaminergic pathways genes as affecting amygdala reactivity to emotional stimuli and behavioral traits in humans (Hariri, Reference Hariri2009). The monoamines such as dopamine, serotonin, and norepinephrine are important modulators of amygdala activity (LeDoux, Reference LeDoux2007). Findings from both animal and human pharmacological neuroimaging studies indicate that increasing levels of dopamine, serotonin, and norepinephrine within amygdala potentiates its functioning, subsequently affecting downstream neurocircuits and related behaviors (Buffalari & Grace, Reference Buffalari and Grace2007; Burghardt et al., Reference Burghardt, Bush, McEwen and LeDoux2007; Takahashi et al., Reference Takahashi, Yahata, Koeda, Takano, Asai, Suhara and Okubo2005; van Stegeren et al., Reference van Stegeren, Goekoop, Everaerd, Scheltens, Barkhof, Kuijer and Rombouts2005).
Blood-oxygen-level-dependent (BOLD) functional magnetic resonance imaging (fMRI) has proven an effective and reliable tool for investigating individual differences in amygdala neural functioning (Manuck et al., Reference Manuck, Brown, Forbes and Hariri2007). The combination of fMRI and single gene data has yielded associations between amygdala reactivity and genetic variants affecting the expression of the serotonin transporter gene SLC6A4 (Hariri et al., Reference Hariri, Mattay, Tessitore, Kolachana, Fera, Goldman, Egan and Weinberger2002), the catechol-o-methyltransferase enzyme (COMT gene) (Smolka et al., Reference Smolka, Schumann, Wrase, Grusser, Flor, Mann, Braus, Goldman, Buchel and Heinz2005), and the monoamine oxidase A enzyme (MAOA gene) (Meyer-Lindenberg et al., Reference Meyer-Lindenberg, Buckholtz, Kolachana, Pezawas, Blasi, Wabnitz, Honea, Verchinski, Callicott, Egan, Mattay and Weinberger2006). All three gene variants affect synaptic clearance of monoamines, thus regulating monoaminergic neurotransmission. The low-expression variant of the MAOA gene results in increased levels of monoamines within the amygdala, and has been associated with diminished amygdala volume and hyperresponsive amygdala to emotional stimuli (Meyer-Lindenberg et al., Reference Meyer-Lindenberg, Buckholtz, Kolachana, Pezawas, Blasi, Wabnitz, Honea, Verchinski, Callicott, Egan, Mattay and Weinberger2006). Similarly, a low-expression variant, located in the promoter region of the serotonin transporter gene (the 5-HTTLPR S allele), has been consistently associated with heightened amygdala reactivity to emotional stimuli (Hariri et al., Reference Hariri, Drabant, Munoz, Kolachana, Mattay, Egan and Weinberger2005), increased serotonergic signaling, and reduced grey matter volume in the amygdala (Pezawas et al., Reference Pezawas, Meyer-Lindenberg, Drabant, Verchinski, Munoz, Kolachana, Egan, Mattay, Hariri and Weinberger2005). Together, these findings support an at least partially genetic explanation for variation in information processing within the amygdala. However, it is likely that the effect of single variants on amygdala reactivity is small (Hariri, Reference Hariri2009) and few variants have been discovered so far.
As mentioned, individual differences in amygdala neural activity have been linked to behavioral traits and even psychopathology. Therefore, the discovery of genetic variants contributing to individual variation in amygdala neural activity may subsequently point to molecular pathways involved in the pathophysiology of these disorders, and is thus important. Genome-wide association studies offer the possibility of interrogating the whole genome for variants affecting a given phenotype, uncovering novel candidate loci that affect amygdala function through pathways and molecular mechanisms currently unknown. To the best of our knowledge, this is the first genome-wide association study of amygdala activation in adults; however, a similar approach has been used in one study in adolescents (Liu et al., Reference Liu, Akula, Skup, Brotman, Leibenluft and McMahon2010). We combined genome-wide microarray genotype data with data from an emotional fMRI task and discovered a genomic region significantly associated with amygdala activation.
Materials and Methods
The TOP Study
Participants. Participants were recruited from the Thematically Organized Psychosis (TOP) study, an ongoing collaborative study involving the University of Oslo and Oslo University Hospital in Norway. There were 224 individuals (109 women) for whom both fMRI and genotype data were successfully collected (Table I). Participants were healthy individuals or patients with diagnoses of schizophrenia spectrum disorder, bipolar disorder, or psychosis not otherwise specified. Patients were recruited from the psychiatric unit of Oslo University Hospital and underwent the Structural Clinical Interview for DSM-IV Axis I disorders (SCID-I) administered by an MD or a clinically trained psychologist, to assess the presence of AXIS I disorders. Diagnostic reliability was satisfactory, Κ = .77, 95% CI [.60, .94] (Ringen et al., Reference Ringen, Lagerberg, Birkenaes, Engn, Faerden, Jonsdottir, Nesvag, Friis, Opjordsmoen, Larsen, Melle and Andreassen2008). Healthy control subjects were randomly selected from the Norwegian citizen registration of people living in the same catchment area and invited to participate by letter. Before participation, control subjects were screened to exclude serious somatic and psychiatric illness, substance abuse, or MRI-incompatibility. All subjects gave written informed consent before participation. The study was conducted at Oslo University Hospital, Norway, and approved by the Norwegian Data Inspectorate and the Regional Committee for Medical Research Ethics.
Demographic Variables from Norwegian TOP sample by rs10014254 Genotype Group

SD = standard deviation.
fMRI Amygdala Reactivity Task in the TOP study. A widely used and validated paradigm was employed to elicit amygdala reactivity (Carre et al., Reference Carre, Fisher, Manuck and Hariri2010; Hariri et al., Reference Hariri, Mattay, Tessitore, Kolachana, Fera, Goldman, Egan and Weinberger2002). In this task, participants select which of two stimuli (displayed at the bottom of the screen) matches a target stimulus (displayed at the top). The images displayed were either human faces expressing anger or fear (face-matching task) or geometrical shapes (the sensorimotor control task). Participants completed four blocks of the face-matching task, where each block consisted of six emotion-specific face trios derived from a standard set of facial affect pictures (Tottenham et al., Reference Tottenham, Tanaka, Leon, McCarry, Nurse, Hare, Marcus, Westerlund, Casey and Nelson2009). Interleaved between these blocks, participants completed five blocks of the sensorimotor control task. Each trial (faces or shapes) was presented for 5.4 seconds with no inter-stimulus interval, for a total block length of 32.6 seconds. The total paradigm lasted 310 seconds. E-prime software (version 1.0 Psychology Software Tools, Inc., Pittsburgh, PA, USA) controlled the presentations of the stimuli using VisualSystem (NordicNeuroLab, Bergen, Norway). Responses were recorded through MR-compatible ResponseGrips (NordicNeuroLab).
BOLD fMRI Data Acquisition in the TOP Study. MRI scans were acquired on a 1.5 T Siemens Magnetom Sonata scanner (Siemens Medical Solutions, Erlangen, Germany) supplied with a standard head coil. Volumes (n = 152, 24 axial slices, 4 mm thick with 1 mm gap) covering the whole brain were acquired in the axial plane, using a BOLD EPI sequence (TR = 2040 ms, TE = 50 ms, flip angle = 90°, matrix 64 × 64, FOV 192 × 192 mm). The first seven volumes were discarded. Prior to BOLD fMRI scanning, a sagittal T1-weighted 3D Magnetization Prepared Rapid Gradient Echo (MPRAGE) scan (TR = 2000 ms, TE = 3.9 ms, flip angle = 7°, matrix 128 × 128, FOV 256 × 256 mm) was collected for better localization of functional data.
fMRI Data Analysis in the TOP study. SPM2 (http:://www.fil.ion.ucl.nc.uk/spm) was used for preprocessing of data and subsequent single-subject fixed-effect analysis. Before analysis, images were visually inspected for signal dropout in the amygdala, as this region is prone to magnetic susceptibility. None of the subjects had to be excluded due to signal dropout. All of the functional images were realigned to the first image in the time-series to correct for head motion (Friston et al., Reference Friston, Holmes, Poline, Grasby, Williams, Frackowiak and Turner1995). None of the subjects moved more than 3 mm in any direction during the scan. Subsequently, the mean functional image and the anatomical image were co-registered to ensure that they were aligned. The images were spatially normalized to the stereotactical Montreal Neurological Institute (MNI) template (Friston et al., Reference Friston, Holmes, Poline, Grasby, Williams, Frackowiak and Turner1995), and resampled at 2 × 2 × 2 mm voxels. Thereafter, all images were smoothed using a 6 mm full-width half-maximum (FWHM) isotropic kernel. Subsequently, data were high-pass filtered using a cut-off value of 128 s and then an AR1 function was applied. Data for all subjects were first analyzed using a single-subject fixed-effect model built by convolving boxcar functions for the onsets of the two different conditions (faces and figures), with a canonical hemodynamic response function (HRF). Individual contrast images were created by subtracting ‘figures’ from ‘faces.’ To delimit activated voxels within the anatomically defined bilateral amygdala for each individual, the automatic anatomical labels (aal) amygdala mask in the WFU PickAtlas toolbox provided in the SPM was used (version 2.3, http://fmri.wfubmc.edu/cms/software#PickAtlas) (Maldjian et al., Reference Maldjian, Laurienti, Kraft and Burdette2003; Maldjian et al., Reference Maldjian, Laurienti and Burdette2004). This gave us a total of 319 voxels, 161 voxels in the left and 158 voxels in the right hemisphere. Each subject's contrast values for every one of these voxels were then exported from SPM2. Next, a t-test was applied to every voxel in R software (Ihaka & Gentleman, Reference Ihaka and Gentleman1996), and the voxel with most evidence of differential activation across the individuals was chosen as the peak voxel for that hemisphere (left amygdala peak voxel: t = 20.54, p = 4.43 × 10−60; right amygdala peak voxel: t = 20.12, p = 1.84 × 10−58). The activations of these two voxels were carried forward as the phenotypes for the genetic association analysis.
Genotyping and Quality Control in the TOP Study. The TOP sample was genotyped at Expression Analysis Inc. (Durham, NC, USA) using the Affymetrix Genome-Wide Human SNP Array 6.0 (Affymetrix Inc., CA, USA). Individuals with discrepancies between reported and genotyped sex were removed; to control for population stratification, individuals with a calculated ancestry different from the majority of the TOP sample were removed. These were identified by inspecting plots of the first two multi-dimensional scaling components of the Identity by State score, as calculated by PLINK (Purcell et al., Reference Purcell, Neale, Todd-Brown, Thomas, Ferreira, Bender, Maller, Sklar, de Bakker, Daly and Sham2007), of the individuals in the TOP study and in the HapMap study (The International HapMap Project, 2003). Individuals who clustered towards different ethnic groups in HapMap were excluded. All single nucleotide polymorphisms (SNPs) located in mitochondrial DNA, on the sex chromosomes, or in unknown locations, were removed. After this, information on 244 individuals and 872,242 SNPs was available. Quality control was implemented by removing individuals or SNPs that had call rates below the following percentile cut-offs: first, individuals < 90% (leaving 242 individuals); second, SNPs < 95% (750,574 SNPs remaining); third, remaining individuals < 97% (226 individuals); fourth, remaining SNPs < 97% (708,351 SNPs). Next, SNPs with a minor allele frequency less than 5% were removed (546,381 SNPs). Finally, individuals with outlying (greater than three standard deviations from the mean) levels of heterozygosity were removed (n = 2). After QC, information on genotype was available for 546,381 SNPs and 224 individuals.
Statistical Analysis of TOP data. The individual contrast values for the right and left amygdala peak voxels were tested for association with each SNP separately. An additive model of genetic effect was used, controlling for diagnosis using three indicator variables that coded for schizophrenia, bipolar disorder, and other psychosis. Gender and age variables were not included as previous analyses had suggested no significant effect for these variables. Multiple testing over SNPs and phenotypes was controlled for using the Bonferroni correction. Subsequently, a random-effects two sample t-test (CC vs. CT/TT) SPM analysis was performed with the top candidate SNP to explore the difference in amygdala BOLD response as a function of genotype profile. As the amygdala was the region of interest, small volume correction based on anatomically defined bilateral amygdala and false discovery rate (FDR) corrected p-values were used to correct for multiple comparisons. For the SPM analysis, there was no correction across SNPs, only across voxels. The anatomically defined regions of interest (ROIs) were created using the aal mask in the SPM WFU PickAtlas toolbox (Maldjian et al., Reference Maldjian, Laurienti, Kraft and Burdette2003; Maldjian et al., Reference Maldjian, Laurienti and Burdette2004).
Pathway Analysis of TOP Data. Each of the SNPs entered into the Genome-wide association (GWA) analysis were annotated to the closest gene using Affymetrix annotations. A list of these annotated genes was produced, ranked by p value of the most significant SNP associated with that particular gene. This ranked list was submitted to the Gene Set Enrichment Algorithm (GSEA) (Subramanian et al., Reference Subramanian, Tamayo, Mootha, Mukherjee, Ebert, Gillette, Paulovich, Pomeroy, Golub, Lander and Mesirov2005), with weights corresponding to the −log10 p values of the corresponding SNPs, to look for overrepresentation of Gene Ontology (GO) categories.
The DNS study
Participants. A total of 100 participants for whom both fMRI and genetic data were available were included from the ongoing Duke Neurogenetics Study (DNS). The DNS recruits participants from surrounding colleges. All participants provided written informed consent in accordance with Duke University guidelines and received $100 for participating. One participant was excluded from analyses due to poor BOLD fMRI signal in amygdala ROIs (see below), leaving a final sample of 99 individuals (Table 2).
Demographic Variables from North American DNS sample by rs17529323 Genotype Group
Psychiatric disorders and number of subjects affected were: generalized anxiety disorder = 1; major depressive disorder and alcohol abuse = 1; alcohol dependence = 4; alcohol abuse = 5; alcohol abuse and cannabis dependence = 1; alcohol abuse and cannabis abuse = 1; cannabis abuse = 1.
All participants were free of the following DNS exclusion criteria: (1) medical diagnoses of cancer, stroke, diabetes requiring insulin treatment, chronic kidney or liver disease, or lifetime history of psychotic symptoms; (2) use of psychotropic, glucocorticoid, or hypolipidemic medication; and (3) conditions affecting cerebral blood flow and metabolism (e.g., hypertension). Diagnosis of any current DSM-IV Axis I disorder or select Axis II disorders (i.e., antisocial personality disorder, borderline personality disorder), was assessed with the electronic Mini-International Interview (Sheehan et al., Reference Sheehan, Lecrubier, Sheehan, Amorim, Janavs, Weiller, Hergueta, Baker and Dunbar1998) and Structured Clinical Interview for the DSM-IV Axis II Personality Disorders (SCID) (First, Reference First, Gibbon, Spitzer, Williams and Benjamin1997). The presence of an Axis I or Axis II disorder is not an exclusion criterion for DNS participation because the DNS seeks to establish broad variability in multiple behavioral phenotypes related to psychopathology (Table 2).
fMRI Amygdala Reactivity Task in the DNS study. The DNS task was similar to the task used in the TOP study, with 4 face-matching and 5 interleaved sensorimotor control blocks, but there were some minor differences. This version consisted of one block each of fearful, angry, surprised, and neutral facial expressions presented in a pseudorandom order across participants, and used a different set of standard facial affect pictures (Ekman, Reference Ekman and Friesen1976). To be consistent with the TOP study, only blocks containing angry and fearful expressions were included in analyses reported here. Within face-matching blocks, 6 face trios were presented for 4 seconds, with a variable inter-stimulus interval of 2–6 seconds, for a total block length of 48 seconds. Each sensorimotor control block consisted of 6 different shape trios, each presented for 4 seconds, with a fixed inter-stimulus interval of 2 seconds, for a total block length of 36 seconds. The total paradigm length was 390 seconds. Reaction times and accuracy were recorded through an MR-compatible button-box.
fMRI data acquisition in the DNS study. DNS participants were scanned using a research-dedicated GE MR750 3T scanner equipped with high-power high-duty-cycle 50-mT/m gradients at 200 T/m/s slew rate, and an eight-channel head coil for parallel imaging at high bandwidth up to 1MHz at the Duke-UNC Brain Imaging and Analysis Center. A semi-automated high-order shimming program was used to ensure global field homogeneity. A series of 34 interleaved axial functional slices aligned with the anterior commissure–posterior commissure (AC–PC) plane were acquired for full-brain coverage using an inverse-spiral pulse sequence to reduce susceptibility artifact (TR/TE/flip angle = 2000 ms/30 ms/60; FOV = 240 mm; 3.75 × 3.75 × 4 mm voxels; interslice skip = 0). Four initial RF excitations were performed (and discarded) to achieve steady-state equilibrium. To allow for spatial registration of each participant's data to a standard coordinate system, high-resolution three-dimensional structural images were acquired in 34 axial slices co-planar with the functional scans (TR/TE/flip angle = 7.7 s/3.0 ms/12; voxel size = 0.9 × 0.9 × 4 mm; FOV = 240 mm, interslice skip = 0).
BOLD fMRI Data Analysis in the DNS study. The general linear model of SPM8 (http://www.fil.ion.ucl.ac.uk/spm) was used for whole-brain image analysis. Individual subject data were realigned to the first volume in the time-series to correct for head motion, before being spatially normalized into the standard stereotactic space of the MNI template using a 12-parameter affine model. Next, data were smoothed to minimize noise and residual differences in individual anatomy with a 6 mm full width at half maximum (FWHM) Gaussian filter. Subsequently, data were high pass (cut-off 128 s) filtered. Voxel-wise signal intensities were ratio normalized to the whole-brain global mean. Next, the ARtifact detection Tool (ART) (Whitfield-Gabrieli, Reference Whitfield-Gabrieli2009) was used to account for additional noise in the images. Specifically, individual whole-brain BOLD fMRI volumes meeting at least one of two criteria were assigned a lower weight in determination of task-specific effects: 1) significant mean-volume signal intensity variation (i.e., within volume mean signal greater or less than 4 standard deviations of mean signal of all volumes in time-series), and 2) individual volumes where scan-to-scan movement exceeded 2 mm translation or 2° rotation in any direction. To ensure that an adequate signal from the amygdala was obtained, an amygdala ROI mask (aal from the WFU PickAtlas) (Maldjian et al., Reference Maldjian, Laurienti, Kraft and Burdette2003; Maldjian et al., Reference Maldjian, Laurienti and Burdette2004) was used to exclude all participants with less than 90% coverage of the amygdala ROI (n = 1).
After these preprocessing steps, linear contrasts using canonical HRFs estimated an angry and fearful faces > shapes contrast image for each individual. These contrast images were entered into a second-level random-effects model (one sample t-test) to determine mean task-related responses within the anatomically defined right and left amygdala (WFU PickAtlas). To correct for multiple comparisons, FWE-correction across the amygdala ROIs with a combined voxel-level threshold of p < .05 and cluster threshold of ≥ 10 contiguous voxels was applied. Subsequently, BOLD contrast estimates were extracted for the group peak voxels within right and left amygdala for each participant. Extracted values were then entered into regression models outside of SPM. Importantly, extracting BOLD parameter estimates from peak voxels activated by the paradigm, rather than voxels specifically correlated with the independent variables of interest, will preclude the possibility of any regression coefficient inflation that may result from capitalizing on the same data twice (Viviani, Reference Viviani2010).
Genotyping and Quality Control in the DNS Study. Genomic DNA was isolated from buccal cells derived from Oragene DNA self-collection kits (DNA Genotek). Samples were genotyped using the Illumina Omni Express chip and a custom array containing an additional 330,000 SNPs by 23andme (www.23andme.com). Because rs10014254 was not available in the DNS genotyping array, SNAP (Johnson et al., Reference Johnson, Handsaker, Pulit, Nizzari, O'Donnell and de Bakker2008) was used to identify an SNP that could function as a proxy based on linkage disequilibrium. SNAP showed that rs10014254 was in complete linkage disequilibrium with rs17529323 (r 2 = 1.0) within the CEPH population of 1000 genomes. Hence, rs17529323 (A/C) was used for DNS analyses.
Statistical Analysis of DNS data. A series of multiple regressions, including gender and the number of rs17529323 C alleles, were conducted in PASW (v. 18, SPSS Inc.) to predict amygdala reactivity to emotional stimuli extracted from the peak voxels in the right and the left amygdala. These analyses were conducted in the sample including Caucasians only, and in the entire sample with the addition of self-reported ancestry as covariates (i.e., dummy coded African American, Asian, or Other). Analyses were repeated within the entire sample, with individuals with a psychiatric diagnosis excluded.
Results
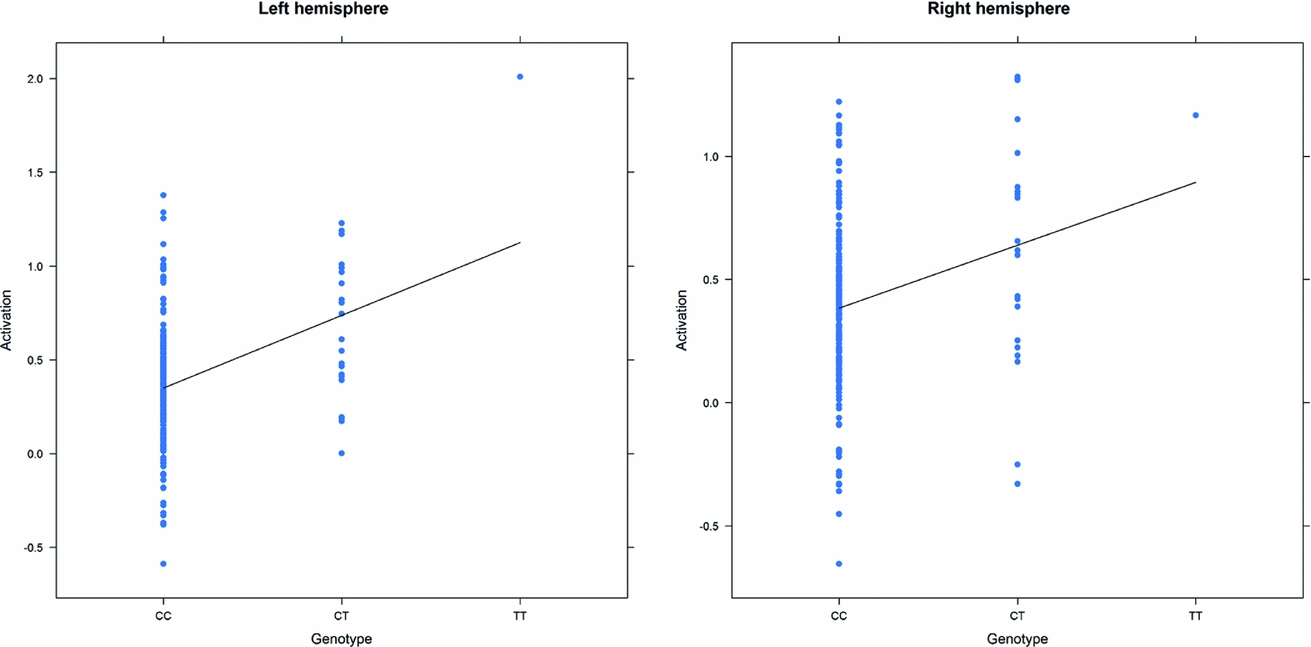
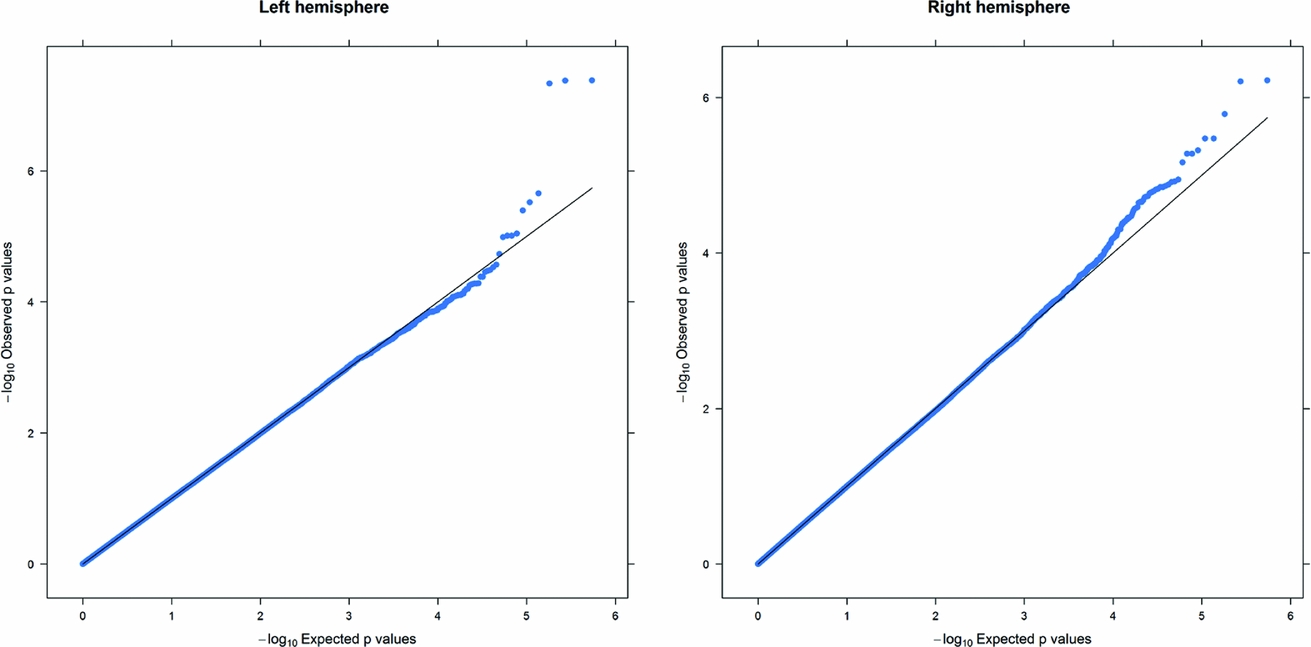
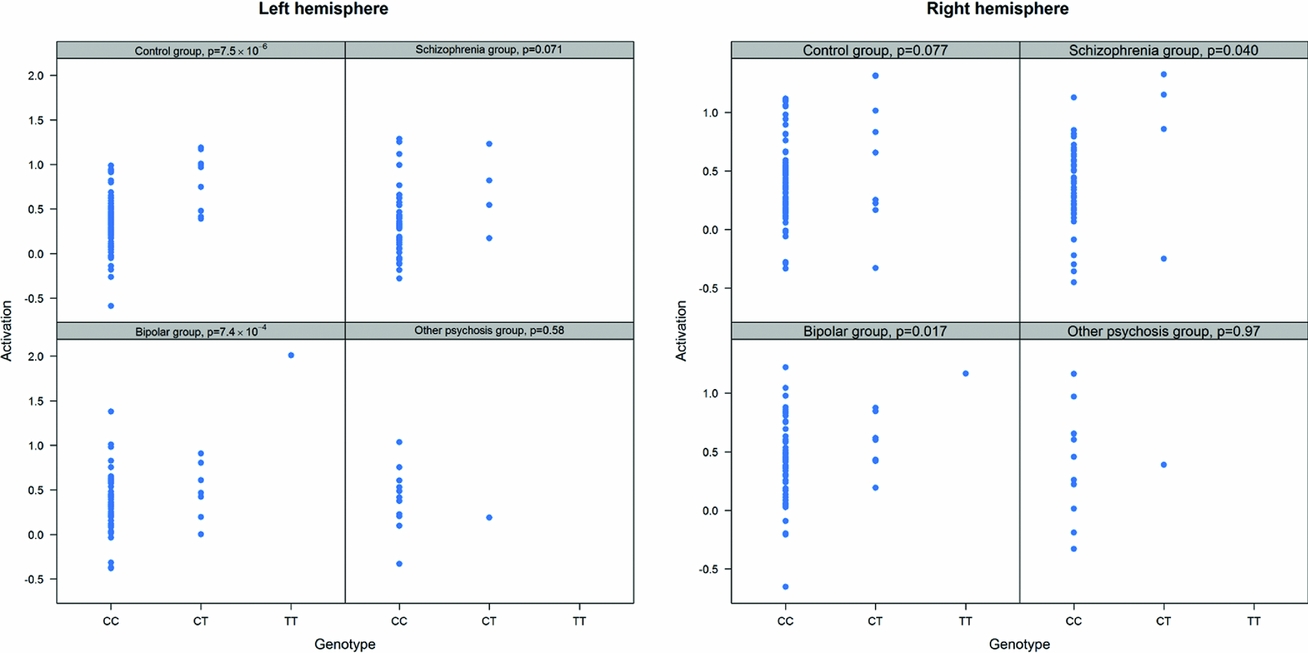
As in prior studies, the task robustly recruited amygdala in both studies. In the Norwegian sample, there were significant associations between activation of the amygdala peak voxel in the left hemisphere and three SNPs in high linkage disequilibrium (LD): rs10014254, rs11722038, and rs17529323. The most significant signal was with rs10014254, which had a p = 4.16 × 10⁻⁸, p = .045 after adjustment for multiple testing across both phenotypes and all SNPs using Bonferroni correction (Figure 1 and Table 3). The SNP is located upstream of the Paired-like homeobox 2b (PHOX2B) gene. The effect of this SNP on both left and right hemisphere activations is shown in Figure 2. Inspection of activation against genotype shows one individual to have outlying activation; after exclusion of this individual, the p value remains highly significant, but not at a genome-wide level (p = 5.52 × 10⁻⁵). An estimation of genomic inflation using all SNPs found little evidence of such an effect (λ = 1.00; Figure 3). Table 3 shows estimates of effect for the combined sample and for separate analyses of each subsample (these separate analyses are displayed in Figure 4); here we see consistent estimates of effect in all groups except ‘other psychosis’, where only one individual carried the minor allele. A statistical test for interactions between SNP and diagnosis also found no evidence (p = .28). The results from the SPM random-effects two sample t-test analysis revealed significantly increased activation in right (x = 16, y = −8, z = −16, Z = 2.87, cluster-size = 34 voxels, p (SVC) < .05), and left (x = −26, y = −4, z = −14, Z = 3.60, cluster-size = 73 voxels, p (SVC) < .05) amygdala for the T-allele carriers of the rs10014254 (i.e., combining heterozygote, CT (n = 21), and minor allele homozygote, TT (n = 1) relative to major allele homozygotes, CC (n = 199), though this analysis ignores multiple testing across SNPs. The SPM activations results are displayed in Figure 5.
Manhattan plot of genome-wide p values from the Norwegian sample. −Log10 p values for association between SNP and activation of the peak voxel in the amygdala in the left and right hemispheres, plotted against genomic location. The red line corresponds to genome-wide significance accounting for multiple testing across SNPs and phenotypes.

Effect of Significantly Associated Single Nucleotide Polymorphisms on Activation of the Left Amygdala in the Entire Norwegian Sample and in the Subgroups
We report effect size, standard error (SE) and p value using an additive model and, in the combined analysis, controlling for diagnosis.
Peak voxel activation by genotype in the Norwegian sample. Activation of the peak voxel in the left and right hemispheres, adjusted for diagnosis, plotted against the genotype of rs10014254.
Analysis on a proxy SNP, rs17529323, in the North American study failed to produce significant effects in the entire sample (right amygdala peak voxel: x = 28, y = −4, z = −20, t statistic = 0.24, p = .81; left amygdala peak voxel: x = −24, y = −6, z = −18, t statistic = 0.05, p = .96), or in the Caucasian-only sample (right amygdala: t statistic = 1.04, p = .31, left amygdala: t statistic = 0.70, p = .49).
Q-Q plot of the Norwegian sample. This Q-Q plot of the expected against observed −log10 p values for association with the left and right hemisphere phenotypes across all SNPs shows little evidence of genomic inflation.
Peak voxel activation by genotype and diagnosis. Activation of the peak voxel in the left and right hemispheres is plotted against the genotype of rs10014254 for each of the diagnostic groups separately. We see consistent effect sizes of genotype on left hemisphere on left hemisphere activations across all groups except ‘other psychosis’; this group includes only one minor allele carrier.
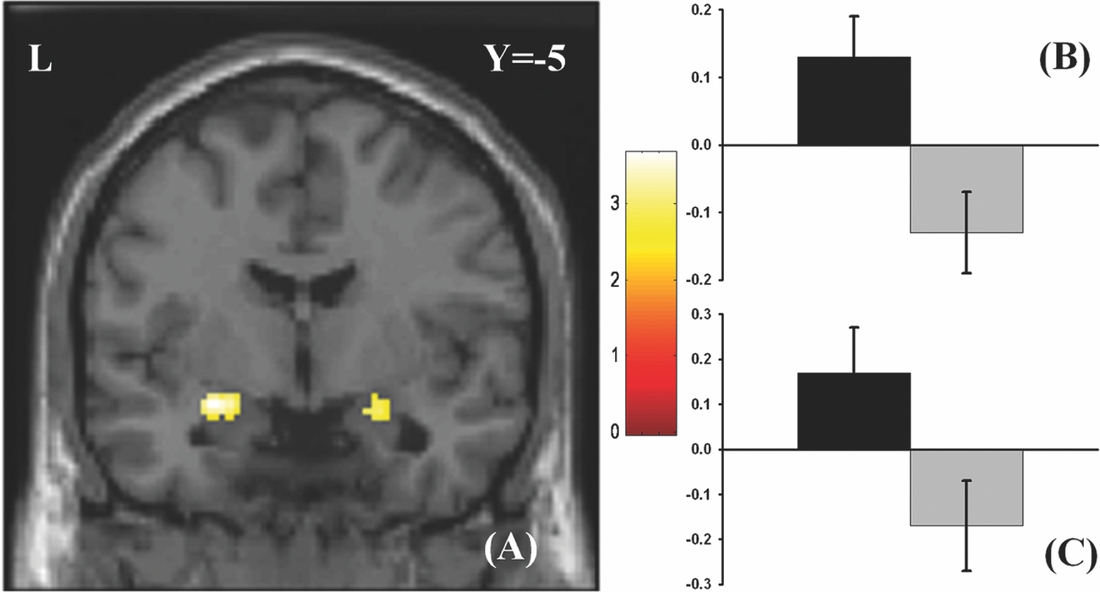
Effect of genotype. (A) The association between the rs10014254 and amygdala activation in the Norwegian TOP sample. Participants carrying the T-allele (i.e., CT or TT) exhibited significantly heightened activation in bilateral amygdala (right amygdala peak voxel: x = 16, y = −8, z = −16, Z = 2.87, p (SVC)< .05; left amygdala peak voxel: x = −26, y = −4, z = −14, Z = 3.60, p (SVC)< .05) in comparisons to those homozygous for the C-allele. The results are corrected for multiple comparisons across voxels using small volume correction, but not for the multiple comparisons across SNPs inherent in the GWAS analysis. As such, this plot is principally included to present the areas of greatest SNP effect. The colours refer to t-values as coded in the bar at the right of the figure. (B) and (C) Contrast estimates for the peak voxel in left and right amygdala, respectively, for the same contrast.
Adopting a strict Bonferroni multiple testing correction, ignoring LD within the genome, risks discarding potentially interesting findings. For this reason, a list of all regions containing an association signal with p < 10−5 in the Norwegian GWAS, along with corresponding p values from the North American study, is included in Table 4. We see that for the most significant region after the PHOX2B region, represented by rs5767645 and with p = 6 × 10⁻⁷ for association with right hemisphere activation, there is also a nominally significant association with right hemisphere activation in the North American study (p = .024), though this would not survive multiple testing correction.
Other Associated Regions
A list of all regions associated with one of the peak voxel phenotypes at a significance threshold of 10−5 in the Norwegian sample. Most regions contain groups of associated SNPs in high LD; we report a single SNP from each region (the SNP with the most significant p value). We report effect size, standard error (SE) and p value for the SNP assuming an additive model and correcting for diagnosis. The nearest gene is based on Affymetrix annotations. The final column gives the p value for testing the peak voxel in the same hemisphere in the Duke Neurogenetics Study (DNS) using an additive model, in the sample where people of different ancestry have been removed. The DNS analysis was based on the same SNPs where available, otherwise the following proxies were used (R2 = 1 unless otherwise stated): rs1121554 tagged with rs1429381, rs10014254 with rs17529323, rs2170561 with rs6656158, rs4746818 with rs4746817, rs1035540 with rs2870471 (R2 = .83), rs150757 tagged with rs219655 (R2 = .925). Rs10178425 and rs10212227 had no proxies in the DNS experiment, and thus were not included.
We looked for further evidence of the importance of monoaminergic signaling pathways using the TOP data, both by inspecting well-known candidate loci and by using the tools of pathway analysis. For two of the previously linked genes, MAOA and COMT, genotype information was available either at the previously identified locus (rs4680 for MAOA), or a locus in perfect LD (rs3027401 is in perfect LD with rs6323, previously linked with COMT expression). Applying the same model as used in the GWA analysis, there was a nominally significant association between the COMT loci and left hemisphere peak activation (p = .034) but no association with right hemisphere peak activation (p = .33). There was no evidence of association for the MAOA SNPs (left hemisphere, p = .71; right hemisphere, p = .081). No SNPs were available which were in LD with rs25532, the variant linked to differential expression of SLC6A4.
A pathway analysis of the GWAS results was performed to look for overrepresentation of SNPs annotated to particular GO categories amongst the more significant GWAS associations. The GO categories of interest were those which contained the monoaminergic signaling genes linked to amygdala activity (i.e. COMT, MAOA, and SLC6A4). The GSEA tool (http://www.broadinstitute.org/gsea/index.jsp) was used to search for such overrepresentation. None of these particular GO categories were significant with FDR < 0.25. There could be a number of explanations for this: pathway analysis suffers from reduced power because of factors such as the incompleteness of GO categories, and random noise in the ranking can swamp genuine signals. In addition, when annotating SNPs to genes, many links between SNPs and monoaminergic genes may have been missed; this would further reduce power.
Discussion
In this study, the combination of genome-wide data and fMRI phenotypes in a Norwegian sample suggested an association between a common gene variant in a regulatory region upstream of PHOX2B and neural function of the amygdala. However, analyses in a secondary North American dataset failed to replicate this association.
It is possible that the gene variant rs10014254 regulates the expression of PHOX2B in cis. ChIP-Seq data, collected by the ENCODE consortium (Birney et al., Reference Birney, Stamatoyannopoulos, Dutta, Guigo, Gingeras, Margulies and de Jong2007) and displayed in the UCSC genome browser (http://genome.ucsc.edu/), found three transcription factors binding to this locus. However, confirmation of a regulatory effect of rs10014254 on expression of this gene would require further experiments. PHOX2B codes for a transcription factor exclusively expressed in the nervous system, including the amygdala (Lein et al., Reference Lein, Hawrylycz, Ao, Ayres, Bensinger, Bernard and Jones2007). Of its main functions, PHOX2B is necessary for the development of the autonomic nervous system, and has a primary role in the generation and survival of adrenergic neurons (Pattyn et al., Reference Pattyn, Morin, Cremer, Goridis and Brunet1999). Further, it regulates the expression of enzymes necessary for the biosynthesis of dopamine and norepinephrine (Brunet & Pattyn, Reference Brunet and Pattyn2002). It is also involved in the serotonergic neurogenesis (Jacob et al., Reference Jacob, Ferri, Milton, Prin, Pla, Lin, Gavalas, Ang and Briscoe2007). Interestingly, a mutation in PHOX2B causes congenital central hypoventilation syndrome (CCHS) with autonomic nervous system dysfunction such as reduced drive to breathe, abnormal heart rate variability, exaggerated sweating, poor temperature control, and abnormal pupillary dilatation (Antic et al., Reference Antic, Malow, Lange, McEvoy, Olson, Turkington, Windisch, Samuels, Stevens, Berry-Kravis and Weese-Mayer2006; Patwari et al., Reference Patwari, Carroll, Rand, Kumar, Harper and Weese-Mayer2010). Further, some CCHS patients show subtle cognitive and affective impairments such as problems with working memory functions and elevated levels of anxiety (Ruof et al., Reference Ruof, Hammer, Tillmann, Ghelfi and Weber2008; Vanderlaan et al., Reference Vanderlaan, Holbrook, Wang, Tuell and Gozal2004). The CCHS findings are consistent with animal and human studies that demonstrate that the amygdala is involved in mediating autonomic reactivity and the allocation of attentional resources in response to significant environmental stimuli (LeDoux, Reference LeDoux2007). The amygdala receives cardiopulmonary information and projects directly to autonomic control regions such as the hypothalamus. Further, stimulating the central amygdala leads to alterations in blood pressure, heart rate, and respiration (Davis, Reference Davis1992). Because of these findings, the amygdala is considered as part of the neural circuit that mediates descending control over the autonomic nervous system (Kapp et al., Reference Kapp, Gallagher, Underwood, McNall and Whitehorn1982), likely integrating autonomic responses with emotional or relevance factors. Thus, changes in PHOX2B expression may alter autonomic functions both directly and indirectly, the second by modulating amygdala neuronal firing, with resultant changes in subjects’ physiological and cognitive responses to relevant environmental stimuli.
An association has also been suggested between a PHOX2B polymorphism and schizophrenia, in particular for subgroups with ocular misalignment (Toyota et al., Reference Toyota, Yoshitsugu, Ebihara, Yamada, Ohba, Fukasawa, Minabe, Nakamura, Sekine, Takei, Suzuki, Itokawa, Meerabux, Iwayama-Shigeno, Tomaru, Shimizu, Hattori, Mori and Yoshikawa2004). An emergent feature among schizophrenia patients is impairments in emotion recognition and abnormal amygdala responses to emotional salient information; this implicates the amygdala as part of the neural substrate of this disorder (Morris et al., Reference Morris, Weickert and Loughland2009). However, as no interaction with diagnosis was found in the current study, and the direction of effect was the same for the control group, those with schizophrenia and those with bipolar disorder (little can be said about the ‘other psychosis’ group, as it contained only one minor allele carrier), the present results suggest this variant acts independently of any neuropsychiatric disorder. Similar findings have been obtained with other genes controlling important brain phenotypes (Rimol et al., Reference Rimol, Agartz, Djurovic, Brown, Roddey, Kahler, Mattingsdal, Athanasiu, Joyner, Schork, Halgren, Sundet, Melle, Dale and Andreassen2010).
As argued previously, at least some of the observed variation in amygdala activity appears to rely on differences in monoaminergic signaling pathways. For instance, both impaired amygdala structure and increased amygdala activation have been linked to genetic variants in important monoaminergic pathways, in particular the serotonin transporter gene (Hariri et al., Reference Hariri, Mattay, Tessitore, Kolachana, Fera, Goldman, Egan and Weinberger2002; Hariri et al., Reference Hariri, Drabant, Munoz, Kolachana, Mattay, Egan and Weinberger2005) and the MAOA enzyme gene (Meyer-Lindenberg et al., Reference Meyer-Lindenberg, Buckholtz, Kolachana, Pezawas, Blasi, Wabnitz, Honea, Verchinski, Callicott, Egan, Mattay and Weinberger2006). Interestingly, the low-expression variant in MAOA is associated with impulsive violence (Caspi et al., Reference Caspi, McClay, Moffitt, Mill, Martin, Craig, Taylor and Poulton2002) and the corresponding variant of the serotonin transporter gene (the 5-HTTLPR S allele) with anxiety (Gross & Hen, Reference Gross and Hen2004), linking genetics variants to complex behavioral traits. The current result is in line with these earlier candidate gene studies, as it demonstrates how genetic variation in a regulatory step of monoaminergic signaling that affects cerebral monoaminergic tone subsequently relates to amygdala neuronal signaling. Moreover, volumetric effects of variants linked to the MAOA gene and the serotonin transporter gene on amygdala structures are consistent with emerging evidence that indicates some structural damage in amygdala and interconnected limbic structures in CCHS patients (Kumar et al., Reference Kumar, Macey, Woo, Alger and Harper2006; Kumar et al., Reference Kumar, Macey, Woo, Alger, Keens and Harper2005). These results indicate that genetic variation in monoaminergic signaling pathways affects not only amygdala neural activity, but also structural integrity. It would be interesting to investigate in a future study if variants of the rs10014254 affect amygdala structure. The synthesis of fMRI and genome-wide data is a hypothesis-free approach, with no preconceived notion as to which genetic pathways affect a trait. As the gene variants tested for associations are not limited to a few candidates, but hundreds of thousands of SNPs, it allows the discovery of unexpected genetic variants and novel mechanisms. Hence, this unguided discovery of a genetic variant within a monoaminergic signaling pathway constitutes further evidence for the unique role these transmitters play in regulating amygdala activity.
The effect of the rs10014254 on amygdala reactivity was not replicated in a North American sample. Such a replication in an independent dataset would greatly strengthen the credibility of the variant we propose (Chanock et al., Reference Chanock, Manolio, Boehnke, Boerwinkle, Hunter, Thomas, Hirschhorn, Abecasis, Altshuler, Bailey-Wilson, Brooks, Cardon, Daly, Donnelly, Fraumeni, Freimer, Gerhard, Gunter, Guttmacher, Guyer, Harris, Hoh, Hoover, Kong, Merikangas, Morton, Palmer, Phimister, Rice, Roberts, Rotimi, Tucker, Vogan, Wacholder, Wijsman, Winn and Collins2007). While all science progresses by the independent validation of experimental results, with GWA studies replication reduces the probability that the result is related to subtle population stratification (though our study is conducted in a homogeneous population, well suited for GWA studies) or to the issue of multiple comparisons (which we control for using the gold standard and, many argue, overly conservative Bonferroni correction). Replication could also give truer estimate of effect size, which initially could be inflated by ‘winner's curse’ (Zollner & Pritchard, Reference Zollner and Pritchard2007). Winner's curse has been posited as a reason GWAS results fail to replicate; because of the initial overestimation of effect size, subsequent replication experiments are underpowered to confirm their findings. The reason for the current failure is not clear. It is possible to speculate that both task-related and genotype-related factors influence these relations. For instance, winner's curse would be exacerbated by the smaller size of the replication sample. Chanock et al. (Reference Chanock, Manolio, Boehnke, Boerwinkle, Hunter, Thomas, Hirschhorn, Abecasis, Altshuler, Bailey-Wilson, Brooks, Cardon, Daly, Donnelly, Fraumeni, Freimer, Gerhard, Gunter, Guttmacher, Guyer, Harris, Hoh, Hoover, Kong, Merikangas, Morton, Palmer, Phimister, Rice, Roberts, Rotimi, Tucker, Vogan, Wacholder, Wijsman, Winn and Collins2007) suggest, as far as possible, study design and phenotype should match to maximize the chance of replication.
Other factors, including the samples under study and task-related differences, may have contributed to the lack of replication. While the Norwegian task used pictures of faces expressing fear or anger from the NimStim set, the North American study used faces from the Ekman set. As the amygdala is a heterogeneous structure composed of several nuclei, parts of the observed discrepancy may be ascribed to activation of different nuclear groups within the amygdala. These nuclear groups have different connectivity profiles and are even thought to operate independent of each other in some neural processes (Balleine & Killcross, Reference Balleine and Killcross2006). Unfortunately, the resolution of whole-brain fMRI does not allow one to discriminate subgroups of nuclei within the amygdala, and therefore this remains speculative.
In summary, we report here an association between amygdala reactivity and genetic variants upstream of PHOX2B, which controls pathways related to monoaminergic biosynthesis. Although we failed to replicate this association within a second sample, we believe that the centrality of such pathways to amygdala neural activity, as well as the links between this gene and phenotypes related to amygdala function, mean that this result merits further investigation.
Acknowledgment
The authors would like to thank the study participants and the members of the TOP study and the DNS study group involved in data collection and statistical analysis. The Norwegian work was supported by Oslo University Hospital, University of Oslo, South-Eastern Norway Health Authority (grant #2004-123), and the Research Council of Norway (#167153/V50,#163070/V50).


