


Introduction
In the space of just 15 years, Leptocybe invasa Fisher & La Salle (Hymenoptera: Eulophidae) spread to over 35 countries and became a serious insect pest of Eucalyptus species (Myrtaceae) grown in plantations outside Australia (Otieno et al., Reference Otieno, Nahrung and Steinbauer2019). Consequently, research has been conducted to identify trees resistant to galling by this tiny wasp including testing of variable genotypes. Eucalyptus camaldulensis, one of the most widely planted species of this economically important but preferred host species, is used in many tree breeding programmes to confer drought and/or salinity tolerance to hybrid eucalypts. Variability in the incidence of galling by L. invasa has been reported in some published literature (Mendel et al., Reference Mendel, Protasov, Fisher and La Salle2004; Nyeko et al., Reference Nyeko, Mutitu, Otieno, Ngae and Day2010; Otieno et al., Reference Otieno, Salminen and Steinbauer2022), emphasising the potential to identify resistance mechanisms. Subspecies of E. camaldulensis have been found to exhibit variable susceptibility to L. invasa but genotype × environment interactions have not been considered (Andrew et al., Reference Andrew, Wallis, Harwood and Foley2010; O’Reilly-Wapstra et al., Reference O’Reilly-Wapstra, Bailey, McArthur and Potts2010). For example, Otieno et al. (Reference Otieno, Salminen and Steinbauer2022) found that the incidence of galling of E. camaldulensis was inversely correlated with concentrations of quinic acid derivatives (QUIN) in different subspecies. This suggests that these compounds adversely impact agents of gall induction, which can be either eggs or neonate larvae (Giron et al., Reference Giron, Huguet, Stone and Body2016; Isaias et al., Reference Isaias, Ferreira, Alvarenga, Barbosa, Salminen and Steinbauer2018), prior to gall induction.
These studies however do not give clarity on whether traits evolved in a particular region of endemism will remain constant when the progeny of that population are grown elsewhere and where growing conditions and/or the mosaic of herbivores they are exposed to differ in composition and abundance (Rapley et al., Reference Rapley, Allen and Potts2004; Henery et al., Reference Henery, Stone and Foley2009). Moreover, other studies have found that constitutive resistance traits in other plant species are influenced by genetic and environmental factors (Andrew et al., Reference Andrew, Wallis, Harwood and Foley2010; O’Reilly-Wapstra et al., Reference O’Reilly-Wapstra, Bailey, McArthur and Potts2010). This indicates that environmental influences could alter expression of genetically determined traits when eucalypts are deployed in novel environmental gradients, i.e. counter-gradient variation (Conover et al., Reference Conover, Duffy and Hice2009).
Despite the belief that the expression of many plant traits are shaped by interactions between genotypes and the environment (Underwood and Rausher, Reference Underwood and Rausher2000; Hochwender and Fritz, Reference Hochwender and Fritz2004; Johnson and Agrawal, Reference Johnson and Agrawal2005), mechanisms are often not well understood (Sultan, Reference Sultan2000). Other than genes, the environmental factors at play are many and diverse. Soil nutrient availability may influence plant growth such that those endemic to environments with limited resources may grow more slowly and/or may invest more in traits conferring resistance (Haukioja et al., Reference Haukioja, Ossipov, Koricheva, Honkanen, Larsson and Lempa1998; Fine et al., Reference Fine, Miller, Mesones, Irazuzta, Appel, Stevens, Sääksjärvi, Schultz and Coley2006). For example, some species of conifer and ericaceous plants produce high foliar concentrations of phenolic compounds when grown in nutrient poor soils (Northup et al., Reference Northup, Dahlgren and Yu1995; Kraus et al., Reference Kraus, Zasoski and Dahlgren2004). Nitrogen availability can affect plant secondary metabolite expression and hence influence plant defences against some pests and diseases (Sakakibara et al., Reference Sakakibara, Takei and Hirose2006) (Sakakibara et al., Reference Sakakibara, Takei and Hirose2006). Larvae of galling insects, such as L. invasa, induce the formation of and develop within, highly modified plant tissues (Kaiser et al., Reference Kaiser, Huguet, Casas, Commin and Giron2010; Agrawal, Reference Agrawal2011; Oliveira et al., Reference Oliveira, Isaias, Fernandes, Ferreira, Carneiro and Fuzaro2016) and maybe least affected by changes in host plant quality (Hartley, Reference Hartley1998). Nevertheless, galling by some insects has been shown to follow soil fertility gradients (Blanche and Westoby, Reference Blanche and Westoby1995; Cuevas-Reyes et al., Reference Cuevas-Reyes, Siebe, Martínez-Ramos and Oyama2003).
Some plant genera and species from lower latitudes have been found to invest more in resistance than those at higher latitudes (Rasmann and Agrawal, Reference Rasmann and Agrawal2011), or plant phenotypes can exhibit plasticity of expression in which responses may be either continuous or interactive (Singh et al., Reference Singh, Ceccarelli and Grando1999; Des Marais et al., Reference Des Marais, Hernandez and Juenger2013). Although phenotypic plasticity may enhance plant fitness in heterogeneous environments (Sultan, Reference Sultan2000), it may not be desirable in an applied context where consistency of expression of constitutive resistance is needed for consistent pest management. Variability in the abundance of such galling insect taxa with environmental conditions implies that host suitability is important to their success (Fernandes and Price, Reference Fernandes and Price1992; Blanche and Westoby, Reference Blanche and Westoby1995).
We investigated the evolutionary influence on the defensive characteristics of E. camaldulensis genotypes to the invasive galling wasp L. invasa. The influence of place of origin in Australia and its possible effects in shaping defensive traits was used as our indicator of the evolutionary influence on extant characteristics. The influence of growing conditions in Kenya on the expression of resistance when grown in common garden arboreta as well as in experiments with potted plants was studied to quantify phenotypic plasticity. Since constitutive resistance is mediated by ‘always present defences’ such traits are difficult to manipulate (Wittstock and Gershenzon, Reference Wittstock and Gershenzon2002). Genotype × environment (G × E) experiments provide a means to address this problem because plants exhibit tremendous phenotypic plasticity. Common garden arboreta permit an insect herbivore to choose between numerous genotypes which may, due to differences in their vegetative growth in a specific space and time, provide for marked variation in relative resource availability and suitability. Since galling insects are essentially specialists of rapidly differentiating plant tissues, common garden arboreta may provide situations in which populations of species such as L. invasa have the opportunity to overwhelm putative resistance mechanisms of some genotypes prior to the expression of specific harmful compounds or the full suite of compounds (see Khanal et al., Reference Khanal, Rochfort and Steinbauer2025).
Materials and methods
Seed source locations and information
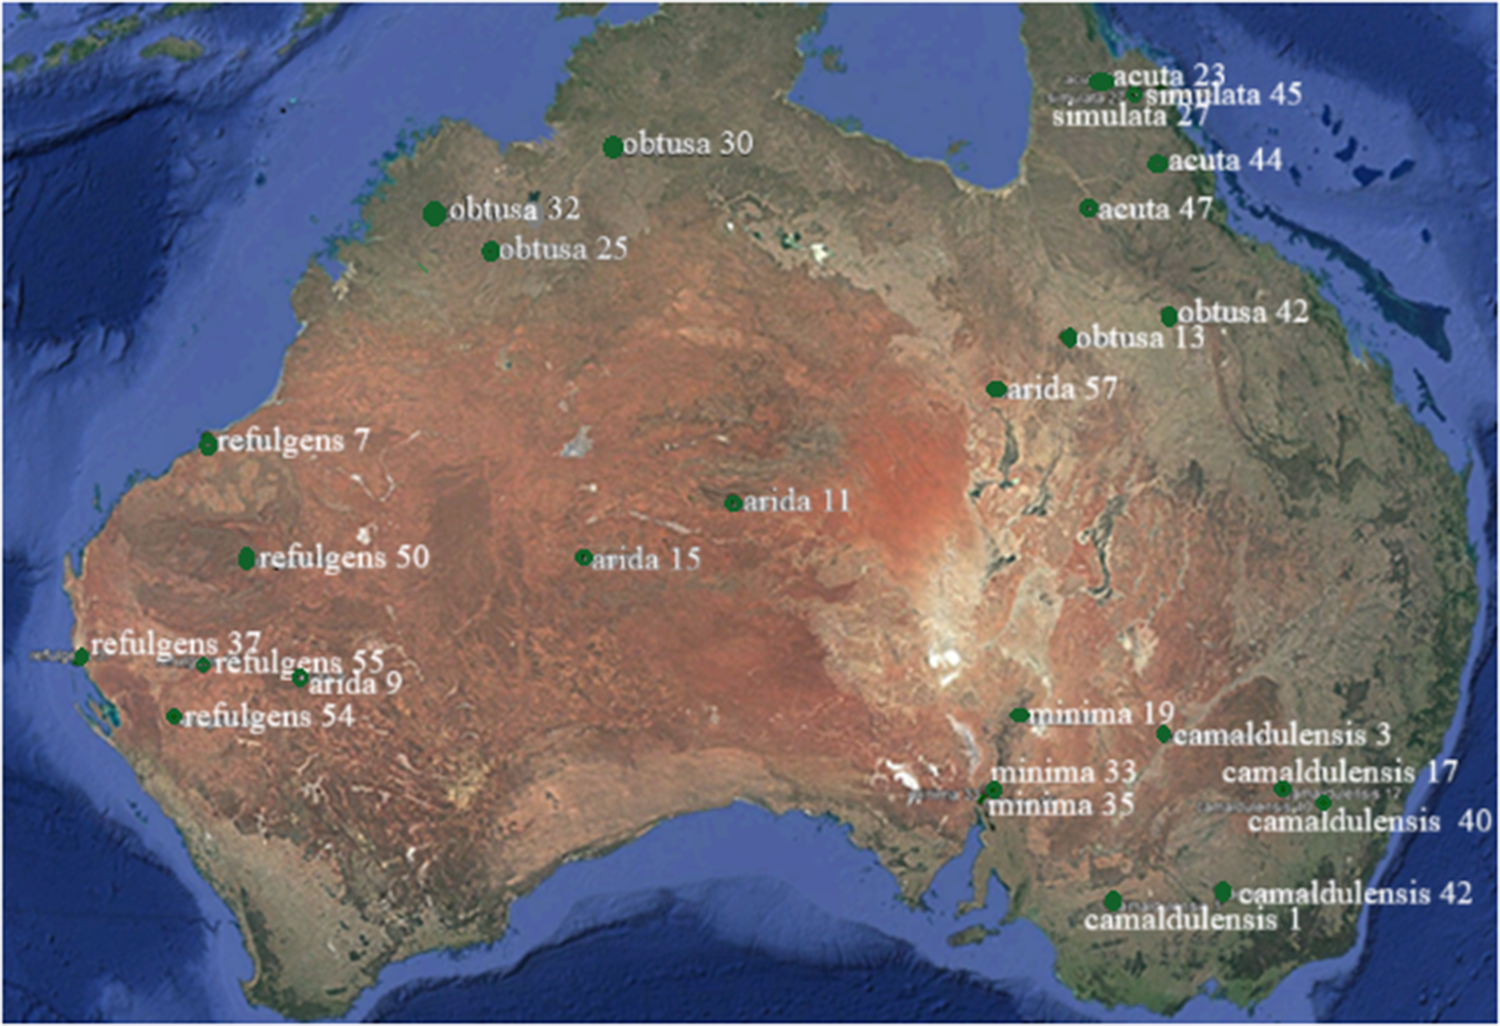
We selected 29 genotypes representative of all seven subspecies of E. camaldulensis from their endemic populations (fig. 1). These were identified into their respective subspecies by McDonald et al. (Reference McDonald, Brooker and Butcher2009) and Butcher et al. (Reference Butcher, McDonald and Bell2009). Within each subspecies we chose genotypes representative of as wide a geographical distribution as possible so as to present as much of the diversity within the species as possible. The seedlots selected were those that originated from as few parent trees as possible (typically a single parent tree), i.e. to minimise diversity within genotypes and hence variability in expression of traits. Seeds of selected genotypes were purchased from the Australia Tree Seed Centre (ATSC), Canberra, Australia.
Location of collection of seedlots of endemic populations of Eucalyptus camaldulensis genotypes used in this study. Seeds sourced from by Australian Tree Seed Centre (ATSC), Canberra, Australia.

Figure 1 Long description
The map of Australia illustrates the distribution of Eucalyptus camaldulensis subspecies across various regions, using a thematic approach over a satellite basemap. The map is oriented with north at the top. Green dots represent specific sites where subspecies are located, each labeled with a name and number indicating site IDs. The subspecies and their corresponding site IDs are as follows: - Refulgens: 7, 9, 37, 50, 54, primarily in Western Australia. - Obtusa: 24, 30, 32, 42, found in Northern Territory and Queensland. - Arida: 11, 15, 57, located in central Australia. - Minima: 19, 33, situated in Queensland. - Acuta: 44, 45, in Queensland. - Camaldulensis: 3, 6, 7, 40, 42, distributed across New South Wales and Victoria. The map provides a visual representation of the geographic spread of each subspecies, highlighting their presence in specific regions such as Western Australia, Northern Territory, Queensland, New South Wales and Victoria. The numbers next to each label indicate site IDs, which are unique to each subspecies. This thematic map helps in understanding the distribution patterns of Eucalyptus camaldulensis subspecies across Australia.
Arboreta establishment and data collection
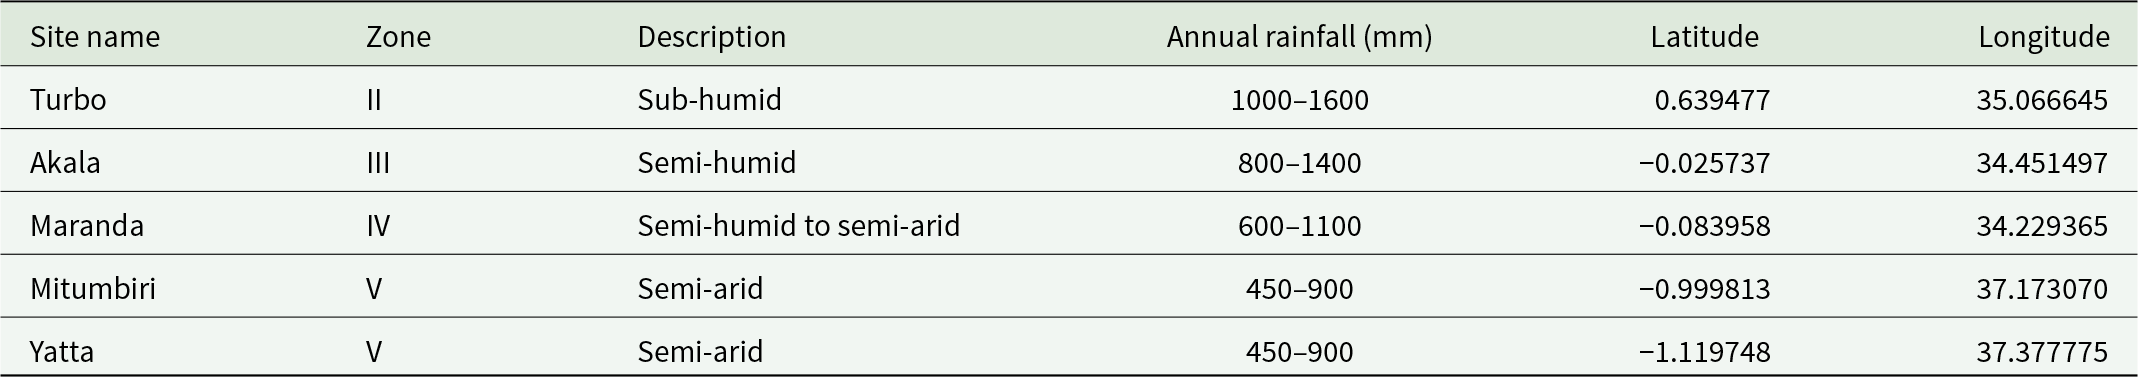
Seeds were sown and raised in a common nursery at KEFRI, Muguga, Kenya in October 2012. A nursery trial was conducted in Embakasi (−1.287995, 36.977557), a suburb of Nairobi, where L. invasa infestation had been confirmed while five common garden arboreta were established in four agroecological zones (see table 1). The trials were laid out in nursery and field arboreta in April 2013, when the seedlings about 30 cm and well hardened off. In each arboretum, the genotypes were planted in 12-plant line plots replicated in three blocks. Seedlings from the Muguga nursery were also planted out in a common garden reserve comprising ten plants of each genotype at KEFRI, Muguga where there was no L. invasa infestation. Additional seed from the same seedlots was germinated and 10 individual plants of each were grown in native plant potting mix in 15 cm diameter pots in the open in the Agriculture Reserve at La Trobe University, Melbourne. A potting mix suitable for native Australian plants comprising composted pine bark, river sand, trace elements, professional-grade wetting agent, and two types of slow-release fertiliser sufficient for 4–6 months of growth was used for the plants maintained in 15 cm diameter plastic pots in the Agriculture Reserve at La Trobe University.
Locations of common garden arboreta in Kenya and their climatic characteristics. Zones are agroecological zones as recognised by Orodho (Reference Orodho2006)

Table 1 Long description
The table lists five garden arboreta sites in Kenya with their agroecological zone, climate description, annual rainfall range, and geographic coordinates. Turbo is in zone II and is sub-humid, with the highest rainfall range of 1000–1600 mm at latitude 0.639477 and longitude 35.066645. Akala and Maranda fall in zones III and IV and are described as semi-humid and semi-humid to semi-arid, with rainfall ranges of 800–1400 mm and 600–1100 mm. Mitumbiri and Yatta are both in zone V, described as semi-arid, and share the lowest rainfall range of 450–900 mm, with coordinates near latitude minus 1 and longitude about 37. Overall, the sites show a shift toward drier conditions from zone II to zone V. Rainfall values are presented as ranges, so they indicate typical variability rather than a single annual total.
Environmental and soil data
Climatic data for seedlot collection locations were extracted from the CliMond dataset (Kriticos et al., Reference Kriticos, Webber, Leriche, Ota, Macadam, Bathols and Scott2012) in ArcMap 10.2.2. Soil data for the genotype source location was obtained from CSIRO website at http://www.clw.csiro.au/aclep/soilandlandscapegrid/index.html.
Soil collection and analysis
Nine soil samples per site were collected using soil auger, along two transects of the whole plot. The soil samples were collected from the top 30 cm layer, at the time of arboretum establishment, packed and sent to the laboratory for analysis of their nitrogen, phosphorus, potassium, calcium, magnesium, organic carbon, pH, and electrical conductivity. These were quantified using methods described by Okalebo et al. (Reference Okalebo, Gathua and Woomer2002) after the soil samples were air dried at room temperature, milled and passed through 2 mm sieve. A portable glass electrode was used to measure soil pH and electrical conductivity (EC) while available phosphorus (P) and magnesium (Mg) were determined using a UV spectrophotometer. Potassium (K) and calcium (Ca) were determined using a flame photometer. Organic carbon (C) was determined using the Walkley–Black method and total nitrogen (N) was determined using the Kjeldahl method.
Analysis of plant growth performance, insect infestation, and foliar phenolic compounds
From the experimental plots in the arboreta, we measured the height of plants and apical bud length (our indicator of plant vigour, see Steinbauer (Reference Steinbauer1999)), leaf toughness, insect oviposition intensities, and the intensity of gall development. Specific leaf weight, as determined using the method of Steinbauer (Reference Steinbauer2001), was used as our indicator of leaf toughness. These data were collected every 6 months within the first 2 years of the trials because damage was more pronounced on seedlings and saplings compared to mature trees (Nyeko et al., Reference Nyeko, Mutitu, Otieno, Ngae and Day2010).
To quantify the intensity of oviposition in the common arboreta, a sample of one apical bud was collected from each sapling. This was done in the third month of their establishment. Since the eggs are laid inside soft plant tissue and not visible, the samples were taken to the laboratory and ovipuncture marks counted under a stereo microscope (Olympus SZ, Japan). Assessments of galling intensity were undertaken twice during the year for 2 years using a 4-point scale (Nyeko et al., Reference Nyeko, Mutitu, Otieno, Ngae and Day2010), i.e. 1 = not infested, 2 = 1–25% of canopy infested (minor infestation), 3 = 26–50% infestation (moderate infestation), and 4 = >50% canopy infested (severe infestation).
Phenolic compounds in actively growing shoots (rather than in mature leaves) were analysed for this study. Shoot collection was carried out mid-morning from all the experimental sites during the same sampling season. Samples were collected from selected genotypes representing highly susceptible, moderately susceptible, and resistant genotypes as previously determined in the nursery experiments (Otieno et al., Reference Otieno, Salminen and Steinbauer2022). The shoots were collected in the second year of the common arboreta in four locations in Kenya, from plants at a protected nursery in Muguga and Agriculture Reserve at La Trobe University. Shoots samples were harvested by pinching off actively growing tips of each plant and pooling into a common zip-lock bag by genotype and site. In the laboratory, the identity and quantity of phenolic compounds in the genotypes were determined from freeze dried samples ground into a fine powder in a mortar and pestle. The samples were analysed for extracted phenolic compounds analysed, using methods described in Steinbauer et al. (Reference Steinbauer, Farnier, Taylor and Salminen2016) as adapted from Engström et al. (Reference Engström, Pälijärvi, Fryganas, Grabber, Mueller-Harvey and Salminen2014), in the Natural Chemistry Research Group, University of Turku, Finland. An amount of 20 mg of plant powder was extracted twice for 3 h with 1.4 ml of acetone/water (80/20, v/v). The pooled extract was concentrated to water phase by an Eppendorf concentrator then freeze-dried. The extracts were dissolved in 1 ml of H2O, filtered with 0.2 µm PTFE syringe filters and diluted five times with H2O before subsequent ultra-performance liquid chromatography–tandem mass spectrometry (UPLC-MS/MS) analyses. The UPLC system was connected to a Xevo TQ triple-quadrupole mass spectrometer (Waters Corp., Milford, MA, USA) with electrospray ionisation and the UPLC system utilised a 100 mm × 2.1 mm i.d., 1.7 μm, Acquity UPLC BEH Phenyl column (Waters Corp., Wexford, Ireland). The polyphenol groups were quantified from the extracts by UPLC-MS/MS, considering the specific fragmentation of different types of polyphenols in the ion source and their subsequent specific detection and quantitation by sensitive and selective multiple reaction monitoring methods (Engström et al., Reference Engstrom, Palijarvi and Salminen2015). The following standards were used for quantitation: proanthocyanidins (PA) were quantified using standard curves from stock solutions of procyanidin (PC) and prodelphinidins purified by Sephadex LH-20 gel chromatography. Ellagitannins and gallic acid derivatives were quantified as tellimagrandin I and pentagalloylglucose, respectively. QUIN and three classes of flavonols (kaempferol, quercetin, and myricetin derivatives) were quantified using chlorogenic acid, kaempferol, quercetin, and myricetin glycosides as quantitation standards. Before each set of runs, a flavonoid mix stock solution was injected twice to determine the systems performance at the start of analysis. Additionally, prior to and after each 10 samples, 5 samples of a catechin stock solution were run to determine the stability in the systems ionisation efficiency for polyphenols over the course of the analysis. Rapid fingerprint UPLC-MS/MS was used to determine the abundance of QUIN and total polyphenols.
Nitrogen supplementation studies
A principal component analysis of soil characteristics found nitrogen to be the macronutrient that accounted for the greatest site variability. Hence, the effect of nitrogen supplementation on host susceptibility was investigated under glasshouse conditions at KEFRI, Muguga. Seedlings of three susceptible genotypes (17, 19, and 35) (selected based on Otieno et al., Reference Otieno, Salminen and Steinbauer2022) were transplanted into 15 cm diameter pots in forest soil and gravel mix and allowed to establish for 2 months. The plants were then separated into groups of 60 pots per genotype and given urea at the rate of 0, 1, 2, or 4 g and watering to field capacity. Single apical shoots from 15 randomly selected plants were harvested 2 weeks after urea application for analysis of polyphenolic compounds. Using 13 mm diameter, 18 mm deep clip cages (sourced from BioQuip, California, USA), one newly emerged female wasp was caged onto a shoot of each of the remaining plants and left for 24 hours. The wasps were from field collected galls that were caged in the insectary for adult wasp emergence. Locations where wasps had been caged were marked with thread and monitored for gall development.
Data analyses
To determine the variability of genotype performance in different growing sites, analysis of variance and principal component analysis was used (Crossa, Reference Crossa1990). Measurements pertaining to host quality/vigour (latter indicated by increase in height), oviposition intensity, galling incidence, and intensity from common garden arboreta were analysed to consider the responses of the genotypes in different subspecies to the environmental conditions under which they were grown. Linear and log-linear regression modelling was used depending on the distribution of the data.
Analysis of the effect of place of origin in Australia on the performance of genotypes was by principal component, canonical correlation analysis, and discriminant analyses followed by regression analysis using environmental and performance data from nursery experiments (Crossa, Reference Crossa1990; Anderson and Willis, Reference Anderson and Willis2003). Relationships among the environmental variables of host plant origin were modelled using linear regression with their level of infestation, growth, physical, and chemical characteristics. ANOVA was used to compare log transformed data on composition of phenolic compounds on leaves.
Results
Influence of site and tree growth on galling
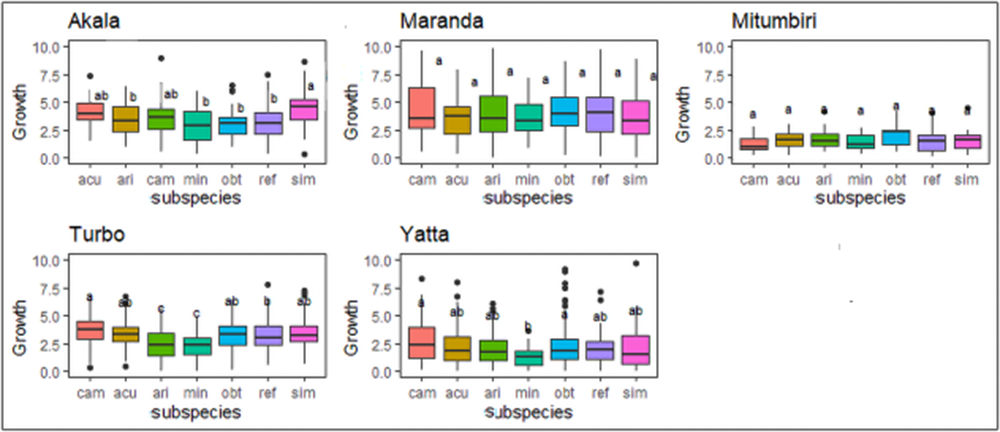
The genotypes of subspecies camaldulensis were generally the fastest growing except in Maranda and Mitumbiri, while those of subspecies minima were the slowest (fig. 2). While tree growth rate was positively correlated with oviposition incidence (r = 0.48; F 1,52 = 14.99; P < 0.001), it did not have a significant correlation with galling incidence.
Mean growth rate (in cm/month) of subspecies of Eucalyptus camaldulensis in the first 6 months after arboretum establishment. Box and whisker plots show 25th and 75th percentiles (shaded), mean (solid line inside box). Letters indicate similarities of means. Details relating to the location of each arboretum are given in table 2. The subspecies are abbreviated as: sim = simulata, ref = refulgens, acu = acuta, obt = obtusa, ari = arida, cam = camaldulensis, min = minima.

Figure 2 Long description
The image contains five box plots representing the mean growth rate in centimeters per month of subspecies in the first six months after arboretum establishment across five locations: Akale, Maranda, Mitumbiri, Turbo and Yatta. Each plot includes subspecies labeled as sim, ref, acu, obt, ari, cam and min. The vertical axis represents the mean growth rate in centimeters per month, ranging from 0 to 12. The box plots display the 25th and 75th percentiles, with the mean indicated by a solid line inside each box. Outliers are present in several plots, marked as individual points outside the whiskers. In Akale, subspecies cam shows the highest median growth rate, while min has the lowest. Maranda displays a similar pattern, with cam having a higher median compared to other subspecies. Mitumbiri shows less variability, with all subspecies having similar median growth rates. Turbo and Yatta both show cam with higher median growth rates, while min remains the lowest. Overall, cam consistently shows higher growth rates across locations, while min tends to have the lowest. The plots reveal variability in growth rates among subspecies and locations, with notable outliers in several cases.
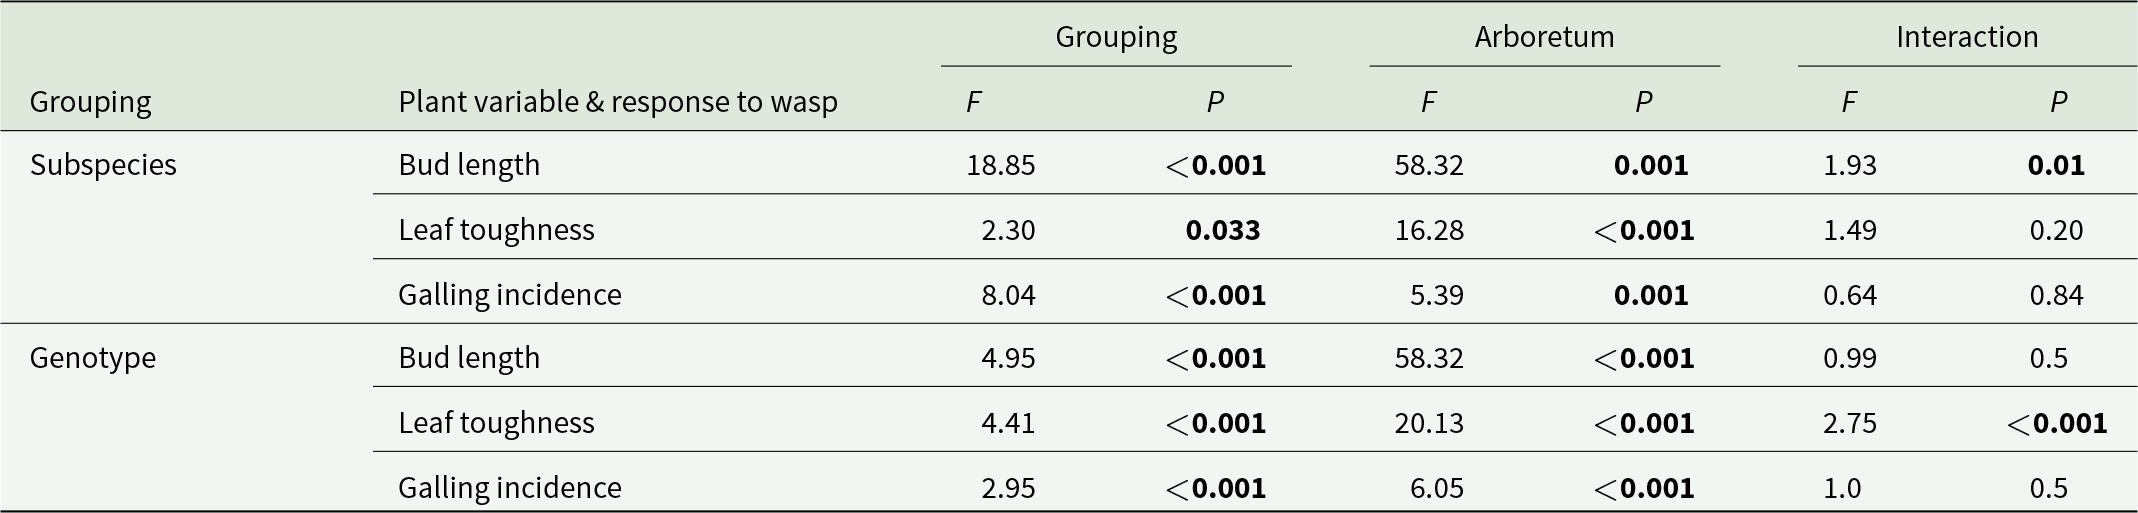
Differences in apical shoot length and leaf toughness were dependent on interactions between subspecies and arboretum location. Although there was variability in the incidence of galling both among subspecies and according to arboretum location, there was no interaction between genotype and arboretum location (table 2).
Interactions among subspecies/genotype and arboretum on leaf physical characteristics and galling

Table 2 Long description
The table reports analysis results for three plant outcomes related to wasp response: bud length, leaf toughness, and galling incidence, tested across either subspecies or genotype, across arboretums, and their interaction. For subspecies, bud length differs strongly by arboretum and also by subspecies, and the subspecies by arboretum interaction is also statistically significant. For subspecies, leaf toughness varies by arboretum and shows a smaller but significant subspecies effect, while the interaction is not significant. For subspecies, galling incidence differs by both subspecies and arboretum, with no meaningful interaction. For genotype, bud length and leaf toughness both show strong arboretum effects and significant genotype effects, but the genotype by arboretum interaction is not significant for bud length and is significant for leaf toughness. For genotype, galling incidence differs by genotype and arboretum, with no significant interaction. Overall, arboretum effects are consistently large across outcomes, and interaction effects are generally absent or modest, so differences are mostly additive rather than strongly dependent on site.
Note: Significant values (P < 0.05) are shown in bold.
Influence of soil nutrients on leaf galling incidence and leaf phenolic composition
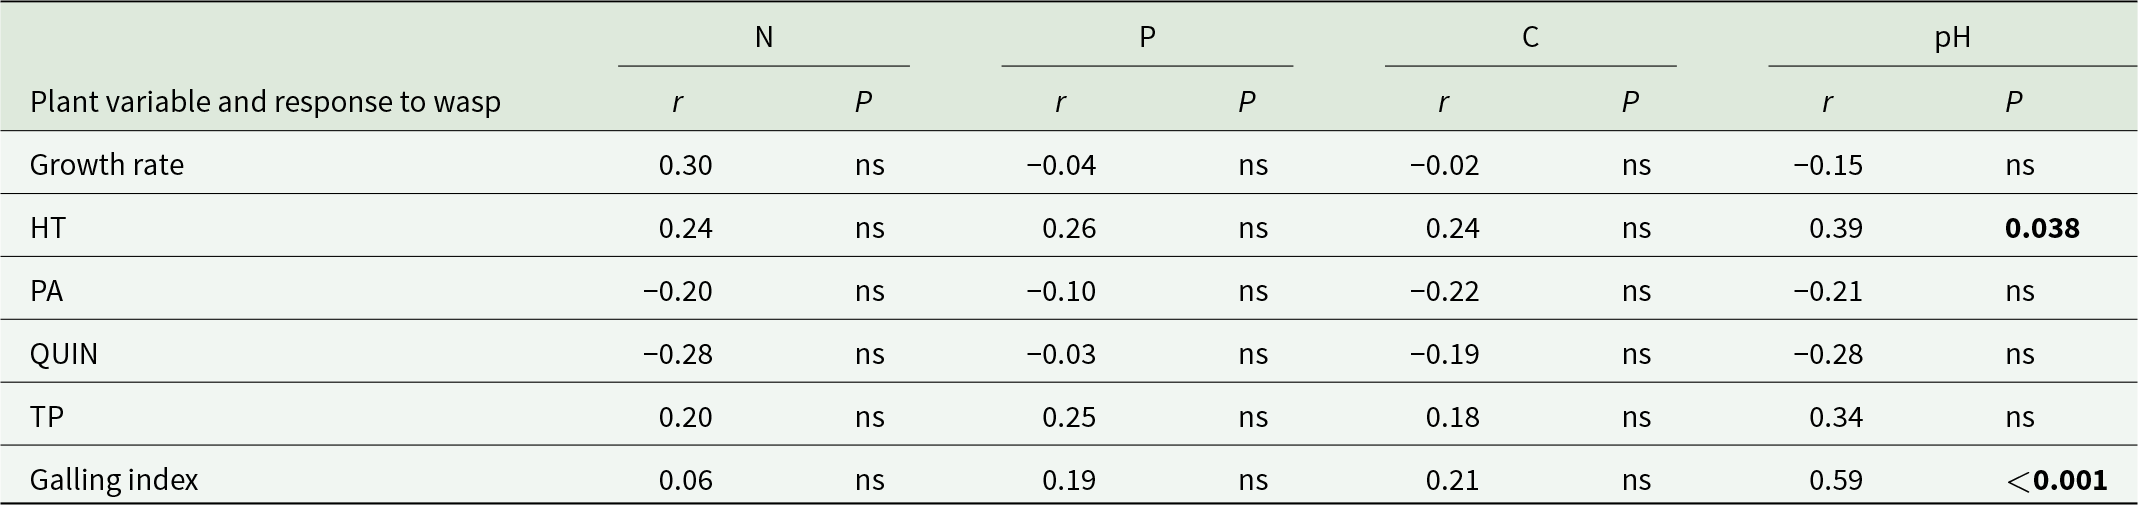
Soil nutrients of locations in Australia from where the seed was sourced were not correlated with susceptibility to gall formation, growth rate, or the abundance polyphenols of the trees grown in Kenya. However, galling index and the concentration of hydrolysable tannins were inversely correlated with soil pH (table 3).
Correlations among soil attributes, growth rate, concentrations of phenolics and galling index across all genotypes

Table 3 Long description
The table reports correlation coefficients and significance tests between four soil attributes (nitrogen, phosphorus, carbon, and pH) and six plant variables, including growth rate, four phenolic measures (HT, PA, QUIN, TP), and galling index. Soil pH has the clearest relationships: galling index is strongly positively correlated with pH and is statistically significant, and HT is moderately positively correlated with pH and is statistically significant. All other pH correlations are not statistically significant, including growth rate, PA, QUIN, and TP. Nitrogen, phosphorus, and carbon show no statistically significant correlations with any listed plant variable or galling index, with coefficients generally small to modest in size. Several phenolic measures trend negative with nitrogen, phosphorus, or carbon, but these patterns are not supported by statistical significance. Interpret results as associations rather than cause and effect, and note that most relationships in the table are not statistically reliable.
Notes: ns, not statistically significant.
Significant values (P < 0.05) are shown in bold.
Arboreta differed significantly in soil macronutrients and physical properties (Appendix 1). Principle component analysis of soil nutrients and characteristics showed that the variability among sites was influenced by pH (component 1) and nitrogen + phosphorus concentrations (component 2; Appendix 2). These two components explained 52.2% of the variation. Although discriminant analysis grouped soils according to the location of arboreta (χ 2 = 25.79, df = 8, P = 0.001), there was no correlation between individual soil nutrients and galling incidence or severity.
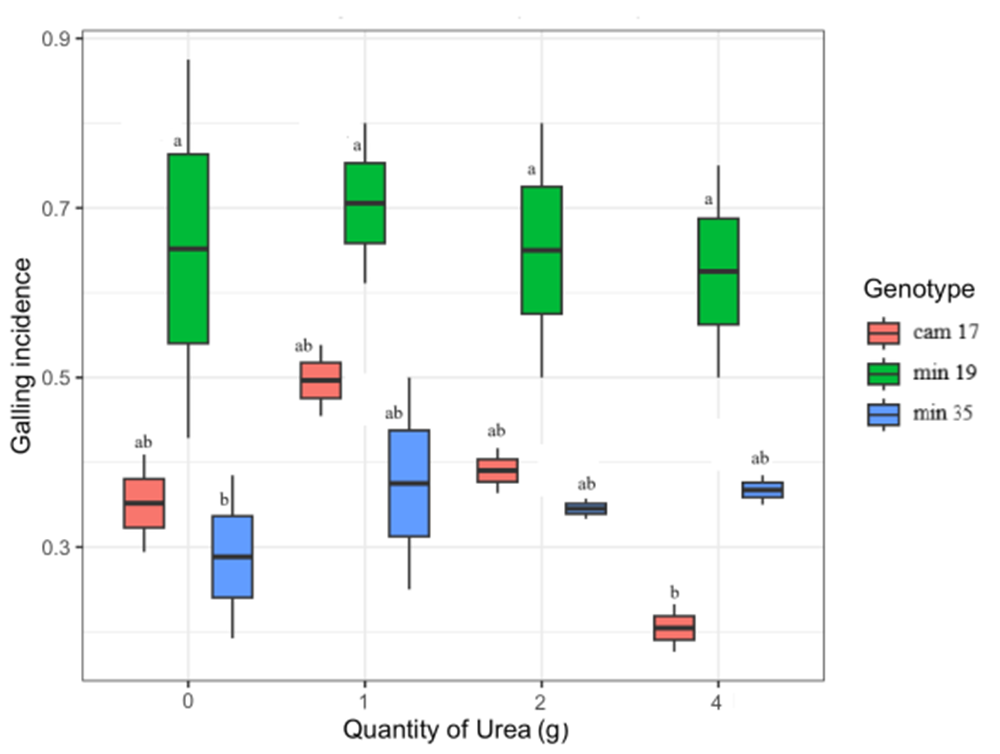
In the glasshouse, plants treated with urea had lower concentrations of total phenolics (F 1,4 = 614.70, P < 0.001) and hydrolysable tannins (F 1,4 = 589.20, P < 0.001) than control plants. The concentrations of QUIN were also reduced but differences among genotypes were not statistically significant (F 1,4 = 0.65, P = 0.95). There was variability in galling incidence between genotypes given different treatments of urea, but differences between treatments were not statistically significant and did not follow any obvious pattern (fig. 3).
Galling incidence on potted plants treated with different quantities of urea. Box and whisker plots show 25th and 75th percentiles (shaded), mean (solid line inside box). Letters indicate similarities of means. The subspecies are abbreviated as: cam = camaldulensis and min = minima.

Figure 3 Long description
The box-and-whisker plot illustrates galling incidence on potted plants treated with varying quantities of urea across three genotypes: cam 17, male 19 and min 35. The horizontal axis represents the quantity of urea in grams, ranging from 0 to 4. The vertical axis represents galling incidence, ranging from 0 to 0.9. Each box plot displays the 25th and 75th percentiles (shaded area), the median (solid line inside the box) and whiskers indicating variability outside the upper and lower quartiles. Outliers are not explicitly marked. For cam 17, the median galling incidence is higher across all urea quantities, with a wider interquartile range at 2 grams. Male 19 shows a consistent median with less variability, while min 35 has the lowest median incidence and narrower interquartile ranges. The plot suggests differences in galling incidence among genotypes, with cam 17 generally exhibiting higher values.
Variability in leaf composition of phenolics in different growing sites
Different sites didn’t show clear differences in the concentrations of QUIN in plants of same subspecies despite variability in the climatic zones where they were grown (table 1, fig. 4A) except in one from, which was not consistent with plants from the same climatic zone. The abundance of total polyphenols differed between sites and damage classes within sites (fig. 4B).
Concentrations of quinic acid derivatives (A) and total polyphenols (B) from plants in field arboreta (Maranda, Mitumbri, Muguga, Turbo, and Yatta, n = 7 each) and in pots (Melbourne, n = 7). Subspecies arida represent highly susceptible genotype while obtuse represent moderately susceptible genotype. Box and whisker plots show 25th and 75th percentiles (shaded), mean (solid line inside box). Letters indicate similarities of means.

Figure 4 Long description
The image consists of two box plots labeled A and B. A. The box plot shows the mean abundance of quinic acid derivatives in milligrams per gram across different sites: Maranda, Melbourne, Mitumbri, Muguga, Turbo and Yatta. The horizontal axis represents the sites and the vertical axis represents the mean abundance in milligrams per gram. The subspecies are indicated by a legend: arida and obtuse. Each box plot displays the median as a solid line inside the box, the interquartile range (25th to 75th percentiles) and whiskers extending to the minimum and maximum values. Outliers are marked as individual points. B. The box plot shows the mean abundance of polyphenols in milligrams per gram across the same sites. The axes and legend are consistent with panel A. The plot similarly displays the median, interquartile range, whiskers and outliers. Comparative differences are visible across sites and subspecies, with variations in median values and spread. Some sites show higher concentrations, while others have wider ranges. The letters indicate similarities of means across different subspecies and sites.
Correlation between the environmental variables of host endemism with host plant characteristics and infestation
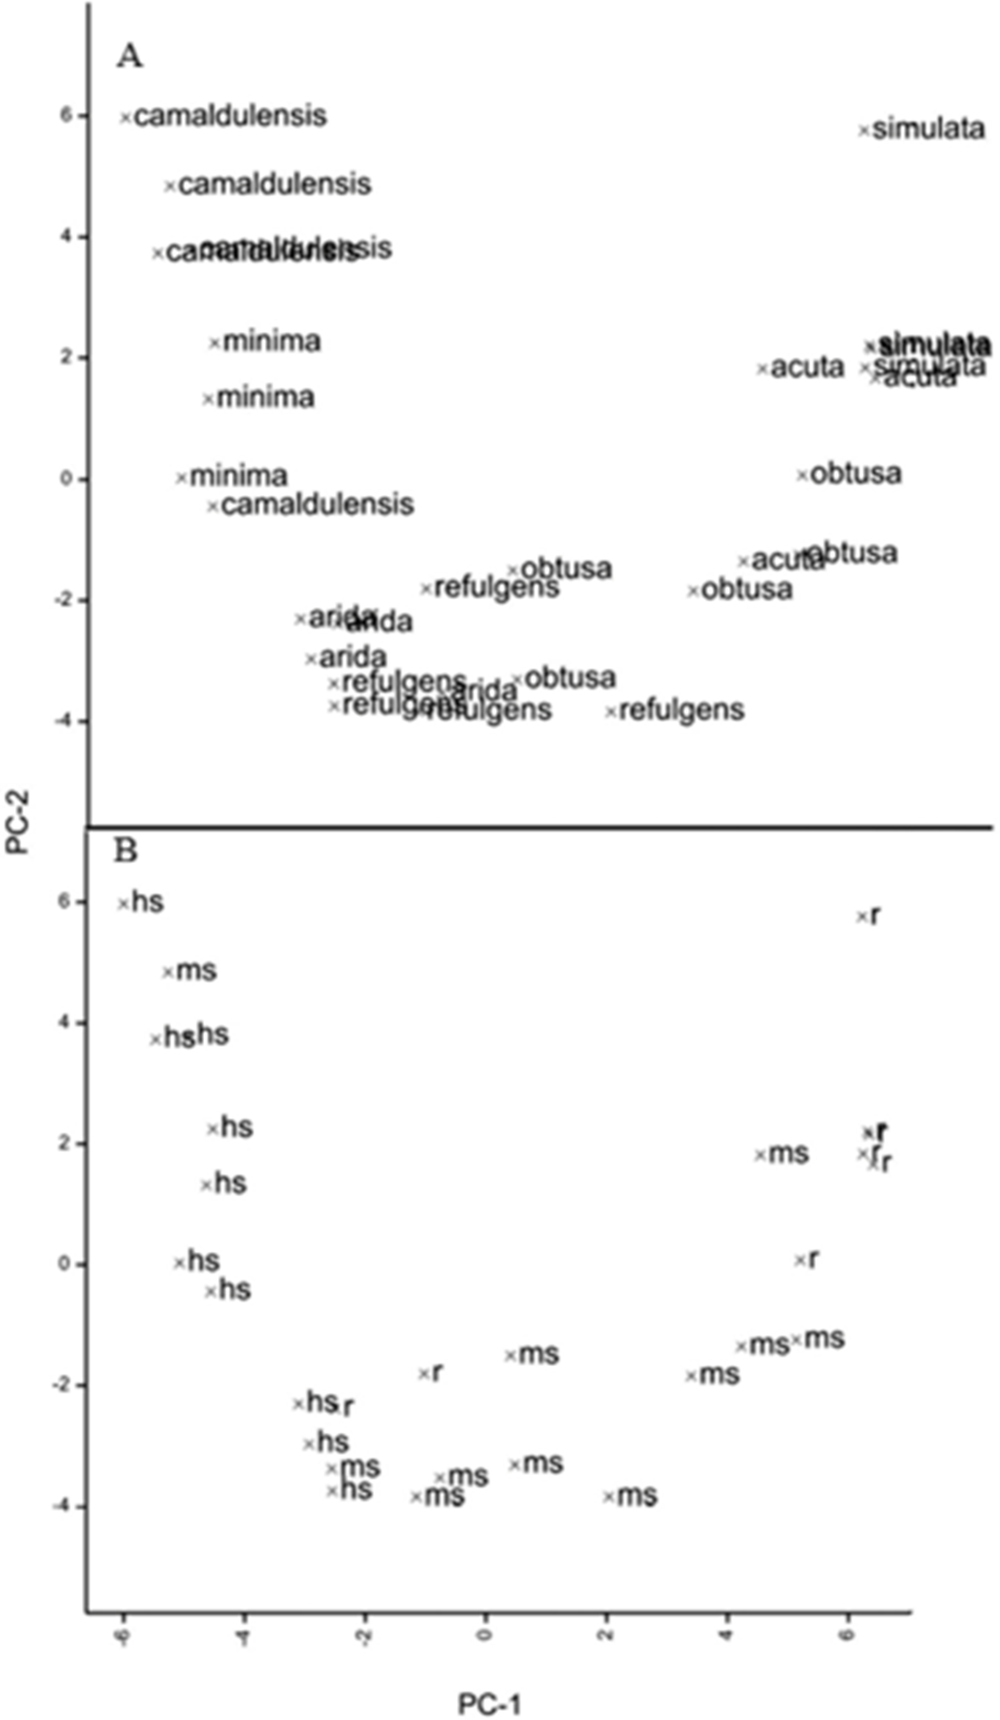
Using principal components analysis, the environmental variables of source locations within Australia grouped the genotypes closely according to subspecies (fig. 5A) but not by resistance status (fig. 5B).
Principal components biplots of climatic variables of seed source of genotypes grouped according to subspecies (A) and according to level of resistance (B).

Figure 5 Long description
The image contains two scatter plots labeled A and B. In plot A, the x-axis is labeled PC-1 and the y-axis is labeled PC-2. It shows the distribution of genotypes grouped according to subspecies. The points are labeled with names such as 'camaldulensis', 'minima', 'obtusa' and 'simulata'. There are clusters of points around 'camaldulensis' and 'obtusa', indicating a grouping by subspecies. In plot B, the x-axis is labeled PC-1 and the y-axis is labeled PC-2. It shows the distribution of genotypes grouped according to resistance level. Points are labeled with codes like 'hs', 'ms' and 'rf'. The distribution is more spread out compared to plot A, with no clear clustering by resistance level. Both plots aim to illustrate the principal components of climatic variables affecting the genotypes, with plot A showing a clearer grouping by subspecies.
In stepwise discriminant analyses, the environmental variables grouped the genotypes into subspecies (χ 2 = 65; P < 0.001; reclassification error rate 17.25) and resistance status (χ 2 = 17.18; P < 0.001; reclassification error rate 11.44). Wilk’s lambda criterion identified precipitation of the wettest week, precipitation seasonality, radiation of warmest quarter, radiation of driest quarter, minimum temperature of the coldest week, radiation of coldest quarter, and radiation seasonality as the most important variables influencing the grouping of genotypes into subspecies while precipitation seasonality and minimum temperature of the coldest week grouped them into resistance status.
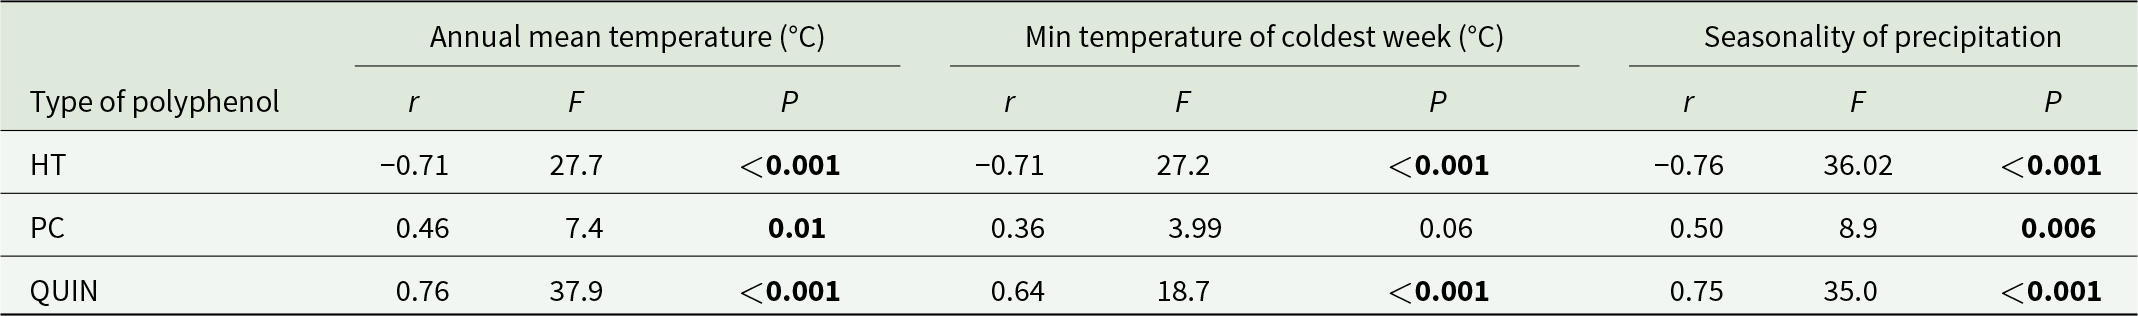
Galling incidence was inversely correlated with seasonality of precipitation (r = −0.74; F 1,27 = 32.65; P < 0.001), mean annual temperature (r = −0.75; F 1,27 = 35.40; P < 0.001), and minimum temperature of the coldest week (r = −0.73; F 1,27 = 30.60; P < 0.001). These climatic variables influenced hydrolysable tannins in a manner opposite to that of QUIN and PC (table 4).
Correlations among climatic variables in region of endemism and concentrations of foliar phenolics

Table 4 Long description
The table reports correlation results between three climate variables and foliar polyphenol types, listing correlation strength along with F and P values. Hydrolysable tannins show strong negative relationships with annual mean temperature, minimum temperature of the coldest week, and precipitation seasonality, each with very small P values. Total quinic acid derivatives show strong positive relationships with the same three climate variables, also with very small P values. Procyanidins show a moderate positive relationship with annual mean temperature and with precipitation seasonality, both statistically significant, but the relationship with minimum temperature of the coldest week is weaker and not statistically significant. Overall, hydrolysable tannins and quinic acid derivatives show opposite, consistently strong patterns across all climate measures, while procyanidins vary by climate variable. These results describe associations and do not establish causation.
Notes: HT, hydrolysable tannins; PC, procyanidins; QUIN, total quinic acid derivatives.
Significant values (P < 0.05) are shown in bold.
Latitudinal influence on leaf galling and polyphenol composition
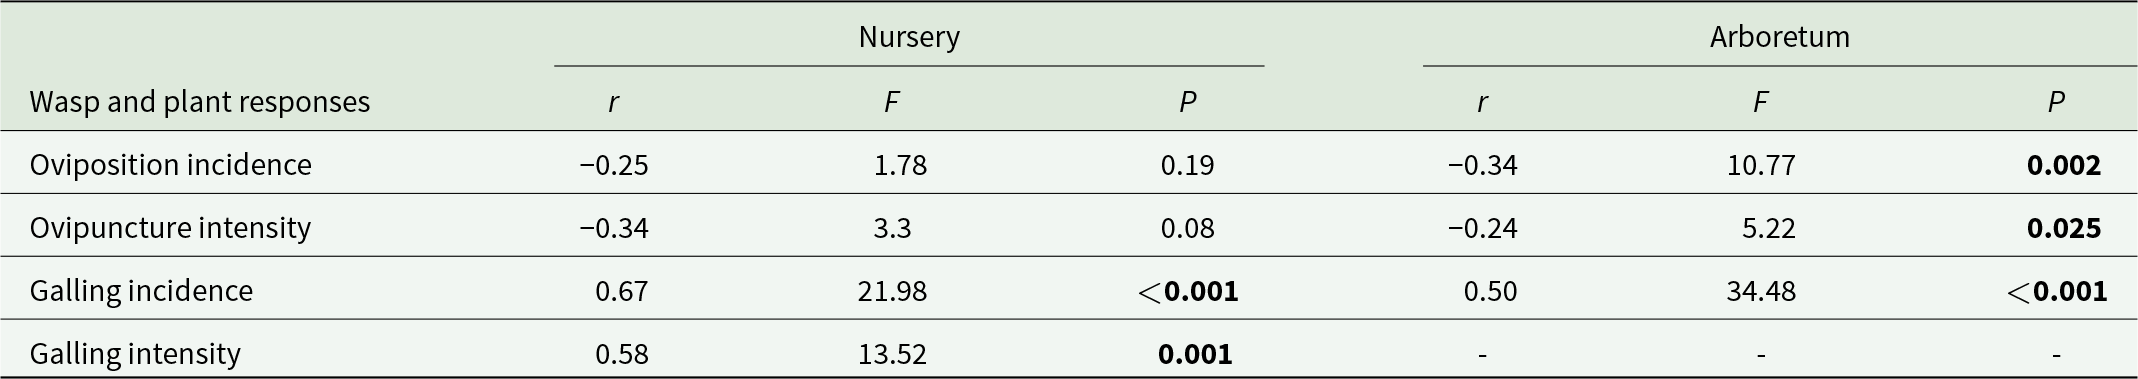
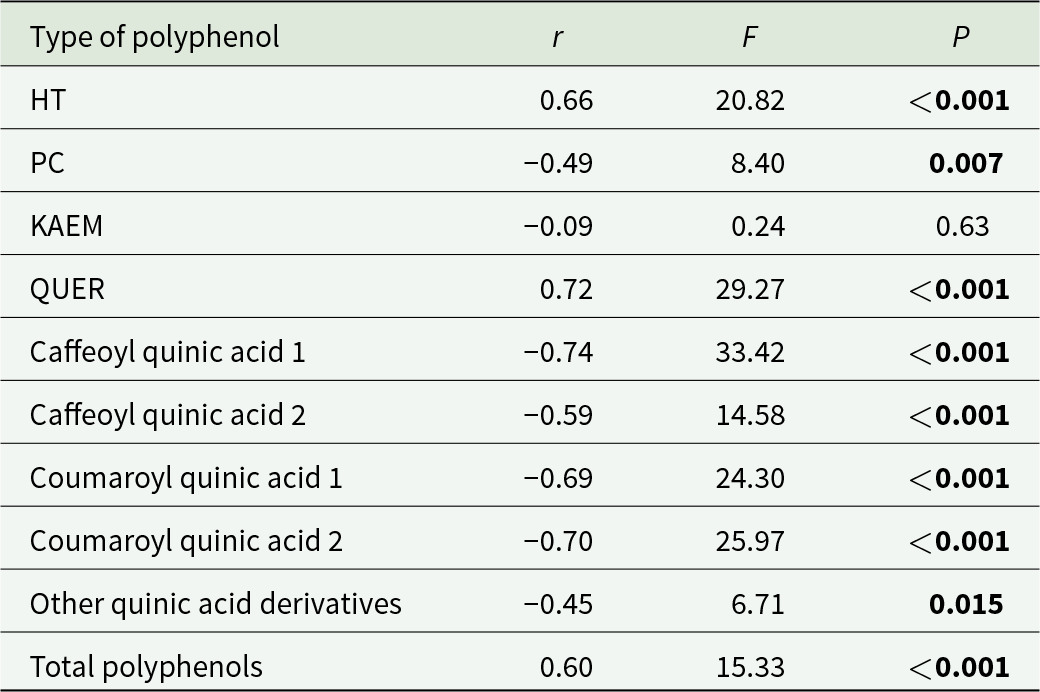
The intensity of galling increased with increasing latitude while oviposition incidence and intensity displayed the inverse relationship (table 5). The concentration of QUIN and PC decreased inversely with latitude while that of hydrolysable tannins, quercetin, and total polyphenols increased with increasing latitude (table 6).
Correlations among latitude of seed source, oviposition by wasps and galling

Table 5 Long description
The table reports correlations between seed-source latitude and four wasp or plant response measures, shown separately for nursery and arboretum settings, with correlation strength and associated test results. Galling incidence shows a strong positive relationship with latitude in the nursery and a moderate positive relationship in the arboretum, and both are statistically significant. Galling intensity is also positively related to latitude in the nursery and is statistically significant, but the arboretum has no reported values for this measure. Oviposition incidence is negatively related to latitude in both settings, but it is only statistically significant in the arboretum. Ovipuncture intensity is also negatively related to latitude in both settings and reaches statistical significance in the arboretum but not in the nursery. Overall, galling responses increase with latitude more consistently and strongly than oviposition responses, and some outcomes differ by setting and by whether data were available.
Note: Significant values (P < 0.05) are shown in bold.
Correlations among latitude of seed source and concentrations of polyphenols

Table 6 Long description
The table reports correlations between seed-source latitude and concentrations of several polyphenol groups, listing the correlation strength, an F statistic, and a P value for each. The strongest positive association is for quercetin derivatives, with a high correlation and a P value below 0.001; hydrolysable tannins and total polyphenols also increase with latitude and are significant. The strongest negative association is for caffeoyl quinic acid 1, with a high-magnitude negative correlation and a P value below 0.001. Other quinic acid derivatives are generally lower at higher latitudes, including caffeoyl quinic acid 2 and both coumaroyl quinic acids, all with P values below 0.001, while “other quinic acid derivatives” shows a moderate negative correlation with a P value of 0.015. Procyanidins show a moderate negative correlation with a P value of 0.007. Kaempferol shows little to no relationship with latitude and is not significant. Statistical significance is indicated by P values below 0.05, but correlations describe association and do not establish causation.
Notes: HT, hydrolysable tannins; PC, procyanidins; KAEM, kaempferol; QUER, quercetin derivatives.
Significant values (P < 0.05) are shown in bold (df = 27 each).
Discussion
We have shown that the growth of genotypes of E. camaldulensis can vary according to geographic location while the expression of chemical resistance was invariable across locations. In addition, patterns of resistance observed under nursery conditions were maintained in field arboreta. The plant growth attributes we measured, such as the growth rate, leaf toughness, and bud length, exhibited strong G × E interactions. Growth rate is a genetically regulated characteristic for which plasticity is desirable in selection programmes targeting performance (Lambers and Poorter, Reference Lambers and Poorter1992). The positive correlation between growth rate and oviposition indicates that faster growing modules offered more soft parenchyma tissue for egg deposition though this did not translate into higher susceptibility which has been shown to be more controlled by plant chemistry (Otieno et al., Reference Otieno, Salminen and Steinbauer2022). While leaf toughness exhibited plasticity due to both genetic and environmental factors as also observed by Read et al. (Reference Read, Sanson and Lamont2005) and Read et al. (Reference Read, Sanson, Caldwell, Clissold, Chatain, Peeters, Lamont, De Garine-Wichatitsky, Jaffré and Kerr2009), it showed no effect on galling.
The absence of any interaction between the genotypes and the environment on susceptibility to galling indicates stability of genotypic resistance – at least at the population densities of L. invasa that our trees were exposed to and the age of tissues when exposed. This is an important attribute for the purposes of plant breeding (Becker and Leon, Reference Becker and Leon1988), especially in the case of L. invasa because previous research has found that the wasp will oviposit in all E. camaldulensis hosts (Otieno et al., Reference Otieno, Salminen and Steinbauer2022). Plasticity of host resistance could have been detrimental since it may be exploited by L. invasa and increase the fitness of the wasp (Fordyce, Reference Fordyce2006) and considering that the wasp has shown tolerance of diverse environments (Otieno et al., Reference Otieno, Nahrung and Steinbauer2019).
Although levels of plant defence and herbivory have been related to nutrient availability (Coley et al., Reference Coley, Bryant and Chapin1985; Fine et al., Reference Fine, Miller, Mesones, Irazuzta, Appel, Stevens, Sääksjärvi, Schultz and Coley2006; Shrivastav et al., Reference Shrivastav, Prasad, Singh, Yadav, Goyal, Ali, Dantu, Naeem, Ansari and Gill2020), our study did not show any influence of soil nutrients on resistance to the wasp. The absence of any correlations with soil nutrients in the place of origin and arboretum of growth indicates that edaphic factors may not have influenced the evolution of putative defences against L. invasa. Variation in nutrient availability to potted plants also did not have an influence on QUIN, although the overall phenolic profile changed in these conditions.
The presence of high concentrations of QUIN was shown to confer resistance to genotypes of E. camaldulensis by Otieno et al. (Reference Otieno, Salminen and Steinbauer2022). Therefore, the presence of these compounds in the shoots of plants growing in locations where plants are likely to have experienced galling by L. invasa, as well as in locations where no galling was observed (e.g. in Melbourne and the protected nursery in Muguga), again confirms that these metabolites are constitutive components of the chemistry of leaves. According to the optimal defence hypothesis, constitutive defensive compounds are prevalent in plants or plant parts that experience frequent insect attack (McKey, Reference McKey, Rosenthal and Janzen1979; Zangerl and Bazzaz, Reference Zangerl, Bazzaz, Fritz and Simms1992; Zangerl and Rutledge, Reference Zangerl and Rutledge1996) and should occur in eucalypts (Heatwole et al., Reference Heatwole, Lowman and Abbott1999). Nevertheless, only one study has presented evidence linking a group of eucalypt secondary metabolites to defence against an individual species of insect (Steinbauer and Tanha, Reference Steinbauer and Tanha2023).
Our study found that higher susceptibility was associated with the lower temperatures of the higher latitudes in seed source locations. Many authors have observed that plants in the tropics are better defended against herbivores than those in higher latitudes (Rasmann and Agrawal, Reference Rasmann and Agrawal2011; Woods et al., Reference Woods, Hastings, Turley, Heard and Agrawal2012; Więski and Pennings, Reference Więski and Pennings2014). Nevertheless, we cannot rule out the possibility that QUIN could be adaptations for protecting leaves against photodamage in cold environments (Moore et al., Reference Moore, Wallis, Wood and Foley2004). The genotypes of E. camaldulensis from northern Australia (regions with warmer climates) are believed to be evolutionarily older lineages than those from higher latitude, colder regions (Butcher et al., Reference Butcher, McDonald and Bell2009). Consequently, the evolutionary age of the interaction between the wasp and its hosts could also explain latitudinal variability in resistance because younger plant taxa have been observed to support more galling insect species (Fernandes and Price, Reference Fernandes and Price1992). This finding corroborates distribution modelling results which have revealed that the most suitable region for origin of the invasive population of L. invasa in Africa lies in southern Australia (Otieno et al., Reference Otieno, Nahrung and Steinbauer2019). Our research, however, could not explain an increase in hydrolysable tannins with increasing latitude which could point to their role in providing protection against other herbivore pests or photodamage.
The linkage of the phenolic defensive metabolites to the environmental conditions of their respective regions of endemism in Australia, as seen in the groupings in the multivariate analyses, agrees with the phylogenetic conservatism hypothesis (Balagawi et al., Reference Balagawi, Drew and Clarke2013). However, it is unlikely that they have been shaped by galling by L. invasa alone but rather in response to endemic insect herbivore community pressure in Australia (Agrawal et al., Reference Agrawal, Conner, Johnson, Wallsgrove and Poulin2002; Johnson and Agrawal, Reference Johnson and Agrawal2005) or possibly maladaptations on coevolution (Thompson et al., Reference Thompson, Nuismer and Gomulkiewicz2002).
Irrespective of whether the resistance we have identified is specific or not, the identification of genes controlling resistance conferring traits and analysis of their performance in progeny trials could provide a better understanding of the direction of evolutionary processes involved in this system as well as opportunities to develop improved genotypes for planting in seed orchards by breeders and farmers. The genotypes identified to be resistant to the wasp can be adopted for growing in infested areas, as has been a common silvicultural practice for the mitigation of outbreaks of key insect pests and diseases for many decades (Henery, Reference Henery2011; Naidoo et al., Reference Naidoo, Slippers, Plett, Coles and Oates2019), while breeding research continues.
Acknowledgements
We thank Jane Njuguna, Benard Kigomo (in memoriam), and Ely Mwanza (KEFRI) for supporting this research. We are grateful to the technical staff of KEFRI Forest Health Department for assisting with nursery and field work, the staff of the La Trobe Wildlife Sanctuary Nursery for potting mix and access to potting facilities as well as Robert Evans, Kevin Farnier, Umar Lubanga, Santosh Khanal, and Reza Tanha for assistance with the maintenance of the potted plants in the Agriculture Reserve, LTU. We thank Anne Koivuniemi, Suvi Vanhakylä, and Marianna Manninen (University of Turku) for help with analyses of polyphenols. We appreciate the statistical advice provided by Simon Watson (LTU). This Research was supported by an Australia Awards for Africa (Australian Government – Department of Foreign Affairs and Trade) scholarship and research funds awarded to BAO. Additional research funding was provided by the Department of Ecology, Environment and Evolution, LTU, and KEFRI.
Author contributions
BAO and MJS conceived and designed the experiments/arboreta; BAO, MJS, and JPS performed the experiments/chemical analyses; BAO and MJS analysed the data; BAO and MJS led writing of the manuscript. All authors contributed to the manuscript prior to review and gave final approval for its publication.
Competing interests
The authors of this manuscript declare they have no conflict of interest to disclose.
Appendix 1 Chemical properties of arboretum soil samples. Significant values (P < 0.05) are shown in bold

Appendix 2 PCA loadings for soil chemical properties


 Open access