

Introduction
In recent years, the mineralogy and geochemistry of tellurium have attracted increasing attention from experts (Christy et al., Reference Christy, Mills and Kampf2016; Krivovichev et al., Reference Krivovichev, Krivovichev and Charykova2020; Missen et al., Reference Missen, Ram, Mills, Etschmann, Reith, Shuster, Smith and Brugger2020). A number of new tellurium oxysalts were described as a result of the discovery of new Te mineral localities (e.g. Otto Mountain, Blue Bell Mine and Noth Star Mine in the USA, Ozernovskoe and Khokhoy Deposits in Russia) and investigation of new material from well-known Te deposits (Moctezuma Mine in Mexico, Tambo Mine in Chile etc.). In the course of the study by scanning electron microscopy with energy-dispersive spectrometry (SEM-EDS) of the fragments of quartz-sulfide veins from the abandoned Boevskoe (Russian Cyrillic – Боевское) W-Be deposit, Southern Urals, Russia, we encountered a supergene mineral phase having essential Pb, Te, S and O and a stoichiometry differing from all the already existing minerals with the same species-defining elements such as adanite, Pb2(Te4+O3)(SO4) (Kampf et al., Reference Kampf, Housley, Rossman, Yang and Downs2020a), fairbankite, Pb2+12(Te4+O3)11(SO4) (Missen et al., Reference Missen, Rumsey, Mills, Weil, Najorka, Spratt and Kolitsch2021), northstarite, Pb6(Te4+O3)5(S6+O3S2–) (Kampf et al., Reference Kampf, Housley and Rossman2020b) and schieffelinite, Pb10Te66+O20(OH)14(SO4)(H2O)5 (Williams, Reference Williams1980; Kampf et al., Reference Kampf, Mills, Housley, Rumsey and Spratt2012). Subsequent investigations of its crystal structure in combination with Raman and wavelength-dispersive spectroscopies showed this phase to be a new anhydrous lead tellurite sulfate thiosulfate. The simultaneous presence of both sulfate and thiosulfate groups as species-defining constituents is remarkable and recorded for the first time in a mineral. It was named boevskite [pronounced: bo ǝ vskait; Russian Cyrillic – боевскит] after the type locality. The new mineral, its name and symbol (Boe) have been approved by the Commission on New Minerals, Nomenclature and Classification of the International Mineralogical Association (CNMNC-IMA) (IMA2024-041, Kasatkin et al., Reference Kasatkin, Zubkova, Škoda, Gurzhiy, Nestola, Biagioni, Agakhanov, Britvin, Plašil and Kuznetsov2024). The holotype specimen is deposited in the systematic collection of the Fersman Mineralogical Museum of the Russian Academy of Sciences, Moscow with the catalogue number 98802.
Occurrence and general appearance
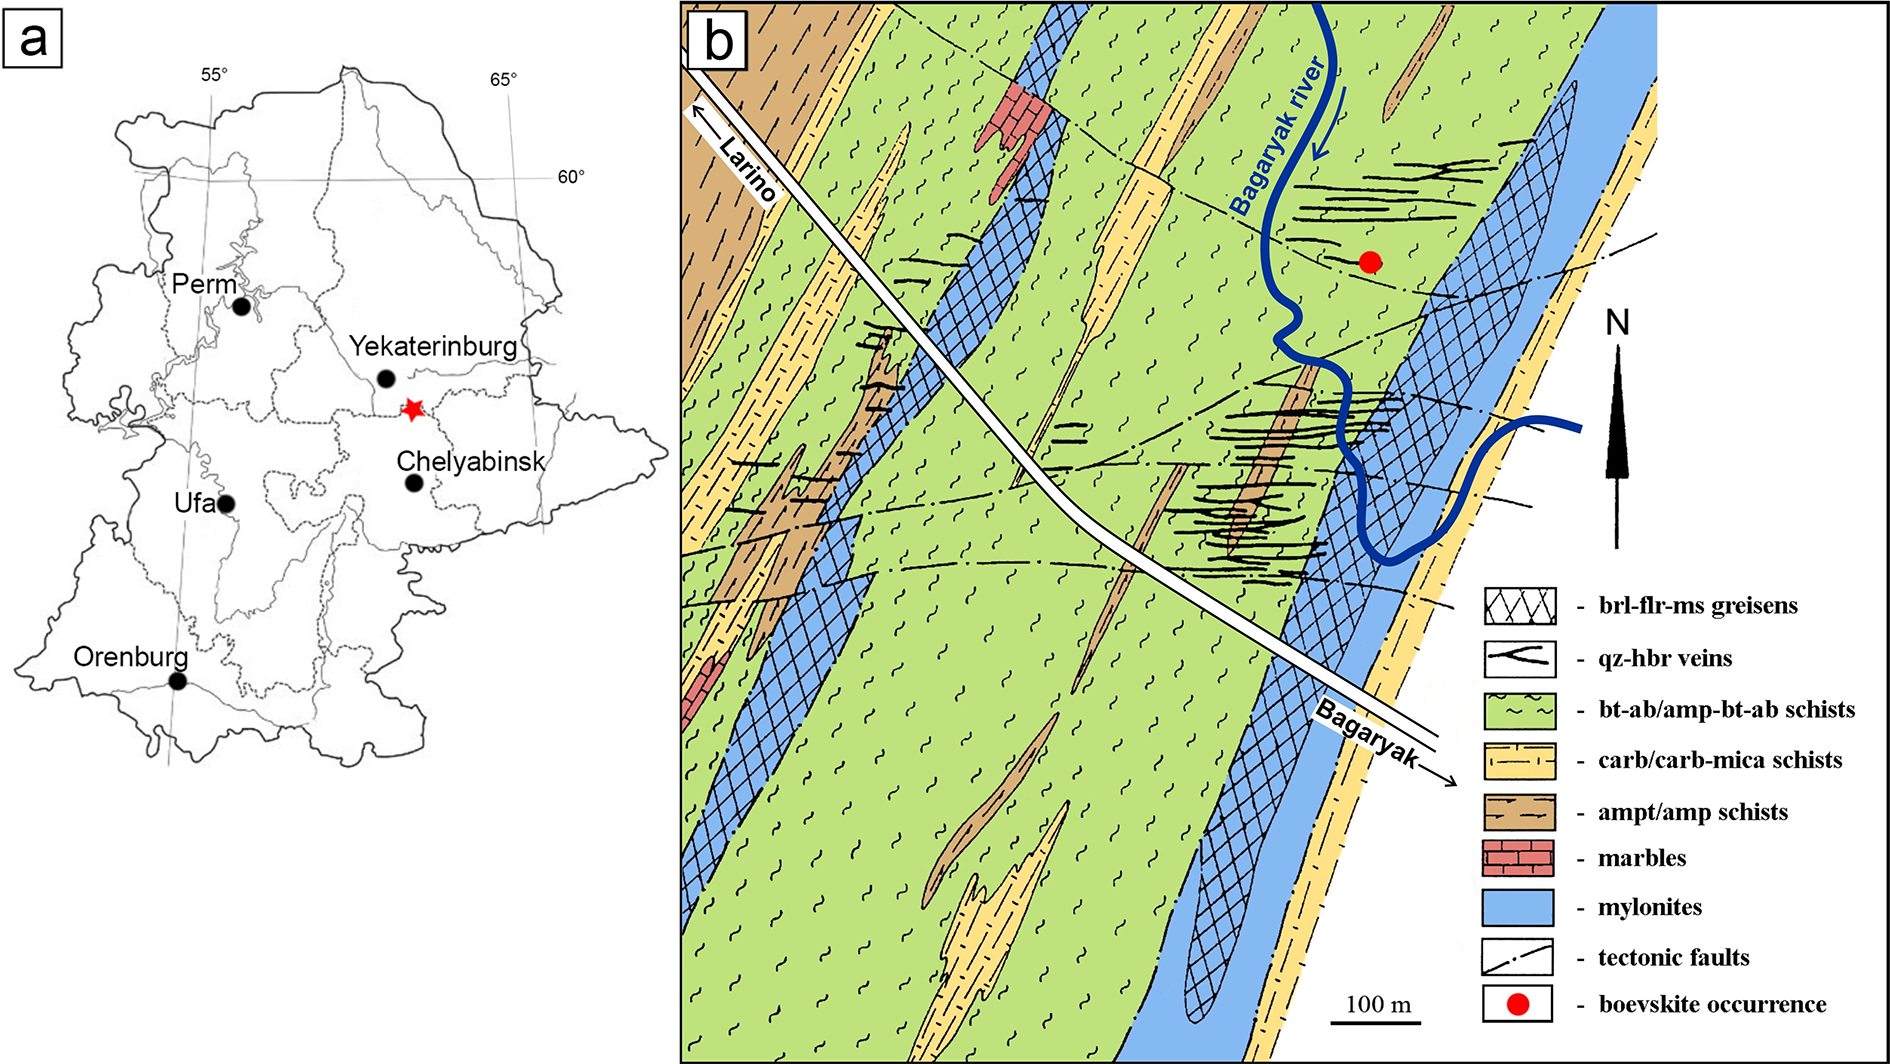
The new mineral occurs at the Boevskoe W-Be deposit, 35 km SW of the city of Kamensk-Uralskiy, Kaslinskiy District, Chelyabinsk Oblast, Southern Urals, Russia (56°14’44’’N, 61°22’26’’E; WGS84) (Fig. 1a).
(a) Geographical position and (b) geological scheme of the Boevskoe deposit (drawn and modified after Zoloev et al., Reference Zoloev, Levin, Mormil and Schardakova2004). Abbreviations: brl – beryl, flr – fluorite, ms – muscovite, qz – quartz, hbr – hübnerite, bt – biotite, ab – albite, amp – amphibole, carb – carbonaceous, mica – micaceous, ampt – amphibolite.

Figure 1 Long description
The image consists of two parts. The first part shows a map highlighting several cities in Russia, including Perm, Yekaterinburg, Ufa, Orenburg and Chelyabinsk. The cities are marked with dots. The deposit is marked just north of Chelyabinsk with a red star. The second part is a geological scheme of the Boevskoe deposit. It includes various geological features such as quartz veins, carbonaceous mica schists, amphibole schists, marbles, mylonites and tectonic faults. The scheme uses different patterns and colours to represent these features.
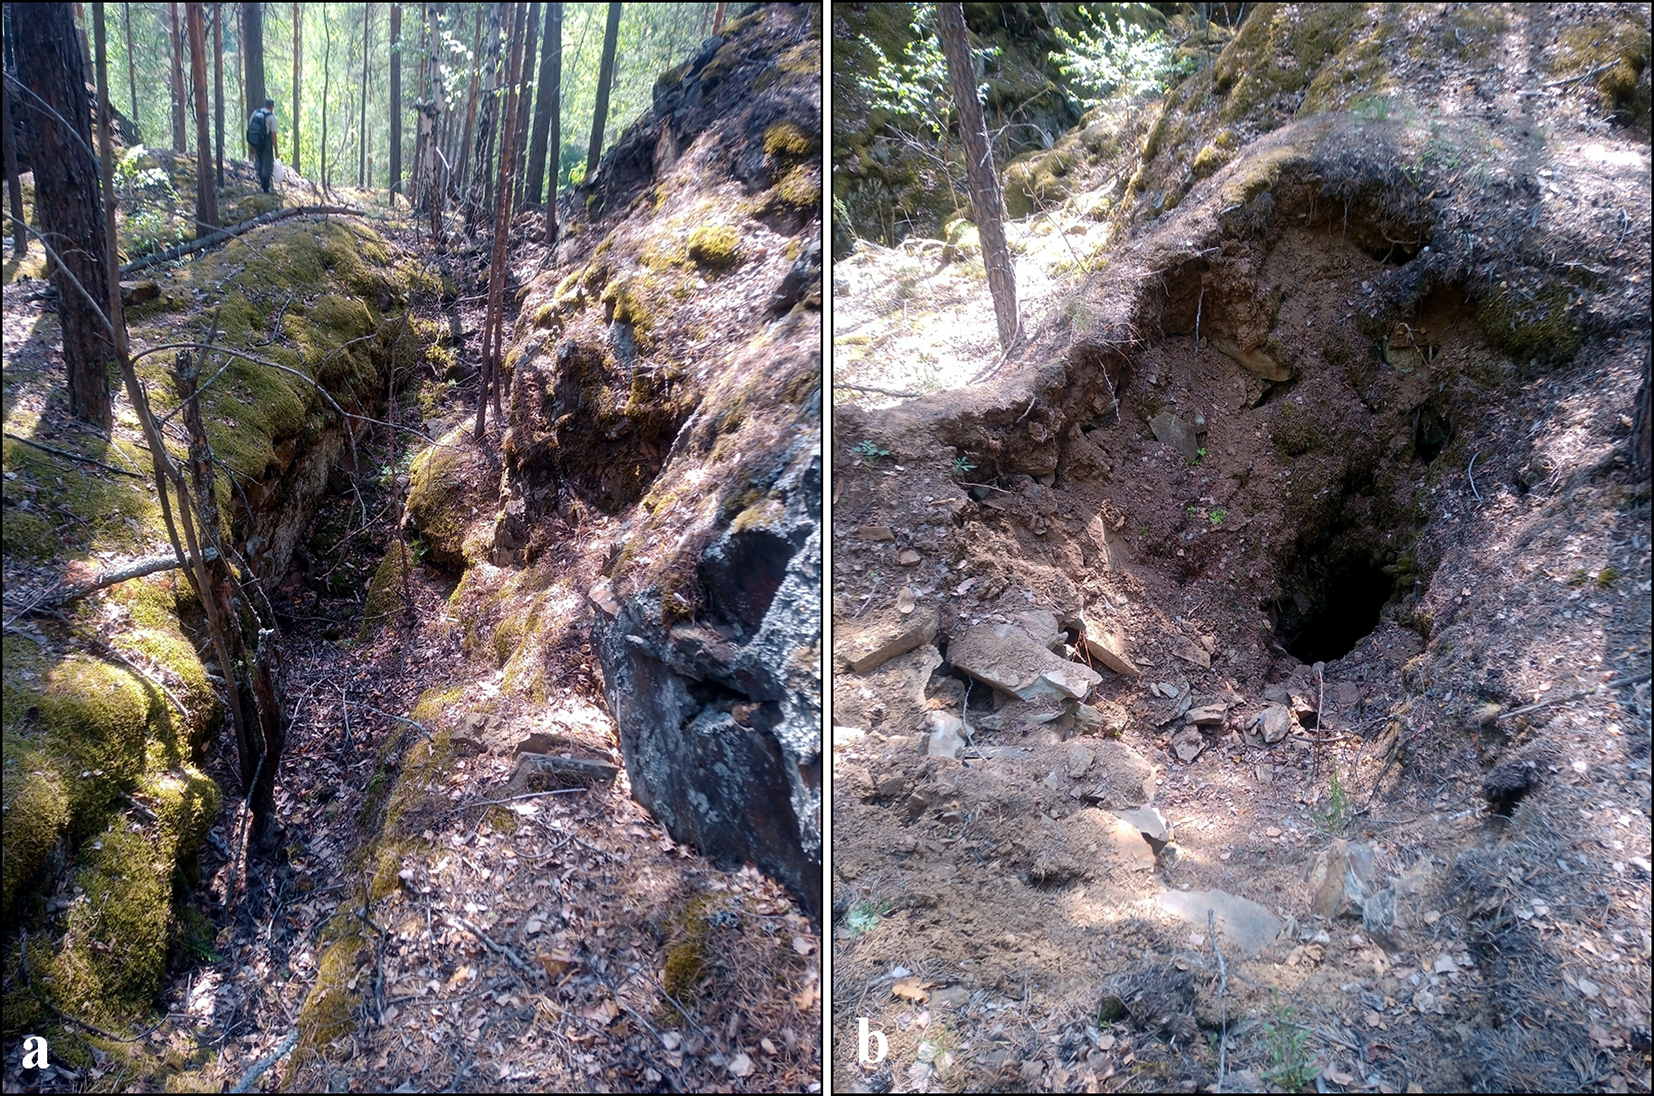
The Boevskoe deposit has been mined for tungsten since the end of 19th Century. It is known as the first tungsten deposit in Russia. For instance, during the second World War more than 80 tons of tungsten concentrate were mined. In the end of the 1940s, due to the low tungsten content in the ores compared to other deposits discovered at that time, the Boevskoe deposit was classified as a small-scale mining site and abandoned. In 1957, prospecting workings resumed and led to the discovery of beryl-fluorite-muscovite greisens with beryllium mineralization. The deposit was evaluated as large for beryllium reserves but poor for average beryllium content (0.12% BeO). Consequently, the industrial mining of beryllium ore never started. Currently, the deposit consists of numerous forested ditches up to several metres deep and collapsed adits (Fig. 2a,b).
(a) The general view of the abandoned mine at the Boevskoe W-Be deposit. May 2023. Photo by Pavel Andrushchenko; (b) collapsed adit on the border of which the specimens with boevskite were collected (‘boevskite occurrence’); FOV 0.7 m. July 2023. Photo by Alexey Kuznetsov.

Figure 2 Long description
The image A shows a general view of an abandoned mine site with forested ditches. The area is surrounded by trees and the ground is uneven with visible moss-covered rocks. The image B shows a collapsed adit at the site. The entrance is partially covered with soil and debris and the surrounding area is forested with trees and shrubs.
Geologically, the deposit is confined to the main fault that controls the location of the Boyevsko-Biktimirovskaya ore zone and comprises three tectonic blocks: western, eastern and central. In the western block, amphibolites are predominantly developed over pyroxene-plagioclase porphyrites and their tuffs (Fig. 1b). The eastern block is composed of carbonaceous, carbonaceous-micaceous schists and metamorphosed tuffaceous rocks. The central block is composed of biotite-albite and amphibole-biotite-albite schists, which are the result of metamorphism of the Middle Devonian volcanic-sedimentary and carbonate-terrigenous sedimentary rocks. The latter contain a subvolcanic body of metamorphosed gabbro, where quartz veins with wolframite (hübnerite) are confined. The central block includes two tectonic zones, western and eastern, each with a thickness of 200–300 m. The zones are sheet-like, consist of mylonites, and control fluorite-beryl metasomatic mineralization. Quartz-hübnerite veins have a sublatitudinal strike (70–80°) and dip to the south at angles of 60–90°. Main minerals of the veins are quartz, muscovite, fluorite, beryl, hübnerite and pyrite. Subordinate minerals include phenakite, fluorapatite, microcline, albite, calcite, scheelite, galena, sphalerite, pyrrhotite, rutile and supergene stolzite. The presence of sulfides in the ores of the deposit along with fluorite led to the formation of sulfuric and hydrofluoric acids in the oxidation zone and the active development of supergene processes to a depth of 100 metres (Rundqvist and Chistyakov, Reference Rundqvist and Chistyakov1960; Zabolotnaya, Reference Zabolotnaya1978; Zoloev et al., Reference Zoloev, Levin, Mormil and Schardakova2004; Kupriyanova and Shpanov, Reference Kupriyanova and Shpanov2011; Ponomarev et al., Reference Ponomarev, Erokhin and Grigoriev2022).
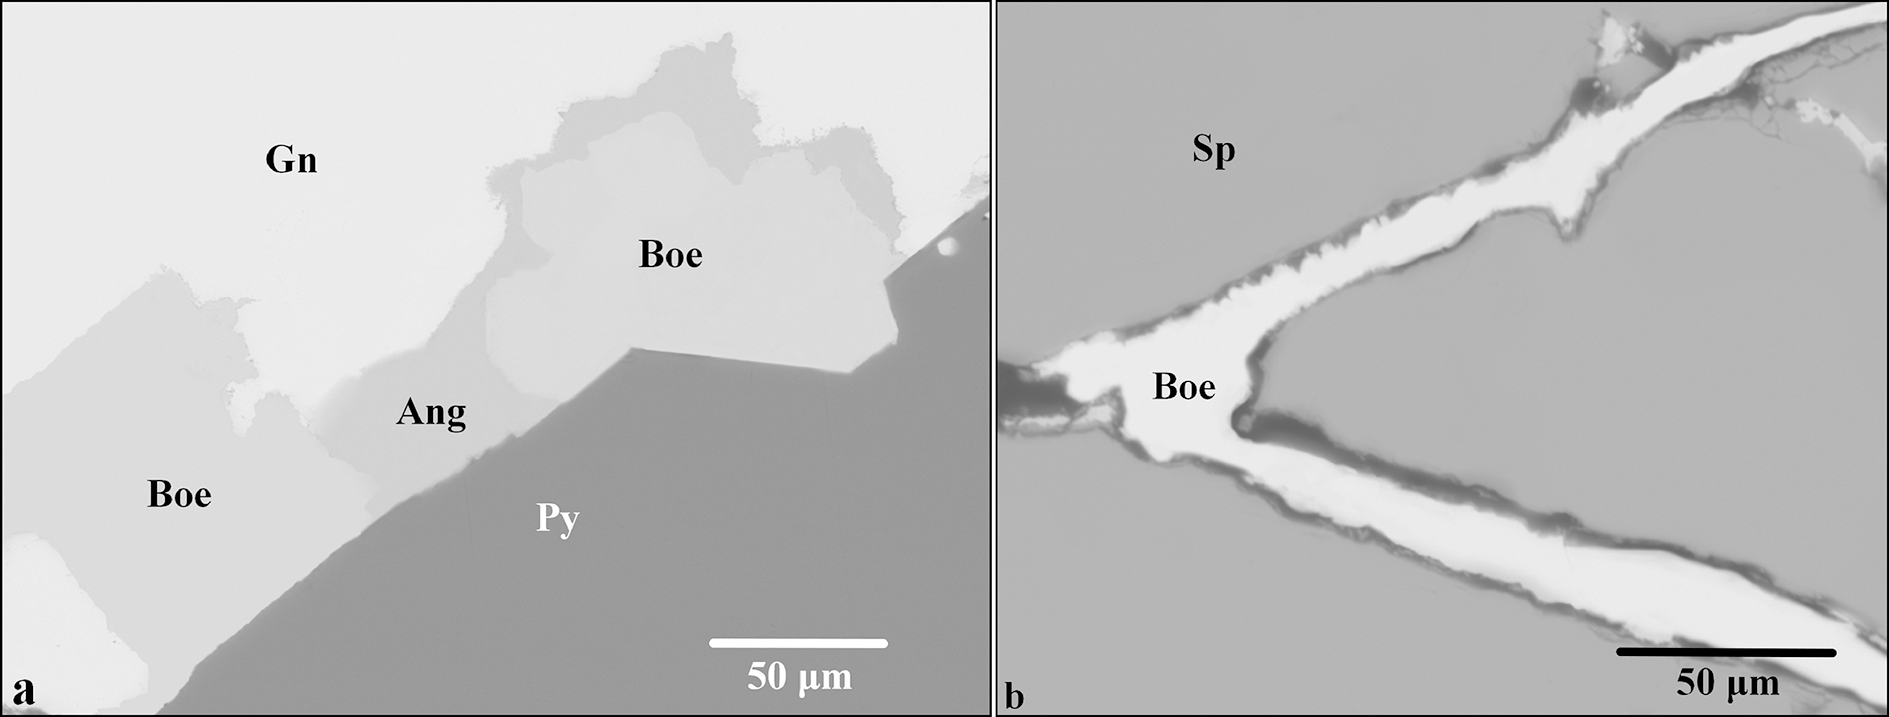
The samples containing the new mineral were collected in May and July 2023 on the border of an old collapsed adit used for tungsten mining in the first half of 20th Century (Fig. 2b). Macroscopically, the samples are represented by fragments of a quartz vein with visible galena, pyrite, sphalerite and muscovite. Boevskite was discovered during SEM-EDS analysis of polished sections prepared from these samples. The new mineral occurs as very rare idiomorphic grains up to 0.25 mm developed at the contact of galena and pyrite (Fig. 3a), as inclusions in galena up to 0.2 mm, or as thin veinlets up to 0.2×0.03 mm filling cracks in sphalerite (Fig. 3b). Some grains are rimmed by later anglesite. In addition to the minerals mentioned above, boevskite is associated with cerussite and primary chalcopyrite, matildite, pyrrhotite and several tellurides (empressite, hessite, ingodite and joséite-B). The latter occur in the same rock but not in the direct contact with boevskite.
(a) Boevskite (Boe) at the contact of galena (Gn) and pyrite (Py) with anglesite (Ang), sample Boev-3; (b) boevskite veinlets in sphalerite (Sp), sample Boev-5. Polished section. SEM (BSE) images.

Figure 3 Long description
The image A shows a polished section with boevskite labeled as Boe at the contact of pyrite labelled as Py, alongside anglesite labelled as Ang. The scale bar indicates 50 micrometres. The image B shows boevskite veinlets labeled as Boe within sphalerite labeled as Sp. The scale bar also indicates 50 micrometres.
The new mineral was formed as a result of the supergene alteration of the co-existing galena and tellurides (empressite, hessite, ingodite and joséite-B) in the oxidation zone.
The Boevskoe deposit is the type locality of glucine, CaBe4(PO4)2(OH)4·0.5H2O (Grigoriev, Reference Grigoriev1963) and uralolite, Ca2Be4(PO4)3(OH)3·5H2O (Grigoriev, Reference Grigoriev1964). Thus, boevskite is the third new mineral discovered here.
Physical properties and optical data
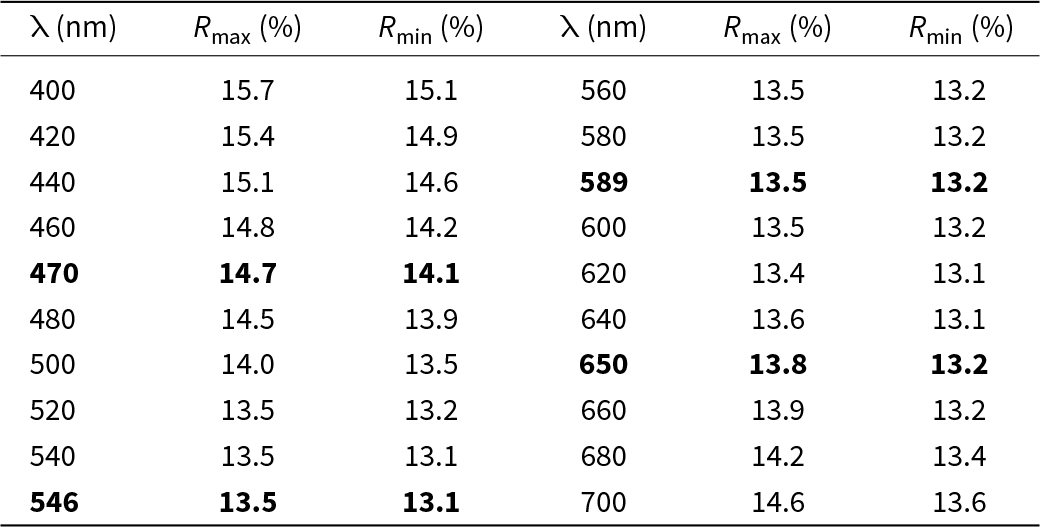
Boevskite is colourless and transparent with a white streak and adamantine lustre. It is brittle, with uneven fracture. No cleavage and parting are observed. It does not fluoresce under ultraviolet light. The Vickers’ micro-indentation hardness (VHN, 10 g load) is 110 kg/mm2 (range 97–124, n = 3), corresponding to a Mohs’ hardness of 2.5–3. The density of the mineral could not be measured due to the very small amount of available material and absence of heavy liquids with suitable density. A density value calculated using the empirical formula and unit-cell volume obtained from single-crystal X-ray diffraction (SCXRD) data is 6.599 g/cm3. Boevskite is biaxial, colourless and non-pleochroic in transmitted plane-polarized light. Its refractive indices (RI) could not be measured because of the absence of immersion liquids that can measure RI values higher than 2.0. The Gladstone–Dale relationship (Mandarino, Reference Mandarino1981) predicts an average index of refraction of 2.08 which is comparable to the value of 2.15 calculated for northstarite, Pb6(Te4+O3)5(S6+O3S2–), the only other thiosulfate–tellurite of Pb (Kampf et al., Reference Kampf, Housley and Rossman2020b). Optical properties of boevskite were therefore studied using the methods common for opaque minerals. In reflected light, boevskite is grey, a little lighter than neighbouring anglesite but a little darker than sphalerite and much darker than galena and especially pyrite. No visible bireflectance and pleochroism are observed. In crossed polars it is weakly anisotropic, in grey tones. Internal reflections were not observed. The set of reflectance measurements performed in air relative to a Si standard by means of an MSF-R (LOMO, St. Petersburg, Russia) microspectrophotometer is given in Table 1.
Reflectance values for boevskite (COM standard wavelengths are given in bold)

Table 1 Long description
The table presents reflectance values for boevskite across various wavelengths, for both maximum (Rmax) and minimum (Rmin) percentages. The COM wavelengths are, in the order lambda, R min, Rmax: 470, 14.7, 14.1; 546, 13.5, 13.1; 589, 13.5, 13.2; 650, 13.8, 13.2.
Raman spectroscopy
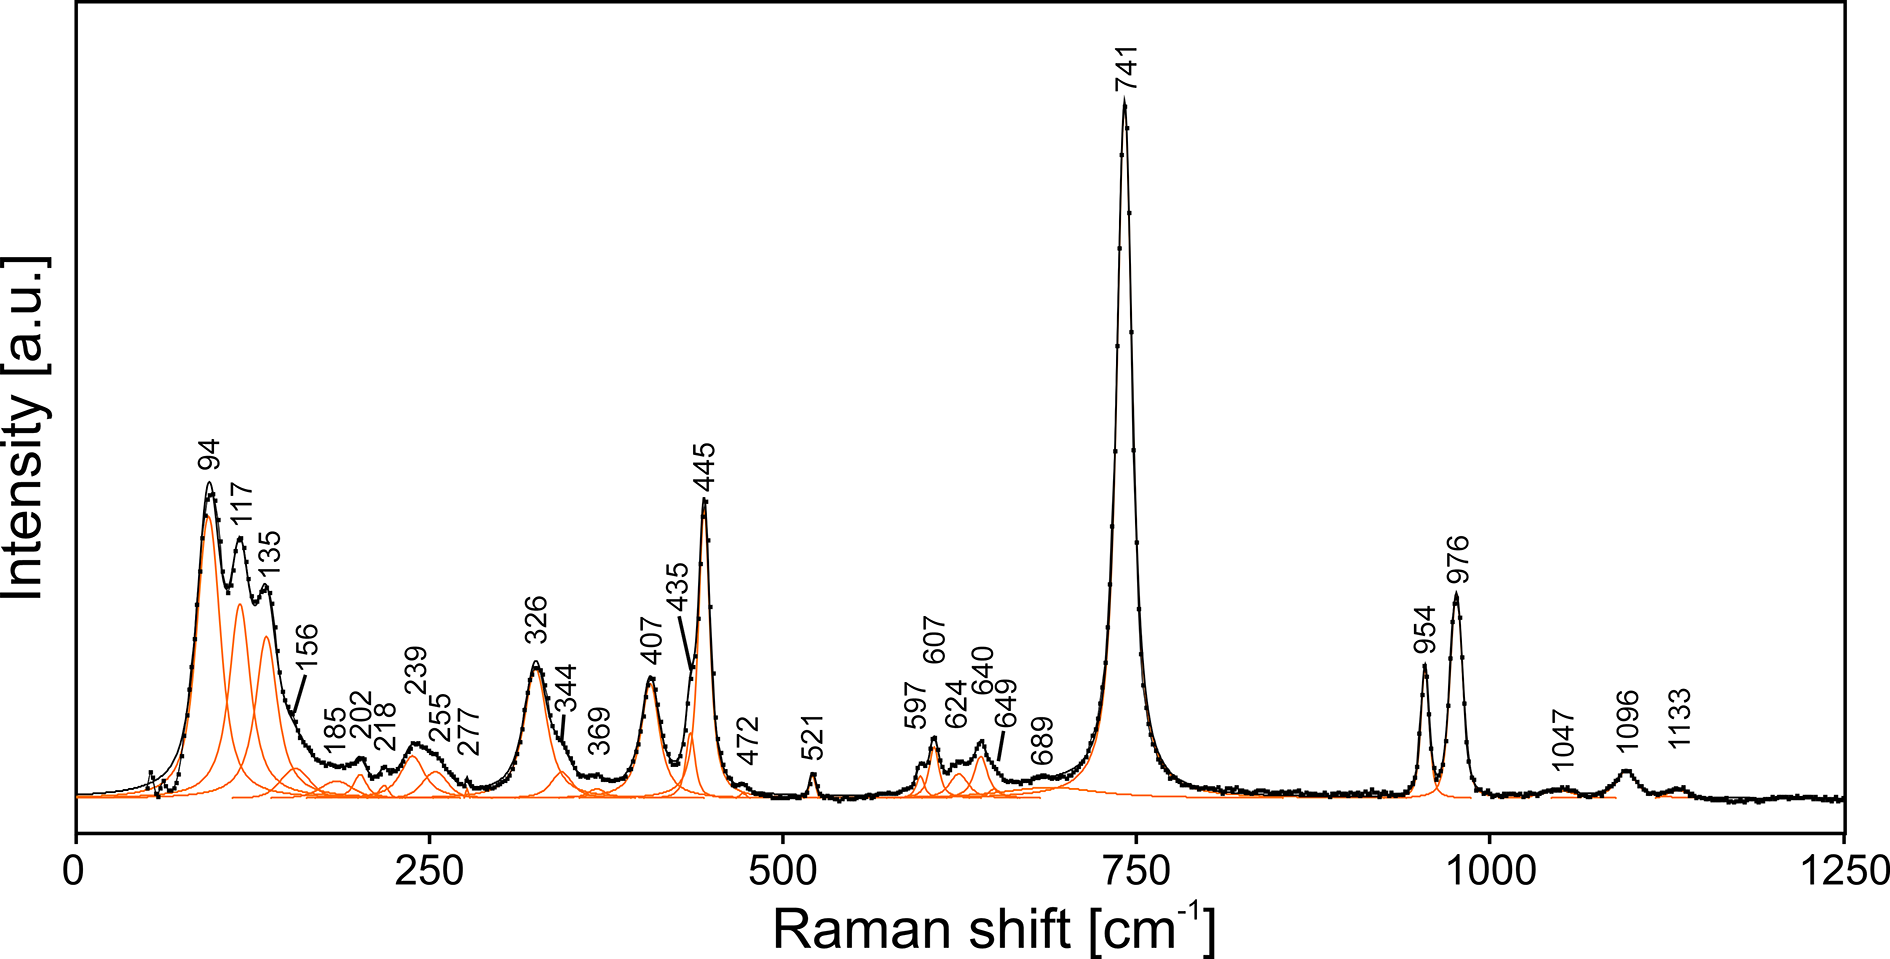
The Raman spectrum of boevskite was obtained by means of a Horiba Labram HR Evolution spectrometer. This dispersive, edge-filter-based system is equipped with an Olympus BX 41 optical microscope, a diffraction grating with 600 grooves per millimetre, and a Peltier-cooled, Si-based charge-coupled device (CCD) detector. The Raman data were collected using a 532 nm laser. The nominal laser beam energy of 50 mW was attenuated to 25% using a neutral density filter to avoid the thermal damage of the analysed area. A Raman signal was collected in the range of 50–4000 cm–1 with a 50× objective and the system being operated in confocal mode with a beam diameter of ∼2.6 μm and an axial resolution of ∼5 μm. Time acquisition was 60 s per spectral window; 5 accumulations and 7 spectral windows were applied to cover the 50–4000 cm–1 range. Wavenumber calibration was done using the Rayleigh line and low-pressure Ne-lamp emissions. The wavenumber accuracy was ∼0.5 cm–1, and the spectral resolution was ∼2 cm–1. Band fitting was done after appropriate background correction, assuming combined Lorentzian–Gaussian band shapes using a Voigt function (PeakFit; Jandel Scientific Software). As there were no Raman bands observed in the region above 1200 cm–1, the Raman spectrum is shown in the range 50–1250 cm–1 (Fig. 4).
The Raman spectrum of boevskite excited by 532 nm laser in the 50–1250 cm–1 region. The measured spectrum is shown by dots. The curve matching to the dots is a result of spectral fit as a sum of individual Voigt peaks shown in red below the curve.

Figure 4 Long description
A graph showing the Raman spectrum with intensity on the y-axis labelled as arbitrary units and Raman shift on the x-axis labelled in centimetres. The graph displays several peaks with specific values marked, including 94, 117, 135, 156, 185, 225, 277, 326, 407, 435, 445, 472, 521, 597, 607, 624, 640, 649, 689, 741, 954, 976, 1047, 1096 and 1133. The most prominent peak is at 741. The spectrum covers a range from 0 to 1250 centimetres.
Raman bands of boevskite were assigned according to the systematic study of synthetic thiosulfates (Gabelica, Reference Gabelica1980) and sulfate and tellurite phases (Buzgar et al., Reference Buzgar, Buzatu and Sanislav2009; Frost et al., Reference Frost, Čejka and Dickfos2009).
Raman scattering in the range 950–1150 cm–1 correspond to stretching vibrations of the SO4 and S2O3 tetrahedra. The more intense bands at 954 and 976 cm–1 correspond to symmetric stretching, whereas the less intense bands at 1047, 1096 and 1133 cm–1 are interpreted as antisymmetric stretching of the SO4 and S2O3 groups. The spectrum of boevskite is dominated by a strong band at 741 cm–1 corresponding to the symmetric stretching vibrations of TeO3 groups. The less intense Raman bands in the region 550–700 cm–1 represent bending modes of SO4 and S2O3 groups overlapping with antisymmetric stretching vibrations of TeO3 groups. The isolated weak Raman band at 521 cm–1 is attributed to a thiosulfate bending mode. Raman bands in the region 300–500 cm–1 are dominated by a sharp, intense band at 445 cm–1 corresponding to vibration of the S–S bond. Additionally, rotation modes of the SO4 and S2O3 groups overlapping with symmetrical bending modes of SO4 and S2O3 groups and bending modes of TeO3 groups are present. The Raman bands < 300 cm–1 are attributed to Pb–O vibrations and lattice modes.
Chemical data
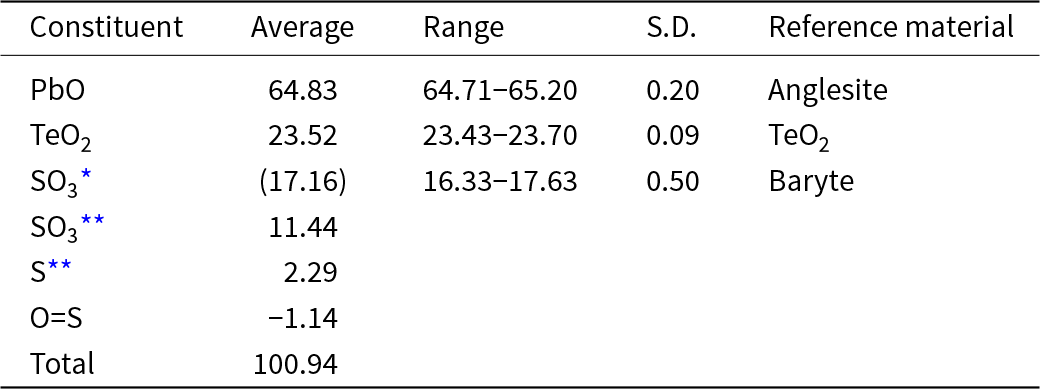
Quantitative chemical analyses were carried out using a Cameca SX 100 electron microprobe (WDS mode, 15 kV, 10 nA, 3 μm beam diameter) at the Department of Geological Sciences, Faculty of Science, Masaryk University, Brno, Czech Republic. The structure determination and Raman spectrum indicate boevskite contains one sulfate and one thiosulfate group, so the measured content of SO3 was allocated as SO3 and S based upon S6+:S2– = 2:1. The crystal structure and Raman spectroscopy data also confirm the absence of H2O, OH groups, as well as B–O, C–O and N–O bonds in the mineral. Contents of other elements with atomic numbers higher than that of C other than Pb, Te, S, and O are below detection limits. Raw X-ray intensities were corrected for matrix interactions using the X-PHI algorithm (Merlet, Reference Merlet1994). Analytical data and the list of standards are given in Table 2.
Chemical composition (in wt.%) of boevskite

Table 2 Long description
The table presents the chemical composition of boevskite, highlighting lead oxide as the major constituent at 64.83% by weight. Tellurium dioxide follows at 23.52%, while sulfur trioxide is noted in two forms: measured at 17.16% and calculated at 11.44%. Reference materials include anglesite for lead oxide and baryte for sulfur trioxide.
* Total measured value; **Calculated values based on the structure (S6+:S2– = 2:1); S.D. – standard deviation.
The empirical formula calculated on the basis of 13 O atoms per formula unit is Pb4.01Te4+2.03S6+1.97S2–0.98O13. The ideal formula of boevskite is Pb4(TeO3)2(SO4)(S2O3), which requires PbO 64.31, TeO2 23.00, SO3 11.53, S 2.31, O=S –1.15, total 100 wt.%.
Boevskite dissolves slowly in concentrated hydrochloric acid.
X-ray crystallography
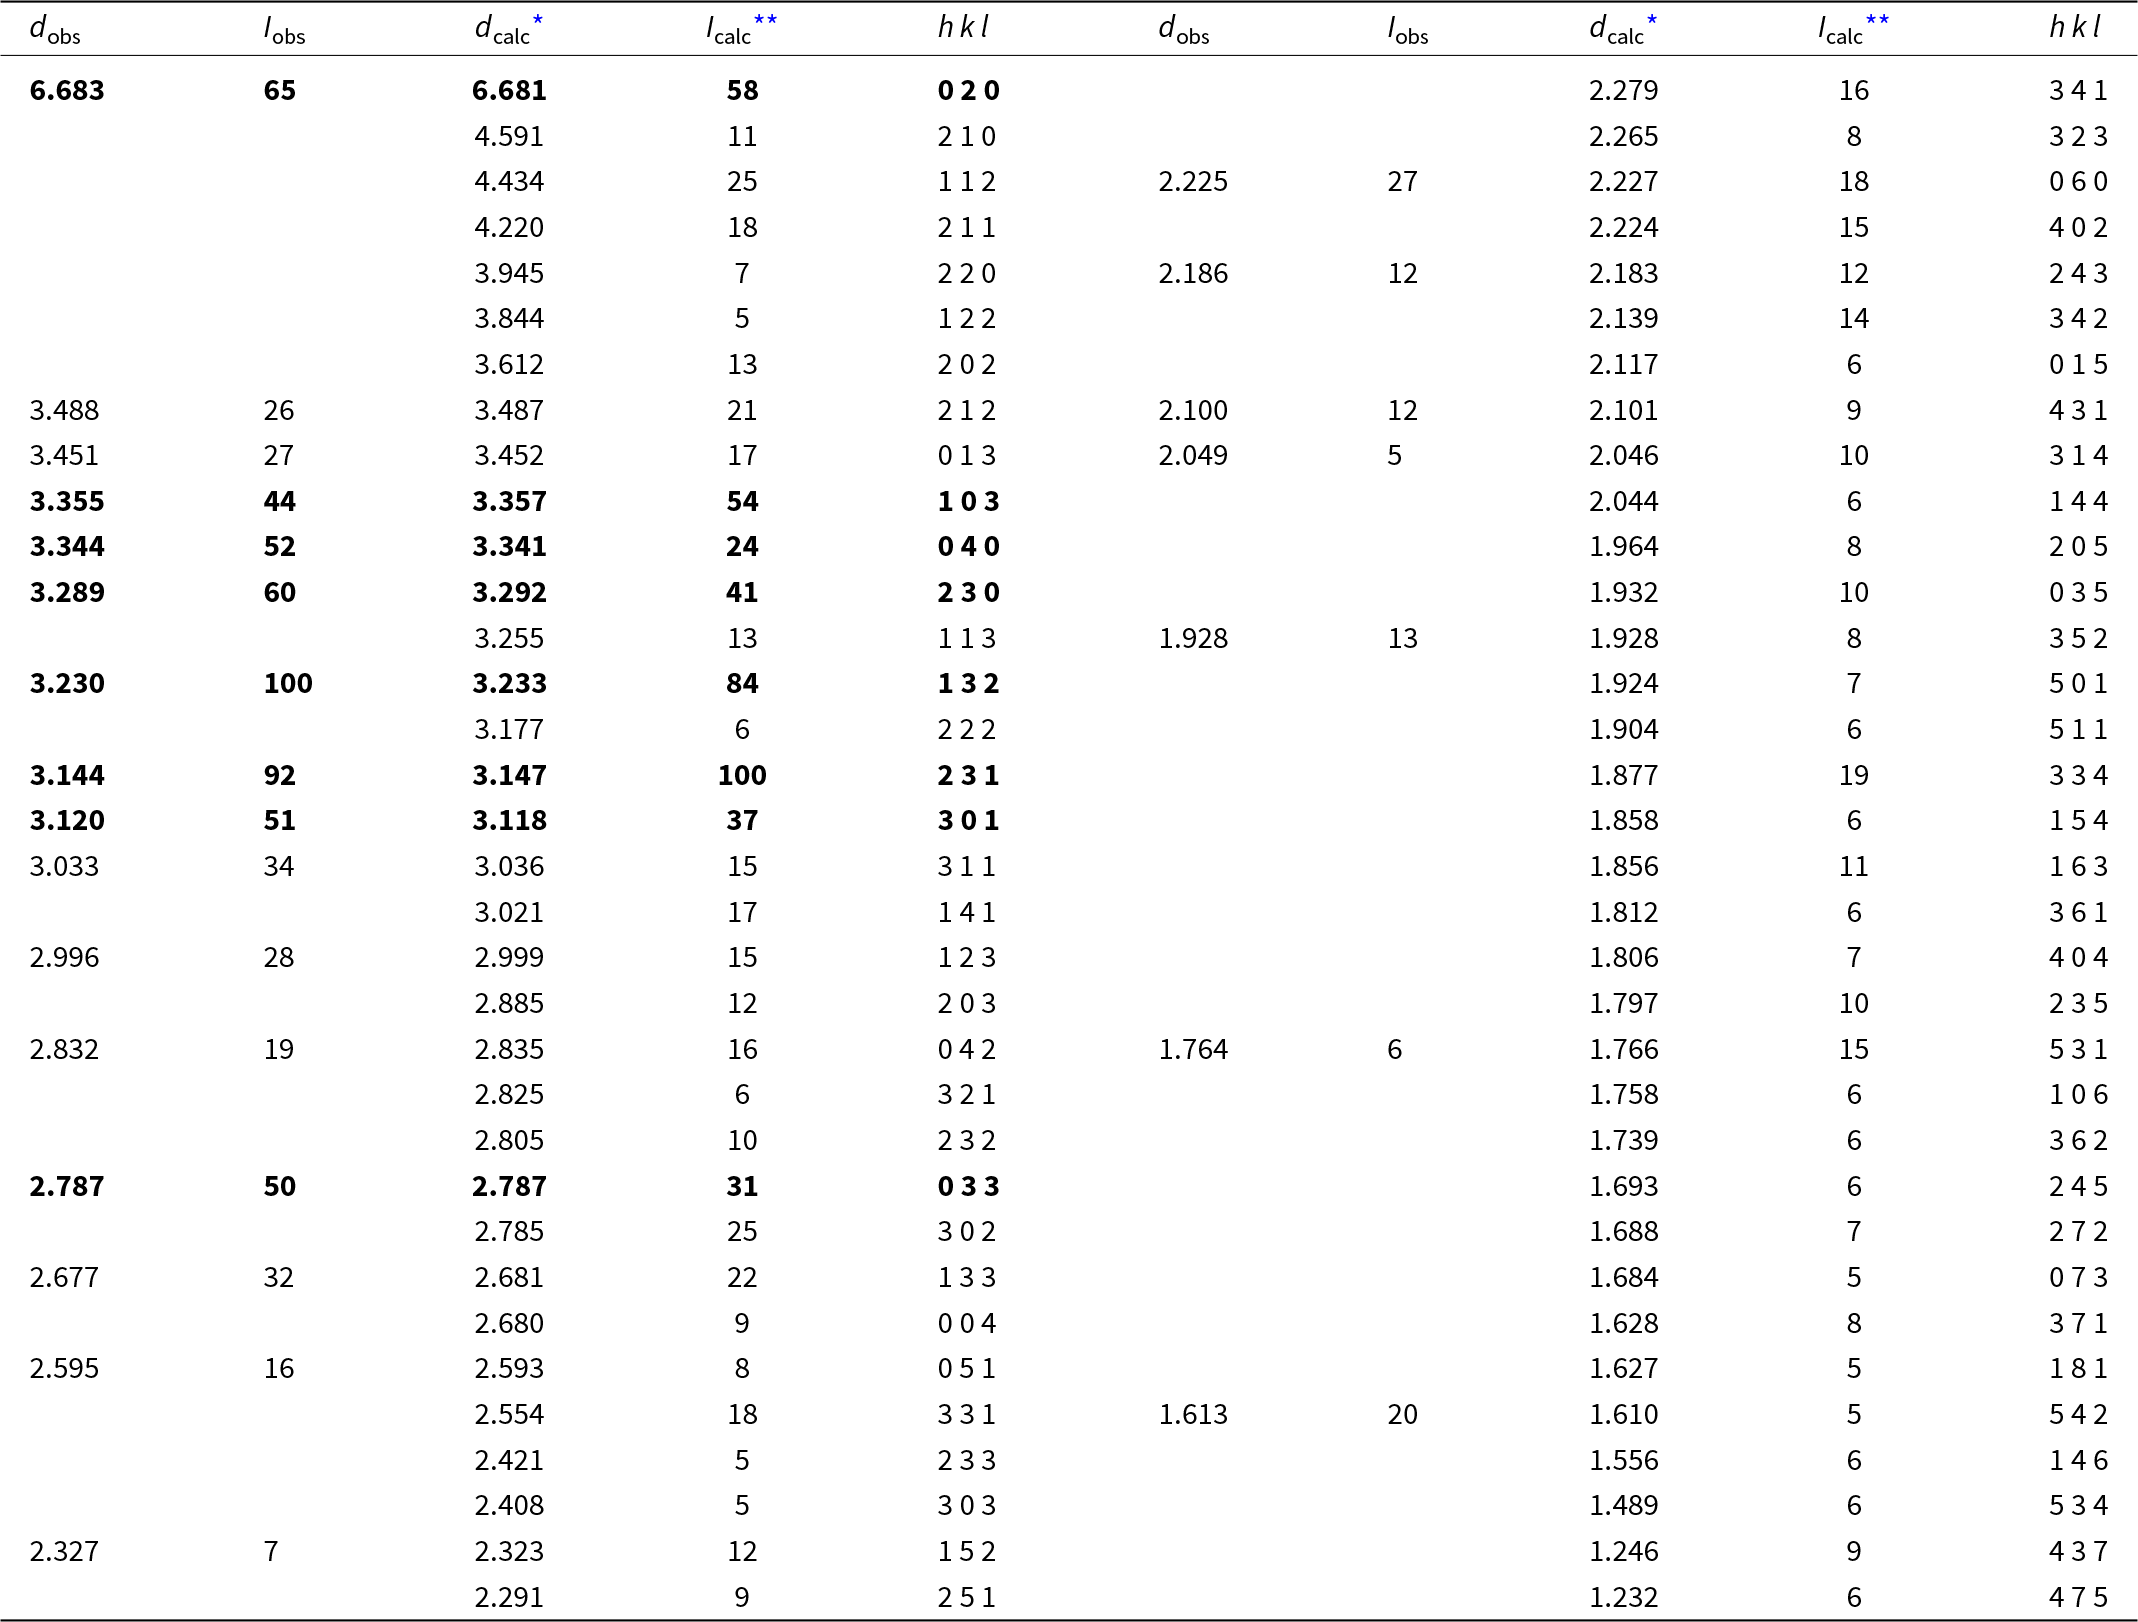
Due to the lack of material, powder X-ray diffraction (PXRD) data were collected from the same grain used for SCXRD studies, using a Rigaku R-AXIS Rapid II single-crystal diffractometer equipped with a cylindrical image plate detector (radius 127.4 mm) using Debye-Scherrer geometry, CoKα radiation (rotating anode with VariMAX microfocus optics), 40 kV and 15 mA. The angular resolution of the detector is 0.045°2θ (pixel size 0.1 mm). The data were integrated using the software package Osc2Tab (Britvin et al., Reference Britvin, Dolivo-Dobrovolsky and Krzhizhanovskaya2017). PXRD data for boevskite are given in Table 3 in comparison to that calculated from SCXRD data using the Atoms 5.1 program (Dowty, Reference Dowty2000). It should be noted that preferential orientation of the single crystal during PXRD data collection introduces some minor differences in the intensity of peaks in the observed and calculated powder diffraction patterns, while maintaining their angular positions. Parameters of an orthorhombic unit-cell were calculated from the observed d spacing data using UnitCell software (Holland and Redfern, Reference Holland and Redfern1997) and are as follows: a = 9.774(3), b = 13.364(3), c = 10.716(3) Å, and V = 1399.7(8) Å3.
Powder X-ray diffraction data (d in Å) of boevskite

Table 3 Long description
This table presents powder X-ray diffraction data for boevskite, comparing observed and calculated d-spacings and intensities for various crystal planes. The strongest observed reflection occurs at a d-spacing of 3.230 Å with an intensity of 100, which closely aligns with the calculated d-spacing of 3.233 Å and intensity of 84 for the 1 3 2 plane. Other notable reflections include 3.144 Å with an observed intensity of 92 and a calculated intensity of 100 for the 2 3 1 plane.
Notes: *For the calculated pattern, only reflections with intensities ≥5 are given;
** For the unit-cell parameters obtained from single crystal data. The strongest reflections are given in boldtype.
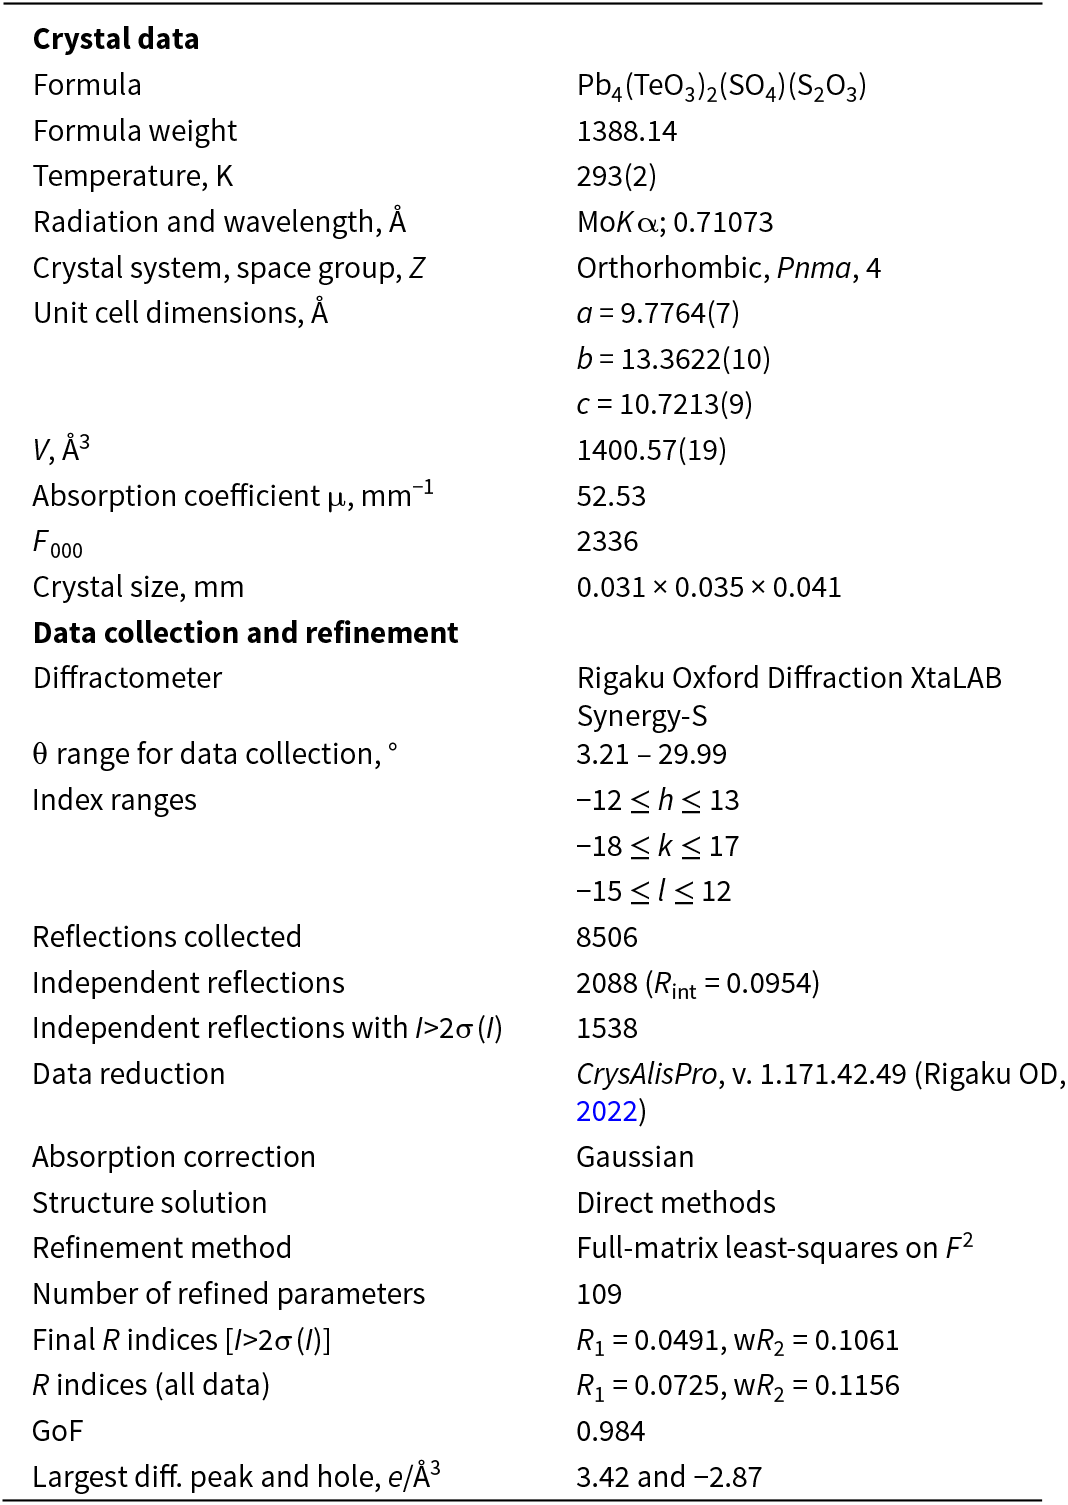
For the SCXRD study, a grain of boevskite, 0.031 × 0.035 × 0.041 mm in size, extracted from the polished section that was analysed using electron microprobe and Raman spectroscopy, was mounted on a glass fibre and examined with a Rigaku Oxford Diffraction XtaLAB Synergy-S single-crystal X-ray diffractometer (monochromated microfocused MoKα radiation, λ = 0.71073 Å; 50 kV and 1 mA) equipped with an area hybrid photon-counting HyPix-6000HE detector. The data were collected by 376 frames over 5 runs; the exposure time was 170 seconds per frame. The data were processed by CrysAlisPro 1.171.42.49 software (Rigaku OD, Reference Rigaku2022) and are as follows: boevskite is orthorhombic, space group Pnma, with unit-cell parameters a = 9.7764(7), b = 13.3622(10), c = 10.7213(9) Å, V = 1400.57(19) Å3 and Z = 4.
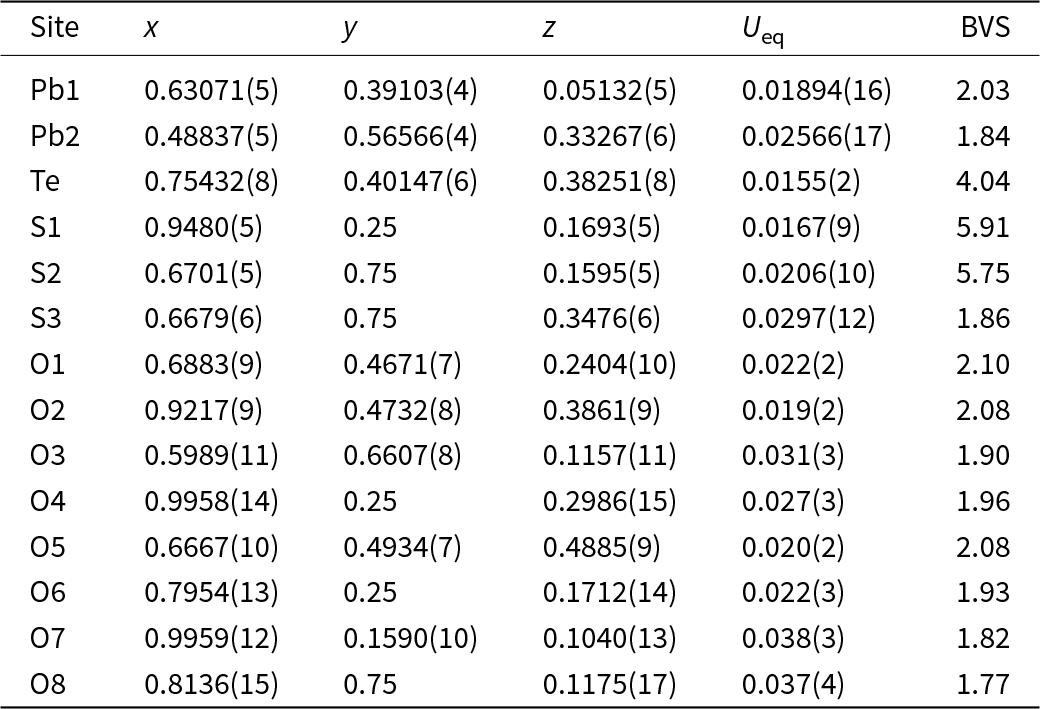
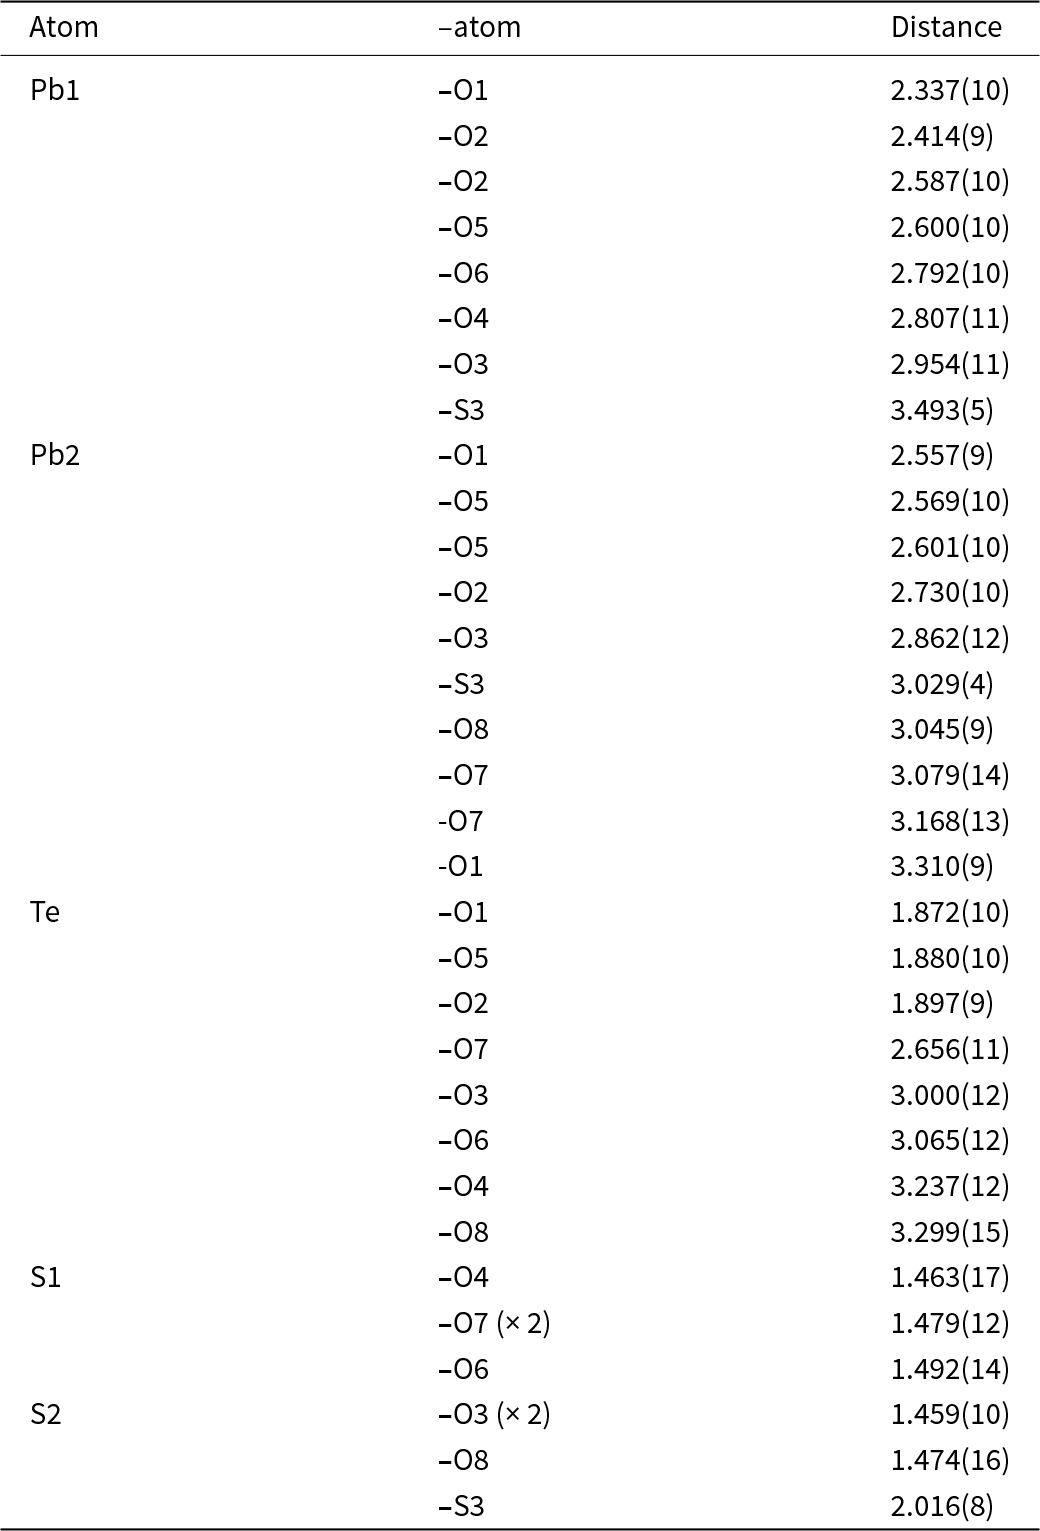
The crystal structure of boevskite was solved by direct methods and refined to R 1 = 0.0491 for 1538 reflections with I > 2σ(I) using SHELXS and SHELXL software package (Sheldrick, Reference Sheldrick2008, Reference Sheldrick2015). Crystal data, data collection information and structure refinement details for boevskite are given in Table 4. Coordinates and displacement parameters of atoms are given in Table 5 and selected interatomic distances in Table 6. The crystallographic information file has been deposited in the Inorganic Crystal Structure Database (ICSD) and can be obtained by quoting the CSD 2440705 via www.ccdc.cam.ac.uk/structures/, and also is available as Supplementary material (see below).
Single-crystal X-ray diffraction data collection information and structure refinement parameters for boevskite

Table 4 Long description
The table provides detailed information on the single-crystal X-ray diffraction data collection and structure refinement parameters for boevskite. It is in the orthorhombic crystal system with specific unit cell dimensions and a formula weight of 1388.14. The data collection was performed at room temperature using MoKα radiation, and the crystal size was 0.031 × 0.035 × 0.041.The refinement method used was full-matrix least-squares, and the largest difference in electron density was observed between 3.42 and -2.87 units per cubic angstrom.
Coordinates and displacement parameters (U eq, Å2) of atoms and bond valence sums (BVS) for boevskite calculated using the parameters taken from Gagné and Hawthorne (Reference Gagné and Hawthorne2015) for Pb–O and S–O, from Brese and O’Keeffe (Reference Brese and O’Keeffe1991) for Pb–S2– and S6+–S2– and from Mills and Christy (Reference Mills and Christy2013) for Te–O

Table 5 Long description
The table presents atomic coordinates and displacement parameters for boevskite, alongside bond valence sums for each atom.
Selected interatomic distances (Å) in the structure of boevskite

Table 6 Long description
The table presents interatomic distances in the boevskite structure, focussing on atoms Pb1, Pb2, Te, S1, and S2. Pb1 has the longest distance with S3 at 3.493 Å, while its shortest is with O1 at 2.337 Å. Pb2's distances range from 2.557 Å with O1 to 3.310 Å with another O1. Te's shortest distance is with O1 at 1.872 Å, and its longest is with O8 at 3.299 Å. S1 and S2 have shorter distances, with S1's shortest being 1.463 Å with O4 and S2's shortest being 1.459 Å with O3.
Description of crystal structure
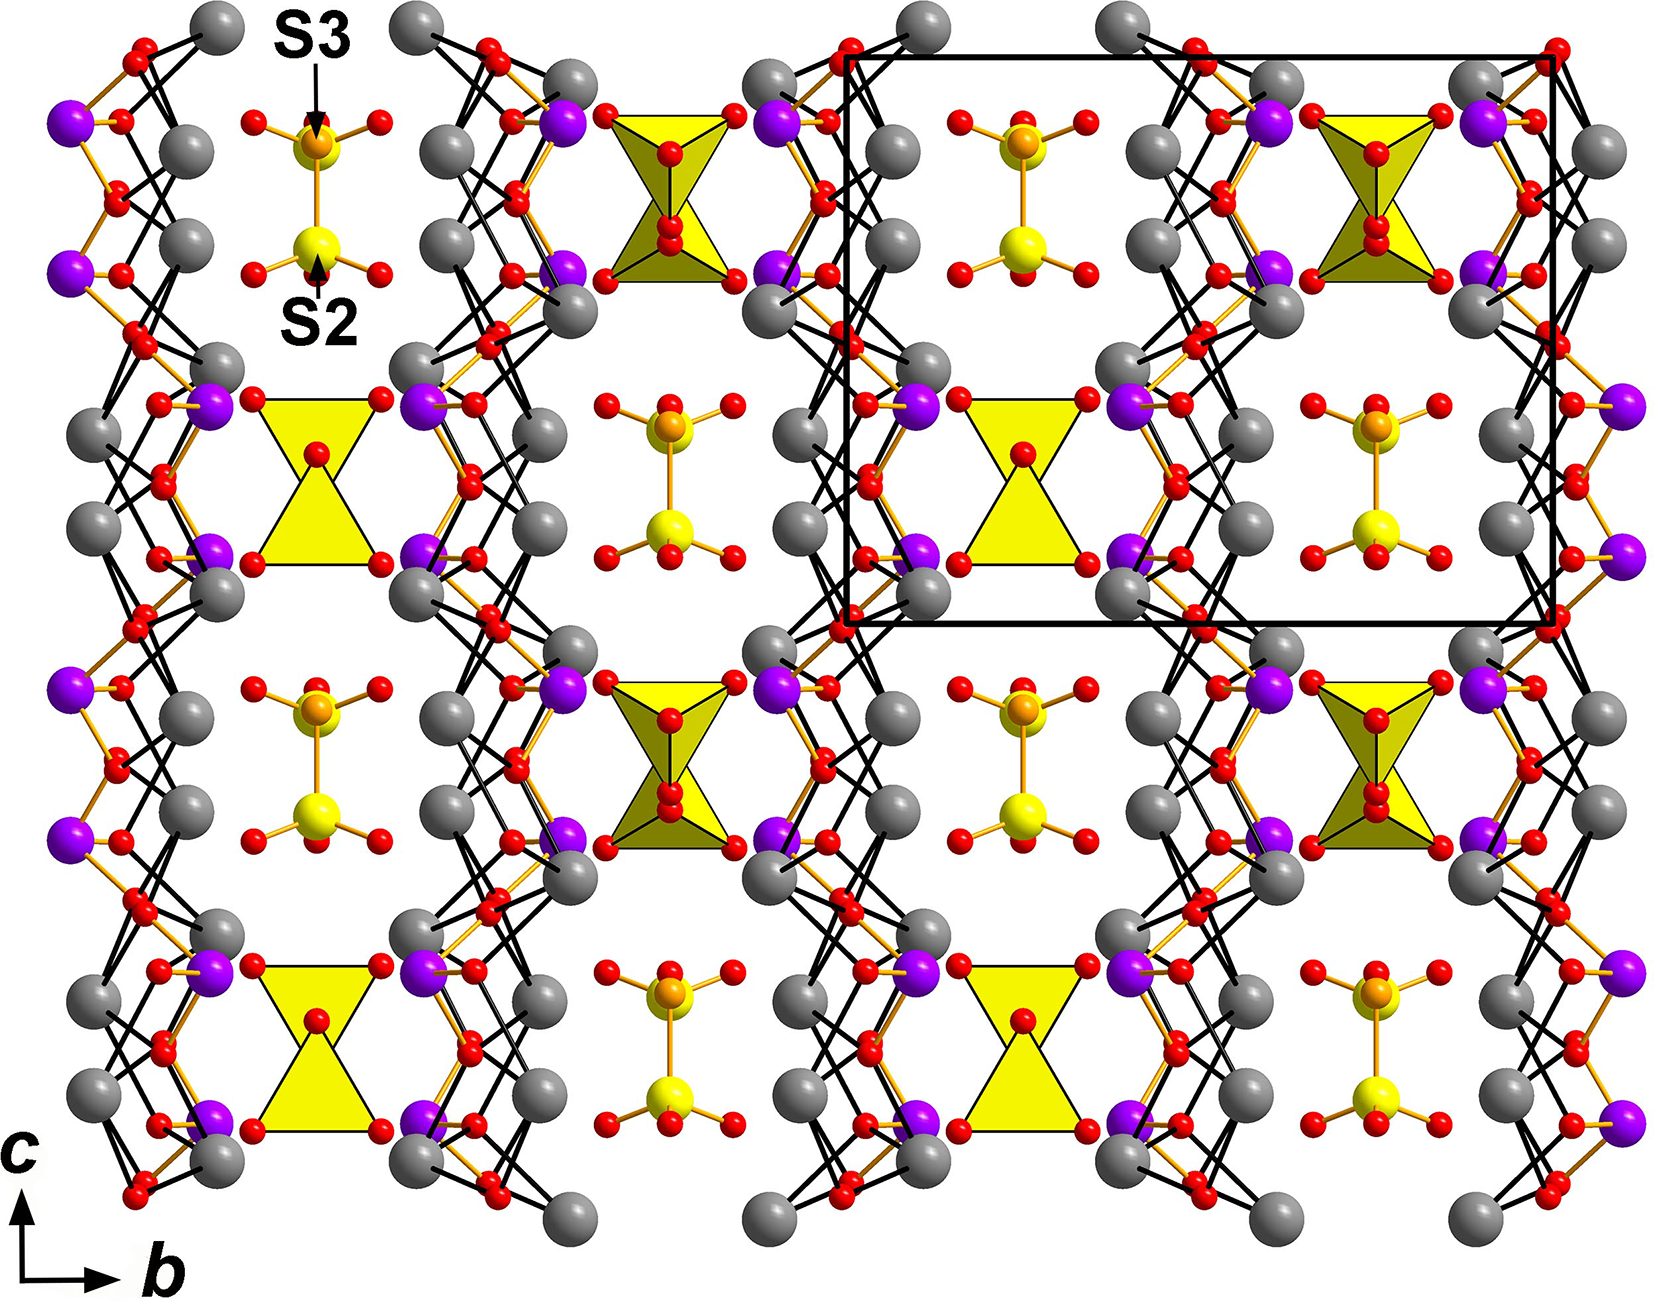
The crystal structure of boevskite is unique (Fig. 5). It contains two non-equivalent Pb2+ sites and one Te4+ site, which are characterized by off-centre coordinations that are typical for cations with lone-pair electrons (Christy and Mills, Reference Christy and Mills2013). The Pb1 cation has four relatively short Pb1–O bonds in the range 2.34–2.60 Å, three longer Pb1–O bonds (2.79–2.95 Å), and one significantly elongated Pb1–S3 bond (3.49 Å) to S2–. The Pb2 site is coordinated by nine O2– anions with four relatively short Pb2–O bonds in the range 2.56–2.73 Å, five longer Pb2–O bonds in the range 2.86–3.31 Å, and one bond to S2– (3.03 Å). The Te site is coordinated by O2– anions with three short Te–O bonds (<1.93 Å) on one side of the Te site, thus defining the Te4+O3 pyramid with the Te cation as its apical vertex, which is the most common coordination for Te4+ in oxysalts (Christy et al., Reference Christy, Mills and Kampf2016). The Te cation is also coordinated by five O atoms with significantly elongated Te–O distances (2.66–3.30 Å) on the opposite side from the short Te–O bonds (Table 6).
The crystal structure of boevskite projected along the a axis (drawn using Diamond v. 3.2k software). Pb2+ cations are grey circles, Te4+ and O are lilac and red circles, respectively. SO4 tetrahedra are yellow. S2 and S3 atoms of thiosulfate groups are large yellow and small orange circles, respectively. Only short (strong) Pb–O and Te–O bonds are shown. The unit cell is outlined.

Figure 5 Long description
The image shows the crystal structure of boevskite projected along the a axis. It includes grey circles representing Pb cations, lilac and red circles for Te and O, respectively and yellow SO tetrahedra. Large yellow and small orange circles depict S2 and S3 atoms of thiosulfate groups. Only short Pb–O and Te–O bonds are shown. The unit cell is outlined and the axes are labelled as c and b.
There are three crystallographically non-equivalent S sites in the structure of boevskite. The S1 site is tetrahedrally coordinated by O atoms whereas S2 and S3 participate in the formation of a thiosulfate group S2O32– or (S26+O3S32–)2–. S–O distances in the SO4 tetrahedron and in the thiosulfate group as well as S6+–S2– distance in thiosulfate tetrahedron are in good agreement with the corresponding distance ranges reported for sulfate and thiosulfate tetrahedra (Hawthorne et al., Reference Hawthorne, Krivovichev and Burns2000). Considering the short Te–O and relatively short Pb–O bonds, the structure of boevskite can be described as formed by Te–Pb–O layers coplanar to the ac plane with thiosulfate groups and SO4 tetrahedra located between them and only weakly linked to the layers. It is noteworthy that rather rigid structural units like TeO3 pyramids, SO4 tetrahedra and thiosulfate (S6+O3S2–) groups are isolated one from another.
Discussion
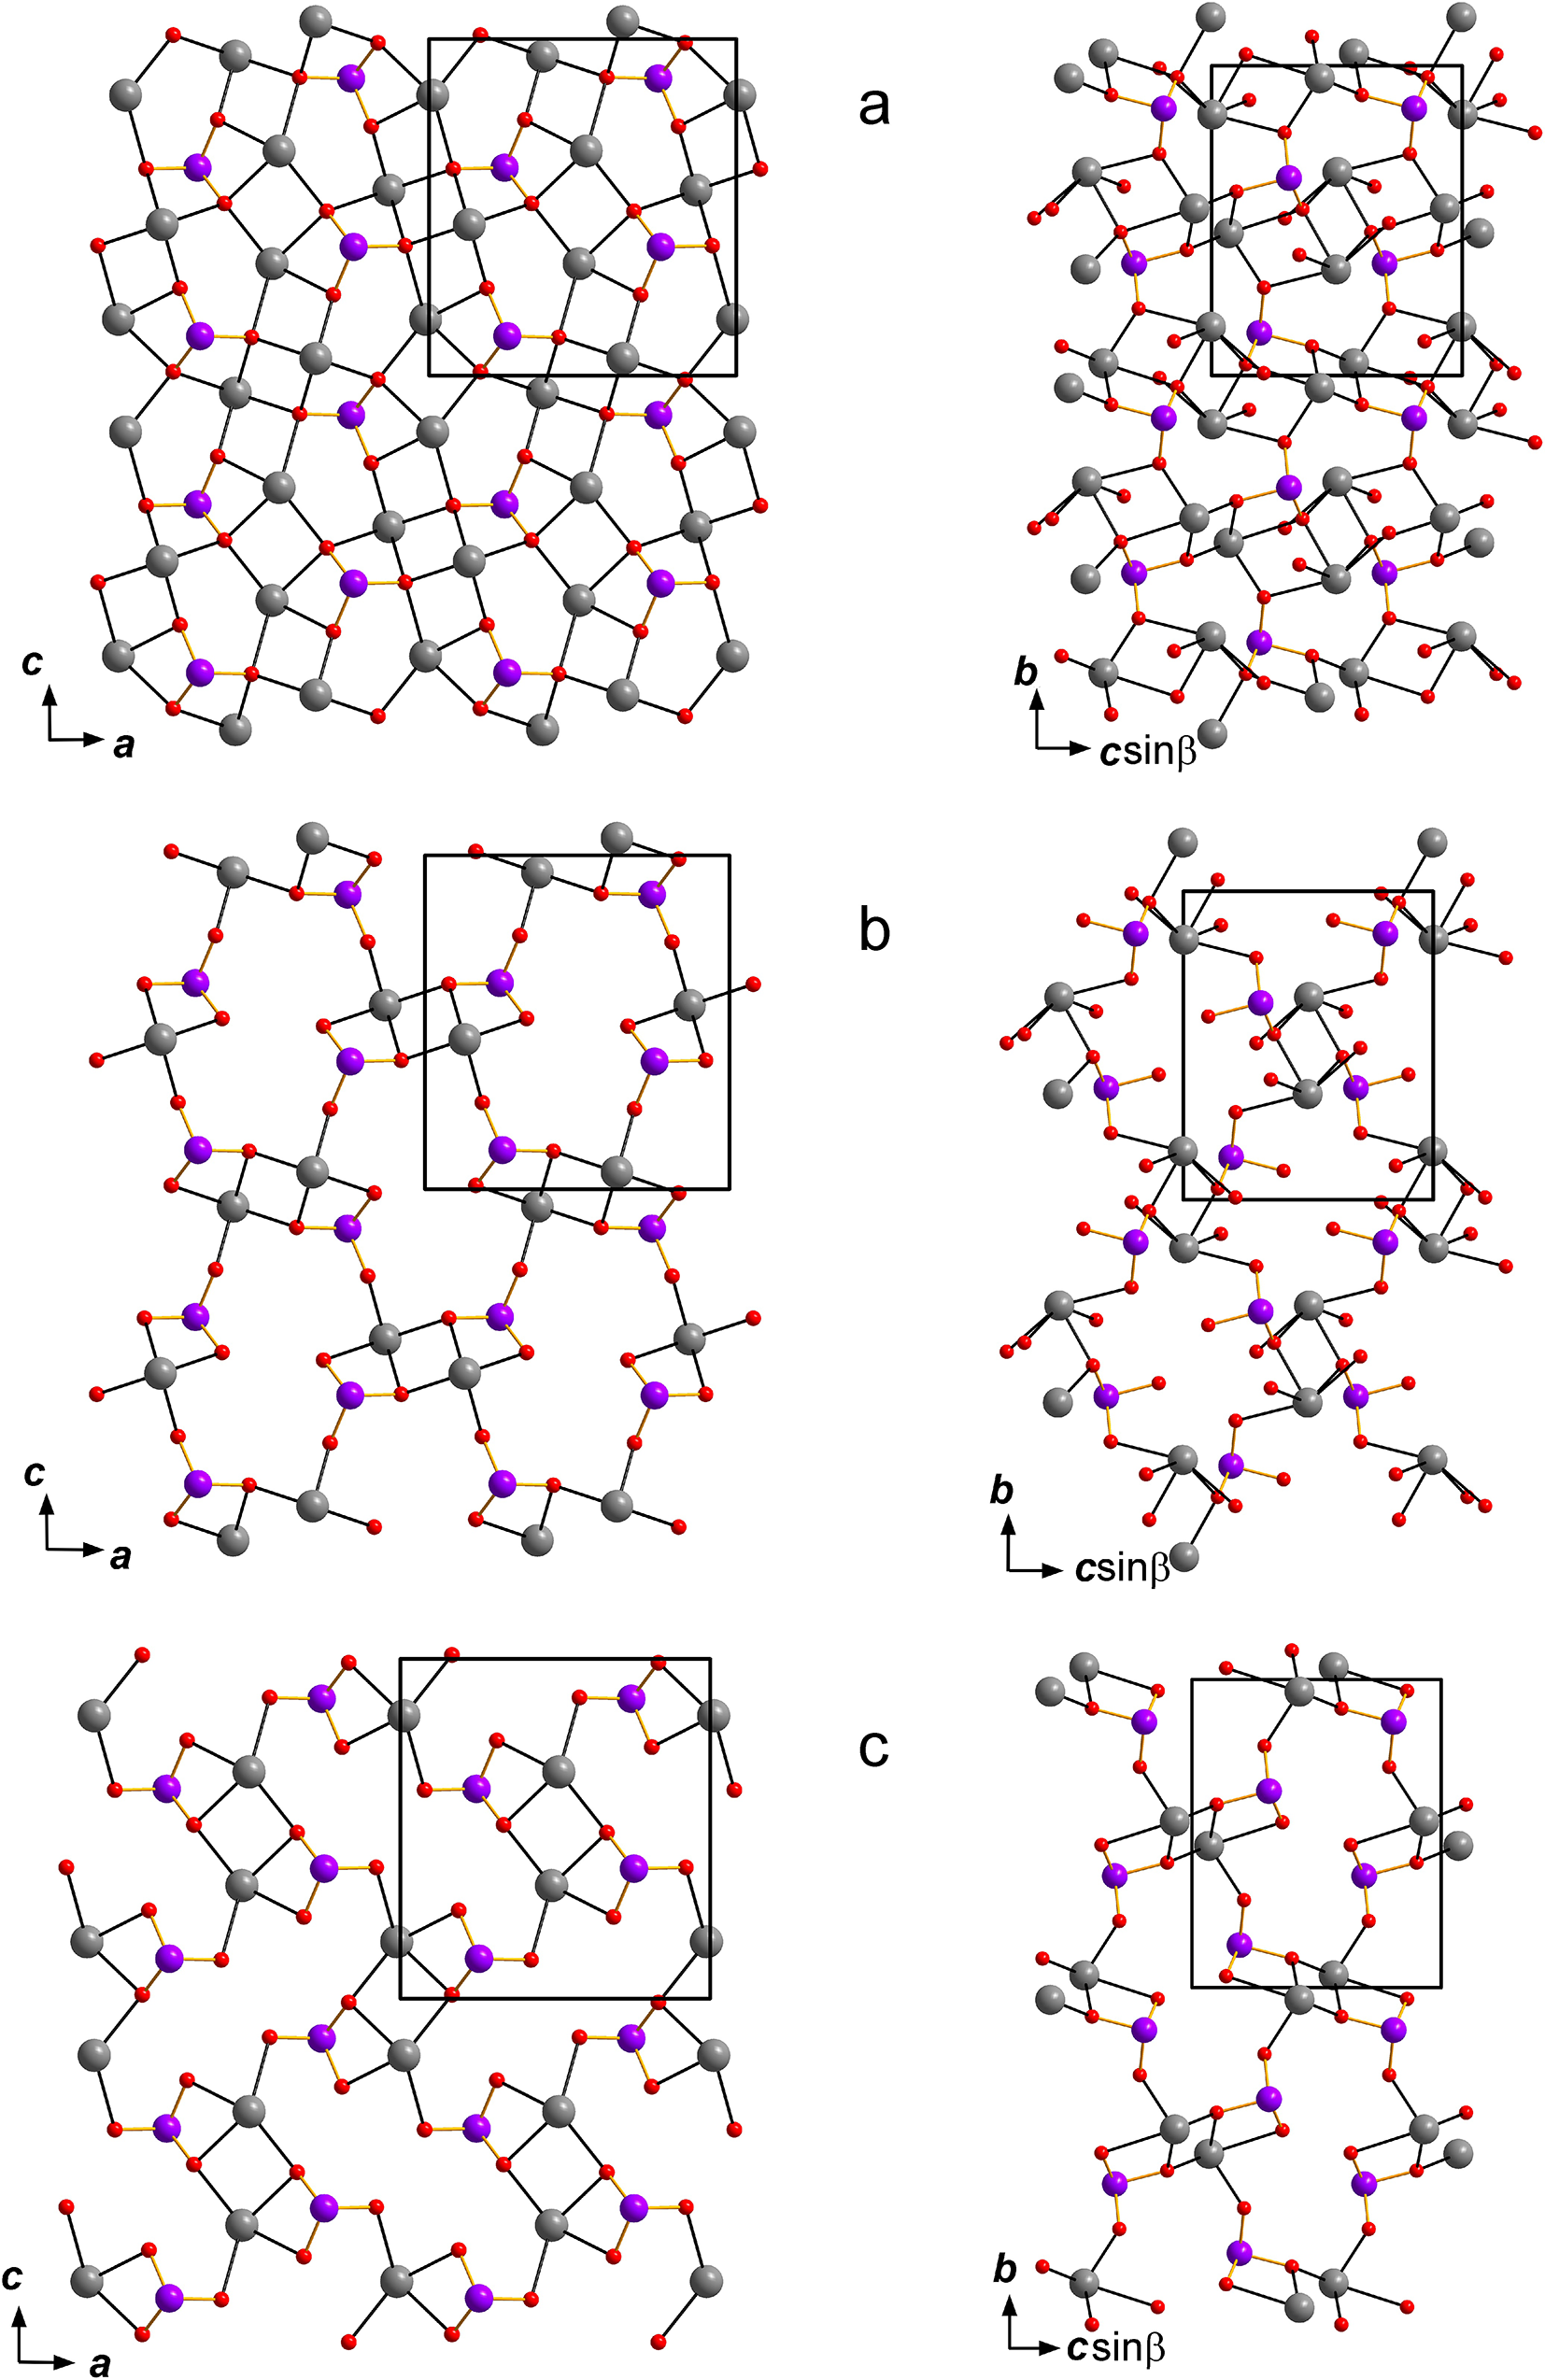
Boevskite has no structural analogues or relatives among minerals. In general, minerals with the simultaneous presence of different species-defining S–O groups are extremely rare. To date, only three sulfate–sulfites are known: orschallite Ca3(SO3)2(SO4)·12H2O (Weidenthaler et al., Reference Weidenthaler, Tillmanns and Hentschel1993), hielscherite Ca3Si(OH)6(SO4)(SO3)·11H2O (Pekov et al., Reference Pekov, Chukanov, Britvin, Kabalov, Göttlicher, Yapaskurt, Zadov, Krivovichev, Schüller and Ternes2012) and tomiolloite Al12(Te4+O3)5[(SO3)0.5(SO4)0.5](OH)24 (Missen et al., Reference Missen, Mills, Rumsey, Spratt, Najorka, Kampf and Thorne2022). Moreover, similarly to boevskite, the latter is also a tellurite. However, boevskite is the first mineral containing both sulfate and thiosulfate groups as species-defining constituents at distinct structural positions. During the preparation of this article, another sulfate–thiosulfate has been approved by CNMNC-IMA – blueridgeite [Pb8Zn3Cu2+(OH)16](SO4)2(S2O3)2·2H2O from Redmond Mine, North Carolina, USA (Emproto et al., Reference Emproto, Olds, Kampf, Smith, Hughes and Ma2025). The substitution of a small amount of thiosulfate for sulfate and vice versa had been reported earlier in several new lead sulfate and thiosulfate minerals from the above-mentioned mine in North Carolina, such as sulfatoredmondite [Pb8O2Zn(OH)6](SO4)4·6H2O (Kampf et al., Reference Kampf, Smith, Hughes, Ma and Emproto2023a), cubothioplumbite and hexathioplumbite, dimorphs with the formula [Pb4OH4]Pb(S2O3)3 (Kampf et al., Reference Kampf, Smith, Hughes, Ma and Emproto2023b), cherokeeite [Pb2Zn(OH)4](SO4)·H2O and cuprocherokeeite [Pb8Zn3Cu2+(OH)16](SO4)4·4H2O (Kampf et al., Reference Kampf, Smith, Hughes, Ma and Emproto2023c), finescreekite [Pb4(OH)4](S2O3)2 and hayelasdiite [Pb4O1.5(OH)2.5]2[Cu+5(S2O3)4(S2O2OH)2(H2O)]·4H2O (Kampf et al., Reference Kampf, Smith, Hughes, Ma and Emproto2024a), boojumite Pb8O4(OH)2(S2O3)3 and kennygayite [Pb4O2(OH)2](SO4) (Kampf et al., Reference Kampf, Smith, Hughes, Ma and Emproto2024b). The mineral chemically closest to boevskite is northstarite, a lead-tellurite–thiosulfate with the formula Pb6(Te4+O3)5(S2O3) (Kampf et al., Reference Kampf, Housley and Rossman2020b). However, it does not contain sulfate groups, and its structure is completely different. Some structural similarity in the topology of Te–Pb–O layers in boevskite could be found with the layers in the structure of another chemically similar mineral, adanite Pb2(Te4+O3)(SO4), where the most rigid structural units are TeO3 pyramids and SO4 tetrahedra, while the strongest bonds between structural units are similarly the short bonds between the Pb2+ cations and O atoms of the Te4+O3 pyramids (Kampf et al., Reference Kampf, Housley, Rossman, Yang and Downs2020a). Taking into account short Pb–O (the fourth elongated Pb2–O bond of 2.77 Å in the structure of adanite should also be considered for better comparison) and Te–O bonds in both minerals, the topological similarity of their layers is shown in Fig. 6. The other two minerals having same species-defining elements as boevskite, i.e. fairbankite, Pb2+12(Te4+O3)11(SO4) (Missen et al., Reference Missen, Rumsey, Mills, Weil, Najorka, Spratt and Kolitsch2021) and schieffelinite, Pb10Te66+O20(OH)14(SO4)(H2O)5 (Williams, Reference Williams1980; Kampf et al., Reference Kampf, Mills, Housley, Rumsey and Spratt2012) are characterized by a structure topology strongly differing from that of boevskite. They do not contain thiosulfate groups and schieffelinite, moreover, is a tellurate and not tellurite.
Left column: Te–Pb–O layers in boevskite and right column: adanite (drawn after Kampf et al., Reference Kampf, Housley, Rossman, Yang and Downs2020a; the elongated Pb2–O bond 2.77 Å is included). (a) Te–Pb(1,2)–O layer; (b) Te–Pb(1)–O layer; and (c) Te–Pb(2)–O layer. The unit cells are outlined.

Figure 6 Long description
The image consists of three diagrams labelled a, b and c, each showing Te–Pb–O layers in boevskite and adanite. Diagram a displays a complex network of atoms with unit cells outlined, viewed from two angles. Diagram b shows a similar arrangement with a different atomic configuration, also viewed from two angles. Diagram c presents another variation of the atomic structure, again with unit cells outlined and viewed from two perspectives. Each diagram includes axes labelled c, a, b and c times sine beta, indicating the orientation of the structures.
Boevskite was formed proximally as a result of the oxidative decomposition of primary sulfides and tellurides. The oxidation of pyrite and galena under neutral to alkaline conditions (pH > 7) releases thiosulfate and sulfate oxoanions, with sulfate concentrations decreasing as pH increases up to ∼ pH 9 (Gardner and Woods, Reference Gardner and Woods1979; Goldhaber, Reference Goldhaber1983). Therefore, boevskite probably forms in this pH range. Moreover, alkaline conditions inhibit the formation of anglesite (Keim and Markl, Reference Keim and Markl2015), and low dissolved carbonate concentrations prevent the formation of cerussite. Neutral-to-alkaline conditions were also considered by Bindi et al. (Reference Bindi, Nestola, Kolitsch, Guastoni and Zorzi2011) for the crystallization of another thiosulfate mineral, fassinaite Pb22+(S2O3)(CO3), described from the Trentini mine, Mount Naro, Italy and the Erasmus adit, Schwarzleo District, Austria. The subsequent overgrowing of boevskite by anglesite probably reflects evolution of the mineral-forming solution to lower pH values. Consequently, the proximal or distal formation of boevskite in other ore deposits could be expected if similar geochemical conditions were present during the alteration of mineral associations containing primary Pb sulfides or sulfosalts and Te minerals.
Supplementary material
The supplementary material for this article can be found at https://doi.org/10.1180/mgm.2025.10143.
Competing interests
The authors declare none.
Acknowledgements
We thank Associate Editor Anthony Kampf, Reviewer Igor V. Pekov and two anonymous reviewers for constructive comments that improved the manuscript. Maria D. Milshina and Ekaterina V. Vorontsova are acknowledged for the help with the figures.
Financial statement
This work in part of structural and crystal chemical analysis was supported by the Russian Science Foundation [grant No. 25-17-00005] (for N.V.Z.). The PXRD studies have been performed at the Research Centre for X-ray Diffraction Studies of St. Petersburg State University within the framework of the project 125021702335-5.


 Open access

