1. Introduction
The discovery of a legion of supermassive black holes ( $\sim\!10^8\,\,{\rm M}_\odot$
) at high redshift (
$\sim\!10^8\,\,{\rm M}_\odot$
) at high redshift ( $z>6$
; Bañados et al. Reference Bañados2018) has intensified the discussion on how such objects can form and grow so quickly (e.g. Volonteri & Rees Reference Volonteri and Rees2005). Samples of active galactic nuclei (AGN) are selected via indicators across the electromagnetic spectrum in X-rays, optical, near-infrared (near-IR), mid-IR, or radio, all of which originate from one of several different physical manifestations as described by the AGN unification scheme (e.g. Antonucci Reference Antonucci1993). While relatively large and deep X-ray surveys will soon be within reach with the extended ROentgen Survey with an Imaging Telescope Array (eROSITA; Cappelluti et al. Reference Cappelluti2011), recent years have seen increasing numbers of AGN detected at
$z>6$
; Bañados et al. Reference Bañados2018) has intensified the discussion on how such objects can form and grow so quickly (e.g. Volonteri & Rees Reference Volonteri and Rees2005). Samples of active galactic nuclei (AGN) are selected via indicators across the electromagnetic spectrum in X-rays, optical, near-infrared (near-IR), mid-IR, or radio, all of which originate from one of several different physical manifestations as described by the AGN unification scheme (e.g. Antonucci Reference Antonucci1993). While relatively large and deep X-ray surveys will soon be within reach with the extended ROentgen Survey with an Imaging Telescope Array (eROSITA; Cappelluti et al. Reference Cappelluti2011), recent years have seen increasing numbers of AGN detected at $z>5$
(Bañados et al. Reference Bañados2016) due to the proliferation of deep, large optical and near-IR surveys (e.g. Panoramic Survey Telescope and Rapid Response System; Pan-STARRS and VISTA Kilo-Degree Infrared Galaxy Survey, VIKING; Arnaboldi et al. Reference Arnaboldi, Neeser, Parker, Rosati, Lombardi, Dietrich and Hummel2007; Chambers et al. Reference Chambers2016). The mid-IR selection has provided some successful selection criteria (e.g. Stern et al. Reference Stern2005) but is currently stalled with no large mid-IR surveys foreseen in the near future. As for radio-selected samples, these have been lagging due to the lack of deep and wide low-frequency surveys which allow one to efficiently isolate high-redshift candidates among the millions of radio sources already catalogued (e.g. De Breuck et al. Reference De Breuck, van Breugel, Röttgering and Miley2000). With the release of the TIFR Giant Metrewave Radio Telescope (GMRT) Sky Survey (TGSS; Intema et al. Reference Intema, Jagannathan, Mooley and Frail2017), the GaLactic and Extragalactic All-sky Murchison Widefield Array (MWA; Tingay et al. Reference Tingay2013) survey (GLEAM; Wayth et al. Reference Wayth2015), the LOFAR Two-metre Sky Survey (LoTSS; Shimwell et al. Reference Shimwell2017; Shimwell et al. Reference Shimwell2019), and more recently the Rapid Australian Square Kilometre Array Pathfinder (ASKAP) Continuum Survey (RACS; McConnell et al. Reference McConnell2020), we finally have the opportunity to continue the search for radio-selected AGN at high redshift.
$z>5$
(Bañados et al. Reference Bañados2016) due to the proliferation of deep, large optical and near-IR surveys (e.g. Panoramic Survey Telescope and Rapid Response System; Pan-STARRS and VISTA Kilo-Degree Infrared Galaxy Survey, VIKING; Arnaboldi et al. Reference Arnaboldi, Neeser, Parker, Rosati, Lombardi, Dietrich and Hummel2007; Chambers et al. Reference Chambers2016). The mid-IR selection has provided some successful selection criteria (e.g. Stern et al. Reference Stern2005) but is currently stalled with no large mid-IR surveys foreseen in the near future. As for radio-selected samples, these have been lagging due to the lack of deep and wide low-frequency surveys which allow one to efficiently isolate high-redshift candidates among the millions of radio sources already catalogued (e.g. De Breuck et al. Reference De Breuck, van Breugel, Röttgering and Miley2000). With the release of the TIFR Giant Metrewave Radio Telescope (GMRT) Sky Survey (TGSS; Intema et al. Reference Intema, Jagannathan, Mooley and Frail2017), the GaLactic and Extragalactic All-sky Murchison Widefield Array (MWA; Tingay et al. Reference Tingay2013) survey (GLEAM; Wayth et al. Reference Wayth2015), the LOFAR Two-metre Sky Survey (LoTSS; Shimwell et al. Reference Shimwell2017; Shimwell et al. Reference Shimwell2019), and more recently the Rapid Australian Square Kilometre Array Pathfinder (ASKAP) Continuum Survey (RACS; McConnell et al. Reference McConnell2020), we finally have the opportunity to continue the search for radio-selected AGN at high redshift.
The most distant optically selected AGN currently known is at $z=7.64$
(Wang et al. Reference Wang2021), while the most distant radio-loud object is at
$z=7.64$
(Wang et al. Reference Wang2021), while the most distant radio-loud object is at $z=6.82$
(Bañados et al. Reference Bañados2021)Footnote
a
. Both optically selected and radio-selected samples are complementary and necessary to capture a complete picture of early AGN evolution within the Epoch of Reionisation (EoR). While optical selection tends to miss dust-obscured objects (due to obscuration by the host galaxy and/or the orientation of the torus with respect to the observer), radio selection alleviates this bias, at the cost of only capturing the radio-luminous population.
$z=6.82$
(Bañados et al. Reference Bañados2021)Footnote
a
. Both optically selected and radio-selected samples are complementary and necessary to capture a complete picture of early AGN evolution within the Epoch of Reionisation (EoR). While optical selection tends to miss dust-obscured objects (due to obscuration by the host galaxy and/or the orientation of the torus with respect to the observer), radio selection alleviates this bias, at the cost of only capturing the radio-luminous population.
Powerful high-redshift radio galaxies (HzRGs; $L_{3\,\rm GHz}>10^{26}\,$
WHz−1; Miley & De Breuck Reference Miley and De Breuck2008) have a long history of being AGN/galaxy distance ‘record holders’ (e.g. van Breugel et al. Reference van Breugel, De Breuck, Stanford, Stern, Röttgering and Miley1999). These advances were a result of a number of wide-area radio surveys available in the 1980s to 1990s and the advent of the ultra-steep spectrum (USS) technique (e.g. De Breuck et al. Reference De Breuck, van Breugel, Röttgering and Miley2000, using the radio spectral index for selection,
$L_{3\,\rm GHz}>10^{26}\,$
WHz−1; Miley & De Breuck Reference Miley and De Breuck2008) have a long history of being AGN/galaxy distance ‘record holders’ (e.g. van Breugel et al. Reference van Breugel, De Breuck, Stanford, Stern, Röttgering and Miley1999). These advances were a result of a number of wide-area radio surveys available in the 1980s to 1990s and the advent of the ultra-steep spectrum (USS) technique (e.g. De Breuck et al. Reference De Breuck, van Breugel, Röttgering and Miley2000, using the radio spectral index for selection, $\alpha\le -1.3$
;
$\alpha\le -1.3$
; $S_\nu\propto\nu^\alpha$
). Radio selection of AGN typically includes faintness in the K-band as powerful radio galaxies follow the
$S_\nu\propto\nu^\alpha$
). Radio selection of AGN typically includes faintness in the K-band as powerful radio galaxies follow the $K-z$
relation (e.g. Rocca-Volmerange et al. Reference Rocca-Volmerange, Le Borgne, De Breuck, Fioc and Moy2004). As they are highly obscured AGN, the rest-frame optical emission from these sources is dominated by a massive stellar population (
$K-z$
relation (e.g. Rocca-Volmerange et al. Reference Rocca-Volmerange, Le Borgne, De Breuck, Fioc and Moy2004). As they are highly obscured AGN, the rest-frame optical emission from these sources is dominated by a massive stellar population ( $\sim 10^{11}\,{\rm M}_\odot$
; Seymour et al. Reference Seymour2007) leading to a correlation of K-band emission with redshift.
$\sim 10^{11}\,{\rm M}_\odot$
; Seymour et al. Reference Seymour2007) leading to a correlation of K-band emission with redshift.
The recent discovery of the USS-selected source TGSS J1530 $+$
1049 at
$+$
1049 at $z=5.72$
(
$z=5.72$
( $\alpha=-1.4$
; Saxena et al. Reference Saxena2018b) broke the 20-year-old radio-powerul AGN distance record from van Breugel et al. (Reference van Breugel, De Breuck, Stanford, Stern, Röttgering and Miley1999). We have developed a new selection criterion based on the low-frequency (
$\alpha=-1.4$
; Saxena et al. Reference Saxena2018b) broke the 20-year-old radio-powerul AGN distance record from van Breugel et al. (Reference van Breugel, De Breuck, Stanford, Stern, Röttgering and Miley1999). We have developed a new selection criterion based on the low-frequency ( $70\!-\!230\,$
MHz) curvature of a radio source’s SED in GLEAM (Drouart et al. Reference Drouart2020, hereafter D20). This curvature is due to the expected small size of radio-loud AGN at
$70\!-\!230\,$
MHz) curvature of a radio source’s SED in GLEAM (Drouart et al. Reference Drouart2020, hereafter D20). This curvature is due to the expected small size of radio-loud AGN at $z>5$
(e.g. Saxena et al. Reference Saxena, Röttgering and Rigby2017) and the presence of a low-frequency turnover due to synchrotron self-absorption and/or free–free absorption processes. This method is agnostic to the nature of the high-frequency SED and hence finds sources which do not have ultra-steep spectra. However, it does require the same faintness in
$z>5$
(e.g. Saxena et al. Reference Saxena, Röttgering and Rigby2017) and the presence of a low-frequency turnover due to synchrotron self-absorption and/or free–free absorption processes. This method is agnostic to the nature of the high-frequency SED and hence finds sources which do not have ultra-steep spectra. However, it does require the same faintness in $K-$
band as the USS selection (in this case
$K-$
band as the USS selection (in this case $K_{\rm s}>21.2$
in VIKING) to further refine the identification of high-redshift candidates. Using this selection method, D20 discovered GLEAM J0856+0224 at
$K_{\rm s}>21.2$
in VIKING) to further refine the identification of high-redshift candidates. Using this selection method, D20 discovered GLEAM J0856+0224 at $z=5.55$
, which has a spectral index of
$z=5.55$
, which has a spectral index of $\alpha\sim -0.78$
across
$\alpha\sim -0.78$
across $0.1-1\,$
GHz and would have been missed by the USS selection technique.
$0.1-1\,$
GHz and would have been missed by the USS selection technique.
Very recently, a handful of optically selected quasi-stellar objects (QSOs) known at $z>6$
have been detected in radio surveys: at
$z>6$
have been detected in radio surveys: at $z=6.44$
(Ighina et al. Reference Ighina, Belladitta, Caccianiga, Broderick, Drouart, Moretti and Seymour2021) and
$z=6.44$
(Ighina et al. Reference Ighina, Belladitta, Caccianiga, Broderick, Drouart, Moretti and Seymour2021) and $z=6.82$
(Bañados et al. Reference Bañados2021). However, these radio-loud QSOs are more than an order of magnitude less luminous than HzRGs in the radio (not meeting the 3-GHz rest-frame luminosity threshold) and are potentially beamed as both show evidence of radio variability.
$z=6.82$
(Bañados et al. Reference Bañados2021). However, these radio-loud QSOs are more than an order of magnitude less luminous than HzRGs in the radio (not meeting the 3-GHz rest-frame luminosity threshold) and are potentially beamed as both show evidence of radio variability.
In D20, we also presented a tentative $z=10.15$
redshift for GLEAM J091734-001243 (hereafter GLEAM J0917–0012), based on the presence of three low signal-to-noise ratio, putative carbon monoxide (CO) lines in an Atacama Large sub-Millimetre Array (ALMA)
$z=10.15$
redshift for GLEAM J091734-001243 (hereafter GLEAM J0917–0012), based on the presence of three low signal-to-noise ratio, putative carbon monoxide (CO) lines in an Atacama Large sub-Millimetre Array (ALMA) $84\!-\!115\,$
GHz spectrum. The CO lines were extracted at the position of the host galaxy detected in a deep
$84\!-\!115\,$
GHz spectrum. The CO lines were extracted at the position of the host galaxy detected in a deep $K_{\rm s}$
-band image from the HAWKI instrument on the Very Large Telescope (VLT). In this paper, we describe supplementary ALMA and Karl G. Jansky Very Large Array (VLA) data that do not confirm this extreme redshift. However, we present arguments on the high-redshift nature of GLEAM J0917–0012 using a compilation of multi-wavelength data. The paper is organised as follows. In Section 2, we present our new ALMA and VLA follow-up observations, as well as additional data at radio, IR, and optical wavelengths from the literature. Section 5 shows the constraints on the SED of GLEAM J0917–0012 in the optical/near-IR and radio/far-IR. In Section 6, we attempt to constrain the nature of GLEAM J0917–0012 with respect to redshift, jointly using model predictions, empirical relations, and observational limits. We then discuss the likely range of redshifts of GLEAM J0917–0012 in Section 5 when combining all the information derived in the previous sections, before encapsulating our conclusions in Section 6. Throughout this paper, we assume a flat
$K_{\rm s}$
-band image from the HAWKI instrument on the Very Large Telescope (VLT). In this paper, we describe supplementary ALMA and Karl G. Jansky Very Large Array (VLA) data that do not confirm this extreme redshift. However, we present arguments on the high-redshift nature of GLEAM J0917–0012 using a compilation of multi-wavelength data. The paper is organised as follows. In Section 2, we present our new ALMA and VLA follow-up observations, as well as additional data at radio, IR, and optical wavelengths from the literature. Section 5 shows the constraints on the SED of GLEAM J0917–0012 in the optical/near-IR and radio/far-IR. In Section 6, we attempt to constrain the nature of GLEAM J0917–0012 with respect to redshift, jointly using model predictions, empirical relations, and observational limits. We then discuss the likely range of redshifts of GLEAM J0917–0012 in Section 5 when combining all the information derived in the previous sections, before encapsulating our conclusions in Section 6. Throughout this paper, we assume a flat $\Lambda$
CDM cosmology with H
$\Lambda$
CDM cosmology with H $_0$
= 67.7 km s−1 Mpc−1 and
$_0$
= 67.7 km s−1 Mpc−1 and $\Omega_M$
= 0.308 (Planck Collaboration et al. Reference Planck2016).
$\Omega_M$
= 0.308 (Planck Collaboration et al. Reference Planck2016).
2. Data
Following our previous observing campaign presented in D20, we further observed GLEAM J0917–0012 in order to confirm or refute our original tentative redshift determination: $z=10.15$
. The aim of our VLA observation in Q-band (
$z=10.15$
. The aim of our VLA observation in Q-band ( $36\!-\!46\,$
GHz) was to independently confirm the redshift by the detection of the CO(4-3) and carbon [CI(1-0)] lines, whereas the deeper ALMA observations aimed to confirm the original CO(9-8), CO(10-9), and CO(11-10) line detections. We also obtained further data from the literature in order to compile a well-sampled broadband SED, thereby allowing us to estimate source properties.
$36\!-\!46\,$
GHz) was to independently confirm the redshift by the detection of the CO(4-3) and carbon [CI(1-0)] lines, whereas the deeper ALMA observations aimed to confirm the original CO(9-8), CO(10-9), and CO(11-10) line detections. We also obtained further data from the literature in order to compile a well-sampled broadband SED, thereby allowing us to estimate source properties.
2.1. Host identification
The absolute astrometric uncertainties of the HAWKI, ALMA, and VLA data are small (0.2–0.3 arcsec, see the respective following subsections); hence we have reliably identified the host galaxy responsible for the radio emission as the $K_{\rm s}$
-band source (yellow cross in Figure 1) within the 100-GHz beam, but 0.5 arcsec east of the ALMA central coordinates. Some offset between the ALMA and the
$K_{\rm s}$
-band source (yellow cross in Figure 1) within the 100-GHz beam, but 0.5 arcsec east of the ALMA central coordinates. Some offset between the ALMA and the $K_{\rm s}$
-band coordinates is not unexpected due to the nature of the emission; the former from the synchrotron emission from the jets and the later from the stellar emission from the host galaxy.
$K_{\rm s}$
-band coordinates is not unexpected due to the nature of the emission; the former from the synchrotron emission from the jets and the later from the stellar emission from the host galaxy.
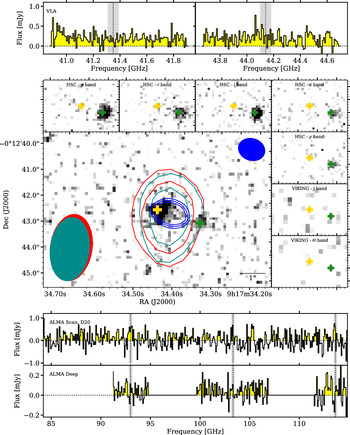
Top: VLA spectra extracted at the host galaxy position with dotted lines/grey regions indicating expected locations of the targeted CO(4-3) and [CI(1-0)] lines. Middle: $K_s-$
band image (centre) and the available HSC and VIKING data in insets in greyscale, with the deepest ALMA continuum image (blue contours) at 3, 4, and 5
$K_s-$
band image (centre) and the available HSC and VIKING data in insets in greyscale, with the deepest ALMA continuum image (blue contours) at 3, 4, and 5 $\sigma$
and the respective VLA continuum 41- and 44-GHz images (red and dark-cyan contours) overlaid at 5 and 10
$\sigma$
and the respective VLA continuum 41- and 44-GHz images (red and dark-cyan contours) overlaid at 5 and 10 $\sigma$
. The beams are presented in the corners in their respective colours. The yellow cross indicates the coordinates of the host galaxy used to extract the presented spectra. The green cross on the detected source south-west of the host represents the coordinates for the aperture photometry presented in Figure 6. Note that the cross are
$\sigma$
. The beams are presented in the corners in their respective colours. The yellow cross indicates the coordinates of the host galaxy used to extract the presented spectra. The green cross on the detected source south-west of the host represents the coordinates for the aperture photometry presented in Figure 6. Note that the cross are $\sim$
0.3 arcsec wide, corresponding to the absolute positional accuracy of our data (see Section 2). Bottom: ALMA spectra from D20 (top) and the new, deeper follow-up spectrum (bottom), extracted at the host galaxy position (yellow cross). Note the change in flux scale (
$\sim$
0.3 arcsec wide, corresponding to the absolute positional accuracy of our data (see Section 2). Bottom: ALMA spectra from D20 (top) and the new, deeper follow-up spectrum (bottom), extracted at the host galaxy position (yellow cross). Note the change in flux scale ( $\times4$
) and the dotted line/grey regions indicating expected locations of the targeted CO(9-8), CO(10-9) and CO(11-10) lines.
$\times4$
) and the dotted line/grey regions indicating expected locations of the targeted CO(9-8), CO(10-9) and CO(11-10) lines.

The second source visible $\sim$
1 arcsec south-west of the ALMA 100-GHz continuum (green cross in Figure 1) is believed to be unrelated to the host galaxy. We present its SED in Section 3.1. We also extracted the ALMA and VLA spectra at these coordinates (following the same method presented in the next subsections) and identified nothing (lines or continuum) to report.
$\sim$
1 arcsec south-west of the ALMA 100-GHz continuum (green cross in Figure 1) is believed to be unrelated to the host galaxy. We present its SED in Section 3.1. We also extracted the ALMA and VLA spectra at these coordinates (following the same method presented in the next subsections) and identified nothing (lines or continuum) to report.
2.2. VLA data
Our DDT programme was observed by the VLA in D-configuration on 2020 January 6 and 7 (ID: 19B-337). The time onsource was 5 h (total of 10 h including overheads) in Q-band. We set up the 8-bit correlator in order to (i) simultaneously cover the redshifted CO(4-3) and [CI(1-0)] lines (observed-frame frequencies 41.33 GHz and 44.12 GHz, respectively, assuming $z=10.15$
), (ii) place each of these lines at the centre of a 128-MHz subband to optimise the signal-to-noise ratio, and (iii) perform a 20-MHz offset between the two observations to fill the ‘gaps’ at the edges of the 128-MHz subbands. The final data therefore had continuous frequency coverage of the two lines, with a relatively homogeneous noise level in the 1-GHz bandwidth centred on each line. We performed calibration from the raw data using casa v5.6.2-2 (McMullin et al. Reference McMullin, Waters, Schiebel, Young and Golap2007) in the pipeline mode with default values. We visually checked the visibilities and performed extra flagging as required (i.e. one antenna was flagged due to noisy amplitudes).
$z=10.15$
), (ii) place each of these lines at the centre of a 128-MHz subband to optimise the signal-to-noise ratio, and (iii) perform a 20-MHz offset between the two observations to fill the ‘gaps’ at the edges of the 128-MHz subbands. The final data therefore had continuous frequency coverage of the two lines, with a relatively homogeneous noise level in the 1-GHz bandwidth centred on each line. We performed calibration from the raw data using casa v5.6.2-2 (McMullin et al. Reference McMullin, Waters, Schiebel, Young and Golap2007) in the pipeline mode with default values. We visually checked the visibilities and performed extra flagging as required (i.e. one antenna was flagged due to noisy amplitudes).
2.2.1. Continuum image
Creating images with natural weighting, the synthesised beams are 2.6 arcsec $\times 1.7$
arcsec (FWHM with beam position angle PA =
$\times 1.7$
arcsec (FWHM with beam position angle PA = $-9^{\circ}$
measured north through east) and 2.5 arcsec
$-9^{\circ}$
measured north through east) and 2.5 arcsec $\times 1.6$
arcsec (PA
$\times 1.6$
arcsec (PA $\;=\;-8^{\circ}$
) at 41.4 and 44.2 GHz, respectively (see Figure 1 lower panel). The one sigma sensitivity levels are 13 and 15 μJy beam−1 at 41.4 and 44.2 GHz, respectively, with an absolute positional accuracyFootnote
b
of 0.2 arcsec. The source is well detected at the location of the host galaxy in continuum in the two 1-GHz frequency bands and appears unresolved (see Figure 1). We extracted the flux density in the continuum images at each frequency using aegean, a source finding and photometry code performing 2D-Gaussian fits on detected sources in an image (Hancock et al. Reference Hancock, Trott and Hurley-Walker2018). The integrated flux densities are reported in Table 1.
$\;=\;-8^{\circ}$
) at 41.4 and 44.2 GHz, respectively (see Figure 1 lower panel). The one sigma sensitivity levels are 13 and 15 μJy beam−1 at 41.4 and 44.2 GHz, respectively, with an absolute positional accuracyFootnote
b
of 0.2 arcsec. The source is well detected at the location of the host galaxy in continuum in the two 1-GHz frequency bands and appears unresolved (see Figure 1). We extracted the flux density in the continuum images at each frequency using aegean, a source finding and photometry code performing 2D-Gaussian fits on detected sources in an image (Hancock et al. Reference Hancock, Trott and Hurley-Walker2018). The integrated flux densities are reported in Table 1.
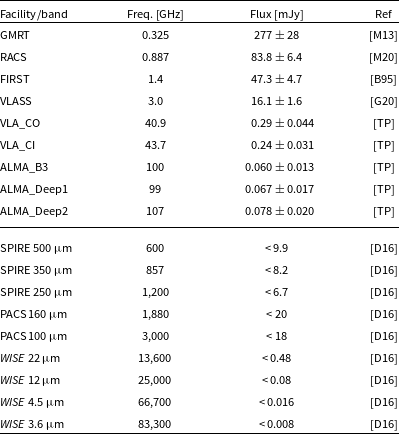
Continuum flux densities and their respective uncertainties for each image from both publicly available data and our new VLA and ALMA data. Uncertainties include a 10% calibration uncertainty added in quadrature for all radio fluxes, excepted for the RACS flux which follows the Equation 7 from McConnell et al. (Reference McConnell2020)). The reported upper limits are at the $3\sigma$
level. The GLEAM, TGSS, and NVSS data are not included here; Table 4 in D20. References: [M13] Mauch et al. (Reference Mauch, Klöckner, Rawlings, Jarvis, Hardcastle, Obreschkow, Saikia and Thompson2013); [B95] Becker et al. (Reference Becker, White and Helfand1995); [M20] (McConnell et al. Reference McConnell2020); [G20] Gordon et al. (Reference Gordon2020); [TP] this paper; [D16] Driver et al. (Reference Driver2016).
$3\sigma$
level. The GLEAM, TGSS, and NVSS data are not included here; Table 4 in D20. References: [M13] Mauch et al. (Reference Mauch, Klöckner, Rawlings, Jarvis, Hardcastle, Obreschkow, Saikia and Thompson2013); [B95] Becker et al. (Reference Becker, White and Helfand1995); [M20] (McConnell et al. Reference McConnell2020); [G20] Gordon et al. (Reference Gordon2020); [TP] this paper; [D16] Driver et al. (Reference Driver2016).
2.2.2. Spectral data cube
Using natural weighting and applying an 8-MHz channel width, the data cubes reach sensitivities of 120 and 150 μmJy beam−1 at 41.4 and 44.2 GHz, respectively. We present the resulting spectra in Figure 1, extracting at the host galaxy coordinates (the yellow cross), following the same procedure described in D20, that is, an average spectrum assuming a 0.8-arcsec aperture. While the continuum is clearly detected, the expected lines are not detected. We further explore the implications of the non-detections in Section 4.
2.3. Deeper ALMA data
Our DDT programme was observed in C43-4 configuration on 2020 March 14 and 15 (ID:2019.A.00023.S). The observations consist of two tunings in Band 3, centred at 99.0 and 107.4 GHz, in order to cover the three CO transitions with enough channels surrounding each line for a reliable continuum fit. All data analyses were performed with casa v5.6.2. In particular, one should note the difference between the original ALMA dataset covering a 30-GHz bandwidth with five tunings of $\sim$
10 min, and the new, deeper follow-up consisting of two 7.5-GHz bandwidth tunings, each with an onsource integration time of
$\sim$
10 min, and the new, deeper follow-up consisting of two 7.5-GHz bandwidth tunings, each with an onsource integration time of $\sim$
40 min. This results in the new continuum images reaching a similar continuum depth if taken individually and compared to the previous ALMA data from D20. However, it is important to note that the line sensitivity is increased by a factor of
$\sim$
40 min. This results in the new continuum images reaching a similar continuum depth if taken individually and compared to the previous ALMA data from D20. However, it is important to note that the line sensitivity is increased by a factor of $\,\geq 2$
.
$\,\geq 2$
.
2.3.1. Continuum image
Given the $\sim$
40-min onsource time for each tuning, we imaged each of the two tunings separately to obtain continuum detections at both 99.0 and 107.4 GHz. We use natural weighting in order to optimise the sensitivity. The resulting flux densities, measured in the continuum images with aegean and reported in Table 1, are consistent with the collapsed 30-GHz bandwidth flux density presented in D20. The final sensitivities are 11 and 14 μJy beam−1 at 99.0 and 107.4 GHz, respectively; the synthesised beams are 1.41 arcsec
$\sim$
40-min onsource time for each tuning, we imaged each of the two tunings separately to obtain continuum detections at both 99.0 and 107.4 GHz. We use natural weighting in order to optimise the sensitivity. The resulting flux densities, measured in the continuum images with aegean and reported in Table 1, are consistent with the collapsed 30-GHz bandwidth flux density presented in D20. The final sensitivities are 11 and 14 μJy beam−1 at 99.0 and 107.4 GHz, respectively; the synthesised beams are 1.41 arcsec $\times 1.24$
arcsec (PA
$\times 1.24$
arcsec (PA $\;=\;-69^{\circ}$
) at 99.0 GHz, and 1.46 arcsec
$\;=\;-69^{\circ}$
) at 99.0 GHz, and 1.46 arcsec $\times 1.17$
arcsec (PA
$\times 1.17$
arcsec (PA $\;=\;76^{\circ}$
) at 107.4 GHz (similar to the resolution obtained in D20) and the positional accuracyFootnote
c
reaches
$\;=\;76^{\circ}$
) at 107.4 GHz (similar to the resolution obtained in D20) and the positional accuracyFootnote
c
reaches $\sim$
0.3 arcsec. As such, we now have three independent data points with which to investigate the 100-GHz part of the SED (discussed further in Section 3.2). We also create a continuum image concatenating all visibilities (the 30 GHz and the two 7.5-GHz data cubes) to generate the best resolution map. The optimal sensitivity and resolution are 6.3 μJy and 1.04 arcsec
$\sim$
0.3 arcsec. As such, we now have three independent data points with which to investigate the 100-GHz part of the SED (discussed further in Section 3.2). We also create a continuum image concatenating all visibilities (the 30 GHz and the two 7.5-GHz data cubes) to generate the best resolution map. The optimal sensitivity and resolution are 6.3 μJy and 1.04 arcsec $\times 0.86$
arcsec (PA
$\times 0.86$
arcsec (PA $\;=\;70^{\circ}$
) arcsec, using a Briggs parameter of 1, presented in Figure 1 as blue contours.
$\;=\;70^{\circ}$
) arcsec, using a Briggs parameter of 1, presented in Figure 1 as blue contours.
2.3.2. Spectral data cube
We concatenated the visibilities from the two new datasets and imaged the data cube. First, we used natural weighting, and then a 3-arcsec tapered beam using 80-MHz-width channels to be consistent with our previous observations from D20. The final cubes reach average noise levels of 70 and 140 μJy beam−1 per 80 MHz-width channel, respectively. Figure 1 presents the spectra extracted at the host galaxy coordinates from the $K_{\rm s}$
-band image, following the same procedure described in D20 by averaging the spectra over an 0.8-arcsec aperture, for the previous and new 3-arcsec tapered data. None of the previous lines are confirmed, and we therefore do not confirm our previous tentative
$K_{\rm s}$
-band image, following the same procedure described in D20 by averaging the spectra over an 0.8-arcsec aperture, for the previous and new 3-arcsec tapered data. None of the previous lines are confirmed, and we therefore do not confirm our previous tentative $z=10.15$
solution. The implications of this are further discussed in Section 4. An extraction at the peak of the radio continuum or at the position of the second source detected in the
$z=10.15$
solution. The implications of this are further discussed in Section 4. An extraction at the peak of the radio continuum or at the position of the second source detected in the $K_{\rm s}$
-band image did not reveal any lines.
$K_{\rm s}$
-band image did not reveal any lines.
2.4. Inter-planetary scintillation observations
The GAMA-09 field was covered by observations with the MWA, searching for sub-arcsecond-scale structures in sources using the phenomenon of inter-planetary scintillation (IPS) at 162 MHz. IPS arises due to turbulence and structure in the solar wind, causing the radio emission from angular scales at $\lesssim 0.3$
arcsec (Fresnel size for IPS at 162 MHz) to scintillate on timescales of
$\lesssim 0.3$
arcsec (Fresnel size for IPS at 162 MHz) to scintillate on timescales of $\sim$
1 second. Using MWA wide-field images with a 0.5-s cadence over 10-min observations, the RMS flux density variation of each bright source is used to calculate its normalised ‘scintillation index’ (NSI; Morgan et al. Reference Morgan2018; Chhetri et al. Reference Chhetri, Morgan, Ekers, Macquart, Sadler, Giroletti, Callingham and Tingay2018). The NSI can be used as an estimator of angular size, or of the flux arising from the compact component. GLEAM J0917–0012 was found to have a significant median NSI of 0.49
$\sim$
1 second. Using MWA wide-field images with a 0.5-s cadence over 10-min observations, the RMS flux density variation of each bright source is used to calculate its normalised ‘scintillation index’ (NSI; Morgan et al. Reference Morgan2018; Chhetri et al. Reference Chhetri, Morgan, Ekers, Macquart, Sadler, Giroletti, Callingham and Tingay2018). The NSI can be used as an estimator of angular size, or of the flux arising from the compact component. GLEAM J0917–0012 was found to have a significant median NSI of 0.49 $\pm$
0.03 from 29 such observations. This value implies one of the three following scenarios (as discussed in Figure 5 of Morgan et al. Reference Morgan2018) for source morphology.
$\pm$
0.03 from 29 such observations. This value implies one of the three following scenarios (as discussed in Figure 5 of Morgan et al. Reference Morgan2018) for source morphology.
-
• A slightly resolved Gaussian, here approximately twice the size of the Fresnel diameter, that is. $\sim0.6$
arcsec.
$\sim0.6$
arcsec. -
• A point source with half of the total flux embedded in an extended component (which could in theory be as large as the MWA synthesised beam at this frequency).
-
• Two compact components separated from each other by
$>0.3$
arcsec where one is partially resolved at
$\sim0.3$
arcsec.


Note that the second and third scenarios cannot provide us with an upper limit for the spatial scale of the extended component. With help of other radio data presented in this paper, we further discuss the implication:
-
• A slightly resolved Gaussian, here approximately twice the size of the Fresnel diameter, that is,
$\sim0.6$
arcsec. -
• A point source with half of the total flux embedded in an extended component (which could in theory be as large as the MWA synthesised beam at this frequency).
-
• Two compact components separated from each other by
$>0.3$
arcsec where one is partially resolved at
$\sim0.3$
arcsec.


Note that the second and third scenarios cannot provide us with an upper limit for the spatial scale of the extended component. With help of other radio data presented in this paper We further discuss the implication of this size and morphology in Section 4.
2.5. Radio polarimetric properties at < 10 GHz
In order to gather as much information as possible to discuss the nature of GLEAM J0917–0012 (Section 5), we checked for radio polarisation at $\nu<$
10 GHz, where our signal-to-noise ratio is the most suitable to perform this analysis. In linear polarisation, GLEAM J0917–0012 is detected neither in the
$\nu<$
10 GHz, where our signal-to-noise ratio is the most suitable to perform this analysis. In linear polarisation, GLEAM J0917–0012 is detected neither in the $169\!-\!231$
MHz MWA POlarised GLEAM Survey (POGS;
$169\!-\!231$
MHz MWA POlarised GLEAM Survey (POGS; $7\sigma$
fractional polarisation upper limit
$7\sigma$
fractional polarisation upper limit $\approx 4.2\%$
for GLEAM J0917–0012; Riseley et al. Reference Riseley2020) nor in the
$\approx 4.2\%$
for GLEAM J0917–0012; Riseley et al. Reference Riseley2020) nor in the $1.4$
-GHz NRAO VLA Sky Survey (NVSS;
$1.4$
-GHz NRAO VLA Sky Survey (NVSS; $5\sigma$
fractional polarisation upper limit
$5\sigma$
fractional polarisation upper limit $\approx 4.7\%$
for GLEAM J0917–0012; Condon et al. Reference Condon, Cotton, Greisen, Yin, Perley, Taylor and Broderick1998). We also investigated the radio polarimetric properties from our
$\approx 4.7\%$
for GLEAM J0917–0012; Condon et al. Reference Condon, Cotton, Greisen, Yin, Perley, Taylor and Broderick1998). We also investigated the radio polarimetric properties from our $5.5$
- and 9-GHz ATCA data (D20). We first conducted further processing of the data in Stokes I: we ran phase-only self-calibration on both the
$5.5$
- and 9-GHz ATCA data (D20). We first conducted further processing of the data in Stokes I: we ran phase-only self-calibration on both the $5.5$
- and 9-GHz datasets. The flux densities at both frequencies remained consistent with the values previously reported in D20. We then imaged the combined
$5.5$
- and 9-GHz datasets. The flux densities at both frequencies remained consistent with the values previously reported in D20. We then imaged the combined $5.5+9$
-GHz dataset so as to create a map at
$5.5+9$
-GHz dataset so as to create a map at $7.25$
GHz. Using a robust weighting parameter of
$7.25$
GHz. Using a robust weighting parameter of $0.5$
, the angular resolution is 43.4 arcsec
$0.5$
, the angular resolution is 43.4 arcsec $\times$ $21.8$
arcsec (PA =
$21.8$
arcsec (PA = $69.\!^\circ8$
). GLEAM J0917–0012 has peak and integrated
$69.\!^\circ8$
). GLEAM J0917–0012 has peak and integrated $7.25$
-GHz flux densities of
$7.25$
-GHz flux densities of $6.0 \pm 0.6$
mJy beam−1 and
$6.0 \pm 0.6$
mJy beam−1 and $6.1 \pm 0.6$
mJy, respectively.
$6.1 \pm 0.6$
mJy, respectively.
A $7.25$
-GHz Stokes-V map was then constructed using the same imaging settings as above. The RMS noise level in this map is 31 μJy beam−1. GLEAM J0917–0012 is not detected in Stokes V, with the
$7.25$
-GHz Stokes-V map was then constructed using the same imaging settings as above. The RMS noise level in this map is 31 μJy beam−1. GLEAM J0917–0012 is not detected in Stokes V, with the $5\sigma$
upper limit for the fractional circular polarisation at
$5\sigma$
upper limit for the fractional circular polarisation at $7.25$
GHz being approximately
$7.25$
GHz being approximately $2.5\%$
.
$2.5\%$
.
To investigate the linear polarimetric properties at $7.25$
GHz, we used the rm-tools software package (Purcell et al. Reference Purcell, Van Eck, West, Sun and Gaensler2020) to conduct Faraday synthesis. Stokes I, Q, and U images were made for all
$7.25$
GHz, we used the rm-tools software package (Purcell et al. Reference Purcell, Van Eck, West, Sun and Gaensler2020) to conduct Faraday synthesis. Stokes I, Q, and U images were made for all $3513 \times 1$
-MHz channels from
$3513 \times 1$
-MHz channels from $4.577$
–
$4.577$
– $9.923$
GHz that had not been flagged. Again, we used a robust weighting parameter of
$9.923$
GHz that had not been flagged. Again, we used a robust weighting parameter of $0.5$
; moreover, all images had the same pixel size (5 arcsec) and were restored with the same synthesised beam (taking the coarsest angular resolution from the lowest-frequency channel: 59.0 arcsec
$0.5$
; moreover, all images had the same pixel size (5 arcsec) and were restored with the same synthesised beam (taking the coarsest angular resolution from the lowest-frequency channel: 59.0 arcsec $\times$ $38.6$
arcsec and PA
$38.6$
arcsec and PA $\;=\;71.\!\!^\circ4$
). We then generated Faraday depth spectra, corrected for the slope of the Stokes-I in-band spectrum, for each pixel in a
$\;=\;71.\!\!^\circ4$
). We then generated Faraday depth spectra, corrected for the slope of the Stokes-I in-band spectrum, for each pixel in a $3 \times 3$
grid centred on the pixel of peak intensity in Stokes I. No components above
$3 \times 3$
grid centred on the pixel of peak intensity in Stokes I. No components above $5\sigma$
were found in any of the Faraday depth spectra. Similar to the result for the fractional circular polarisation, the
$5\sigma$
were found in any of the Faraday depth spectra. Similar to the result for the fractional circular polarisation, the $5\sigma$
upper limit for the fractional linear polarisation is approximately
$5\sigma$
upper limit for the fractional linear polarisation is approximately $2.6\%$
(the average full-bandwidth noise level in Stokes Q and U is 32 μJy beam−1).
$2.6\%$
(the average full-bandwidth noise level in Stokes Q and U is 32 μJy beam−1).
In conclusion, GLEAM J0917–0012 has not been detected in polarisation yet at metre or centimetre wavelengths. We discuss the implication in Section 5.
2.6. Literature data
We also compiled publicly available data on GLEAM J0917–0012, from optical to radio wavelengths. After visual confirmation of a non-detection in the images, we report additional upper limits from the Herschel Space Observatory (hereafter, Herschel Pilbratt et al. Reference Pilbratt2010), the Widefield Infrared Survey Explorer (WISE; Wright et al. Reference Wright2010), and the Hyper Suprime-Cam Subaru Strategic Program (HSC; Aihara et al. Reference Aihara2018). The HSC survey covers our source with the grizy bands, reaching significantly deeper than the VIKING survey (zYJHK) in the overlapping bands, thereby allowing for stronger constraints to be placed on the optical SED. We downloaded the HSC images and performed aperture-matched photometry at the source coordinates based on the detection and the resolution in $K_{\rm s}$
-band (
$K_{\rm s}$
-band ( $\sim$
0.7 arcsec; see D20). The flux densities and associated uncertainties are given in Table 2 along with all the limits from the VIKING survey and our previously reported
$\sim$
0.7 arcsec; see D20). The flux densities and associated uncertainties are given in Table 2 along with all the limits from the VIKING survey and our previously reported $K_s-$
band detection (D20).
$K_s-$
band detection (D20).
Optical and near-IR limits based on the $K_s-$
band detection for GLEAM J0917–0012 and the south-western (SW) source seen in
$K_s-$
band detection for GLEAM J0917–0012 and the south-western (SW) source seen in $K_{\rm s}$
-band. We present the SED filter, central wavelength (
$K_{\rm s}$
-band. We present the SED filter, central wavelength ( $\lambda_0$
), and flux densities (
$\lambda_0$
), and flux densities ( $F_{\nu}$
). The upper limits are at the 3
$F_{\nu}$
). The upper limits are at the 3 $\sigma$
level from aperture-matched photometry using the
$\sigma$
level from aperture-matched photometry using the $K_{\rm s}$
-band detection. These data are plotted in Figure 3.
$K_{\rm s}$
-band detection. These data are plotted in Figure 3.
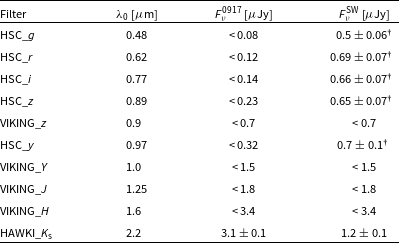
†10% uncertainties have been added in quadrature to account for absolute calibration uncertainties
In the case of the mid- and far-IR flux densities, we assumed that the source is unresolved and report the Herschel and WISE survey limits provided in Driver et al. (Reference Driver2016) in Table 1, along with new radio data obtained from the literature.
3. Results
As the molecular lines we were targetting are not detected, we focus on the broadband SEDs in the optical to near-IR and radio to mid-IR, and their implications in terms of luminosity and radio loudness.
3.1. Optical to near-IR SED
3.1.1. South-western source
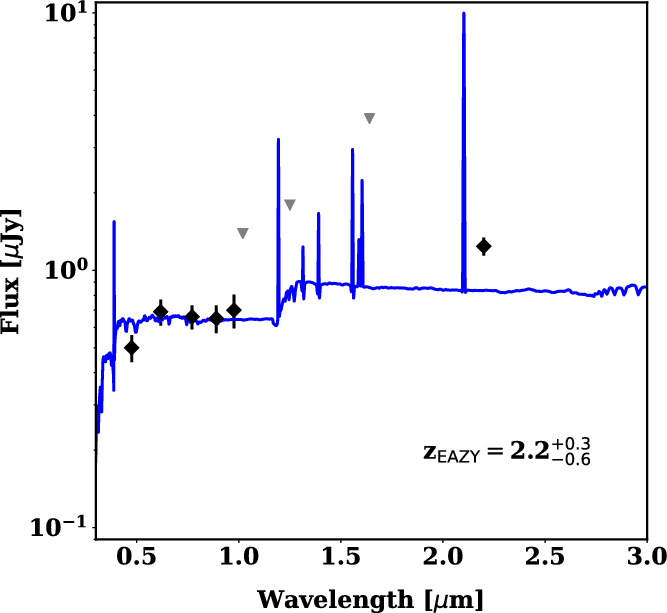
Figure 2 presents the optical to near-IR SED of the source south-west of the host in Figure 1. Aperture photometry is applied in the same fashion as described in D20 with a 0.8-arcsec aperture. The flux densities are extracted at the coordinates in the HAWKI image and reported in Table 2. The source is detected in the HSC images but undetected in VIKING. Using EAZY (a photometric redshift code; Brammer et al. Reference Brammer, van Dokkum and Coppi2008) on this photometry with all parameters at their default value leads to a redshift estimate of $z_{\rm phot}=2.2^{+0.3}_{-0.6}$
taking the 68th-percentile confidence interval from the resulting redshift distribution. The best-fitting template is also shown in Figure 2.
$z_{\rm phot}=2.2^{+0.3}_{-0.6}$
taking the 68th-percentile confidence interval from the resulting redshift distribution. The best-fitting template is also shown in Figure 2.
Optical to near-IR SED for the south-western source identified in Figure 1. Flux densities are reported in Table 2. The black diamonds are the detections and the grey downward triangles the 3 $\sigma$
upper limits. The template overlaid is the best fit from the EAZY fitting at the redshift indicated with the 68th-percentile reported as the uncertainties (see Section 3.1).
$\sigma$
upper limits. The template overlaid is the best fit from the EAZY fitting at the redshift indicated with the 68th-percentile reported as the uncertainties (see Section 3.1).
3.1.2. Host galaxy, GLEAM J0917–0012
In Figure 3, we present the optical to near-IR SED of GLEAM J0917–0012. Despite the new deep optical photometry from HSC, our HAWKI $K_{\rm s}$
-band observation (see D20) provides the only detection. There is a break of more than an order of magnitude between the
$K_{\rm s}$
-band observation (see D20) provides the only detection. There is a break of more than an order of magnitude between the $K_{\rm s}-$
band detection and the HSC i-band upper limit. If this is due to the Lyman break, then the galaxy must lie at
$K_{\rm s}-$
band detection and the HSC i-band upper limit. If this is due to the Lyman break, then the galaxy must lie at $z \gtrsim 6.5$
, or alternatively the break suggests a very red colour due to significant dust obscuration. To further investigate this potential redshift constraint, we overlay four different templates in Figure 3 (three of which are taken from pégase, a galaxy evolutionary code predicting SEDs for a given scenario of evolution; Fioc & Rocca-Volmerange Reference Fioc and Rocca-Volmerange2019) at a range of redshifts. These templates are as follows:
$z \gtrsim 6.5$
, or alternatively the break suggests a very red colour due to significant dust obscuration. To further investigate this potential redshift constraint, we overlay four different templates in Figure 3 (three of which are taken from pégase, a galaxy evolutionary code predicting SEDs for a given scenario of evolution; Fioc & Rocca-Volmerange Reference Fioc and Rocca-Volmerange2019) at a range of redshifts. These templates are as follows:
-
1. A Lyman-break galaxy (LBG) from Álvarez Márquez et al. (Reference AAlvarez MAarquez, Burgarella, Buat, Ilbert and Perez-GonzAalez2019).
-
2. A pégase elliptical (E) galaxy template described in Drouart et al. (Reference Drouart, Rocca-Volmerange, De Breuck, Fioc, Lehnert, Seymour, Stern and Vernet2016), assuming the maximum age hypothesis as per Seymour et al. (Reference Seymour2007) and
$z_{\rm form}=20$
.Footnote
d
-
3. A pégase starburst (SB) template, with and without internal dust extinction, corresponding to a single stellar population with an age of 10 Myr (the amount of dust extinction is calculated consistently within the code assuming a spherical geometry).
-
4. The same pégase SB template as above but with additional dust extinction (in the form of a dust screen) making use of the Fitzpatrick (Reference Fitzpatrick1999) law.

Optical to near-IR SED of GLEAM J0917–0012 with each panel overlaying different galaxy templates over a range of redshifts (each template is normalised to the $K_{\rm s}$
-band detection). The diamond indicates the
$K_{\rm s}$
-band detection). The diamond indicates the $K_{\rm s}$
-band flux density from D20 (note that the uncertainty is smaller than the symbol), and the downward pointing triangles are the 3
$K_{\rm s}$
-band flux density from D20 (note that the uncertainty is smaller than the symbol), and the downward pointing triangles are the 3 $\sigma$
upper limits from the VIKING and HSC images using the same aperture as that used to measure the
$\sigma$
upper limits from the VIKING and HSC images using the same aperture as that used to measure the $K_{\rm s}$
-band flux density. The grey shaded area in the fourth panel inset indicates the permissible solutions for the extinction (note the small island of possible solutions at
$K_{\rm s}$
-band flux density. The grey shaded area in the fourth panel inset indicates the permissible solutions for the extinction (note the small island of possible solutions at $z\sim7$
and
$z\sim7$
and $A_{\rm V}\sim$
2). See Section 3.1 for more details about the templates and Section 4.1 for a discussion.
$A_{\rm V}\sim$
2). See Section 3.1 for more details about the templates and Section 4.1 for a discussion.

We normalise each of the four templates to the detection in $K_{\rm s}$
-band and apply an additional extinction shortward of the rest-frame Ly
$K_{\rm s}$
-band and apply an additional extinction shortward of the rest-frame Ly $\alpha$
. We use the formalism of Fan et al. (Reference Fan, Carilli and Keating2006) to characterise this extinction due to neutral hydrogen (HI) in the intergalactic medium (IGM). In brief, this absorption starts to be significant at
$\alpha$
. We use the formalism of Fan et al. (Reference Fan, Carilli and Keating2006) to characterise this extinction due to neutral hydrogen (HI) in the intergalactic medium (IGM). In brief, this absorption starts to be significant at $z>4$
and reaches full effect at
$z>4$
and reaches full effect at $z\sim6$
due to the evolution of the reionisation of the IGM. At
$z\sim6$
due to the evolution of the reionisation of the IGM. At $z>6$
, essentially all photons shortward of Ly
$z>6$
, essentially all photons shortward of Ly $\alpha$
are absorbed by intervening neutral HI gas.
$\alpha$
are absorbed by intervening neutral HI gas.
We can see that some templates are acceptable fits and some are not.
-
1. The LBG template is consistent with the data for
$z\gtrsim 7$
(lower-redshift options exceed the HSC fluxes). -
2. The elliptical template does not work for any redshift as it cannot reproduce the strong break.
-
3. The starburst template is too blue to fit the constraints even with some internal dust.
-
4. For the starburst template with a dust screen, the acceptable parameter space of redshift and
$A_{\rm V}$
is more complex; the inset shows the permissible solutions (given the 3
$\sigma$
upper limits).


The two possible highly dust-obscured starburst solutions are (i) $A_{\rm V}>3.5$
with a lower-redshift solution (
$A_{\rm V}>3.5$
with a lower-redshift solution ( $z<3$
) and (ii)
$z<3$
) and (ii) $A_{\rm V}\sim2$
with a high-redshift solution (
$A_{\rm V}\sim2$
with a high-redshift solution ( $z\sim7$
).
$z\sim7$
).
Again, the HSC data are the strongest constraints for the lower limits on the obscuration and redshift, but the WISE data provide us with the strongest constraints for the upper limits on the obscuration and redshift. An $A_{\rm V}>3$
solution corresponds to an extreme obscuration value even when compared to infrared luminous galaxies, that is, containing a large amount of dust (e.g. Buat et al. Reference Buat2011, for Herschel-selected galaxies), which typically present
$A_{\rm V}>3$
solution corresponds to an extreme obscuration value even when compared to infrared luminous galaxies, that is, containing a large amount of dust (e.g. Buat et al. Reference Buat2011, for Herschel-selected galaxies), which typically present $A_{\rm V}\sim1$
. Larger values of
$A_{\rm V}\sim1$
. Larger values of $A_{\rm V}$
are usually associated with AGN (e.g. Drouart et al. Reference Drouart2012). Given the highest
$A_{\rm V}$
are usually associated with AGN (e.g. Drouart et al. Reference Drouart2012). Given the highest $A_{\rm V}>3$
solutions are associated with the low-redshift solutions (
$A_{\rm V}>3$
solutions are associated with the low-redshift solutions ( $z<3$
), more obscuration translates into larger far-IR flux densities, which would be detected with Herschel. Therefore, the Herschel upper limits for GLEAM J0917–0012 gives little support to these low-redshift solutions.
$z<3$
), more obscuration translates into larger far-IR flux densities, which would be detected with Herschel. Therefore, the Herschel upper limits for GLEAM J0917–0012 gives little support to these low-redshift solutions.
3.2. Radio to mid-IR SED
We present the radio to mid-IR SED in the upper-right of Figure 4. The new VLA data points confirm the spectral break seen at GHz frequencies in D20. Also, the three ALMA data points potentially suggest a change of slope (see Table 1), indicating a possible radio core component or a possible dust contribution. Even though the first option cannot be completely excluded, it seems unlikely given that the D20 selection tends to favour sources aligned in the plane of the sky (type 2 AGN), where the core contribution is minimal due to the lack of Doppler boosting (Drouart et al. Reference Drouart2012).
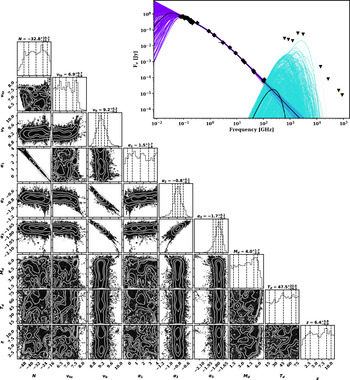
Upper right: Radio to far-IR SED of available data for GLEAM J0917–0012 fitted with MrMoose. Diamonds and triangles are detections and 3 $\sigma$
upper limits, respectively. The two solid black lines are the best fits for each component (the triple power law and modified blackbody; see Eq. (1)), with the purple and blue lines showing the probability distribution for each component, respectively. Lower left: ‘Corner plot’ of the marginalised probability density distributions for all parameters with the median value and uncertainty as the interquartile range at the top of each column. The vertical lines are the 10, 25, 50, 75, and 90th percentiles, respectively. We report the units and best constraints for the parameters in Table 3.
$\sigma$
upper limits, respectively. The two solid black lines are the best fits for each component (the triple power law and modified blackbody; see Eq. (1)), with the purple and blue lines showing the probability distribution for each component, respectively. Lower left: ‘Corner plot’ of the marginalised probability density distributions for all parameters with the median value and uncertainty as the interquartile range at the top of each column. The vertical lines are the 10, 25, 50, 75, and 90th percentiles, respectively. We report the units and best constraints for the parameters in Table 3.

While meaningful constraints on dust properties are not possible at this stage given the lack of a detection in the mid-IR, we can use MrMoose (an advanced Bayesian multi-component fitting code treating consistently the upper limits; Drouart & Falkendal Reference Drouart and Falkendal2018) to determine an upper limit to the contribution from dust at 100 GHz and predict at which frequency this contribution would become dominant.
We have added our new VLA and ALMA continuum points, radio data from the literature, and the WISE and Herschel infrared upper limits to the SED (see Table 1). In addition to fitting the triple power law (see D20; Eq. (4)), we include a new component of the form of a modified blackbody, calculated as follows:
 \begin{equation} f_\nu=(1+z)\frac{M_{\rm d}}{D_L^2}\kappa_{\rm abs}(\nu_0)\left(\frac{\nu}{\nu_0}\right)^{\beta}B_\nu(T_d), \end{equation}
with z is the redshift, $D_L$
is the luminosity distance,
$D_L$
is the luminosity distance, $\kappa_{abs}$
is the grain absorption cross section per unit mass (also referred to as the dust emissivity),
$\kappa_{abs}$
is the grain absorption cross section per unit mass (also referred to as the dust emissivity), $\beta$
is the power law index for the dust emissivity,
$\beta$
is the power law index for the dust emissivity, $\nu_0$
is the reference frequency,
$\nu_0$
is the reference frequency, $M_d$
is the mass of the dust,
$M_d$
is the mass of the dust, $B_\nu$
is the classical blackbody function (Planck’s law), and
$B_\nu$
is the classical blackbody function (Planck’s law), and $T_d$
is the temperature of the dust. For the sake of simplicity, we assumeFootnote
e
that
$T_d$
is the temperature of the dust. For the sake of simplicity, we assumeFootnote
e
that $\beta$
= 2.08,
$\beta$
= 2.08, $\nu_0=$
250 μm, and
$\nu_0=$
250 μm, and $\kappa_0$
(250 μm) = 4.0 cm
$\kappa_0$
(250 μm) = 4.0 cm $^2$
g−1 (Draine & Li Reference Draine and Li2007). We note that plausible different assumptions for
$^2$
g−1 (Draine & Li Reference Draine and Li2007). We note that plausible different assumptions for $\beta$
and
$\beta$
and $\kappa_{abs}$
would introduce a factor two to four change in the dust mass, but would hinder any direct comparison with other samples (for an extensive explanation, see Bianchi Reference Bianchi2013). This leaves us with three free parameters for the dust component:
$T_d$
, z, and
$M_d$
.
$\kappa_{abs}$
would introduce a factor two to four change in the dust mass, but would hinder any direct comparison with other samples (for an extensive explanation, see Bianchi Reference Bianchi2013). This leaves us with three free parameters for the dust component:
$T_d$
, z, and
$M_d$
.
We simultaneously fitted the triple power law and the dust component to the radio to mid-IR data with a set of uniform priors to the nine free parameters (six for the triple power law and three for the dust component). The results of the fitting are overlaid on the SED in the upper right of Figure 4 and the parameter constraints in the corner plot in the lower left. The best-fit parameters are presented in Table 3, along with the range of the uniform considered priors. As one would expect, neither the redshift nor the dust temperatureFootnote
f
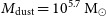
are constrained. However, the dust mass limit is particularly interesting: the 90th percentile for the dust mass distribution gives $M_{\rm dust}=10^{5.7}\,{\rm M}_\odot$
. Accounting for unknown and large systematic uncertainties, a conservative upper limit of
$M_{\rm dust}=10^{5.7}\,{\rm M}_\odot$
. Accounting for unknown and large systematic uncertainties, a conservative upper limit of $M_{\rm dust}<10^7\,{\rm M}_\odot$
is acceptable given our data, and this result is independent of both the redshift and dust temperature.
$M_{\rm dust}<10^7\,{\rm M}_\odot$
is acceptable given our data, and this result is independent of both the redshift and dust temperature.
Results from the observed-frame radio to mid-IR SED fitting. We refer the reader to D20 for the triple power law equation and description of the fitting procedure, as well as Eq. (1) for the modified blackbody. We report the 25th–75th percentiles as uncertainties.

†Considered not constrained by the fit.
While the maximum dust contribution at 100 GHz appears to be $\sim10$
%, only detections at
$\sim10$
%, only detections at $>200$
GHz with higher resolution would definitively settle the question of the presence of an upturn in the SED and its origin. A radio core would stay unresolved and would present a flat spectral index, while dust emission would start to be resolved, show no axial symmetry and the Rayleigh–Jeans tail of cold dust would result in a positive slope.
$>200$
GHz with higher resolution would definitively settle the question of the presence of an upturn in the SED and its origin. A radio core would stay unresolved and would present a flat spectral index, while dust emission would start to be resolved, show no axial symmetry and the Rayleigh–Jeans tail of cold dust would result in a positive slope.
Finally, a conversion between the obscuration (from Section 3.1) and the dust mass leads to interesting limits. Assuming (i) a conservative 4-kpc radius for our dust emitting region (equivalent to $<0.5$
arcsec at
$<0.5$
arcsec at $z>1$
, similar to the limits from our
$z>1$
, similar to the limits from our $K_{\rm s}$
-band and ALMA observations; see Section 4.3), (ii) a
$K_{\rm s}$
-band and ALMA observations; see Section 4.3), (ii) a $M_{\rm dust}<10^{7}\,{\rm M}_\odot$
limit from the MrMoose fitting and, (iii) the most mass conservative
$M_{\rm dust}<10^{7}\,{\rm M}_\odot$
limit from the MrMoose fitting and, (iii) the most mass conservative $A_{\rm V}-M_{\rm dust}$
conversion (Ferrara et al. Reference Ferrara, Bianchi, Cimatti and Giovanardi1999, see the constant sphere approximation in the appendix), we obtain a upper limit of
$A_{\rm V}-M_{\rm dust}$
conversion (Ferrara et al. Reference Ferrara, Bianchi, Cimatti and Giovanardi1999, see the constant sphere approximation in the appendix), we obtain a upper limit of $A_{\rm V}\lesssim 4$
. Any larger physical size, lower dust mass, or different geometries would lead to a lower
$A_{\rm V}\lesssim 4$
. Any larger physical size, lower dust mass, or different geometries would lead to a lower $A_{\rm V}$
. This constraint has further implications for the possible redshift of GLEAM J0917–0012, which are discussed in Section 4.
$A_{\rm V}$
. This constraint has further implications for the possible redshift of GLEAM J0917–0012, which are discussed in Section 4.
3.3. An extreme radio-to-near-IR ratio
Part of our selection technique (D20) for very high-redshift radio galaxies is their brightness at low frequencies ( $S_{\rm 150\,MHz}>100\,$
mJy) and faintness in
$S_{\rm 150\,MHz}>100\,$
mJy) and faintness in $K_{\rm s}$
-band (
$K_{\rm s}$
-band ( $K_{\rm s}>21.2$
). This technique has been used by several groups before us (e.g. De Breuck et al. Reference De Breuck, van Breugel, Stanford, Röttgering, Miley and Stern2002) and is designed to select galaxies with powerful jets observed in the radio, but at high redshift where the host galaxy light is faint. To investigate where GLEAM J0917–0012 lies with respect to the radio-powerful AGN population, we present in Figure 5 the observed-frame 150 MHz to 2.2 μm (the latter corresponding to K- and
$K_{\rm s}>21.2$
). This technique has been used by several groups before us (e.g. De Breuck et al. Reference De Breuck, van Breugel, Stanford, Röttgering, Miley and Stern2002) and is designed to select galaxies with powerful jets observed in the radio, but at high redshift where the host galaxy light is faint. To investigate where GLEAM J0917–0012 lies with respect to the radio-powerful AGN population, we present in Figure 5 the observed-frame 150 MHz to 2.2 μm (the latter corresponding to K- and $K_{\rm s}$
-band) ratio plotted against redshift for a selection of radio sources from the literature.
$K_{\rm s}$
-band) ratio plotted against redshift for a selection of radio sources from the literature.
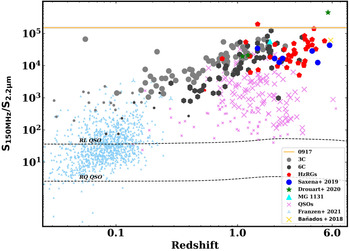
The observed-frame $150\,$
MHz to
$150\,$
MHz to $K_{\rm s}$
-band flux density ratio as a function of redshift for different classes of radio-powerful AGN (see legend). Larger symbols are those with a luminosity
$K_{\rm s}$
-band flux density ratio as a function of redshift for different classes of radio-powerful AGN (see legend). Larger symbols are those with a luminosity $L_{\rm 150MHz}>10^{27}\,$
WHz−1. The two template tracks are from Elvis et al. (Reference Elvis1994) for a radio-loud and radio-quiet QSO. The orange horizontal line at a value of
$L_{\rm 150MHz}>10^{27}\,$
WHz−1. The two template tracks are from Elvis et al. (Reference Elvis1994) for a radio-loud and radio-quiet QSO. The orange horizontal line at a value of $10^{5.1}$
represents GLEAM J0917–0012. Note that uncertainties are reported in grey, but are similar to the width of the line. Further details can be found in Section 3.3.
$10^{5.1}$
represents GLEAM J0917–0012. Note that uncertainties are reported in grey, but are similar to the width of the line. Further details can be found in Section 3.3.

As the redshift of GLEAM J0917–0012 is unknown, we mark it by a horizontal line. At high redshift, we include the other three sources from D20, the sample from (Saxena et al. Reference Saxena2019) and the radio-loud QSO from Bañados et al. (Reference Bañados2018). The two radio-loud QSOs at $z>6$
come from Ighina et al. (Reference Ighina, Belladitta, Caccianiga, Broderick, Drouart, Moretti and Seymour2021) and Spingola et al. (Reference Spingola, Dallacasa, Belladitta, Caccianiga, Giroletti, Moretti and Orienti2020). MG 1131+0456 is a radio-loud lensed galaxy (Stern & Walton Reference Stern and Walton2020). Furthermore, we used data from the following studies: 3C sample (Lilly & Longair Reference Lilly and Longair1984), 6C sample (Eales Reference Eales1985), compilation of known HzRGs at
$z>6$
come from Ighina et al. (Reference Ighina, Belladitta, Caccianiga, Broderick, Drouart, Moretti and Seymour2021) and Spingola et al. (Reference Spingola, Dallacasa, Belladitta, Caccianiga, Giroletti, Moretti and Orienti2020). MG 1131+0456 is a radio-loud lensed galaxy (Stern & Walton Reference Stern and Walton2020). Furthermore, we used data from the following studies: 3C sample (Lilly & Longair Reference Lilly and Longair1984), 6C sample (Eales Reference Eales1985), compilation of known HzRGs at $z\ge 2$
(Miley & De Breuck Reference Miley and De Breuck2008), QSOs cross-matched with TGSS (Pâris et al. Reference Pâris2018), and a complete sample of local, GLEAM-selected radio-loud AGN from a cross-match with 6dFGS, (Franzen et al., Reference Franzen2021).
$z\ge 2$
(Miley & De Breuck Reference Miley and De Breuck2008), QSOs cross-matched with TGSS (Pâris et al. Reference Pâris2018), and a complete sample of local, GLEAM-selected radio-loud AGN from a cross-match with 6dFGS, (Franzen et al., Reference Franzen2021).
We can see that, regardless of redshift, GLEAM J0917–0012 has the third-most extreme flux density ratio, with our previous $z=5.55$
discovery (GLEAM J0856+0224 from D20) being the most extreme. Barring Cygnus A, the high-ratio datum at
$z=5.55$
discovery (GLEAM J0856+0224 from D20) being the most extreme. Barring Cygnus A, the high-ratio datum at $z<0.1$
, we observe a general trend of increasing ratio with redshift. This result is not a selection effect of the populations used (the low-redshift 3C and Franzen et al. samples are both complete in brightness), but rather likely driven by the proliferation of powerful jets earlier in the Universe when the black holes in galaxies were more active.
$z<0.1$
, we observe a general trend of increasing ratio with redshift. This result is not a selection effect of the populations used (the low-redshift 3C and Franzen et al. samples are both complete in brightness), but rather likely driven by the proliferation of powerful jets earlier in the Universe when the black holes in galaxies were more active.
Based on rest-frame near-IR data of a large sample of HzRGs, Seymour et al. (Reference Seymour2007) showed such galaxies consistently have stellar masses of $10^{11}\!-\!10^{11.5}\textit{M}_\odot$
even out to the highest redshifts probed in that work (
$10^{11}\!-\!10^{11.5}\textit{M}_\odot$
even out to the highest redshifts probed in that work ( $z\sim 5$
). We also note the differing k-corrections for the radio and infrared data. While both wavelength ranges will sample a falling portion of the SED, they will change at different rates depending on (i) the steepness of the radio spectra (
$z\sim 5$
). We also note the differing k-corrections for the radio and infrared data. While both wavelength ranges will sample a falling portion of the SED, they will change at different rates depending on (i) the steepness of the radio spectra ( $\alpha<-0.7$
, and decreasing with increasing redshift at higher rest-frame frequencies) and (ii) the amount of star formation and dust extinction in the observed-frame 2.2-μm emission (at an increasingly shorter wavelength with increasing redshift).
$\alpha<-0.7$
, and decreasing with increasing redshift at higher rest-frame frequencies) and (ii) the amount of star formation and dust extinction in the observed-frame 2.2-μm emission (at an increasingly shorter wavelength with increasing redshift).
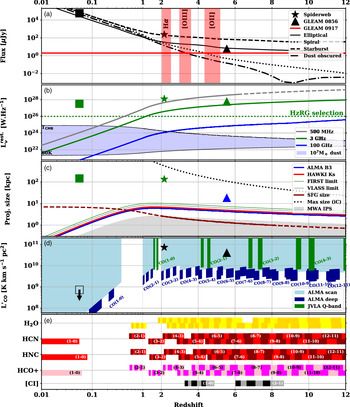
Figure synthesising the known constraints on GLEAM J0917–0012 as a function of redshift. Note that the redshift axis changes from a log to a linear scale at $z=1$
. We present Cygnus A as a square (the open symbol in panel (d) indicating an upper limit), the Spiderweb galaxy as a star and GLEAM J0856+0224 as a triangle (see Section 4). From top to bottom: (a)
$z=1$
. We present Cygnus A as a square (the open symbol in panel (d) indicating an upper limit), the Spiderweb galaxy as a star and GLEAM J0856+0224 as a triangle (see Section 4). From top to bottom: (a) $K_{\rm s}$
-band flux density as a red line) with 10
$K_{\rm s}$
-band flux density as a red line) with 10 $^{12}\,{\rm M}_\odot$
-normalised stellar templates (see Section 4.1 for more details), where the shaded light red areas represent potential contamination by atomic lines; (b) radio luminosities at different rest-frame frequencies (solid lines), with the dashed line showing the extrapolation beyond what we can constrain in the observed frame, the blue shaded area representing a 10
$^{12}\,{\rm M}_\odot$
-normalised stellar templates (see Section 4.1 for more details), where the shaded light red areas represent potential contamination by atomic lines; (b) radio luminosities at different rest-frame frequencies (solid lines), with the dashed line showing the extrapolation beyond what we can constrain in the observed frame, the blue shaded area representing a 10 $^7\,\,{\rm M}_\odot$
blackbody with a range of allowed temperatures (see Section 3.2), and the green dotted line showing the HzRG selection limit from Seymour et al. (Reference Seymour2007); (c) projected size at different frequencies along with (i) the star-forming galaxy size evolution (solid dark red line) from (Allen et al. Reference Allen2017) (note the extrapolation as a dashed line), (ii) the relevant survey resolutions, (iii) the IPS size domain as a grey shaded area (see Section 4.3), and (iv) the maximal iC size from Saxena et al. (Reference Saxena2018a); (d) the accessible part of the L
$^7\,\,{\rm M}_\odot$
blackbody with a range of allowed temperatures (see Section 3.2), and the green dotted line showing the HzRG selection limit from Seymour et al. (Reference Seymour2007); (c) projected size at different frequencies along with (i) the star-forming galaxy size evolution (solid dark red line) from (Allen et al. Reference Allen2017) (note the extrapolation as a dashed line), (ii) the relevant survey resolutions, (iii) the IPS size domain as a grey shaded area (see Section 4.3), and (iv) the maximal iC size from Saxena et al. (Reference Saxena2018a); (d) the accessible part of the L $^\prime_{\rm CO}$
–z parameter space (shaded regions) given the sensitivities of our observations (see Section 4.4 for more details); and (e) supplementary molecular lines, with their observable ranges and the respective sensitivities from the ALMA spectra (see Section 4.4).
$^\prime_{\rm CO}$
–z parameter space (shaded regions) given the sensitivities of our observations (see Section 4.4 for more details); and (e) supplementary molecular lines, with their observable ranges and the respective sensitivities from the ALMA spectra (see Section 4.4).

4. Analysis of observable quantities
As none of the expected emission lines were detected in either the deeper ALMA or the VLA observations, the D20 detections must have been noise peaks regrettably aligned in frequency. The logical conclusion is therefore that GLEAM J0917–0012 is not at $z=10.15$
, and that the D20 detections were instead a manifestation of the effect described in the appendix of Krips et al. (Reference Krips, Neri and Cox2012), where the widening bandwidth in modern interferometers increases the potential for spurious detections at low signal-to-noise ratio.
$z=10.15$
, and that the D20 detections were instead a manifestation of the effect described in the appendix of Krips et al. (Reference Krips, Neri and Cox2012), where the widening bandwidth in modern interferometers increases the potential for spurious detections at low signal-to-noise ratio.
However, such a large amount of data over the electromagnetic spectrum provides us with numerous upper limits, and therefore information which can be used to make an estimate for the redshift of GLEAM J0917–0012. Figure 6 synthesises all of our constraints from the data presented in Section 2. For each subplot (a to e), we investigate the following observable quantities and our constraints on them across $0.01<z<12$
.
$0.01<z<12$
.
-
(a) The near-IR flux density.
-
(b) The radio and sub-mm flux densities.
-
(c) The angular size of the host galaxy and radio emission.
-
(d) The luminosity of the CO gas, and
-
(e) Whether other molecular lines fall within the observing windows of our ALMA and VLA observations.
We investigate the constraints of each of the above observables separately in this section, for clarity, due to the assumptions which go into each part. We keep the discussion of the joint constraints for Section 5. For comparison to GLEAM J0917–0012, in each subplot, we also present the corresponding properties of Cygnus A ( $z=0.0561$
; Mazzarella et al. Reference Mazzarella, Graham, Sanders and Djorgovski1993; Condon et al. Reference Condon, Cotton, Greisen, Yin, Perley, Taylor and Broderick1998; Skrutskie et al. Reference Skrutskie2006), the Spiderweb galaxy (
$z=0.0561$
; Mazzarella et al. Reference Mazzarella, Graham, Sanders and Djorgovski1993; Condon et al. Reference Condon, Cotton, Greisen, Yin, Perley, Taylor and Broderick1998; Skrutskie et al. Reference Skrutskie2006), the Spiderweb galaxy ( $z=2.16$
; Emonts et al. Reference Emonts2014; Seymour et al. Reference Seymour2007; De Breuck et al. Reference De Breuck2010), and GLEAM J0856+0224 (
$z=2.16$
; Emonts et al. Reference Emonts2014; Seymour et al. Reference Seymour2007; De Breuck et al. Reference De Breuck2010), and GLEAM J0856+0224 ( $z=5.55$
; D20), in order to quantitatively compare GLEAM J0917–0012 with known sources of the same class.
$z=5.55$
; D20), in order to quantitatively compare GLEAM J0917–0012 with known sources of the same class.
4.1. Near-IR properties
Figure 6(a) presents the predicted $K_s$
-band flux density of a stellar population as a function of redshift based on an assumed evolutionary history. These calculations are made using pégase and assume the maximum age approximation (Seymour et al. Reference Seymour2007), Given that GLEAM J0917–0012 is detected in a single near-IR band, we restrict this analysis to four modelled templates, some of which are presented in Section 3.1: an elliptical (E), a spiral (S), a 10-Myr starburstFootnote
g
(SB), and an obscured 10-Myr starburst (with
$K_s$
-band flux density of a stellar population as a function of redshift based on an assumed evolutionary history. These calculations are made using pégase and assume the maximum age approximation (Seymour et al. Reference Seymour2007), Given that GLEAM J0917–0012 is detected in a single near-IR band, we restrict this analysis to four modelled templates, some of which are presented in Section 3.1: an elliptical (E), a spiral (S), a 10-Myr starburstFootnote
g
(SB), and an obscured 10-Myr starburst (with $A_{\rm V}=4$
)Footnote
h
in order to normalise the track to a given stellar mass and assess the impact of star formation histories on the
$A_{\rm V}=4$
)Footnote
h
in order to normalise the track to a given stellar mass and assess the impact of star formation histories on the $K_{\rm s}$
-band flux density with respect to redshift.
$K_{\rm s}$
-band flux density with respect to redshift.
We show the tracks for a 10 $^{12}\,{\rm M}_\odot$
galaxy for all four scenarios. Bright atomic line contributions are not included in these templates, which could affect certain redshift windows of the spiral and SB templates (shaded red regions in Figure 6(a)). Strong lines would result a slightly overestimated stellar mass in these redshift ranges. We note that any AGN contribution to the
$^{12}\,{\rm M}_\odot$
galaxy for all four scenarios. Bright atomic line contributions are not included in these templates, which could affect certain redshift windows of the spiral and SB templates (shaded red regions in Figure 6(a)). Strong lines would result a slightly overestimated stellar mass in these redshift ranges. We note that any AGN contribution to the $K_{\rm s}$
-band flux would only decrease the stellar mass estimates.
$K_{\rm s}$
-band flux would only decrease the stellar mass estimates.
The upper limits in the optical (Section 3.1) are not used in these constraints, but we checked the relative depth of each band and their relative constraints. The $K_{\rm s}$
-band data provide the best constraints due to being the longest-wavelength near-IR observation available and comparatively the deepest image. We note several implications of the single broadband detection as follows:
$K_{\rm s}$
-band data provide the best constraints due to being the longest-wavelength near-IR observation available and comparatively the deepest image. We note several implications of the single broadband detection as follows:
-
• For
$z>2$
, the system is massive,
$M_* >10^{11}\,{\rm M}_\odot$
, assuming 100% stellar light and the elliptical template. The spiral template is implausible at
$z>4$
, as it would require a system with
$M_*>10^{12}\,\,{\rm M}_\odot$
. The 10-Myr-old SB template reproduces the
$K_{\rm s}$
-band emission for
$M_*>10^{10}\,\,{\rm M}_\odot$
at
$z>4$
. Any dust obscuration requires an even greater stellar mass. -
• For
$z<1$
, the system would likely have a low galaxy mass,
$M_*<10^{10}\,\,{\rm M}_\odot$
, and would therefore likely be classified as a dwarf galaxy. -
• The
$z>7$
solution is favoured from the optical upper limits; see Figure 3 and Section 3.1.


4.2. Radio and sub-mm properties
We report the monochromatic luminosity at different rest-frame frequencies (500 MHz, 3 GHz, and 100 GHz) in Figure 6(b). When compared to the HzRG selection limit (L $_{\rm 3\,GHz}>10^{26}$
W Hz−1; Seymour et al. Reference Seymour2007), GLEAM J0917–0012 meets the HzRG criterion in terms of radio luminosity at
$_{\rm 3\,GHz}>10^{26}$
W Hz−1; Seymour et al. Reference Seymour2007), GLEAM J0917–0012 meets the HzRG criterion in terms of radio luminosity at $z\gtrsim1$
. The dashed part of the 500-MHz luminosity track indicates where we extrapolate from our best SED fit as the observed-frame frequency shifts outside of the MWA frequency coverage (
$z\gtrsim1$
. The dashed part of the 500-MHz luminosity track indicates where we extrapolate from our best SED fit as the observed-frame frequency shifts outside of the MWA frequency coverage ( $\nu_{\rm obs}<70\,$
MHz).
$\nu_{\rm obs}<70\,$
MHz).
As the redshift of the source increases, the rest-frame frequency of the ALMA Band 3 image enters the sub-mm regime where dust may contribute significantly (the highest-frequency data may suggest an upturn; see Table 1). Given the negative k-correction of the cold gas in galaxies (Blain et al. Reference Blain, Smail, Ivison and Kneib1999) and the increase in CMB temperature with redshift, the dust contribution significantly affects the SED (da Cunha et al. Reference da Cunha2013). We can use this to constrain the redshift range.
While a significant contribution from dust is ruled out from our SED fitting (see Section 3.2), we present, as a blue shaded area in Figure 6(b), the contribution of a modified blackbody at the rest-frame frequency of 100 GHz (see Eq. (1)) with $M_{\rm dust}=$
107 M
$M_{\rm dust}=$
107 M $_\odot$
(the limit provided by MrMoose; see Figure 4). The temperature range is fixed as
$_\odot$
(the limit provided by MrMoose; see Figure 4). The temperature range is fixed as $T_{\rm CMB}(z)<T<60\,$
K, where the minimum allowed temperature at a given redshift is the corresponding CMB temperature. Therefore, the allowed range of dust temperatures decreases with redshift, which could allow one to effectively ‘break’ the classical temperature-redshift degeneracy for the highest-redshift sources. However, we remind the reader that numerous approximations are used in some of the terms (such as the dust composition and grain size distribution).
$T_{\rm CMB}(z)<T<60\,$
K, where the minimum allowed temperature at a given redshift is the corresponding CMB temperature. Therefore, the allowed range of dust temperatures decreases with redshift, which could allow one to effectively ‘break’ the classical temperature-redshift degeneracy for the highest-redshift sources. However, we remind the reader that numerous approximations are used in some of the terms (such as the dust composition and grain size distribution).
Our key conclusions from the second panel are as follows:
-
• For
$z>1$
sources,
$L_{\rm 3\,GHz}$
is the preferable measure, as the rest-frame luminosity calculation does not require an extrapolation. -
• For
$z>1$
, GLEAM J0917–0012 is considered a powerful radio galaxy, similar to the Seymour et al. (Reference Seymour2007) sample. -
• If the source is at
$z<2$
, it has very little dust,
$M_{\rm dust}<10^7\,{\rm M}_\odot$
, and/or a higher dust temperature,
$T_{\rm dust}>20\,$
K (Section 3.2). -
• For
$z<1$
, the source has a radio luminosity on par with radio-luminous dwarf galaxies (e.g. Mezcua et al. Reference Mezcua, Suh and Civano2019).


4.3. Size properties
The source appears unresolved in most of the radio data and marginally resolved in the FIRST (deconvolved size 1.2 arcsec $\times$
1.0 arcsec, Becker et al. Reference Becker, White and Helfand1995) and VLASS image (deconvolved size 0.94 arcsec
$\times$
1.0 arcsec, Becker et al. Reference Becker, White and Helfand1995) and VLASS image (deconvolved size 0.94 arcsec $\times$
0.58 arcsec, Gordon et al. Reference Gordon2020). Moreover, GLEAM J0917–0012 is unresolved in the
$\times$
0.58 arcsec, Gordon et al. Reference Gordon2020). Moreover, GLEAM J0917–0012 is unresolved in the $K_s-$
band image, thereby putting constraints on the physical size of both the radio structure and host galaxy, respectively (see Figure 6(c)). Our best size constraint in the radio comes from the ALMA 100-GHz data (
$K_s-$
band image, thereby putting constraints on the physical size of both the radio structure and host galaxy, respectively (see Figure 6(c)). Our best size constraint in the radio comes from the ALMA 100-GHz data ( $<0.7\,$
arcsec), putting a
$<0.7\,$
arcsec), putting a $<6$
kpc projected linear size limit if GLEAM J0917–0012 is at
$<6$
kpc projected linear size limit if GLEAM J0917–0012 is at $z>1$
. While this indicates that the source is small at high frequencies, one should note that this might not be the case at lower frequencies as the radio galaxies often have extended emission at these frequencies (i.e. lobes with lower-energy electrons).
$z>1$
. While this indicates that the source is small at high frequencies, one should note that this might not be the case at lower frequencies as the radio galaxies often have extended emission at these frequencies (i.e. lobes with lower-energy electrons).
Interestingly, the IPS observations (see Section 2.4) provide additional size constraints at low frequency. Our source scintillates partially: at the $\sim$
50% level. As discussed previously in Section 2, this can be interpreted as (i) a single source 0.6 arcsec across, (ii) half of the 162-MHz flux being emitted from a region more compact than
$\sim$
50% level. As discussed previously in Section 2, this can be interpreted as (i) a single source 0.6 arcsec across, (ii) half of the 162-MHz flux being emitted from a region more compact than $\sim$
0.3 arcsec, which represents
$\sim$
0.3 arcsec, which represents $<3\,$
kpc at
$<3\,$
kpc at $z>1$
(see Figure 6 in Chhetri et al. Reference Chhetri, Morgan, Ekers, Macquart, Sadler, Giroletti, Callingham and Tingay2018) or, (iii) a double source separated by at least 0.3 arcsec of which one is partially resolved at
$z>1$
(see Figure 6 in Chhetri et al. Reference Chhetri, Morgan, Ekers, Macquart, Sadler, Giroletti, Callingham and Tingay2018) or, (iii) a double source separated by at least 0.3 arcsec of which one is partially resolved at $\sim$
0.3 arcsec. Given that the radio size of our source is
$\sim$
0.3 arcsec. Given that the radio size of our source is $<1.2$
arcsec at at 1.4, 3, and 100 GHz (i.e. the VLASS, FIRST, and ALMA size), we can likely discard the third option as we should be able to see some partially resolved features at these frequencies. Moreover, the two first hypotheses basically assume that at least half of the flux is in a structure larger than
$<1.2$
arcsec at at 1.4, 3, and 100 GHz (i.e. the VLASS, FIRST, and ALMA size), we can likely discard the third option as we should be able to see some partially resolved features at these frequencies. Moreover, the two first hypotheses basically assume that at least half of the flux is in a structure larger than $\sim0.3$
arcsec. This translates into a 3–10 kpc region (assuming
$\sim0.3$
arcsec. This translates into a 3–10 kpc region (assuming $z>1$
and the FIRST/VLASS size) or 3–6 kpc (using the ALMA resolution as a limit with the assumption that the 100-ghz continuum traces the same physical process), and the remaining fraction (if any) at
$z>1$
and the FIRST/VLASS size) or 3–6 kpc (using the ALMA resolution as a limit with the assumption that the 100-ghz continuum traces the same physical process), and the remaining fraction (if any) at $<3$
kpc.
$<3$
kpc.
We can compare the observed size to the maximum size estimated to be achievable for radio sources using the modelling presented in Saxena et al. (Reference Saxena, Röttgering and Rigby2017), which uses the Kaiser & Best (Reference Kaiser and Best2007) framework. For a high-redshift source, the inverse-ComptonFootnote i (iC) effect will be significant, reducing and constraining the radio emission, and explaining the smaller radio size. Interestingly, the size limit from our unresolved observations at different frequencies is compatible with an iC-limited size for GLEAM J0917–0012.
The $K_{\rm s}$
-band image provides an upper limit of 0.8 arcsec for the projected angular size of the host galaxy. When compared with the size evolution of star-forming galaxies (dark red line in Figure 6(c); Allen et al. Reference Allen2017), this upper limit seems consistent for any solution
$K_{\rm s}$
-band image provides an upper limit of 0.8 arcsec for the projected angular size of the host galaxy. When compared with the size evolution of star-forming galaxies (dark red line in Figure 6(c); Allen et al. Reference Allen2017), this upper limit seems consistent for any solution $z>1$
, albeit with caveats given the uncertainties on the galaxy type of GLEAM J0917–0012 and the extrapolation outside of the fitted redshift range (dashed part of the line). Conversely, the observed size would suggest a very small system at
$z>1$
, albeit with caveats given the uncertainties on the galaxy type of GLEAM J0917–0012 and the extrapolation outside of the fitted redshift range (dashed part of the line). Conversely, the observed size would suggest a very small system at $z<1$
, on scales of a few kpc or even smaller.
$z<1$
, on scales of a few kpc or even smaller.
We now summarise the key points from this section:
-
• The unresolved radio data indicates a compact source at all frequencies
-
• The IPS observations provide us with an upper limit for the angular scale within which half of the radio flux at 162 MHz is contained: 0.3 arcsec, corresponding to
$<3$
kpc at
$z>1$
. Moreover, there is possibly some extended structure out to
$\sim$
10 kpc (the VLASS/FIRST resolution data) or
$\sim$
6 kpc (assuming the ALMA data traces the same emission). -
• For
$z<1$
, the host galaxy would be unusually small given our
$K_{\rm s}$
-band observation, which would be unprecedented in nature for a galaxy (<1 kpc in size).


4.4. Molecular gas properties
Despite the non-detection of emission lines in our VLA and ALMA spectra, we can estimate useful upper limits on the molecular gas properties given the sizeable integration time spent on the source (Figures 6(d) and (e)). We use the following formula to derive a 3 $\sigma$
upper limit on the strength of each CO line (adapted from Eq. (153) of Meyer et al. Reference Meyer, Robotham, Obreschkow, Westmeier, Duffy and Staveley-Smith2017):
$\sigma$
upper limit on the strength of each CO line (adapted from Eq. (153) of Meyer et al. Reference Meyer, Robotham, Obreschkow, Westmeier, Duffy and Staveley-Smith2017):
 \begin{equation}I_{\rm CO}<3\sigma\Delta\nu \sqrt{\frac{{\rm FWHM}}{\Delta\nu}},\end{equation}
where $I_{\rm CO}$
is the integrated line flux in Jy km s−1,
$I_{\rm CO}$
is the integrated line flux in Jy km s−1, $\sigma$
is the noise of the channel in Jy,
$\sigma$
is the noise of the channel in Jy, $\Delta_\nu$
is the channel width in
$\Delta_\nu$
is the channel width in $\mathrm{km\,s}^{-1}$
, and FWHM is the full width at half maximum in
$\mathrm{km\,s}^{-1}$
, and FWHM is the full width at half maximum in $\mathrm{km\,s}^{-1}$
. Assuming FWHM = 750
$\mathrm{km\,s}^{-1}$
. Assuming FWHM = 750 $\mathrm{km\,s}^{-1}$
(roughly three 80- MHz-channelsFootnote
j
) which is typical for high-redshift quasars and HzRGs (e.g. Carilli & Walter Reference Carilli and Walter2013), this leads to
$\mathrm{km\,s}^{-1}$
(roughly three 80- MHz-channelsFootnote
j
) which is typical for high-redshift quasars and HzRGs (e.g. Carilli & Walter Reference Carilli and Walter2013), this leads to $I_{\rm CO}^{\rm ALMA}<0.09\,$
Jy km s−1 and
$I_{\rm CO}^{\rm ALMA}<0.09\,$
Jy km s−1 and $I_{\rm CO}^{\rm VLA}<0.04\,$
Jy km s−1. Note that this formula can be applied to other lines, such as [CI] and will lead to similar upper limits if assuming the same line width. Note that we use the radio convention for frequency–velocity conversion.
$I_{\rm CO}^{\rm VLA}<0.04\,$
Jy km s−1. Note that this formula can be applied to other lines, such as [CI] and will lead to similar upper limits if assuming the same line width. Note that we use the radio convention for frequency–velocity conversion.
From the integrated line flux limit, it is now possible to calculate a CO line luminosity ( $L'_{\rm CO}$
) limit, with the classical formula from Solomon & Vanden Bout (Reference Solomon and Vanden Bout2005):
$L'_{\rm CO}$
) limit, with the classical formula from Solomon & Vanden Bout (Reference Solomon and Vanden Bout2005):
 \begin{equation}L'_{\rm CO} = 3.25 \times 10^7 \left( \frac{I_{\rm CO}}{{\rm Jy\,km\,s^{-1} }} \right) \left( \frac{D_{L}}{\rm Mpc} \right)^2 \left( \frac{\nu_{\rm rest}}{{\rm GHz}} \right)^{-2} (1+z)^{-1},\end{equation}
where $D_L$
is the luminosity distance and
$D_L$
is the luminosity distance and $\nu_{\rm rest}$
is the line rest-frame frequency.
$\nu_{\rm rest}$
is the line rest-frame frequency.
Figure 6(d) presents the accessible parameter space from our respective limits with ALMA (light and dark blue shaded areas) and VLA (green shaded area), for the corresponding line and redshift. The discontinuous shape for the deeper ALMA observations is due to the narrower frequency coverage compared to the original spectrum. We note that we cannot access some parts of the parameter space: the $z<1$
and
$z<1$
and $1.8<z<2$
regions (an observational constraint; see Weiß et al. Reference Weib2013), as well as fainter systems with L
$1.8<z<2$
regions (an observational constraint; see Weiß et al. Reference Weib2013), as well as fainter systems with L $^\prime_{\rm CO}$ $<10^{9.5}$
K km s−1 pc2. However, we do have good coverage for the rest of the redshift solutions for intrinsically bright CO emission (L
$<10^{9.5}$
K km s−1 pc2. However, we do have good coverage for the rest of the redshift solutions for intrinsically bright CO emission (L $^\prime_{\rm CO}$ $>10^{9.5}$
K km s−1 pc2, where most of the powerful systems are detected; Carilli & Walter Reference Carilli and Walter2013).
$>10^{9.5}$
K km s−1 pc2, where most of the powerful systems are detected; Carilli & Walter Reference Carilli and Walter2013).
A limitation not shown in Figure 6(d) (that is very hard to assess without the redshift of the source) is the potential disappearance of the CO lines at the highest-redshift end. This would be due to the decreasing contrast of the line emission with the background light, either from the strong and compact radio emission from the source itself (creating a mix of emission and absorption of the CO lines) or the CMB. Indeed, as the CMB temperature increases with redshift, the gas floor temperature will be locked in with the background radiation and therefore the lower CO transitions will be unobservable (e.g. Zhang et al. Reference Zhang, Papadopoulos, Ivison, Galametz, Smith and Xilouris2016). This phenomenon particularly affects the lower rotational CO transition lines given the gas temperature, that is, the VLA observations.
Finally, in Figure 6(e), we report other bright molecular lines transitions in the ALMA frequency range, potentially reaching above mJy level, and therefore detectable by ALMA. We do not report their predicted intensities as (i) no observations are readily available for HzRGs for the whole redshift range, (ii) while the lower HCN/HCO+ transitions would be detected ( $z<1$
; e.g. Cañameras et al. Reference Cañameras2021), the higher ones are very likely to be well below our detection limit given that GLEAM J0917–0012 does not appear to be a lensed source (Riechers et al. Reference Riechers, Weib, Walter and Wagg2010; Spilker et al. Reference Spilker2014), and (iii) the special case of the H
$z<1$
; e.g. Cañameras et al. Reference Cañameras2021), the higher ones are very likely to be well below our detection limit given that GLEAM J0917–0012 does not appear to be a lensed source (Riechers et al. Reference Riechers, Weib, Walter and Wagg2010; Spilker et al. Reference Spilker2014), and (iii) the special case of the H $_2$
O molecule requires a complex set of assumptions/calculations (e.g. van der Werf et al. Reference van der Werf2011; Yang et al. Reference Yang, Gao, Omont, Liu, Isaak, Downes, van der Werf and Lu2013), but some bright transitions are detected in high-redshift systems (e.g. Weiß et al. Reference Weib2013; Wang et al. Reference Wang2013; Gullberg et al. Reference Gullberg2016; Lehnert et al. Reference Lehnert, Yang, Emonts, Omont, Falgarone, Cox and Guillard2020). We draw attention to the [CI] lines, which cover the ranges
$_2$
O molecule requires a complex set of assumptions/calculations (e.g. van der Werf et al. Reference van der Werf2011; Yang et al. Reference Yang, Gao, Omont, Liu, Isaak, Downes, van der Werf and Lu2013), but some bright transitions are detected in high-redshift systems (e.g. Weiß et al. Reference Weib2013; Wang et al. Reference Wang2013; Gullberg et al. Reference Gullberg2016; Lehnert et al. Reference Lehnert, Yang, Emonts, Omont, Falgarone, Cox and Guillard2020). We draw attention to the [CI] lines, which cover the ranges $3<z<5$
and
$3<z<5$
and $6<z<9$
. We expect these lines to have similar fluxes to the adjacent CO lines (e.g. Gullberg et al. Reference Gullberg2016), which therefore put further constraints on the likely redshift of GLEAM J0917–0012.
$6<z<9$
. We expect these lines to have similar fluxes to the adjacent CO lines (e.g. Gullberg et al. Reference Gullberg2016), which therefore put further constraints on the likely redshift of GLEAM J0917–0012.
The key implications of Figure 6(d) and (e) are as follows:
-
• The redshift ranges
$0.4<z<1.0$
and
$1.8<z<2.0$
are not covered with our technique when solely considering the CO lines, and we could be missing a bright molecular gas source. -
• When taking into account secondary lines (HCO+, HCN/HNC, and H
$_2$
O), the redshift window that is not covered possibly narrows to
$0.4<z<0.6$
, favouring a higher-redshift solution and much fainter systems. -
• The source is likely a molecular gas-poor system, especially for the higher-redshift solutions
-
• The VLA data do not add strong redshift constraints as they are comparatively shallower than the ALMA data. These VLA data may also be affected by the aforementioned CMB effect at the high-redshift end.


5. Constraining the redshift of GLEAM J0917–0012
In this section, we discuss the nature and the likely redshift of GLEAM J0917–0012, distilling the information presented in Section 4. Firstly, we consider the hypothesis that GLEAM J0917–0012 is a Galactic source. The most obvious candidate in this case would be a pulsar given: (i) its faintness in $K_{\rm s}$
-band (where few pulsars have been detected; e.g. Mignani et al. Reference Mignani, De Luca, Hummel, Zajczyk, Rudak, Kanbach and Slowikowska2012), (ii) its extreme radio/near-IR flux density ratio (see Figure 5), (iii) the compact nature of the source, (Figure 6), and (iv) the low-frequency spectral index, similar to detected pulsars (e.g. Murphy et al. Reference Murphy2017). However, we argue against this possibility for GLEAM J0917–0012 for the following reasons: (i) none of the radio data considered in Section 2.5 have a strong polarised component up to 10 GHz, (ii) it does not appear to be coincident with a pulsar in currently available cataloguesFootnote
k
, (iii) there is no evidence in the radio spectrum of variability, which we might expect from a pulsar, particularly when the spectrum has been compiled using data from a variety of observations taken at different epochs, and (iv) the NSI value (Section 2.4) would require a contrived scenario such as a small pulsar wind nebula or a coincidental alignment of a compact radio source with a steep-spectrum pulsar, and is also incompatible with a lone pulsar (which have an NSI
$K_{\rm s}$
-band (where few pulsars have been detected; e.g. Mignani et al. Reference Mignani, De Luca, Hummel, Zajczyk, Rudak, Kanbach and Slowikowska2012), (ii) its extreme radio/near-IR flux density ratio (see Figure 5), (iii) the compact nature of the source, (Figure 6), and (iv) the low-frequency spectral index, similar to detected pulsars (e.g. Murphy et al. Reference Murphy2017). However, we argue against this possibility for GLEAM J0917–0012 for the following reasons: (i) none of the radio data considered in Section 2.5 have a strong polarised component up to 10 GHz, (ii) it does not appear to be coincident with a pulsar in currently available cataloguesFootnote
k
, (iii) there is no evidence in the radio spectrum of variability, which we might expect from a pulsar, particularly when the spectrum has been compiled using data from a variety of observations taken at different epochs, and (iv) the NSI value (Section 2.4) would require a contrived scenario such as a small pulsar wind nebula or a coincidental alignment of a compact radio source with a steep-spectrum pulsar, and is also incompatible with a lone pulsar (which have an NSI $>$
0.9).
$>$
0.9).
As a galaxy at $z<0.4$
, GLEAM J0917–0012 would have very peculiar properties for a radio-loud AGN or a compact galaxy, as suggested by the radio emission. These are: (i) a low stellar mass,
$z<0.4$
, GLEAM J0917–0012 would have very peculiar properties for a radio-loud AGN or a compact galaxy, as suggested by the radio emission. These are: (i) a low stellar mass, $M_*<10^9\,{\rm M}_\odot$
(Figure 6(a); note that this is in tension with the stellar mass of Cygnus A); (ii) very molecular gas-poor and with a low dust content (see Figure 6(b) and (d)); (iii) an extreme radio-to-near-IR flux density ratio, which is similar only to Cygnus A in the local Universe (see Figure 5); (iv) a very small size,
$M_*<10^9\,{\rm M}_\odot$
(Figure 6(a); note that this is in tension with the stellar mass of Cygnus A); (ii) very molecular gas-poor and with a low dust content (see Figure 6(b) and (d)); (iii) an extreme radio-to-near-IR flux density ratio, which is similar only to Cygnus A in the local Universe (see Figure 5); (iv) a very small size, $<1$
kpc (Figure 6(c)); and (v) a very obscured optical-near-IR SED (Figure 3), in tension with (ii). For all these reasons, we consider this redshift range as unlikely.
$<1$
kpc (Figure 6(c)); and (v) a very obscured optical-near-IR SED (Figure 3), in tension with (ii). For all these reasons, we consider this redshift range as unlikely.
For the $0.4<z<1.0$
range, GLEAM J0917–0012 has somewhat the same range of properties as described above, but less extreme: the mass is higher and the size is larger. We cannot be certain that GLEAM J0917–0012 does lie in this redshift range as the ALMA data do not cover any CO lines. However, Figure 3 seems to be inconsistent with this solution except for a very obscured object (
$0.4<z<1.0$
range, GLEAM J0917–0012 has somewhat the same range of properties as described above, but less extreme: the mass is higher and the size is larger. We cannot be certain that GLEAM J0917–0012 does lie in this redshift range as the ALMA data do not cover any CO lines. However, Figure 3 seems to be inconsistent with this solution except for a very obscured object ( $A_{\rm V}>4$
). Yet, the SED at longer wavelengths (Figure 4) does not suggest a large amount of dust (
$A_{\rm V}>4$
). Yet, the SED at longer wavelengths (Figure 4) does not suggest a large amount of dust ( $M_{\rm dust}<10^{7}\,{\rm M}_\odot$
). Moreover, there is an overlap with the HCO
$M_{\rm dust}<10^{7}\,{\rm M}_\odot$
). Moreover, there is an overlap with the HCO $+$
(2-1), HCN(2-1), and H
$+$
(2-1), HCN(2-1), and H $_2$
O lines in this redshift range, decreasing the possibility of this redshift range even further (which could be detected if reaching the mJy level). We also consider this solution unlikely.
$_2$
O lines in this redshift range, decreasing the possibility of this redshift range even further (which could be detected if reaching the mJy level). We also consider this solution unlikely.
At $z>1$
, the effects due to redshift on parameters such as size and the CO luminosity detection limit become nearly constant as a result of cosmological effects. Also, the
$z>1$
, the effects due to redshift on parameters such as size and the CO luminosity detection limit become nearly constant as a result of cosmological effects. Also, the $K_{\rm s}$
-band flux indicates a massive system (
$K_{\rm s}$
-band flux indicates a massive system ( $M_*>10^{11}\,{\rm M}_\odot$
) of
$M_*>10^{11}\,{\rm M}_\odot$
) of $<$
8 kpc in diameter. Given the radio luminosity, this source is definitely compatible with being a powerful radio galaxy (Figure 6). Even the radio to near-IR flux density ratio, albeit on the higher end of the distribution, is compatible (Figure 5). The main differences compared with previous
$<$
8 kpc in diameter. Given the radio luminosity, this source is definitely compatible with being a powerful radio galaxy (Figure 6). Even the radio to near-IR flux density ratio, albeit on the higher end of the distribution, is compatible (Figure 5). The main differences compared with previous $1<z<5$
samples of powerful radio galaxies (De Breuck et al. Reference De Breuck2010) are that GLEAM J0917–0012 is a relatively gas-poor system and is at the smaller end of the radio size distribution (
$1<z<5$
samples of powerful radio galaxies (De Breuck et al. Reference De Breuck2010) are that GLEAM J0917–0012 is a relatively gas-poor system and is at the smaller end of the radio size distribution ( $<0.8$
arcsec; unresolved at 100GHz). Note that there is the second gap for CO lines in the ALMA coverage at
$<0.8$
arcsec; unresolved at 100GHz). Note that there is the second gap for CO lines in the ALMA coverage at $1.8<z<2$
. However, the optical to near-IR SED does not suggest an object in this redshift range, for the same reasons elucidated in the previous paragraph.
$1.8<z<2$
. However, the optical to near-IR SED does not suggest an object in this redshift range, for the same reasons elucidated in the previous paragraph.
The $z>2$
range marks the beginning of the redshift range where the ALMA data provides us with at minimum one CO line. Note that for the
$z>2$
range marks the beginning of the redshift range where the ALMA data provides us with at minimum one CO line. Note that for the $2<z<3$
range, only a dust-obscured source (with
$2<z<3$
range, only a dust-obscured source (with $A_{\rm V}\sim3.5$
) is possible given the optical and near-IR photometry (see Figure 3). This would push GLEAM J0917–0012 into the infrared luminous galaxies regime. A significant amount of dust has two immediate corollaries: (i) by absorbing the UV–optical light, the dust would re-emit in the far-IR (into the Herschel coverage), but the ALMA continuum provides us with a tight constraint (see Figure 4), and (ii) a order of magnitude estimate of the gas mass from the dust mass assuming a conservative gas-to-dust mass ratio (
$A_{\rm V}\sim3.5$
) is possible given the optical and near-IR photometry (see Figure 3). This would push GLEAM J0917–0012 into the infrared luminous galaxies regime. A significant amount of dust has two immediate corollaries: (i) by absorbing the UV–optical light, the dust would re-emit in the far-IR (into the Herschel coverage), but the ALMA continuum provides us with a tight constraint (see Figure 4), and (ii) a order of magnitude estimate of the gas mass from the dust mass assuming a conservative gas-to-dust mass ratio ( $>100$
) indicates that the CO(2-1) line enters our detectable range (with
$>100$
) indicates that the CO(2-1) line enters our detectable range (with $\alpha_{\rm CO}=0.8$
and CO line ratios from Carilli & Walter Reference Carilli and Walter2013). Finally, the very specific case of a thin dust lane localised on the line of sight, which could reproduce the strong obscuration seen in optical/near-IR and the lack of large far-IR/submm contribution cannot be fully excluded with our present data but appears much less likely.
$\alpha_{\rm CO}=0.8$
and CO line ratios from Carilli & Walter Reference Carilli and Walter2013). Finally, the very specific case of a thin dust lane localised on the line of sight, which could reproduce the strong obscuration seen in optical/near-IR and the lack of large far-IR/submm contribution cannot be fully excluded with our present data but appears much less likely.
We now explore the $z>7$
range, which could explain the optical to near-IR SED due to the sharp drop of the Lyman continuum resulting from IGM absorption. One should note that some dust extinction could lower this redshift limit by producing a redder SED and still be consistent with the upper limits. However, it cannot be too red or it would be incompatible with the WISE data (see Section 4.1). A very high redshift also seems to be consistent with the extreme radio-to-near-IR flux density ratio, given the trend from Figure 5. Moreover, the extreme ratio and the faintness in
$z>7$
range, which could explain the optical to near-IR SED due to the sharp drop of the Lyman continuum resulting from IGM absorption. One should note that some dust extinction could lower this redshift limit by producing a redder SED and still be consistent with the upper limits. However, it cannot be too red or it would be incompatible with the WISE data (see Section 4.1). A very high redshift also seems to be consistent with the extreme radio-to-near-IR flux density ratio, given the trend from Figure 5. Moreover, the extreme ratio and the faintness in $K_s$
-band implies a very luminous radio source, similar to powerful radio galaxies in the
$K_s$
-band implies a very luminous radio source, similar to powerful radio galaxies in the $1<z<5$
range. The mass of this system would be on the higher end of the distribution for HzRGs, approaching the
$1<z<5$
range. The mass of this system would be on the higher end of the distribution for HzRGs, approaching the $10^{12}\,{\rm M}_\odot$
limit from (e.g. Rocca-Volmerange et al. Reference Rocca-Volmerange, Le Borgne, De Breuck, Fioc and Moy2004). A spiral scenario would only be able to reproduce the
$10^{12}\,{\rm M}_\odot$
limit from (e.g. Rocca-Volmerange et al. Reference Rocca-Volmerange, Le Borgne, De Breuck, Fioc and Moy2004). A spiral scenario would only be able to reproduce the $K_{\rm s}$
-band flux density with an unrealistic mass (
$K_{\rm s}$
-band flux density with an unrealistic mass ( $M_*>10^{14}\,{\rm M}_\odot$
; see dotted line in Figure 6(a)). A pure starburst could reproduce the
$M_*>10^{14}\,{\rm M}_\odot$
; see dotted line in Figure 6(a)). A pure starburst could reproduce the $K_{\rm s}$
-band flux density, at an equivalent lower mass due to the higher light-to-mass ratio of the younger and more massive stars. Yet once again, a massive starburst (of the order of
$K_{\rm s}$
-band flux density, at an equivalent lower mass due to the higher light-to-mass ratio of the younger and more massive stars. Yet once again, a massive starburst (of the order of $10^{10}\,{\rm M}_\odot$
) would involve a significant amount of dust and gas as well as a possible disturbed morphology (notably in rest-frame UV/observed-frame near-IR). While the near-IR size could remain consistent with a star-forming galaxy (see dark line in Figure 6(c) and the complete optical/near-IR SED in Figure 3, it suggests a more passively evolving galaxy, and thus a flatter template in the UV. As for the molecular gas content, GLEAM J0917–0012 would have a value
$10^{10}\,{\rm M}_\odot$
) would involve a significant amount of dust and gas as well as a possible disturbed morphology (notably in rest-frame UV/observed-frame near-IR). While the near-IR size could remain consistent with a star-forming galaxy (see dark line in Figure 6(c) and the complete optical/near-IR SED in Figure 3, it suggests a more passively evolving galaxy, and thus a flatter template in the UV. As for the molecular gas content, GLEAM J0917–0012 would have a value $<10^{9.5}$
K km s−1 pc2, which, while probably lower than one would expect, is consistent with the little amount of dust (if any) from the radio to far-IR SED (Figure 4). Also, it is important to keep in mind that at very high redshifts,
$<10^{9.5}$
K km s−1 pc2, which, while probably lower than one would expect, is consistent with the little amount of dust (if any) from the radio to far-IR SED (Figure 4). Also, it is important to keep in mind that at very high redshifts, $K_{\rm s}$
-band corresponds roughly to the UV regime, so any presence of dust would have a strong effect on the continuum.
$K_{\rm s}$
-band corresponds roughly to the UV regime, so any presence of dust would have a strong effect on the continuum.
6. CONCLUSION
We presented new ALMA and VLA follow-up data obtained in order to explore the putative $z=10.15$
nature of GLEAM J0917–0012 from D20. The deeper observations do not confirm the detection of the low signal-to-noise lines observed in the first ALMA spectrum, therefore ruling out this redshift solution. Adding multi-wavelength public imaging data from optical to infrared (HSC, WISE, and Herschel) and additional information from radio frequencies (IPS and polarisation), we are able to narrow the properties of GLEAM J0917–0012 significantly. In particular, the compactness both in near-IR and radio, the implied low amount of dust and molecular gas, the large radio luminosity and the extreme radio-to-near-IR flux density ratio, leads to a very peculiar source for any low-z solutions. We argue that a
$z=10.15$
nature of GLEAM J0917–0012 from D20. The deeper observations do not confirm the detection of the low signal-to-noise lines observed in the first ALMA spectrum, therefore ruling out this redshift solution. Adding multi-wavelength public imaging data from optical to infrared (HSC, WISE, and Herschel) and additional information from radio frequencies (IPS and polarisation), we are able to narrow the properties of GLEAM J0917–0012 significantly. In particular, the compactness both in near-IR and radio, the implied low amount of dust and molecular gas, the large radio luminosity and the extreme radio-to-near-IR flux density ratio, leads to a very peculiar source for any low-z solutions. We argue that a $z>7$
solution is more likely, with a possible, albeit much less likely, solution at
$z>7$
solution is more likely, with a possible, albeit much less likely, solution at $2<z<3$
in case of a peculiar dust geometry and extreme obscuration (
$2<z<3$
in case of a peculiar dust geometry and extreme obscuration ( $A_{\rm V}\sim3.5$
) to reproduce the optical/near-IR data, and the non detection of cold dust continuum. Our options are now near-IR spectroscopy and additional ALMA scans at a different frequency range to find the [CI] or [CII] lines.
$A_{\rm V}\sim3.5$
) to reproduce the optical/near-IR data, and the non detection of cold dust continuum. Our options are now near-IR spectroscopy and additional ALMA scans at a different frequency range to find the [CI] or [CII] lines.
Acknowledgements
The authors would like to thank Cathryn Trott for useful discussion on the IGM properties, Simon Driver and Luke Davies for their help to accessing the GAMA dataset, and Chris Riseley for providing the upper limit from the POGS survey. JA acknowledges financial support from the Science and Technology Foundation (FCT, Portugal) through research grants PTDC/FIS-AST/29245/2017, UIDB/04434/2020 and UIDP/04434/2020. We also thank the anonymous referee for the useful suggestions, helping in clarifying this manuscript.
The National Radio Astronomy Observatory is a facility of the National Science Foundation operated under cooperative agreement by Associated Universities, Inc.
This paper makes use of the following ALMA data: ADS/JAO.ALMA#2019.A.00023.S,2017.1.00719.S. ALMA is a partnership of ESO (representing its member states), NSF (USA) and NINS (Japan), together with NRC (Canada), MOST and ASIAA (Taiwan), and KASI (Republic of Korea), in cooperation with the Republic of Chile. The Joint ALMA Observatory is operated by ESO, AUI/NRAO and NAOJ.
This publication makes use of data products from the Wide-field Infrared Survey Explorer, which is a joint project of the University of California, Los Angeles, and the Jet Propulsion Laboratory/California Institute of Technology, funded by the National Aeronautics and Space Administration.
Based on data collected at the Subaru Telescope and retrieved from the HSC data archive system, which is operated by Subaru Telescope and Astronomy Data Center at National Astronomical Observatory of Japan.
The HSC collaboration includes the astronomical communities of Japan and Taiwan, and Princeton University. The HSC instrumentation and software were developed by the National Astronomical Observatory of Japan (NAOJ), the Kavli Institute for the Physics and Mathematics of the Universe (Kavli IPMU), the University of Tokyo, the High Energy Accelerator Research Organization (KEK), the Academia Sinica Institute for Astronomy and Astrophysics in Taiwan (ASIAA), and Princeton University. Funding was contributed by the FIRST program from Japanese Cabinet Office, the Ministry of Education, Culture, Sports, Science and Technology (MEXT), the Japan Society for the Promotion of Science (JSPS), Japan Science and Technology Agency (JST), the Toray Science Foundation, NAOJ, Kavli IPMU, KEK, ASIAA, and Princeton University.
This paper makes use of software developed for the Large Synoptic Survey Telescope. We thank the LSST Project for making their code available as free software at http://dm.lsst.org.
The Pan-STARRS1 Surveys (PS1) have been made possible through contributions of the Institute for Astronomy, the University of Hawaii, the Pan-STARRS Project Office, the Max-Planck Society and its participating institutes, the Max Planck Institute for Astronomy, Heidelberg and the Max Planck Institute for Extraterrestrial Physics, Garching, The Johns Hopkins University, Durham University, the University of Edinburgh, Queen’s University Belfast, the Harvard-Smithsonian Center for Astrophysics, the Las Cumbres Observatory Global Telescope Network Incorporated, the National Central University of Taiwan, the Space Telescope Science Institute, the National Aeronautics and Space Administration under Grant No. NNX08AR22G issued through the Planetary Science Division of the NASA Science Mission Directorate, the National Science Foundation under Grant No. AST-1238877, the University of Maryland, and Eotvos Lorand University (ELTE) and the Los Alamos National Laboratory.
Based in part on data collected at the Subaru Telescope and retrieved from the HSC data archive system, which is operated by Subaru Telescope and Astronomy Data Center at National Astronomical Observatory of Japan.
The Australia Telescope Compact Array is part of the Australia Telescope National Facility which is funded by the Australian Government for operation as a National Facility managed by CSIRO. We acknowledge the Gomeroi people as the traditional owners of the Observatory site.
This research has made use of the NASA/IPAC Extragalactic Database (NED), which is operated by the Jet Propulsion Laboratory, California Institute of Technology, under contract with the National Aeronautics and Space Administration.