


Healthcare workers (HCWs) are at risk for contracting viral respiratory infections while providing care to patients with these infectious diseases.Reference Jones and Xia1–Reference Sepkowitz and Eisenberg3 Environmental surfaces in the patient room frequently touched by both HCWs and patients have been contaminated with respiratory viruses,Reference Booth, Kournikakis and Bastien4, Reference D’Arcy, Cloutman-Green, Klein and Spratt5 suggesting surfaces could facilitate the transmission of respiratory viruses via the contact route. However, contact patterns have not been observed in conjunction with viral contamination. Respirable influenza virus particles have been detected in the rooms of patients infected with influenza virus and in the breathing zones of HCWs, but the factors that determine the magnitude or presence of these viruses, other than the presence of an infected patient, remain unclear.Reference Leung, Zhou and Chu6–Reference Bischoff, Swett, Leng and Peters8 Viral contamination, in conjunction with the behaviors of HCWs and patients, needs to be characterized because these factors influence the frequency, pathways, and magnitude of occupational exposure.
The primary objective of this study was to characterize the presence and magnitude of respiratory viruses in the air and on environmental surfaces associated with care for hospitalized patients having acute respiratory viral infections. The secondary objective was to explore the association between observed care activities and viral contamination in the environment. Relative to other studies of HCW exposure to respiratory viruses in healthcare settings, this work is unique because it focuses on the association between viral contamination of the environment and the behaviors of HCWs and patients.
Methods
Study setting and participants
The study was conducted over 2 years from March 2017 to June 2017 and from September 2017 to April 2018 in an acute-care hospital in Chicago, Illinois. Patient and HCW participant recruitment and consent have been described elsewhere.Reference Phan, Maita, Mortiz, Bleasdale and Jones9 This study was approved by the University of Illinois at Chicago Institutional Review Board (protocol no. 2015-0990). All patient participants had a positive test for a respiratory viral infection within 3 days prior to the day of observation. Researchers performed observations in patient rooms during a 3-hour period, typically from 8 a.m. to 12 p.m. Patient rooms were cleaned daily with Virex Plus (Diversey, Fort Mill, SC), a quartenary ammonium-chloride–based disinfectant. As a negative control, 5 clean, empty patient rooms in 4 different hospital units were selected at random and environmental surfaces were sampled for viruses on 2 different days (Supplemental Material 1 online).
Subsequent to observation, the medical records of participating patients were reviewed to extract data regarding signs, symptoms, and comorbidities. To get a general sense of illness severity, a disease severity score was tabulated by modifying a method used for community-acquired pneumonia.Reference Welte10
Air sampling
Viruses were measured in the air at a fixed location in the patient room, 1 m above the floor within 1.6 m of the patient’s head for the duration of the experiment, or until patients requested the sampler be turned off. Viruses were also measured in the breathing zone of HCWs during patient encounters: 1 personal sample was collected per experiment. All air sampling used the National Institute for Occupational Safety and Health (NIOSH) 2-stage cyclone air sampler, which separately collects particles in 3 size ranges:Reference Cao, Noti, Blachere, Lindsley and Beezhold11aerodynamic diameter da < 1 μm; 1 < da < 4 μm; and da > 4 μm (Supplemental Material 2 online).
Surface sampling
Environmental surfaces were sampled using premoistened Copan swabs (Copan Diagnostics, Murrieta, CA). At the beginning of the experiment, the following surfaces were sampled (if present in the patient room) to reflect baseline contamination: tray table, IV monitor, bed rail, computer keyboard, and computer mouse. At the end of the experiment, the surfaces sampled at baseline were sampled again and the following additional surfaces were sampled (if present): exterior bed control panel, IV pole hanger, telephone, call button/TV remote control, and isolation stethoscope. For surfaces sampled at the baseline and at the end of the experiment, different locations with the same area on that surface were swabbed (Supplemental Material 3 online). Computer stations were only sampled if they were permanently located in the patient room; mobile computer stations used by HCWs during the observations were not sampled. The surfaces were selected for sampling because previous work has identified them to be frequently touched surfaces by HCWs, and 3 of them (eg, computer keyboard and mouse and IV monitor) were only used by HCWs.Reference Jinadatha, Villamaria and Coppin12, Reference Cheng, Chau and Lee13 All surfaces sampled were swabbed horizontally and vertically following a protocol (Supplemental Material 3 online).
Sample processing and analysis
Sample processing and analysis methodology is described in detail in Supplemental Material 4 (online). Briefly, after extraction of genetic material from the sampling media, preamplification and quantitative polymerase chain reaction (qPCR) were performed using assays for targeted viruses on triplicates of each sample to obtain the cycle threshold values. A sample was considered positive when, having undergone preamplification, a qPCR Ct value of ≤35 was obtained for at least 2 of the triplicate results. For samples determined to not be positive, the value Ct = 40 was substituted as the limit of detection. Quantitation of each sample was based on a linear regression derived from the 5-point preamplified standard curve for each target, with correction for dilution, preamplification, volume of RNA extraction eluate, volume of reverse transcription, and double-stranded nature of the DNA standard. Gene copies were equated with the gene copy per square centimeter sampled and gene copies per cubic meter of air sampled.
Statistical methods
Data management for this study was described elsewhere.Reference Phan, Maita and Mortiz14All data analysis was performed with R (The R Project for Statistical Computing, Vienna, Austria). Preliminary analysis indicated that virus concentrations (gene copy per cm2 and per m3) were approximately log-normally distributed. Left-censored values were imputed as follows. Log-normal distribution parameters were estimated using the cenmle function of the ‘NADA’ library,Reference Lee15, Reference Helsel16 and values were then selected from the fitted lognormal distribution at randomly selected percentiles below the percentage of censored values.Reference Lubin, Colt and Camann17 Because the limit of detection varied between samples, randomly selected values were verified to be below the limit of detection, and a value was selected again if it was greater than the limit of detection.
Differences in virus concentrations among ≥3 groups were tested with the Kruskal–Wallis (KW) test, followed by pairwise Wilcoxon (W) tests with P values adjusted using the Bonferroni method, while differences between 2 groups were tested with the Mann-Whitney (MW) test. Differences in proportions among groups were tested with the χ2 test where expected values were determined using the overall mean proportion, followed by pairwise Wilcoxon test for pairwise comparisons. Spearman’s method was used for correlation testing. The χ2 test was used to test for the associations between the presence of virus and categorical predictor variables.
Results
Participant characteristics
We observed healthcare activities for 52 patients with viral respiratory infections: 30 patients were in droplet and contact isolation, 21 in droplet isolation, and 1 was in contact isolation. In total, 11 patients were in intensive care units (ICUs); 18 were in the clinical decision unit; 9 were in specialty units; and 14 were in other general medical surgical units or non-ICUs.Reference Phan, Maita, Mortiz, Bleasdale and Jones9 Patients were grouped by infection: (1) influenza, including influenza A (n = 23) and influenza B (n = 8); (2) rhinovirus (n = 15); and (3) other (1 parainfluenza, 1 coronavirus, 3 respiratory syncytial virus, and 1 adenovirus). This grouping was selected because the viruses have characteristic environmental persistence.Reference Kramer, Schwebke and Kampf18 Because some patients had coinfections, patients with the target respiratory infections could be in a variety of isolation categories. All participants with influenza or rhinovirus infections were in droplet and contact or droplet isolation. Adenovirus samples were excluded from sample processing due to the complexity of multiple virus strains.
Moreover, 3 patient participants were on ventilators (2 with rhinovirus and 1 with parainfluenza). In general, patients were not severely ill, with 4 (8%) and 8 (15%) of participants having high and moderate disease severity, respectively. Participants with high disease severity were immunocompromised, and 3 of the 4 had malignancies. Overall, 35% of patient participants were immunocompromised. Cough was recorded in the charts of 50 (77%) of patient participants.
Airborne virus
Stationary air samplers operated for 55–197 minutes, with a mean duration of 161 minutes. Of the 47 stationary air samples, 43% were positive for virus in any of the 3 size fractions, and the mean virus concentration was 7,300 virus copies/m3 (Table 1). Virus was present in all 3 size fractions, though virus was present in different size-fractions in different samples. Differences in the proportion of samples positive for virus nor in the virus concentrations among the 3 size fractions were not statistically significant (χ2P = .17 and Kruskal Wallace [KW] P = .47).
Virus Measured in the Air at a Stationary Location and in the Personal Breathing Zone of Healthcare Workers in the Rooms of Patients With Acute Respiratory Infection

Note. da, aerodynamic diameter. Bold indicates statistical significance.
a χ2 test was used to compare differences in proportions among groups.
b Kruskal-Wallis test was used to compare virus concentration differences among groups.
c No proportion comparison test was conducted as all samples of stage 3 were negative across pathogen groups.
When stationary air samples were considered by pathogen group, 11 samples (38%) from the room of a patient with influenza were positive for influenza, 6 samples (43%) were positive for rhinovirus from the rooms of patients with rhinovirus, and 3 samples (75%) were positive from the rooms of patients with other viruses (Table 1). Neither the proportion of positive samples nor the virus concentrations differed among the 3 virus groups (χ2P = .37; KW P = .43). When considered by size fraction, the only difference in the proportion of positive samples was observed in the largest size fraction (da > 4 µm; χ2P = .01).
Personal air samplers were operated for 2–41 minutes, with a mean duration of 13 minutes. Of the 23 personal air samples, 22% were positive for virus and had mean concentration of 3 × 10⁶copies/m3 (Table 1). Virus was detected only in the 2 smaller size fractions (da < 1 µm, and 1 < da< 4 µm), but inference about the size distribution of virus in the breathing zone is limited by the small sample size. Virus was recovered from 1–2 samples for each virus group. Virus concentrations of the positive personal air samples ranged from 1.7 × 10⁴ to 6.8 × 10⁷ copies/m3 and were more variable than concentrations measured by the stationary air sampler.
Personal air samples were more likely to be positive for virus when the stationary air sample was positive than when that stationary air sample was negative, but the odds ratio was not statistically significant (OR, 2.5; 95% CI, 0.3–23.5) (Table 2). Also, the virus concentrations in stationary air samples were not significantly correlated with those in personal air samples (ρ = −0.13; P = .56). Stationary air samples were more likely to be positive when >5 HCW encounters occurred during the observation period than when ≤5 encounters occurred (OR, 5.3; 95% CI, 1.2–37.8), but this factor could not be tested for personal air samples (Table 2). Cough reported on the day of observation was not associated with the stationary or personal viral concentrations (Table 2). Additional results are in Supplementary Material 5 online.
Possible Determinants of the Presence of Virus in Air and Surfaces
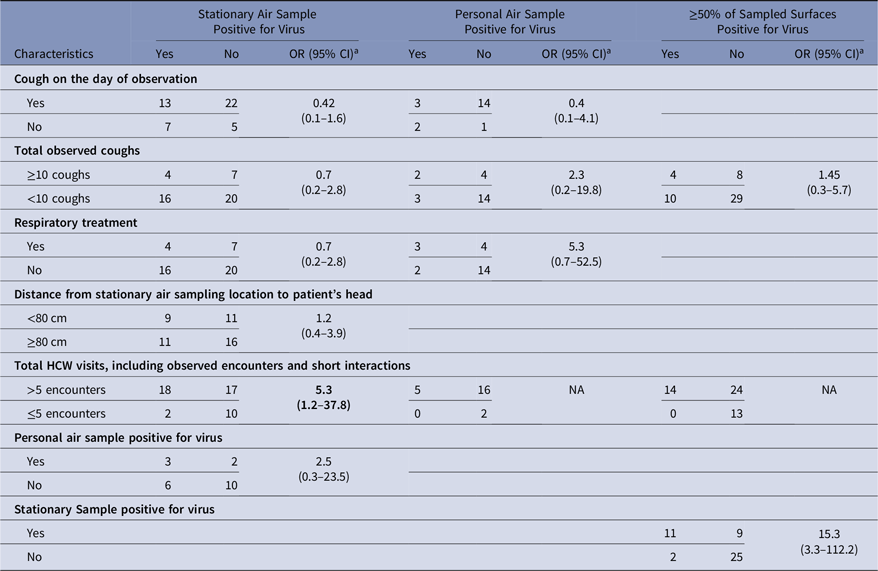
Note. OR, odd ratio; CI confidence interval; HCW, healthcare worker.
a The χ2 test was used to test for the significance of the odds ratio
Surface contamination
Virus presence and concentrations were measured on surfaces at the beginning of the experiment (baseline) and after the experiment (Tables 3 and 4). At baseline, virus was present on the computer keyboard (67%) and bedrail (52%) in most experiments. The proportion of baseline surface samples positive for virus and the distribution of virus concentrations were statistically significantly different among the surfaces sampled (χ2P = .00 and KW P = .001); but the proportion of positive surface samples and in the distribution of virus concentrations at baseline did not differ among the virus groups (Table 3). Every surface swabbed at the end of the experiments tested positive for virus at least once for each virus group, and >50% of the sampled surfaces were positive for virus in 14 of 51 (27%) of the experiments (Table 4). Virus was present on the computer keyboard (68%), the call button (57%), and the computer mouse (50%) in most experiments, and the proportions of positive samples differed significantly among surfaces at the end of the experiments for all viruses (χ2P < .01), influenza (χ2P < .01), and rhinovirus (χ2P = .03). As at baseline, the virus concentrations were statistically significantly different among the surfaces (KW P < .01), with very low virus concentrations measured on the IV monitor relative to the other surfaces, particularly for rhinovirus (Table 4).
Virus on Environmental Surfaces Measured in the Room of Patients with Acute Respiratory Infection at Baseline
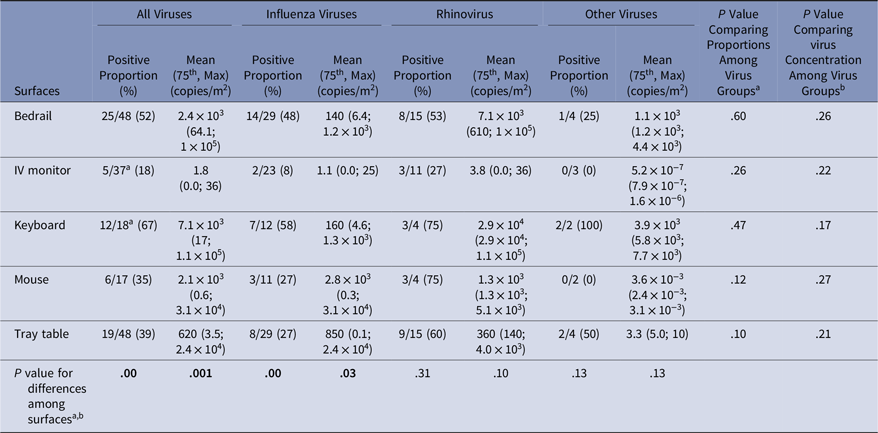
Note. Bold indicates statistical significance.
a χ2 test was used to compare differences in proportions among groups;
b Kruskal-Wallis test was used to compare virus concentration differences among groups;
Virus on Environmental Surfaces Measured in the Room of Patients with Acute Respiratory Infection After the Observation Period
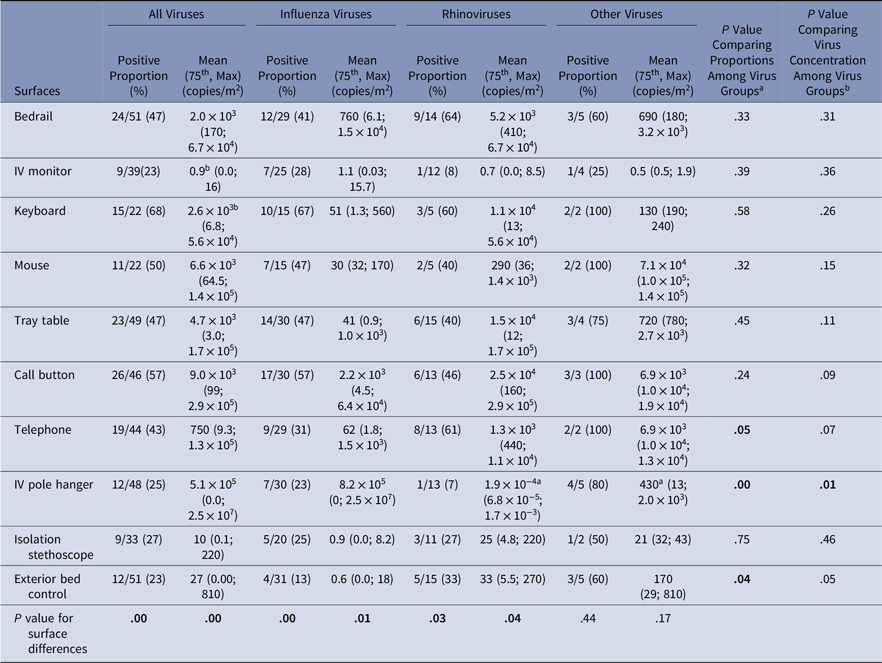
Note. Bold indicates statistical significance.
a Significant pairwise comparison at the significant level of α = 0.05/3 = 0.017;
b Significant pairwise comparison at the significant level of α = 0.05/45 = 0.001
Contacts with surfaces may deposit or remove virus from the surface, and we found moderate positive correlations (0.3 ≤ ρ ≤ 0.6) between the numbers of contacts by HCWs and virus concentrations for some surfaces (Table 5). Patient contacts were not associated with virus concentrations (Supplemental Material 6 online).
Correlation Between Virus Concentration on Surfaces After the Observation Period and Contact Frequency of Healthcare Workers During Observed Care Activities

Note. Bold indicates statistical significance.
The odds that ≥50% of surfaces sampled at the end of an experiment were positive for virus was significantly higher when the stationary air sample was positive for virus (OR, 15.3; 95% CI, 3.3–112.2) and was higher, but not significantly, when ≥ 10 coughs were observed (OR, 1.45; 95% CI, 0.3–5.7) (Table 2). In 53%–76% of the experiments, depending upon the surface, surfaces sampled at the beginning and end of the experiment were both positive or both negative, and the proportion changing from negative to positive was similar to the proportion changing from positive to negative (Table 6). Virus concentrations measured at baseline and at the end of the experiment were only statistically positively correlated on the computer keyboard (ρ = 0.99; P < .05) (Supplemental Material 7 online).
Change in Virus Presence Status From Baseline to After the Experiment Observation Period

a Virus was present-present or absent-absent
Of the 42 surface samples collected across 5 clean, empty patient rooms, only 1 sample was found positive for influenza A, influenza B, or rhinovirus: a telephone swab sample for influenza A. Thus, the virus was not generally present in the hospital environment absent an infected patient.
Discussion
We found respiratory viruses in air in the room near the patient’s head in 43% of the experiments, and in 22% of the personal air samples (Table 1). The relatively low detection of virus in the personal air samples is likely due, at least in part, to the short duration of sampling relative to the stationary air samples (10 minutes versus 3 hours). It is typical that virus is not detected in all air samples collected near patients with viral respiratory infections. Leung et al,Reference Leung, Zhou and Chu6 for example, placed the NIOSH 2-stage cyclone aerosol sampler 1.0 or 1.5 m from the patient in a hospital ward; they detected virus in 50% of study periods with patients having laboratory-confirmed influenza. Using the same device, Lindsley et alReference Lindsley, Blachere and Davis19 reported that 57% of personal samplers worn by HCWs for 4–5 hours in an urgent care clinic and 50% of stationary samplers were positive for influenza or RSV during influenza season. These data affirm that HCWs may inhale respiratory viruses while in the room of infected patients and that virus may disperse through the environment to deposit on surfaces.
Cough is thought to be a primary emission mechanism for respiratory virusesReference Hall20 and has been associated with virus concentration measured by stationary air samplers when patients had an increased nasopharyngeal viral load.Reference Bischoff, Swett, Leng and Peters8 In this study, cough reported on the day of observation was not associated with virus concentrations measured in stationary or personal air samples (Table 2). However, this finding may be an artifact of the study design because coughs were only recorded during observation periods, which are a subset of the 3-hour sampling duration. Future work could explore use of the automated sound-based cough monitor to measure cough with less disruption of patient privacy.Reference Birring, Fleming, Matos, Raj, Evans and Pavord21
Aerosol-generating procedures (AGPs) are medical procedures thought to generate respiratory aerosols and that have been associated with increased risk of occupationally acquired infection among healthcare personnel,Reference Siegel, Reinhart and Jackson22 but some have argued that infectious aerosols are generated by routine care.Reference Cummings, Martin and Lindsley23 Respiratory treatment is thought to be an AGP, and when performed with delivery of nebulized medication, respiratory treatment has been found to generate aerosols.Reference O’Neil, Li and Leavey24 Although the sample numbers were limited, in this study respiratory treatment was not associated with increased odds of virus detection in stationary air samples (OR, 0.7; 95% CI, 0.2–2.8). However, >5 visits by HCWs during the 3-hour observation period was associated with virus detection in stationary air samples (OR, 5.3; 95% CI, 1.2–37.8), though most observed care activities were physical exam and other routine care activities.Reference Phan, Maita, Mortiz, Bleasdale and Jones9 Numerous HCW visits may indicate that the patient is relatively ill and, thus, shedding a lot of virus in the environment, but the association of numerous HCW visits with airborne virus could also reflect the fact that routine care activities introduce virus into the air.
Influenza virus, rhinovirus, and other viruses were detected on all of the environmental surfaces sampled (Tables 3 and 5) at frequencies similar to those reported in the rooms of patients with Middle East respiratory syndrome.Reference Bin, Heo and Song25 Surfaces contacted primarily by HCWs, rather than patients, may become contaminated with viruses through deposition from air or transfer of virus on the hands or gloves of HCW or other contacts, which is consistent with the association between positive stationary air samples and the detection of virus on most surfaces (OR, 15.3; 95% CI, 3.3–112.2). Consistent with the role of HCW contacts, we found positive correlations between virus concentration on some surfaces frequently touched by HCWs and the number of contacts, including the IV pole hanger, telephone, and exterior bed control (Table 6). We did not find any statistically significant associations between patient contacts and virus concentrations on surfaces frequently contacted by patients, but this could be due to the fact that patient contacts were only observed during HCW encounters, not for the 3-hour duration of the observation. This study is the first in which the association between contact behaviors of HCWs, patients, and the magnitude of viral contamination on environmental surfaces in the patient rooms have been explored.
This study has several limitations. Our analytical methods quantified the amount of virus target genes and did not assay viable viruses, and the average ratio between virus target genes and viable viruses for the assays used is unknown, limiting inference from these data for infection risk. Also, the efficiency of the sampling devices has not been characterized and is expected to be less than unity.Reference Park, Lee, Treffiletti, Hrsak, Shugart and Vinjé26 Thus, virus may be present more often and at higher concentrations than reported in this study. Furthermore, we only observed patient activities during HCW encounters, which likely resulted in an underestimation of the numbers of coughs and surface contacts. We tested only for crude associations, rather than using regression modeling, owing in part due to limited sample sizes, which means that we may have missed some complex relationship among predictor variables that influence virus contamination in the environment. Finally, we did not follow HCWs for outcomes related to virus exposure; therefore, the risk of respiratory infection among the HCWs can only be estimated.
The data obtained in this study suggest that influenza, rhinovirus, and other viruses disperse similarly into the air and onto surfaces of the patient room and that HCWs encounter these viruses in the air and on surfaces during patient care activities.
Supplementary material
To view supplementary material for this article, please visit https://doi.org/10.1017/ice.2019.299
Acknowledgments
We thank Charissa Fritzen-Pedicini, Rachel Weber, and Maryshe Zietsman for their helpful assistance with participant recruitment and data collection. We thank Dr. Bill Lindsley from the National Institute for Occupational Safety and Health for loaning us the NIOSH 2-stage air samplers used in this study. Library preparation and sequencing were performed at the University of Illinois at Chicago Sequencing Core (UICSC). Also, we thank Dr Stefan Green of the UICSC facility for his advice and support. Data will be available from the corresponding author or from UIC INDIGO (hhtps://indigo.uic.edu/) within 6 months of publication. Any opinions, findings, and conclusions expressed in this material are those of the authors and do not necessarily reflect the views for the Centers for Disease Control and Prevention.
Financial support
This work was supported by the Centers for Disease Control and Prevention (cooperative agreement no. 1U54CK000445-01).
Conflicts of interest
All authors report no conflicts of interest relevant to this article.


