

Introduction
Rumen serves as a central organ for forage digestion, absorption, and metabolism in ruminants, acting as a dynamic and complex microsystem predominantly comprising bacteria, protozoa, and fungi (Knoell et al., Reference Knoell, Anderson and Pesta2016; Lv et al., Reference Lv, Mao and Zhu2016). Within this ecosystem, metabolically active bacteria play a pivotal role by converting nonprotein nitrogen into protein, digesting fiber, and synthesizing essential vitamins, while utilizing the resulting metabolites for their growth and proliferation (Pang et al., Reference Pang, Chai and Yang2022). Notably, our previous research revealed that the meat quality of Tan sheep grazing on artificial pastures was improved, which was closely linked to the composition of the rumen microbiota (Wang et al., Reference Wang, Wang and Zuo2021). However, the specific mechanisms underlying this connection remain poorly understood.
Diet plays a crucial role in shaping ruminal microbial diversity and activity (Russell and Rychlik, Reference Russell and Rychlik2001). High-concentrate diets have become a common strategy to meet the increasing energy demands and improve growth performance in ruminants (Chen et al., Reference Chen, Wang and Huasai2021; Wang et al., Reference Wang, Zhang and Zhou2023). However, such diets often disrupt the rumen microbial community, leading to subacute ruminal acidosis, which impairs rumen function and microbial interactions (Krause et al., Reference Krause, Nagaraja and Wright2013; Wang et al., Reference Wang, Wang and Wang2020). Additionally, rumen microbiota are considered integral to sustainable livestock production due to their ability to reduce reliance on human-edible feeds (Eisler et al., Reference Eisler, Lee and Tarlton2014). Despite the growing importance of rumen microbial ecology, the impact of high-concentrate diets on keystone microorganisms and their specific roles in metabolic regulation remain insufficiently understood.
Globally, fat-tailed sheep are a predominant type, and dietary strategies significantly affect their carcass traits and meat quality (Prache et al., Reference Prache, Schreurs and Guillier2022; Wei et al., Reference Wei, Wang and Liu2015). Although high-concentrate diets improve lamb growth performance, they are also associated with excessive fat deposition, liver injure, and metabolic disturbances (Ettoumia et al., Reference Ettoumia, Vernet and Ortigues-Marty2022; Wang et al., Reference Wang, Zhang and Zhou2023). As the central organ for nutrient metabolism, the liver regulates carbohydrate and lipid fluxes throughout the body and orchestrates the synthesis, activation, and inactivation of hormones and mediators, exerting systemic metabolic control (Jungermann and Keitzmann, Reference Jungermann and Keitzmann1996). Emerging evidence highlights the critical role of gut microbiota and their derived signals in regulating systemic glucose metabolism via the gut-liver-adipose axis (Castells-Nobau et al., Reference Castells-Nobau, Moreno-Navarrete and de la Vega-correa2024). Our previous studies demonstrated that feeding strategies can modulate fatty acid metabolism by altering liver lipid metabolism-related genes, mediated by rumen microbiota and their metabolites (Li et al., Reference Li, Zhao and Jian2023). However, comprehensive studies on the effects of high-concentrate diets on rumen keystone microbial ecology and their specific impact on host liver and adipose tissue metabolism remain limited.
We hypothesize that specific keystone microbiota in the rumen serve as critical mediators of transcriptomic regulation between the liver and tail adipose tissue. The primary objectives of this study are to identify and characterize keystone functional bacteria in the rumen through comprehensive comparative analyses, focusing on microbial taxa influenced by high-concentrate diets, and to elucidate the underlying mechanisms linking liver and tail adipose tissue in sheep. By achieving these objectives, this study aims to advance the understanding of the rumen-liver-tail adipose axis, emphasizing the interplay between diet, rumen microbial communities, and systemic fat metabolism, and offering practical insights into strategies for sustainable sheep production.
Materials and methods
Experimental design and sampling
This study was approved by the Animal Care Committee of China Agriculture University (Beijing, China; approval nos. AW30901202-1-1 and AW30129102-1-1). A total of 60 Tan lambs (Ovis aries), aged 75 days (±3 days) with an initial body weight (BW) of 15.3 kg (±1.92 SD), were included in Trial 1. The lambs were randomly assigned to one of four diet groups (15 lambs per group): (1) 20% corn silage-based diet (CS; dry matter (DM) basis), (2) 20% alfalfa silage-based diet (AS; DM basis), (3) 20% mulberry leaf silage-based diet (MS; DM basis), and (4) high-concentrate (84%) diet without silage (HE). In Trial 2, 30 Tan lambs (approximately 6 months old; initial BW of 25.1 kg ± 1.23 SD) were randomly allocated to one of two groups: (1) low-concentrate diet (LC; forage:concentrate ratio of 45:55 on a DM basis, n = 15) or (2) high-concentrate diet (HC; forage:concentrate ratio of 20:80 on a DM basis, n = 15). Ingredients and nutrient compositions for the diets from these two trials are shown in Supplementary Material, Table S1. Both trials involve the same dietary protein level but differ in metabolic energy. The diet was provided as a total mixed ration. Daily feed intake was determined by weighing feed deliveries and remaining. Lambs were fed twice daily at 09:00 and 17:00, with ad libitum access to feed and water throughout the experiment. Trial 1 lasted 80 days, including a 20-day adaptation period, while Trial 2 spanned 84 days, with a 14-day adaptation and a 70-day feeding phase. At the end of each experiment, six lambs per group were slaughtered to collect samples (rumen fluid and rumen content from both trials, liver and tail adipose tissue samples from Trial 2). The samples were immediately stored in liquid nitrogen for transcriptome and microbiome analyses.
Blood parameters analysis
Blood samples were collected from the jugular vein 6 hours after morning feeding on the day before slaughter and centrifuged at 3000 × g for 10 minutes at 4℃ to separate serum. Serum levels of alanine transaminase (AST, 30812010433), aspartate aminotransferase (ASP, 30812010233), blood urea nitrogen (BUN, 30812020133), uric acid (UA, 30812040133), alkaline phosphatase (ALP, 30812010333), total cholesterol (T-CHO, 30812070933), high-density lipoprotein cholesterol (HDL-C, 30812070433), triglycerides (TG, 30812071033), low-density lipoprotein cholesterol (LDL-C, 30812070633), glucose (GLU, 30812020533), total bile acids (TBA, 30812010933), total bilirubin (TB, 30812011033) were measured using commercial assay kits (Shanghai Kehua Bio-engineering Co., Ltd., Shanghai, China), and the levels of superoxide dismutase (SOD, A001-2), glutathione peroxidase (GSH-Px, A005), malondialdehyde (MDA, A003-1) were measured using commercial assay kits (Nanjing Jiancheng Bio-Engineering Co., Ltd., Nanjing, China) according to the manufacturer’s instructions. The levels of immunoglobulin G (IgG, JH-00013), immunoglobulin A (IgA, JH-00014), immunoglobulin M (IgM, JH-00015), interleukin-1β (IL-1β, JH-00127), interleukin-10 (IL-10, JH-00133), tumor necrosis factor-α (TNF-α, JH-00140), and transforming growth factor-β (TGF-β, JH-00183) were analyzed using commercial ELISA kits (Beijing JinHaiKeYu Biological Technology Development Co., Ltd., Beijing, China) following the manufacturer’s instructions. During the experiment, the intra-assay coefficient of variation (CV) was ≤5%, and the inter-assay CV was ≤10%. All blood parameter analyses were carried out in triplicate.
Rumen fermentation characteristics analysis
Rumen liquid was then stored in liquid nitrogen for later analysis. The volatile fatty acids (VFAs) concentrations were determined using gas chromatography (Trace 1300; Thermo Fisher Scientific Co., Ltd., Shanghai, China). The pH of the rumen fluid was promptly measured using a German Testo 205 pH meter, which was calibrated prior to use with automatic temperature compensation. Rumen ammonia-N levels were determined using the phenol-sodium hypochlorite colorimetric method (Broderick and Kang, Reference Broderick and Kang1980). In brief, ruminal ammonia reacts with alkaline hypochlorite and phenol catalyzed by sodium nitroprusside to form indophenol, and absorbance was measured at 650 nm using visible spectrophotometry.
DNA sequencing, data processing, and analysis
Microbial DNA was extracted from rumen content samples using HiPure Stool DNA kits (Magen, Guangzhou, China) according to the manufacturer’s instructions. The 16S rRNA were amplified by PCR, region V3-V4 with primers: 341 F: CCTACGGGNGGCWGCAG; 806 R: GGACTACHVGGGTATCTAAT, meanwhile region V4-V5 with primers: 515 F: GTGCCAGCMGCCGCGGTAA; 907 R: CCGTCAATTCCTTTGAGTTT. The ribosomal RNA gene amplification was carried out with an initial denaturation at 94°C for 2 min, followed by 30 cycles of denaturation at 98°C for 10 s, annealing at 62°C for 30 s, and extension at 68°C for 30 s, ending with a final extension at 68°C for 5 min. The PCR amplicons were extracted from 2% agarose gels and purified by the AxyPrep DNA Gel Extraction Kit (Axygen Biosciences, Union City, CA, U.S.), then quantified with the ABI StepOnePlus Real-Time PCR System (Life Technologies, Foster City, USA). Purified amplicons were sequenced on an Illumina Novaseq 6000 platform (PE250). Representative sequences were classified into organisms using a naive Bayesian model by RDP classifier (version 2.2), based on SILVA database (version 138) (Pruesse et al., Reference Pruesse, Quast and Knittel2007). Statistical analyses, including the Alpha diversity indices (Chao and Shannon) and Principal coordinates analysis (PCoA) using Bray-Curtis dissimilarity, were performed using the “Vegan” package in the R. Differential bacterial communities were analyzed using the Wilcoxon rank test in the “Vegan” package.
Co-occurrence network analysis and keystone taxa
A co-occurrence network of rumen microbiota was constructed based on ASV relative abundances using the “Hmisc” and “igraph” packages in R (version 4.3.2). ASVs present in less than 50% of samples or with total abundances below 0.1% were excluded. Statistically significant associations (Spearman’s correlation coefficient |r| > 0.6, P < 0.05) were identified, with P-values adjusted using the Benjamini-Hochberg method (Berry and Widder Reference Berry and Widder2014). Network visualization and topological parameter calculations were performed using Gephi (v0.10.1) (Deng et al., Reference Deng, Jiang and Yang2012). Keystone taxa were identified based on within-module (Zi) and among-module (Pi) connectivity (Guimera and Nunes Amaral, Reference Guimera and Nunes Amaral2005). According to different Zi and Pi thresholds, different microbial genera were classified into four categories: peripherals (Zi ≤ 2.5 and 0 ≤ Pi ≤ 0.60), connectors (Zi ≤ 2.5 and Pi > 0.60), module hubs (Zi > 2.5 and Pi ≤ 0.60), and network hubs (Zi > 2.5 and Pi > 0.60) (Fan et al., Reference Fan, Weisenhorn and Gilbert2018). Keystone taxa were defined as genera classified as connectors, module hubs, or network hubs.
Transcriptome sequencing in liver tissue and tail adipose tissue
Total RNA was extracted from liver and tail adipose tissues using TRIzol reagent (Invitrogen, California, USA). RNA quality was assessed on an Agilent 2100 Bioanalyzer (Agilent Technologies, Palo Alto, California, USA), and eukaryotic mRNA was enriched by Oligo(dT) beads. Subsequently, cDNA was synthesized via reverse transcription with random primers, followed by cDNA fragments purification with the QiaQuick PCR Extraction Kit (Qiagen, Venlo, the Netherlands), end repaired, and poly(A) added. Finally, cDNA library sequencing was performed using the Illumina HiSeq2500 system.
Raw reads from the sequencer were further filtered using FASTP (Chen et al., Reference Chen, Zhou and Chen2018) to remove low-quality data. Short-read aligner Bowtie2 (Langmead and Salzberg, Reference Langmead and Salzberg2012) was used to map the reads to the ribosomal RNA database. The remaining clean reads were then used for assembly and gene abundance calculation. A reference genome index was established, and clean paired-end reads were mapped to the Ovis aries reference genome (Oar_rambouillet_v1.0) using HISAT2.2.4 (Kim et al., Reference Kim, Langmead and Salzberg2015). Gene expression abundance and variation were quantified by calculating fragments per kilobase of transcript per million mapped reads (FPKM) for each transcriptional region using StringTie software. DESeq2 software was used to identify differentially expressed genes (DEGs) between the LC and HC groups, with genes considered significantly differentially expressed if the false discovery rate (FDR) < 0.05 and absolute log2 fold change (|log2 FC|) ≥ 2. Furthermore, KEGG enrichment analysis (based on DEGs) and Gene Set Enrichment Analysis (GSEA) were conducted to explore key signaling pathways. The significance thresholds were: absolute normalized enrichment score (|NES|) > 1, P < 0.05, and FDR < 0.25.
WGCNA for key pathways identification in tail fat deposition
Weighted gene co-expression network analysis (WGCNA) was conducted to reveal the key pathways affecting tail fat deposition (Langfelder and Horvath, Reference Langfelder and Horvath2008). All protein-coding genes (14,946, FPKM > 0.5) expressed in the tail adipose tissue of the experimental sheep were used in the WGCNA. With the “WGCNA” package, we generated a total of 19 modules with the following parameters: minimum module size of 20 and merged cutoff of 85%. Pearson correlation coefficients were then calculated between each gene module and tail traits. Gene modules with |r| > 0.6 and P < 0.05 were considered statistically correlated with the target traits. Significant pathways in these modules that overlapped with KEGG analysis were used for subsequent analysis.
Statistical analyses
Sample size for this study was calculated using the “resource equation method.” (Arifin and Zahiruddin, Reference Arifin and Zahiruddin2017). Data were analyzed using SPSS 21.0 (IBM, USA) and GraphPad Prism version 9.5 (GraphPad Software, Inc., USA). First, the normality and homoscedasticity of hematological parameters and rumen fermentation characteristics were assessed using Shapiro-Wilk and Levene’s tests, respectively. Differences between each groups mean were determined using Student’s t-test or Mann-Whitney U test. Since the relative abundances of microbial communities were not normally distributed, the Wilcoxon rank-sum test was used to analyze the differential abundances between each group. Meanwhile, the microbial taxonomy was also compared using Analysis of Compositions of Microbiomes with Bias Correction (ANCOM-BC) (Lin and Peddada, Reference Lin and Peddada2020) (FDR < 0.05) to further find the crucial rumen microbiota. Moreover, due to the high diversity and discrete distribution of omics data, we employed Spearman correlation analysis in this study to explore the relationships among the transcriptome, microbiome, and host phenotypes. A correlation coefficient |r| > 0.6 and P < 0.05 were used to identify statistically significant associations. The distance correlation between the key rumen bacteria matrix and the key DGEs matrix was evaluated using the Mantel test (performed with the “vegan” package in the R project (4.4.1). The means ± standard error of the mean (SEM) was used to present the results. The statistical differences and trends were regarded at P < 0.05 and 0.05 ≤ P < 0.1, respectively. Referring to our previous research (Zhang et al., Reference Zhang, Jiang and Yu2024a), mediation analysis was conducted using the “mediation” package with consistent parameter settings (boot = “TRUE,” boot.ci.type = “perc,” conf.level = 0.95, sims = 1000) in the R project (version 4.4.1). The presentation of mediation results followed the AGReMA (Guideline for Reporting Mediation Analyses) statement (Lee et al., Reference Lee, Cashin and Lamb2021).
Results
Ruminal microbial communities, keystone microbes, and microbial interactions (Trial 1)
To characterize ruminal microbial communities, we analysed the V3-V4 and V4-V5 regions of 16S rRNA in Trial 1. Alpha diversity (Chao1 and Shannon indices) revealed significant differences between the HE (high-concentrate) and AS (alfalfa silage) groups in the V3-V4 region, while differences in the V4-V5 region were not statistically different (Supplementary Material, Fig. S1a–d). PCoA demonstrated clear distinctions in microbial community structures between the HE and AS groups in both regions (Supplementary Material, Fig. S1e and f). At the phylum level, Bacteroidetes, Firmicutes, and Proteobacteria dominated the microbial communities (Supplementary Material, Fig. S2a, Table S2). Genus-level analysis identified 308 taxa, with Prevotella_1, Selenomonas_1, and Rikenellaceae_RC9_gut being the most abundant (Supplementary Material, Fig. S2b). Similar trends were observed in the V4-V5 region (Supplementary Material, Fig. S2c and d, Table S3).
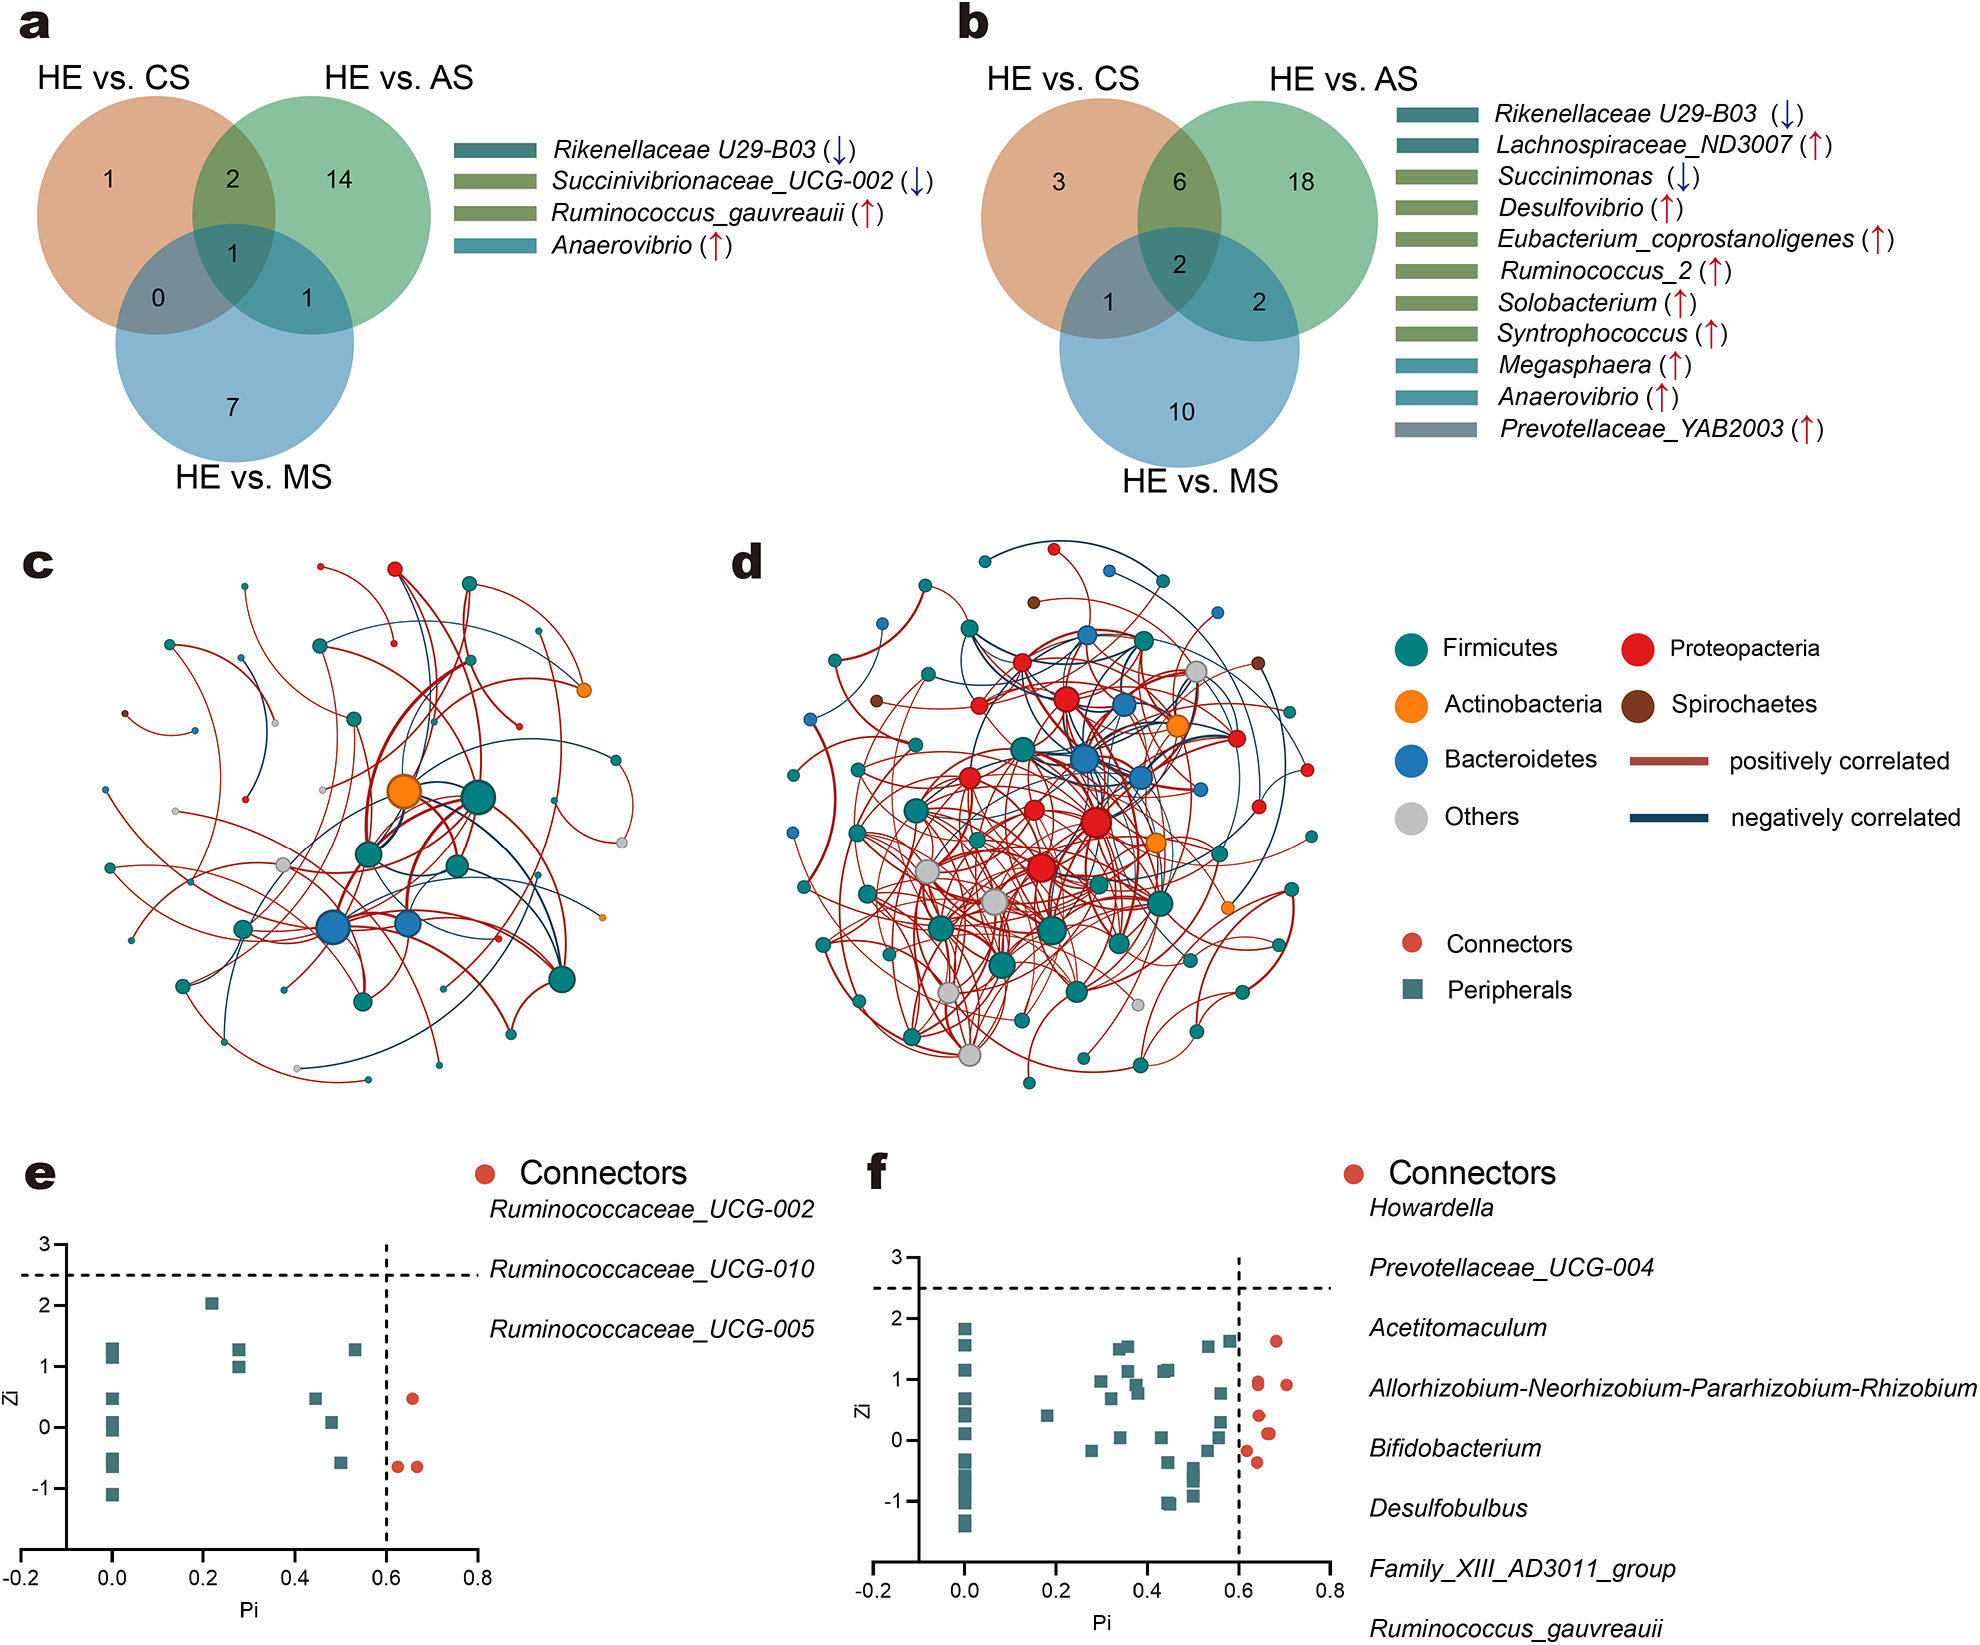
Dietary comparisons revealed significant differences in bacterial genera between the HE group and silage groups (CS, AS, MS). For the V3-V4 region, 4, 18, and 9 genera were significantly different in HE vs. CS, HE vs. AS, and HE vs. MS comparisons, respectively (Fig. 1a; Supplementary Material, Table S4). Common trends included a decrease in Rikenellaceae U29-B03 and Succinivibrionaceae_UCG-002 and an increase in Ruminococcus_gauvreauii and Anaerovibrio in the HE group. For the V4-V5 region, 12, 28, and 15 genera differed significantly in HE vs. CS, HE vs. AS, and HE vs. MS comparisons, respectively (Fig. 1b; Supplementary Material, Table S4). Notably, Rikenellaceae U29-B03 abundance was consistently lower in the HE, while Lachnospiraceae_ND3007, Eubacterium_coprostanoligenes, and Desulfovibrio showed increased abundance.
Similar differences in rumen microbiome and the microbial interactions within sheep rumen. Similar differences in genera (a, b) between each comparison CS and HE, AS and HE, MS and HE. Graphical networks representing the co-occurrence between rumen microbiota within three silage groups (e, f). Classification of nodes to identify putative rumen keystone taxa of bacteria (g, h). The co-occurrence networks among rumen microbiota within the silage groups (CS, AS, and MS), along with rumen keystone taxa based on co-occurrence networks. HE, high concentrate (84%) diet without silage; CS, corn silage-based diet; AS, alfalfa silage-based diet; MS, mulberry leaf silage-based diet. (a, c, e, g) based on region V3-V4 and (b, d, f, h) based on region V4-V5 of 16S rRNA.

Co-occurrence network analysis revealed distinct microbial interactions in the V3-V4 and V4-V5 regions, with the latter showing more complex connectivity (Fig. 1c,d; Supplementary Material, Table S5). Key connectors identified in the V4-V5 region included Howardella, Prevotellaceae_UCG-004, and Bifidobacterium, whereas Ruminococcaceae_UCG-002, Ruminococcaceae_UCG-010, and Ruminococcaceae_UCG-005 were pivotal in the V3-V4 region (Fig. 1e,f; Supplementary Material, Table S6). These findings highlight dietary impacts on keystone microbial communities and their network roles.
Rumen microbial analysis (Trial 2)
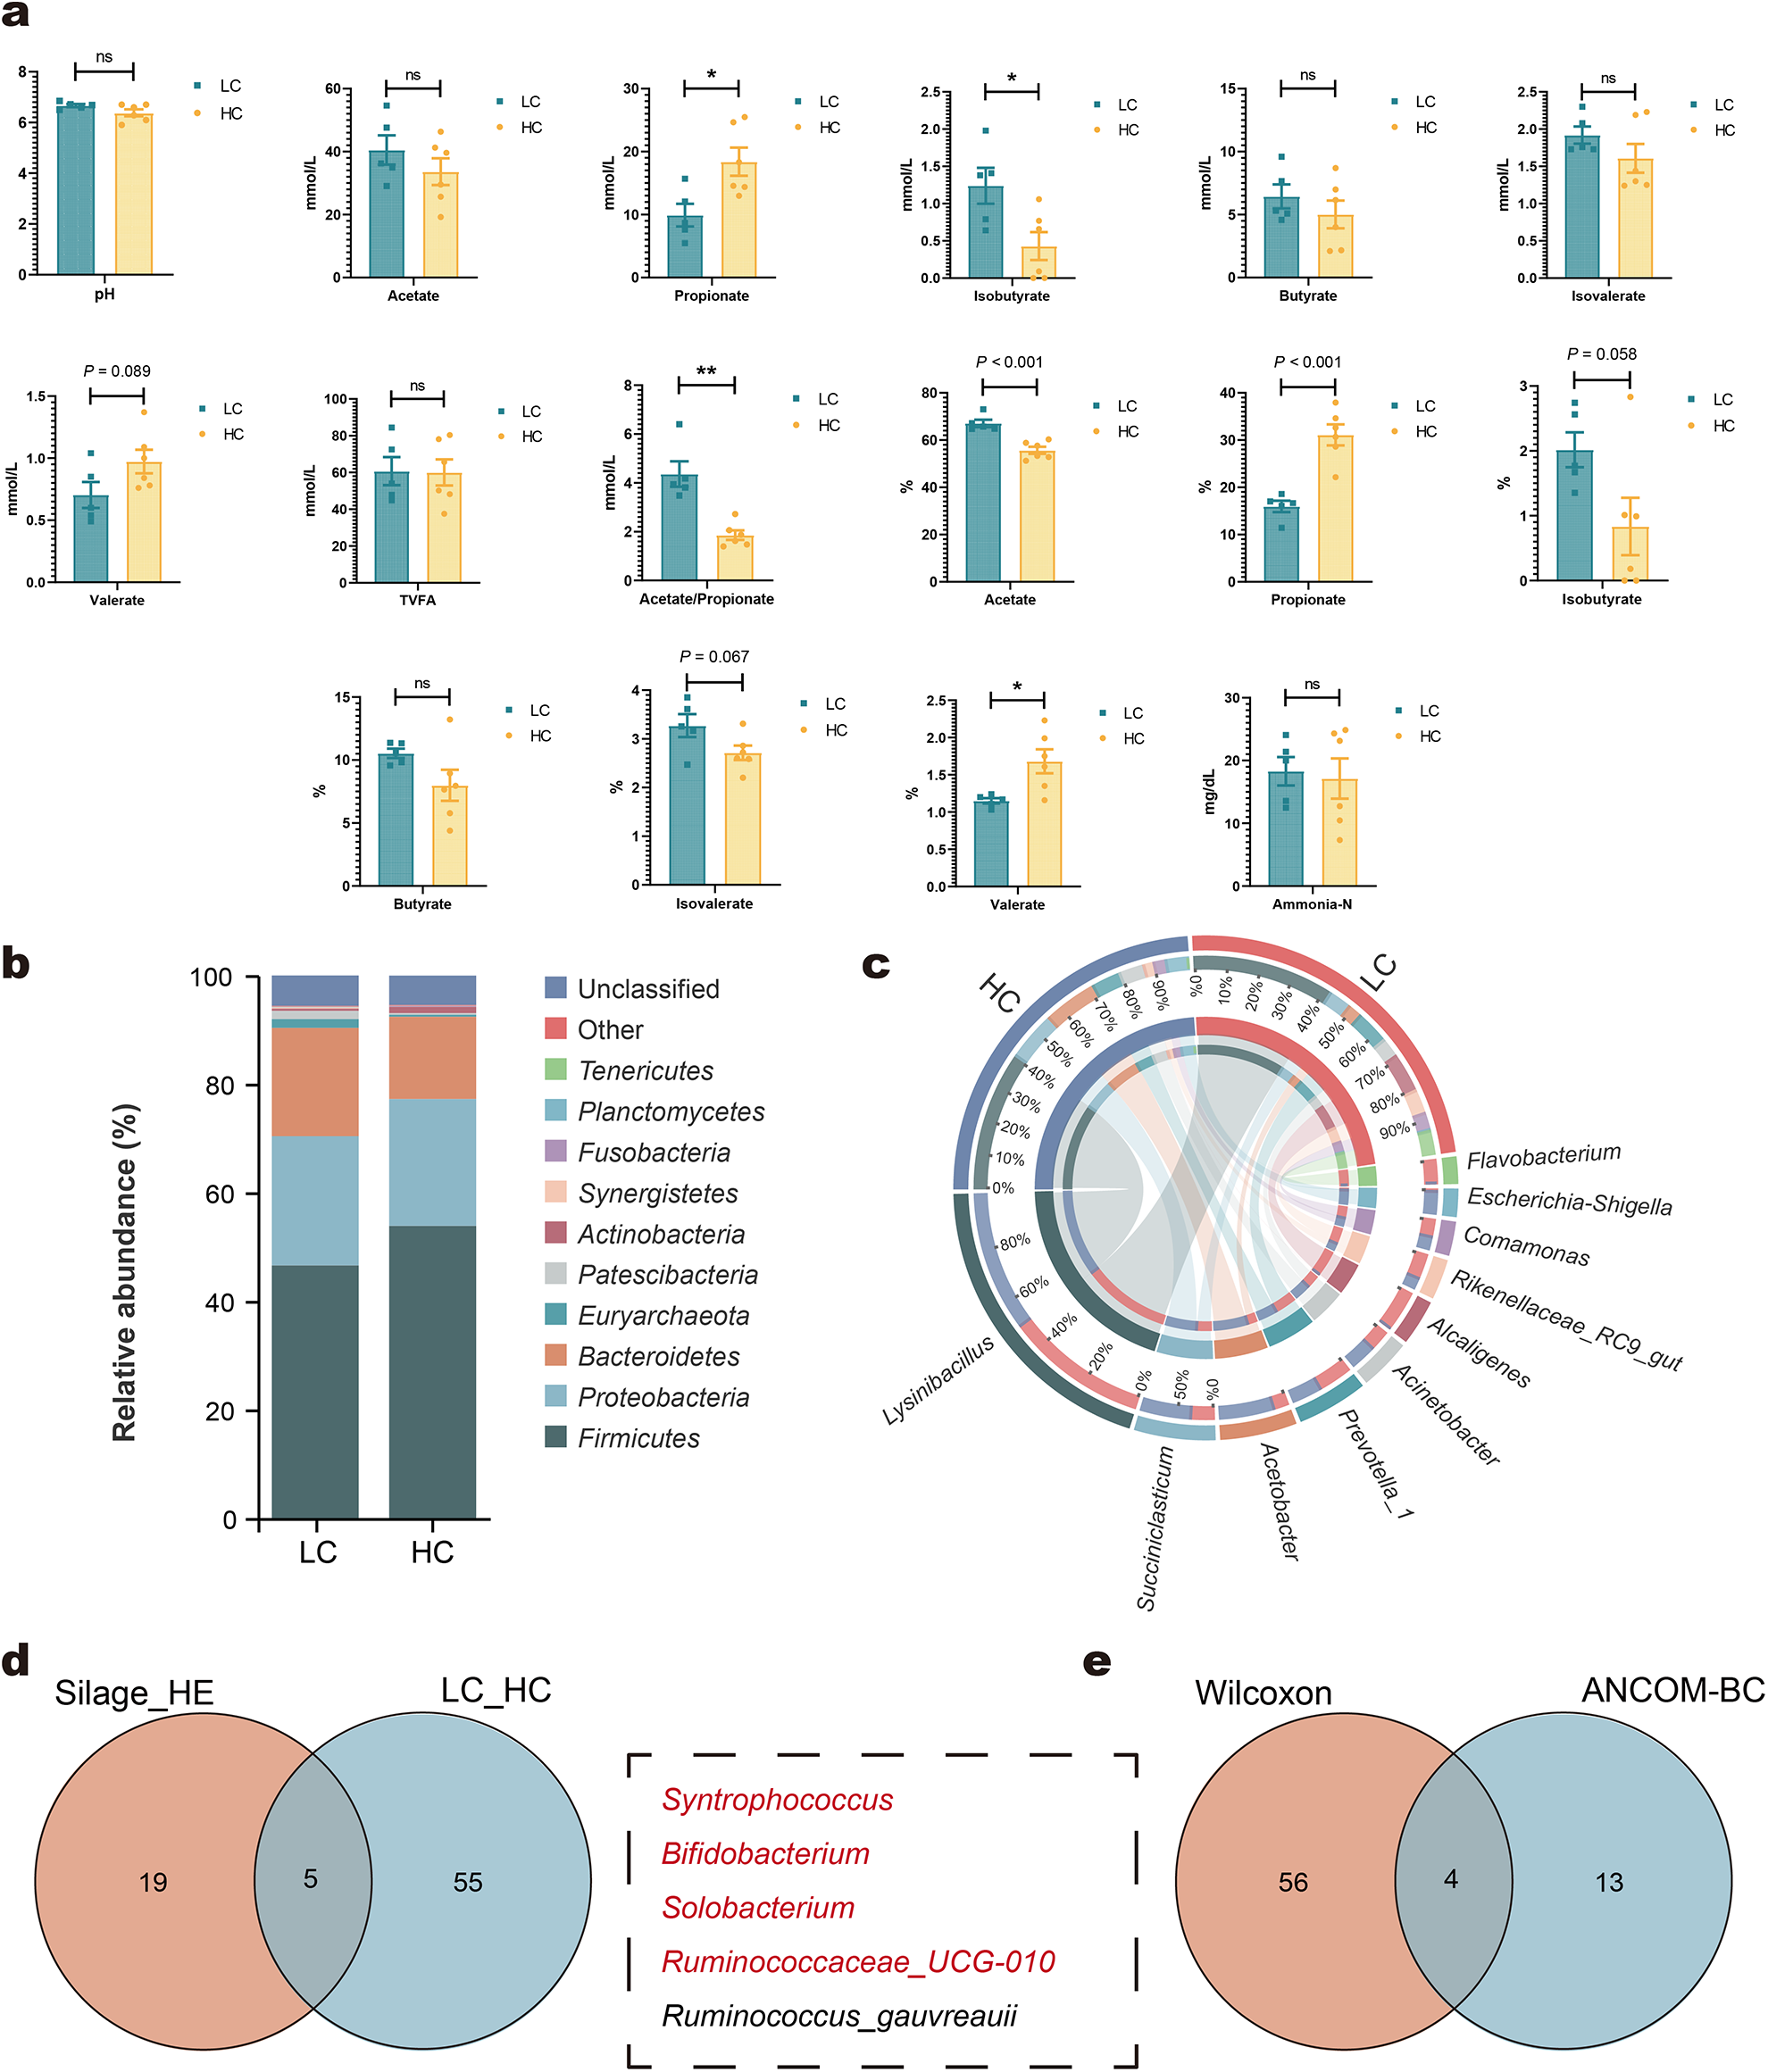
In Trial 2, the HC diet significantly altered fermentation profiles compared to the LC group (Fig. 2a). The HC group exhibited higher propionate concentration and proportions of propionate and valerate, while the acetate-to-propionate ratio, acetate proportion, and isobutyrate concentration were significantly reduced. Valerate concentration displayed an increasing trend (P = 0.089), while the proportions of isobutyrate and isovalerate showed decreasing trends (P = 0.067).
Effects of high-concentrated diets on rumen fermentation characteristics and microbial communities. Rumen fermentation characteristics (a). Relative abundance of rumen bacteria at the phylum (b) and genus (c). Venn diagram showing the differential rumen microbes commonly identified between silage groups (CS, AS, and MS) and HE, as well as between LC and HC groups (d). Venn diagram illustrating the differential rumen microbes co-identified by Wilcoxon rank-sum test (P < 0.05) and ANCOM-BC (FDR < 0.05) (e). HE, high concentrate (84%) diet without silage diet; CS, corn silage-based diet; AS, alfalfa silage-based diet; MS, mulberry leaf silage-based diet; LC, low-concentrate diets; HC, high-concentrate diets. Bars represent mean ± SEM. *P < 0.05, **P < 0.01, ns means not significant.

Microbial community analysis revealed no significant differences in alpha diversity indices (Chao1 and Shannon) or PCoA between the HC and LC groups (Supplementary Material, Fig. S3). At the phylum level, Firmicutes, Proteobacteria, and Bacteroidetes remained the dominant taxa (Fig. 2b; Supplementary Material, Table S7). At the genus level, the top 10 genera included Lysinibacillus, Succiniclasticum, and Acinetobacter, with slight variations compared to the results observed in Trial 1 (Fig. 2c). High-concentrate diets significantly altered the abundance of certain rumen bacteria. A total of 60 genera exhibited significant differences between the HC and LC groups (Supplementary Material, Table S8). Of these, five genera including Syntrophococcus, Bifidobacterium, Solobacterium, Ruminococcaceae_UCG-010, and Ruminococcus_gauvreauii were consistently identified as significantly different in both this analysis and previous intergroup comparisons (Fig. 2d). Among these, the HC group displayed increased abundances of Syntrophococcus, Bifidobacterium, Solobacterium, and Ruminococcus_gauvreauii, whereas Ruminococcaceae_UCG-010 abundance decreased. These findings were consistent with the results of Trial 1. Further analysis using the ANCOM-BC method (FDR < 0.05) identified 17 genera with significant differences between the groups (Supplementary Material, Table S9). Four genera – Syntrophococcus, Bifidobacterium, Solobacterium, and Ruminococcaceae_UCG-010 – were the mutual differential microbes between these two different statistical analysis methods (Fig. 2e).
Overall, based on the rumen microbial analysis from both Trials 1 and 2, it suggests that Syntrophococcus, Bifidobacterium, Solobacterium, Ruminococcaceae_UCG-010, and Ruminococcus_gauvreauii are key microbes involved in rumen metabolism affected by high-concentrate diets. These genera likely play a critical role in mediating the metabolic and functional responses of the rumen to dietary changes.
Blood characteristics analysis
To evaluate the metabolic effects of high-concentrate diets in sheep, we analyzed various hematological parameters. The results revealed significant differences between the LC and HC groups (Table 1). Sheep in the HC group exhibited significantly higher serum glucose (GLU) levels compared to the LC group (P < 0.01). Conversely, serum triglyceride (TG) levels were significantly lower in the HC group (P < 0.05). Additionally, sheep on high-concentrate diets showed elevated levels of the anti-inflammatory factor interleukin-10 (IL-10) (P < 0.05) and the antioxidant enzyme glutathione peroxidase (GSH-Px) (P < 0.05).
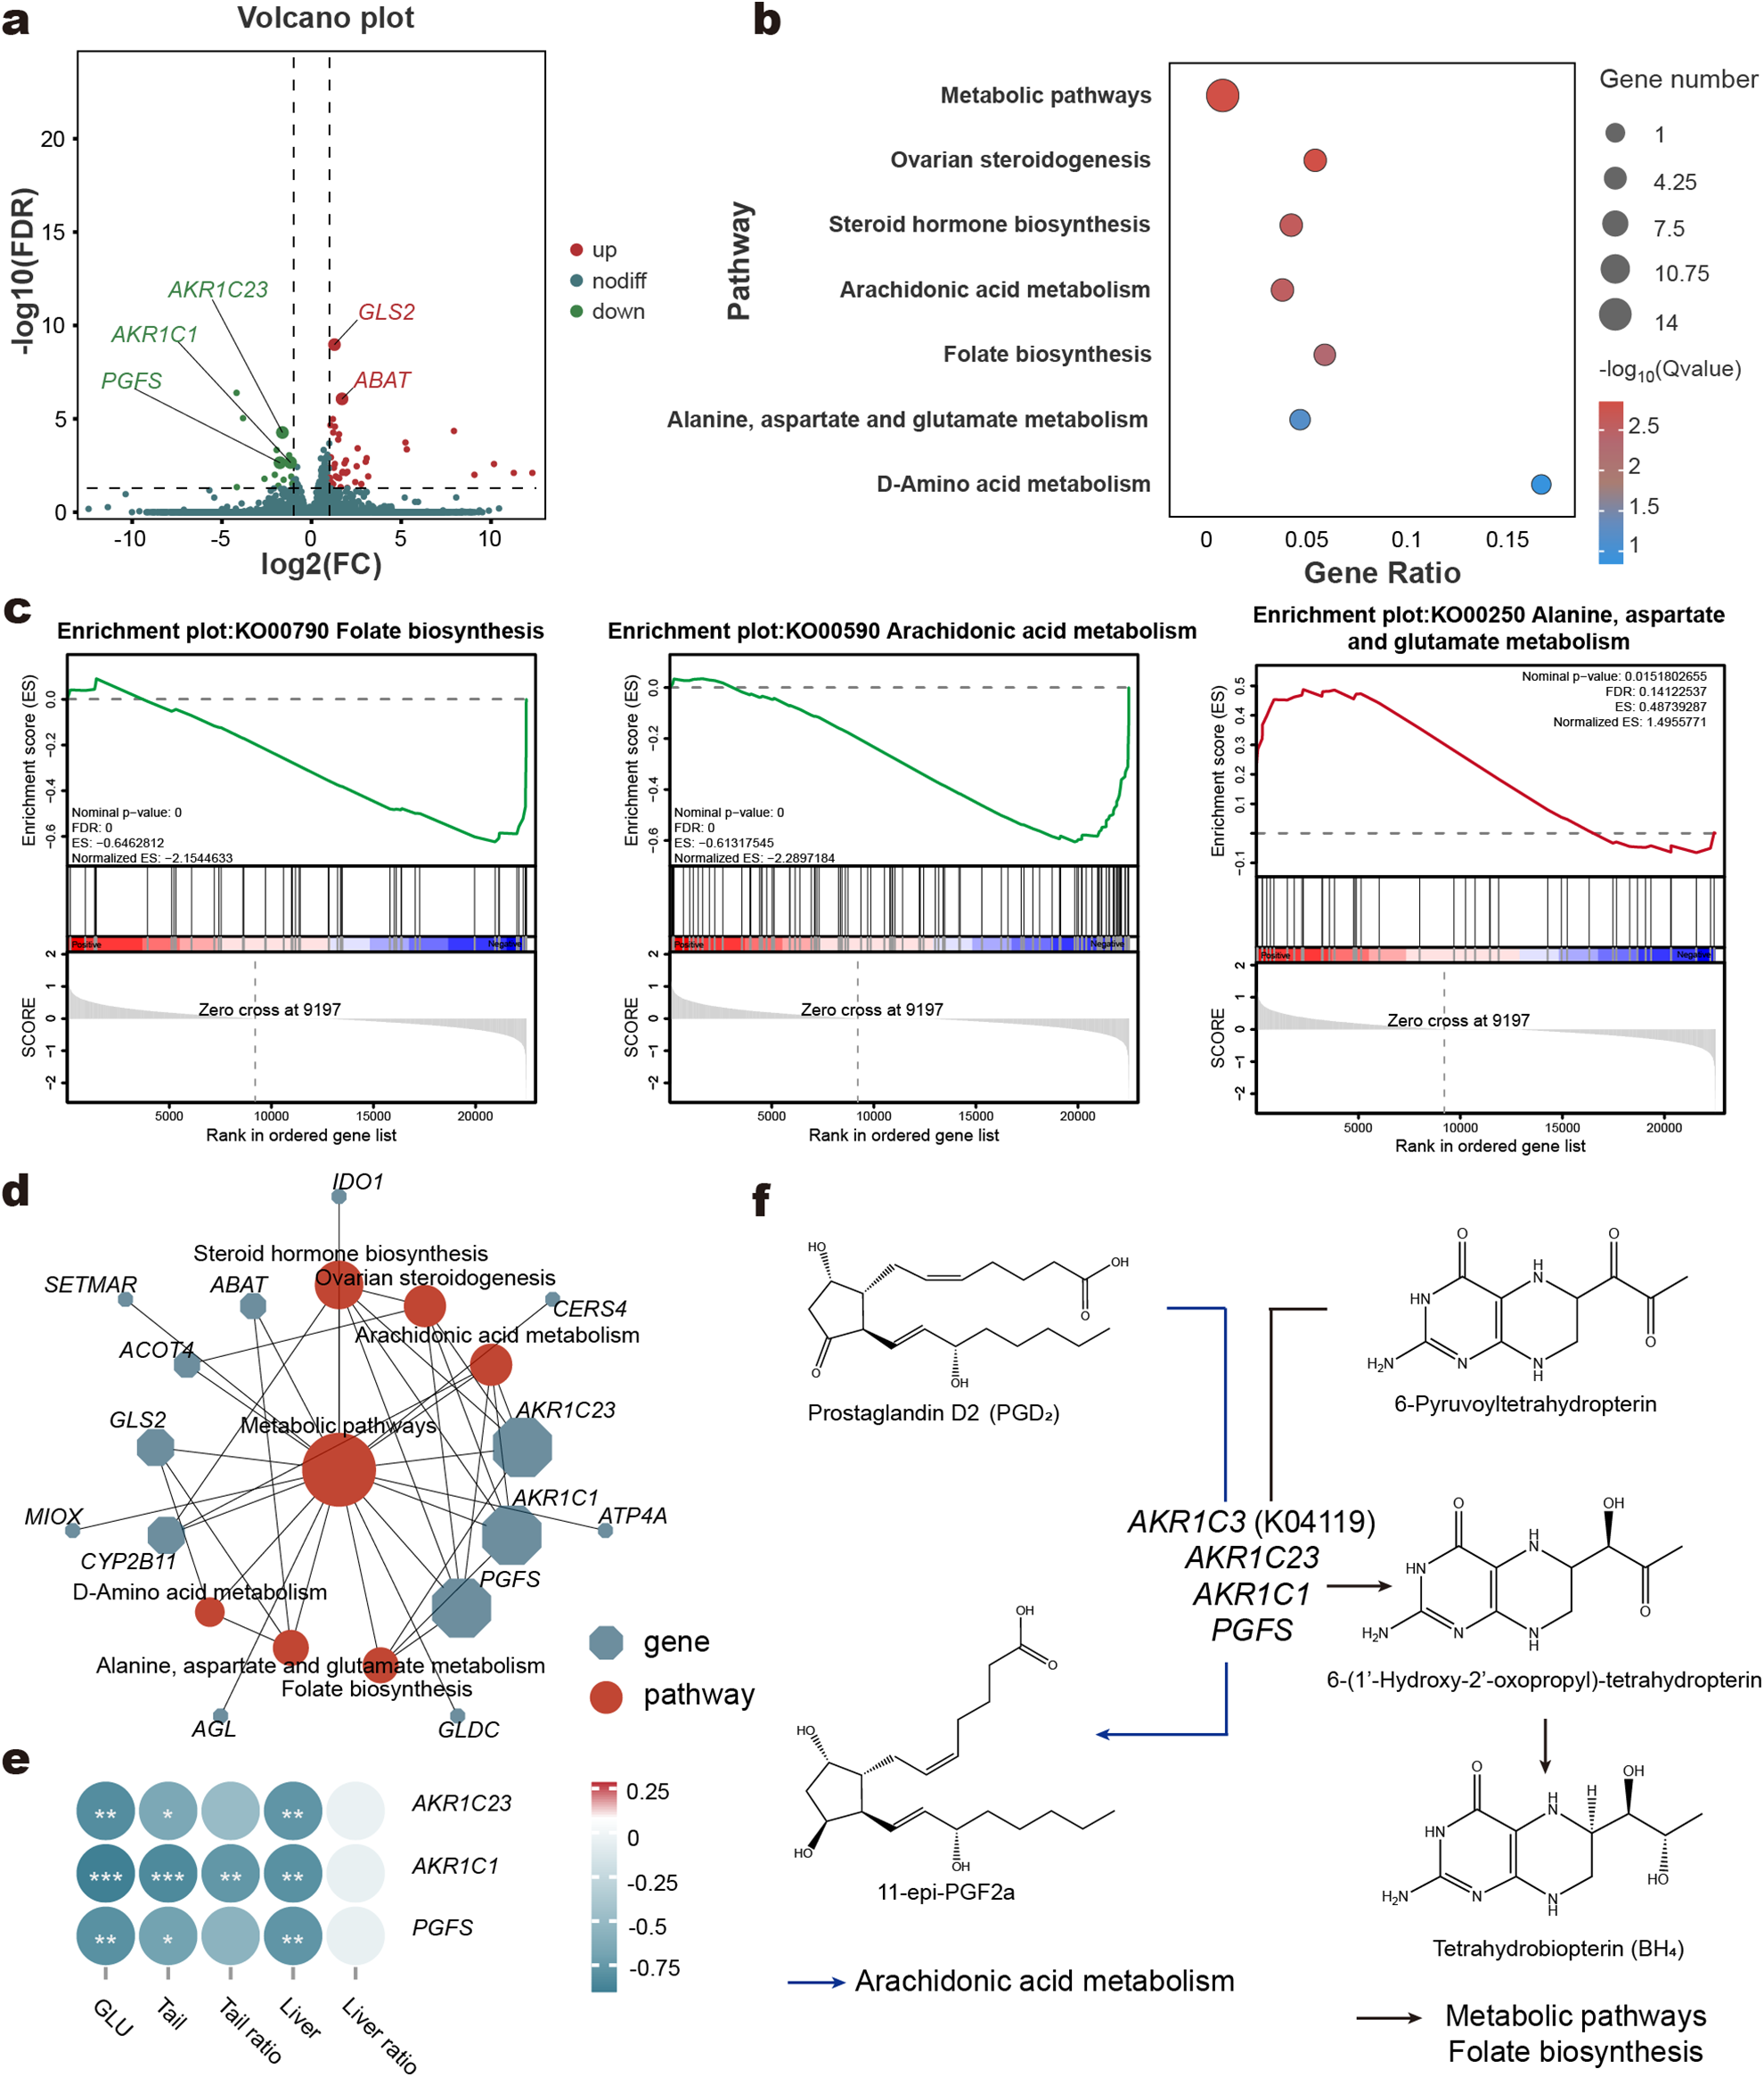
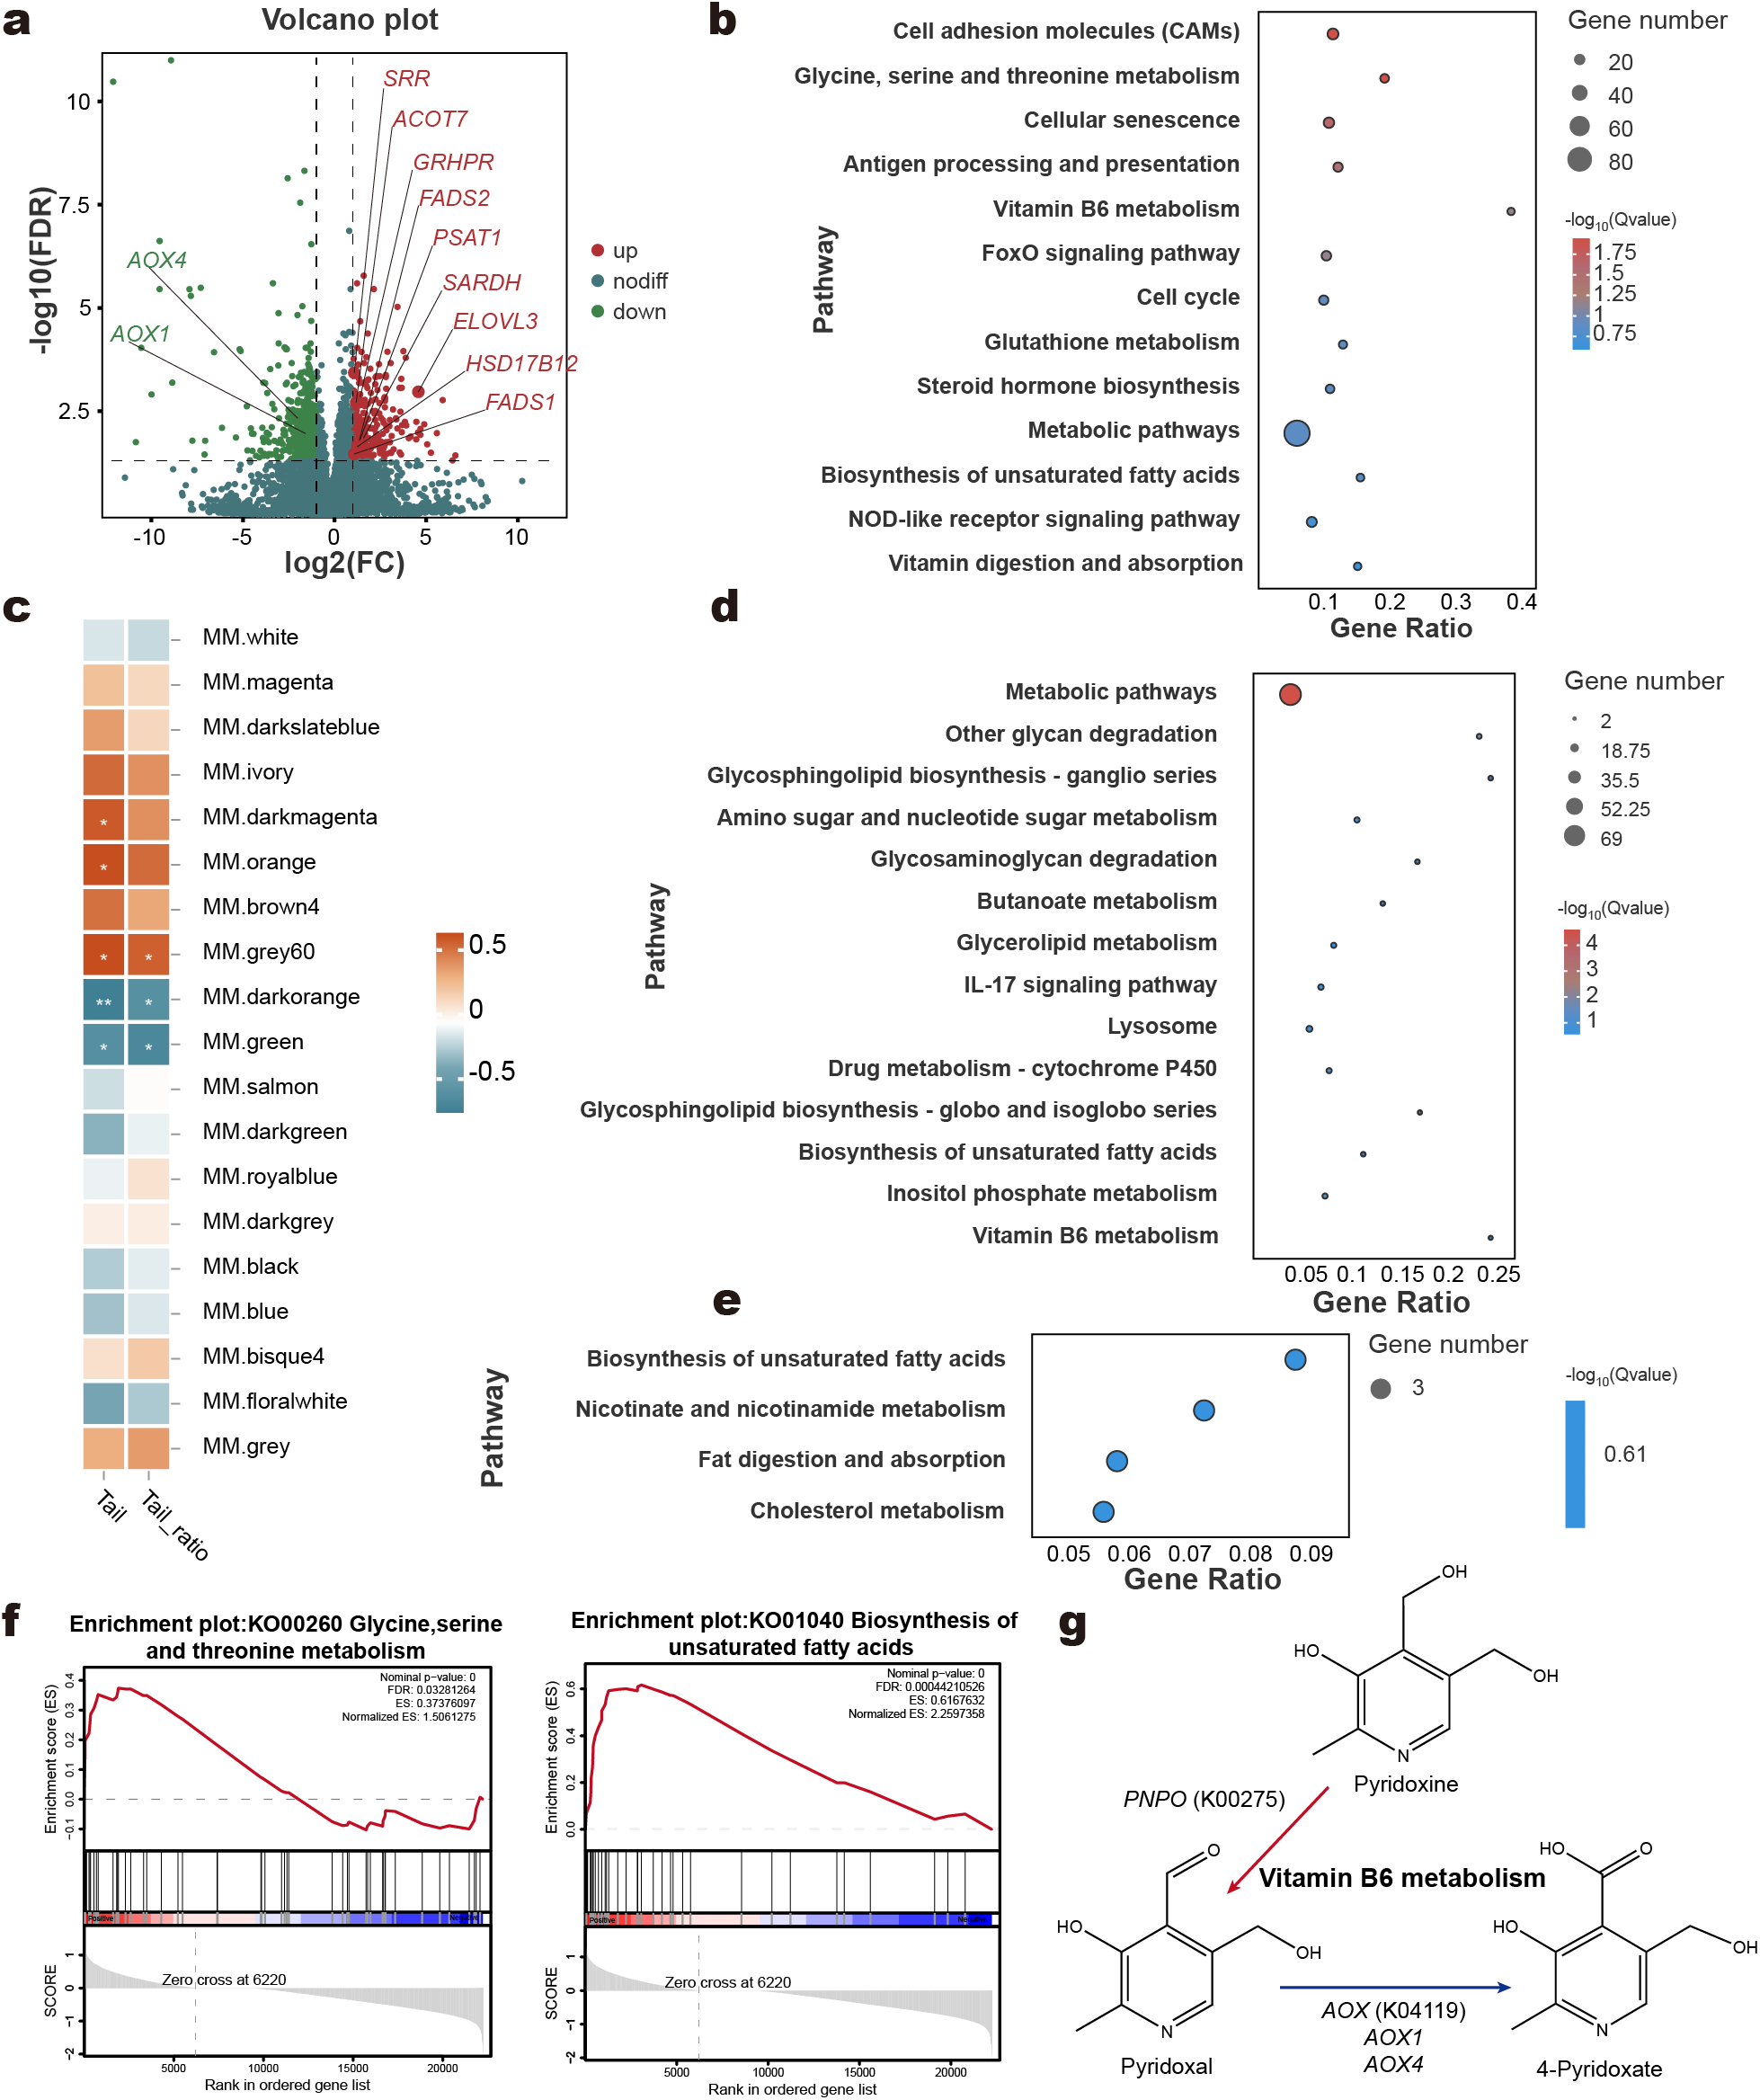
Transcriptomic alterations in liver tissue. Volcano plot of differentially expressed genes (DEGs) between LC and HC groups (a). KEGG enrichment analysis of DEGs of liver (b). Gene set enrichment analysis (GSEA) of specific pathways (c). Interaction network of different pathways (d). Heatmap of correlation between key genes and host phenotypes (e). Schematic diagram of gene pathways involved in key genes in KEGG enrichment analysis (f). Blue arrows indicate Arachidonic acid metabolism, while black arrows represent Metabolic pathways and Folate biosynthesis.
Blood nutrients characteristics, antioxidant capacity, and immune function of the sheep
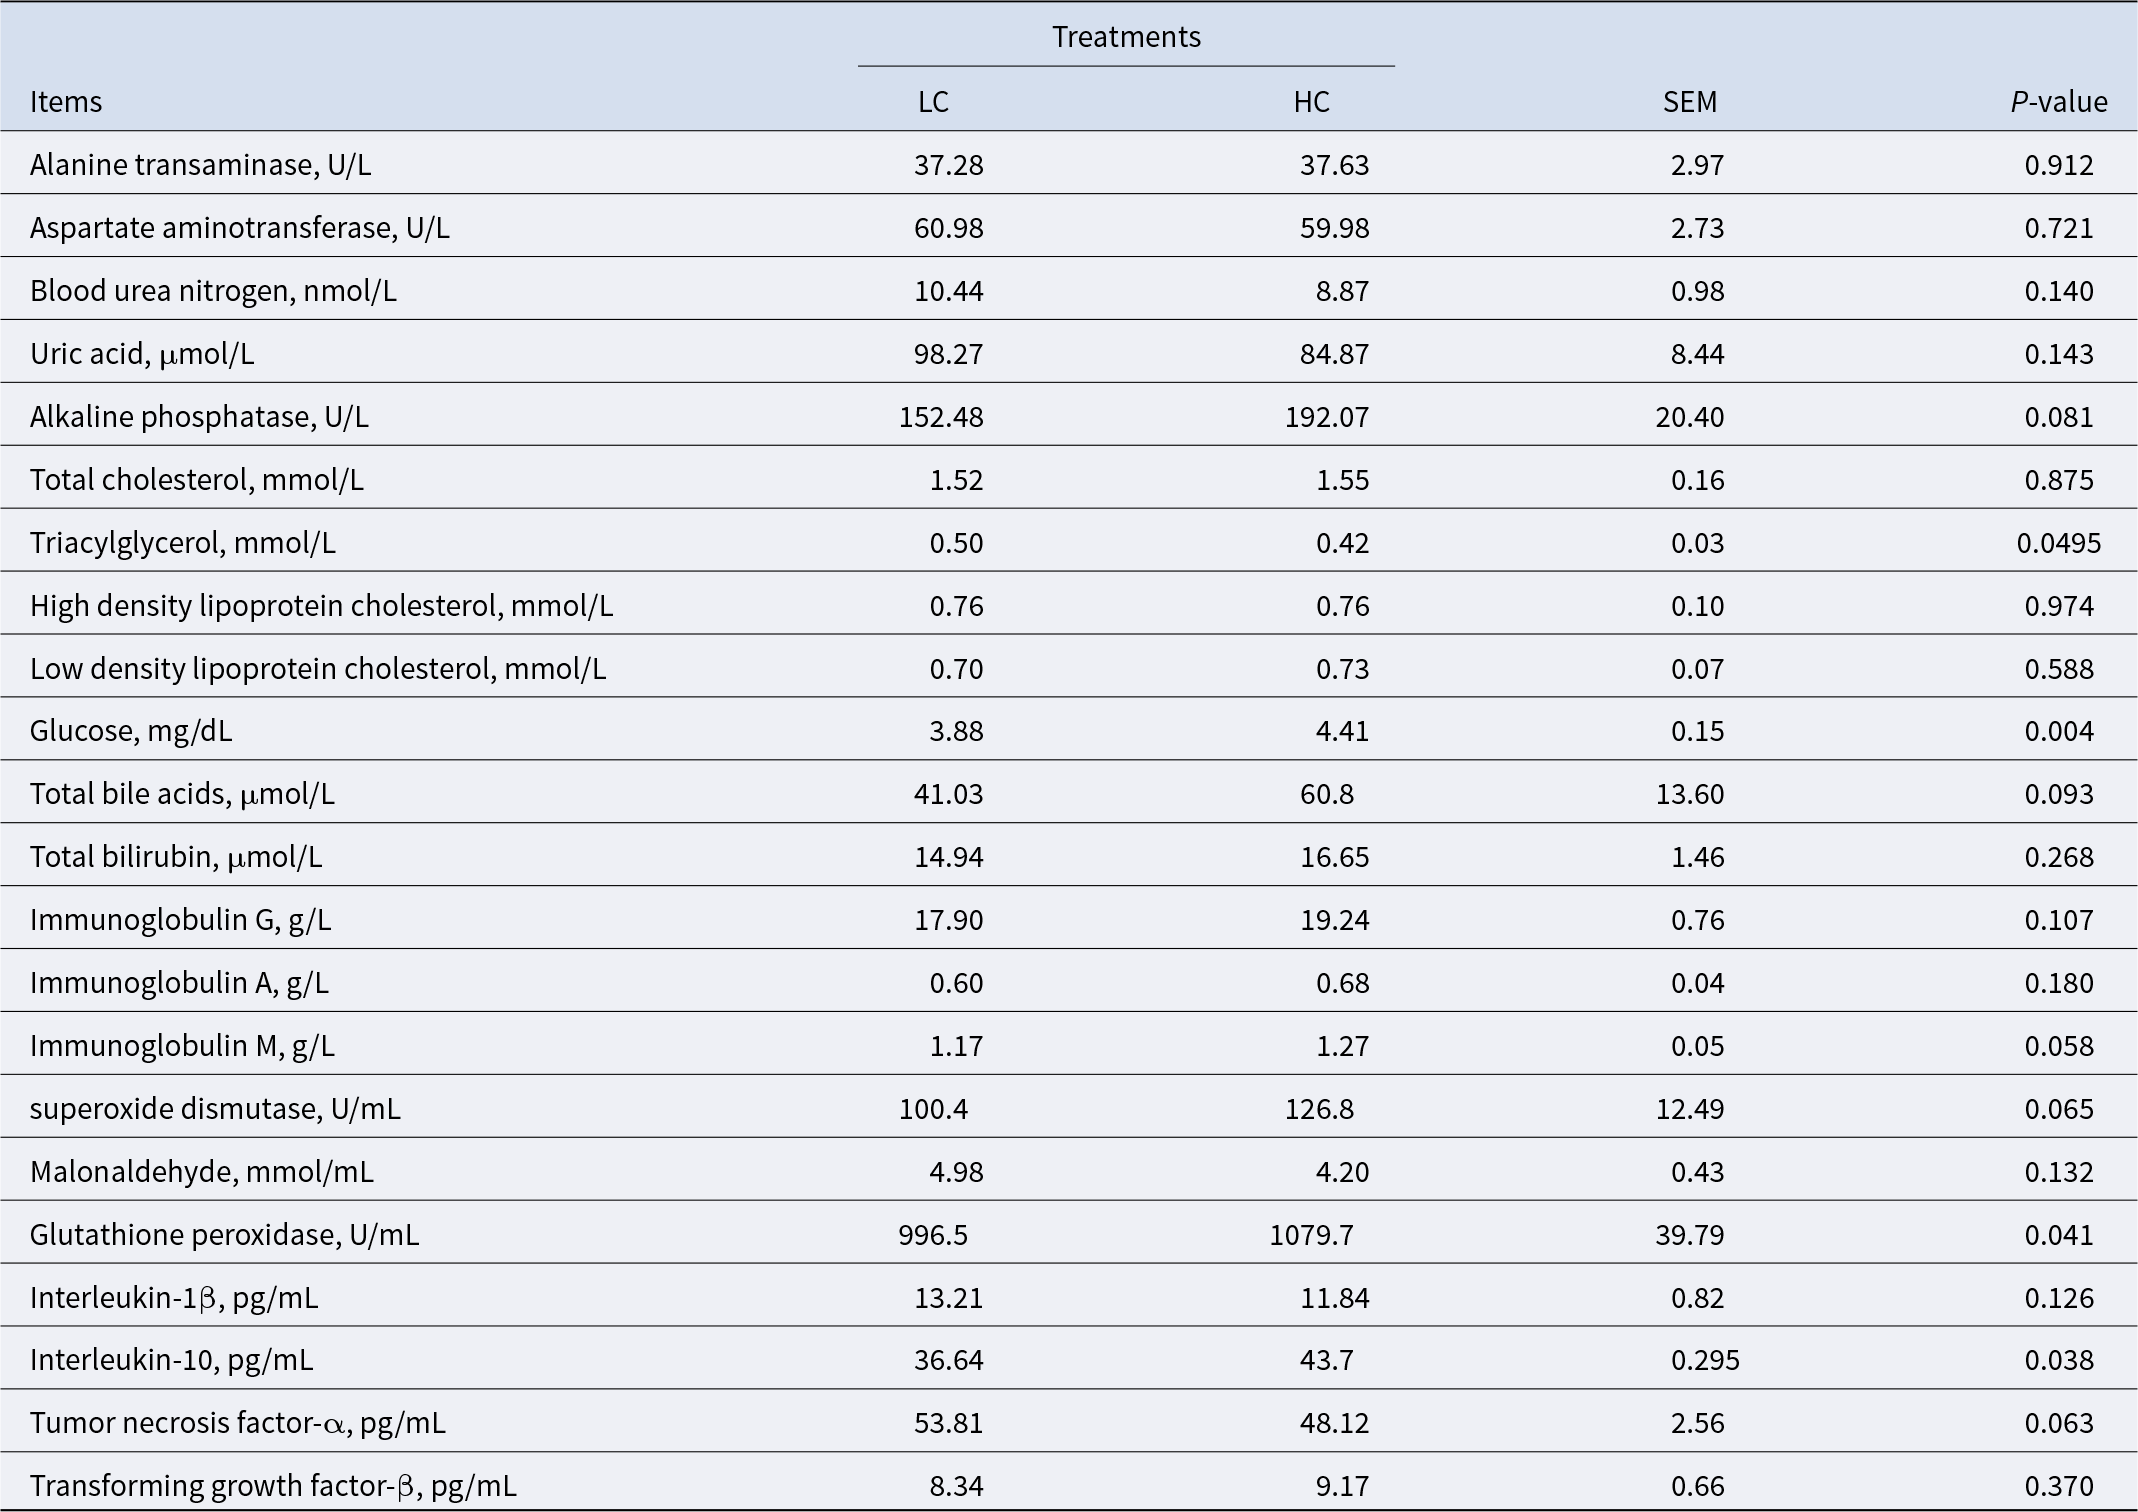
HC, high-concentrate diet; LC, low-concentrate diet.
High-concentrate diets altered the transcriptome in liver
To investigate the changes in liver metabolism, we performed transcriptome sequencing on liver tissue from LC and HC groups. Principal Component Analysis (PCA) revealed no significant differences in overall gene expression patterns between the HC and LC groups (Supplementary Material, Fig. S4a). However, the analysis identified 56 differentially expressed protein-coding genes (DEGs), with 41 upregulated and 15 downregulated in the HC group compared to the LC group (Fig. 3a; Supplementary Material, Table S10). KEGG enrichment analysis of these DEGs, revealed significant alterations in seven pathways related to liver metabolism. These included metabolic pathways, ovarian steroidogenesis, and steroid hormone biosynthesis, among others (Fig. 3b). GSEA further highlighted pathway-specific changes: folate biosynthesis and arachidonic acid metabolism were significantly downregulated in the HC group, while alanine, aspartate, and glutamate metabolism was significantly upregulated (Fig. 3c). A KEGG pathway network analysis provided a detailed view of the relationships between DEGs and metabolic pathways (Fig. 3d). At the network’s core, the metabolic pathways was central, and three genes – AKR1C23, AKR1C1, and PGFS – emerged as pivotal. These genes belong to the aldo-keto reductase family 1 member C3 (AKR1C3) and were enriched across multiple pathways. Notably, their expression was significantly downregulated in the HC group. Correlation analysis revealed that AKR1C23, AKR1C1, and PGFS were negatively correlated with phenotypic traits (Fig. 3e). The specific roles of these genes in metabolic pathways, folate biosynthesis, and arachidonic acid metabolism were visualized (Fig. 3f).
Transcriptome analysis of tail adipose tissue
PCA revealed a clear separation between the LC and HC groups (Supplementary Material, Fig. S4b). A total of 830 DEGs were identified, including 533 downregulated and 297 upregulated genes in the HC group compared to the LC group (Fig. 4a; Supplementary Material, Table S11). These DEGs were significantly enriched in 13 KEGG pathways, including cell adhesion molecules, glycine, serine, and threonine metabolism, and cellular senescence, after excluding pathways related to human diseases (Fig. 4b). Using WGCNA, we identified 19 gene modules associated with tail adipose tissue (Supplementary Material, Fig. S5). Among these, the darkmagenta, orange, and grey60 modules showed strong positive correlations with tail fat deposition (Fig. 4c). Functional enrichment analysis of these modules revealed additional pathways beyond those identified through DEGs analysis. Specifically, the biosynthesis of unsaturated fatty acids pathway was enriched in the darkmagenta module (Fig. 4e), while both biosynthesis of unsaturated fatty acids and vitamin B6 metabolism were enriched in the orange module (Fig. 4d). In the biosynthesis of unsaturated fatty acids pathway, key genes such as ELOVL3, FADS2, FADS1, HSD17B12, and ACOT7 were upregulated in the HC group. For vitamin B6 metabolism, gene expression was more nuanced. While AOX1 and AOX4 were downregulated, PSAT1 was also downregulated, but PNPO showed an upward trend (P = 0.006, FDR = 0.065). Based on these genetic changes, a potential mechanism by which high-concentrate diets influence vitamin B6 metabolism and adipose tissue function was proposed (Fig. 4g).
Effects of high-concentrate diets on the transcriptome of tail adipose tissue. Volcano plot of differentially expressed genes (DEGs) between the LC and HC groups (a). KEGG enrichment analysis of DEGs in tail adipose tissue (b). Correlation analysis between the tail adipose transcriptome and host phenotypes using the WGCNA method, with the names of different colored modules shown on the right; |r| > 0.6 and P < 0.05 were considered a significant correlation (c). KEGG enrichment pathways in the orange module (d) and darkmagernta module (e) of adipose tissue. Gene set enrichment analysis (GSEA) of specific pathways (f). Potential mechanism by which high-concentrate diets influence Vitamin B6 metabolism in tail adipose tissue (g). Red arrows indicate increased gene expression, while blue arrows indicate decreased gene expression.

GSEA further demonstrated that genes associated with biosynthesis of unsaturated fatty acids and glycine, serine, and threonine metabolism were positively enriched in the HC group (Fig. 4f). The glycine, serine, and threonine metabolism pathway, closely linked to the tricarboxylic acid (TCA) cycle, plays a crucial role in carbohydrate, lipid, and energy metabolism. Within this pathway, the HC group exhibited upregulation of genes such as GRHPR, SARDH, ALAS1, SRR, and PSAT1, while GATM, AMT, and ALAS2 were downregulated. These findings highlight the molecular adaptations in tail adipose tissue to dietary changes, with implications for energy and lipid metabolism in sheep.
Integrated multi-omics analysis of the associations between rumen microbiota, host phenotypes, and key genes
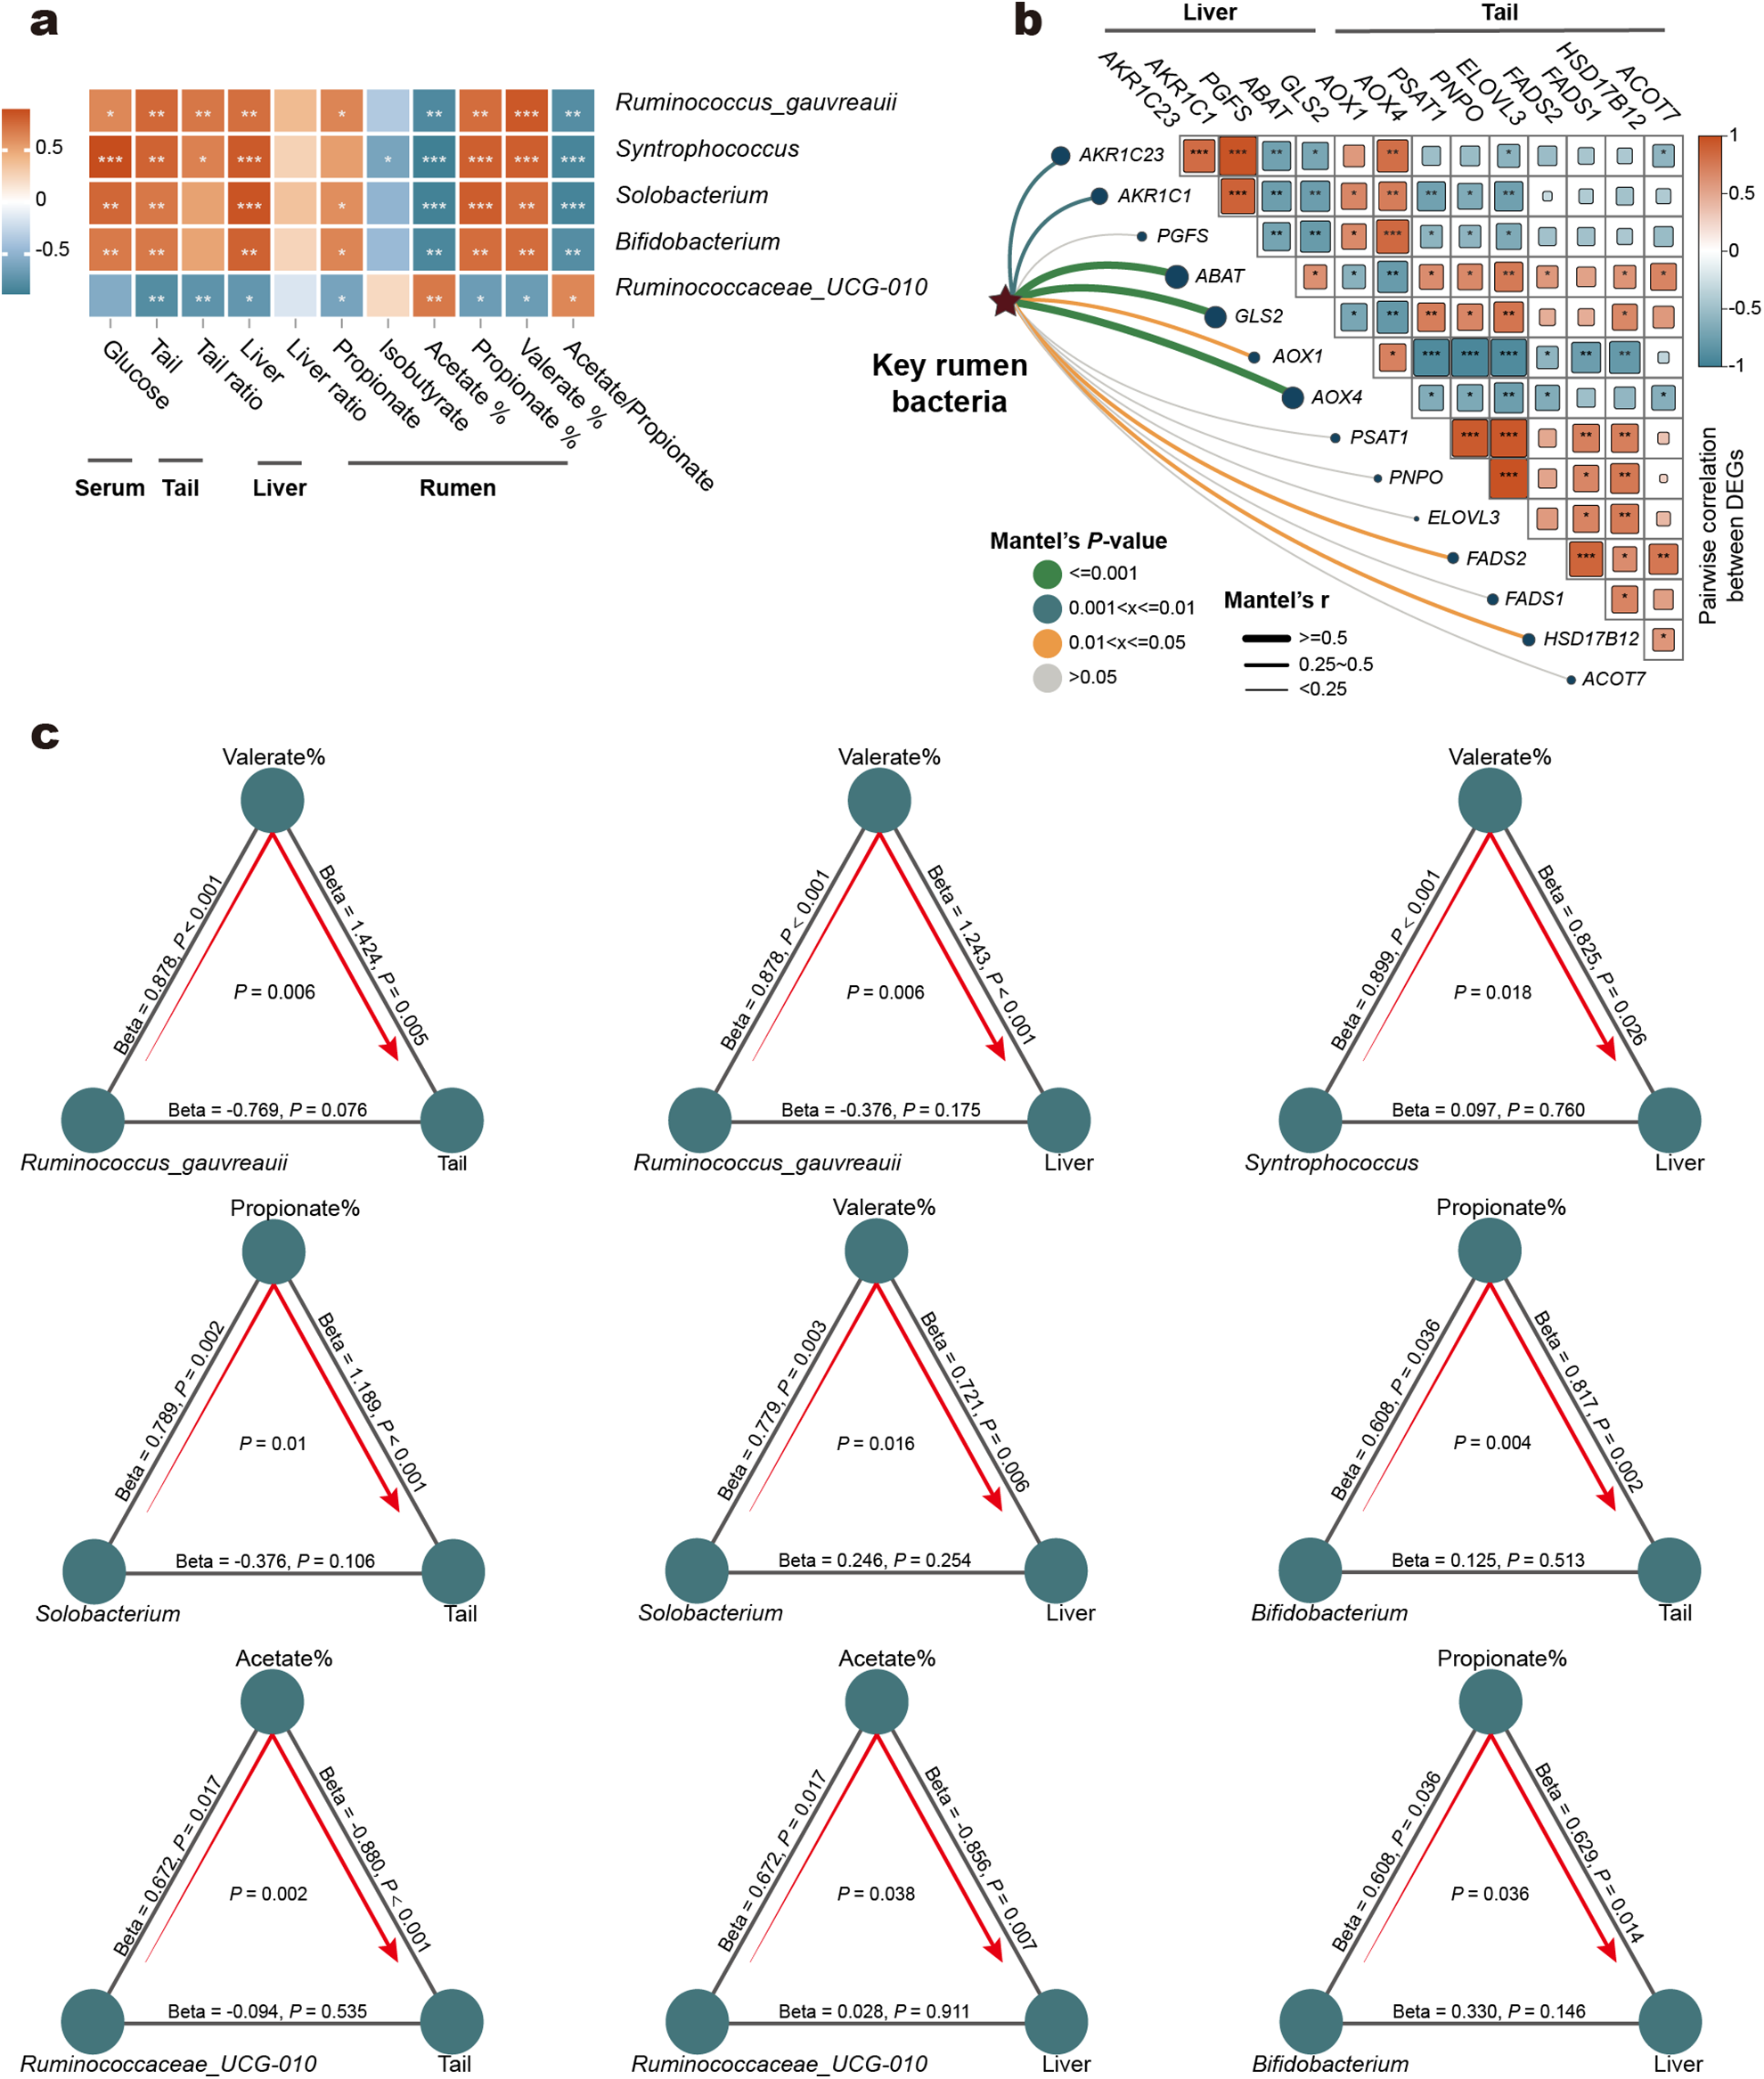
We conducted a correlation analysis to examine the relationships between key rumen bacteria, rumen fermentation parameters, and host phenotypes (Fig. 5a). The analysis revealed significant positive correlations for Syntrophococcus, Bifidobacterium, Solobacterium, and the Ruminococcus gauvreauii with propionate concentration, the proportions of propionate and valerate within the total volatile fatty acids (VFAs), tail adipose deposition, liver parameters, and serum glucose levels. Conversely, these bacteria were significantly negatively correlated with the acetate proportion and the acetate-to-propionate ratio. In contrast, Ruminococcaceae_UCG-010 exhibited the opposite effects. It was significantly negatively correlated with propionate concentration, the proportions of propionate and valerate, tail adipose, and liver parameters, while being positively correlated with the acetate proportion and acetate-to-propionate ratio.
Association between rumen and liver and tail adipose tissue. Correlations between key rumen microbes, rumen fermentation parameters and host phenotypes (a). The Spearman correlation of key DEGs in the liver and tail adipose tissue and the distance correlation between the key rumen bacteria matrix and the key DGEs matrix (b). Ruminococcus_gauvreauii, Syntrophococcus, Solobacterium and Bifidobacterium, which were positively correlated with high-concentrate diets feeding, influenced Tail and Liver through the proportion of propionate or valerate in VFAs. Conversely, Ruminococcaceae_UCG.010, negatively associated with high-concentrate diets, impacts the tail and liver via the proportion of acetate within the total VFAs (c). The distance correlation of the matrices was analyzed using the Mantel test, with Euclidean distances applied to the transcriptomic data and Bray distances applied to the microbiome data. The lines connecting each items indicate the association with the corresponding standardized Beta and P-values. Arrow lines connecting the three items represent the microbial effects on host phenotypes mediated by specific VFAs, with mediation relationships considered significant at P < 0.05.

To verify the potential regulatory roles of key microbes and establish the connections between critical genes in the liver and tail fat tissue, we correlated microbial composition differences with gene expression (Fig. 5b). Overall, members of the AKR1C3 family in the liver (AKR1C23, AKR1C1, and PGFS) were significantly associated with vitamin B6 metabolism-related genes (AOX1, AOX4, PSAT1, and PNPO) in tail fat tissue. Meanwhile, vitamin B6 metabolism-related genes exhibited widespread correlations with genes involved in the biosynthesis of unsaturated fatty acids. Additionally, Mantel test revealed significant associations between key rumen bacteria and the critical differentially expressed genes in the liver and tail fat tissue, particularly ABAT, GLS2, and AOX4. These findings further highlight the crosstalk among sheep rumen microbiota, liver, and tail fat tissue.
To explore potential causal relationships, we constructed a mediation analysis model to investigate whether key rumen bacteria directly influenced host phenotypes or exerted effects via mediators (Fig. 5c). Direct associations between the bacteria and host phenotypes were not identified. However, mediation analysis revealed significant indirect associations. Syntrophococcus, Bifidobacterium, Solobacterium, and the Ruminococcus_gauvreauii were linked to tail adipose and liver metabolism via the proportions of propionate or valerate within the total VFAs as mediators. Ruminococcaceae_UCG-010 was associated with tail adipose and liver metabolism through the proportion of acetate within the total VFAs as a mediator.
Discussion
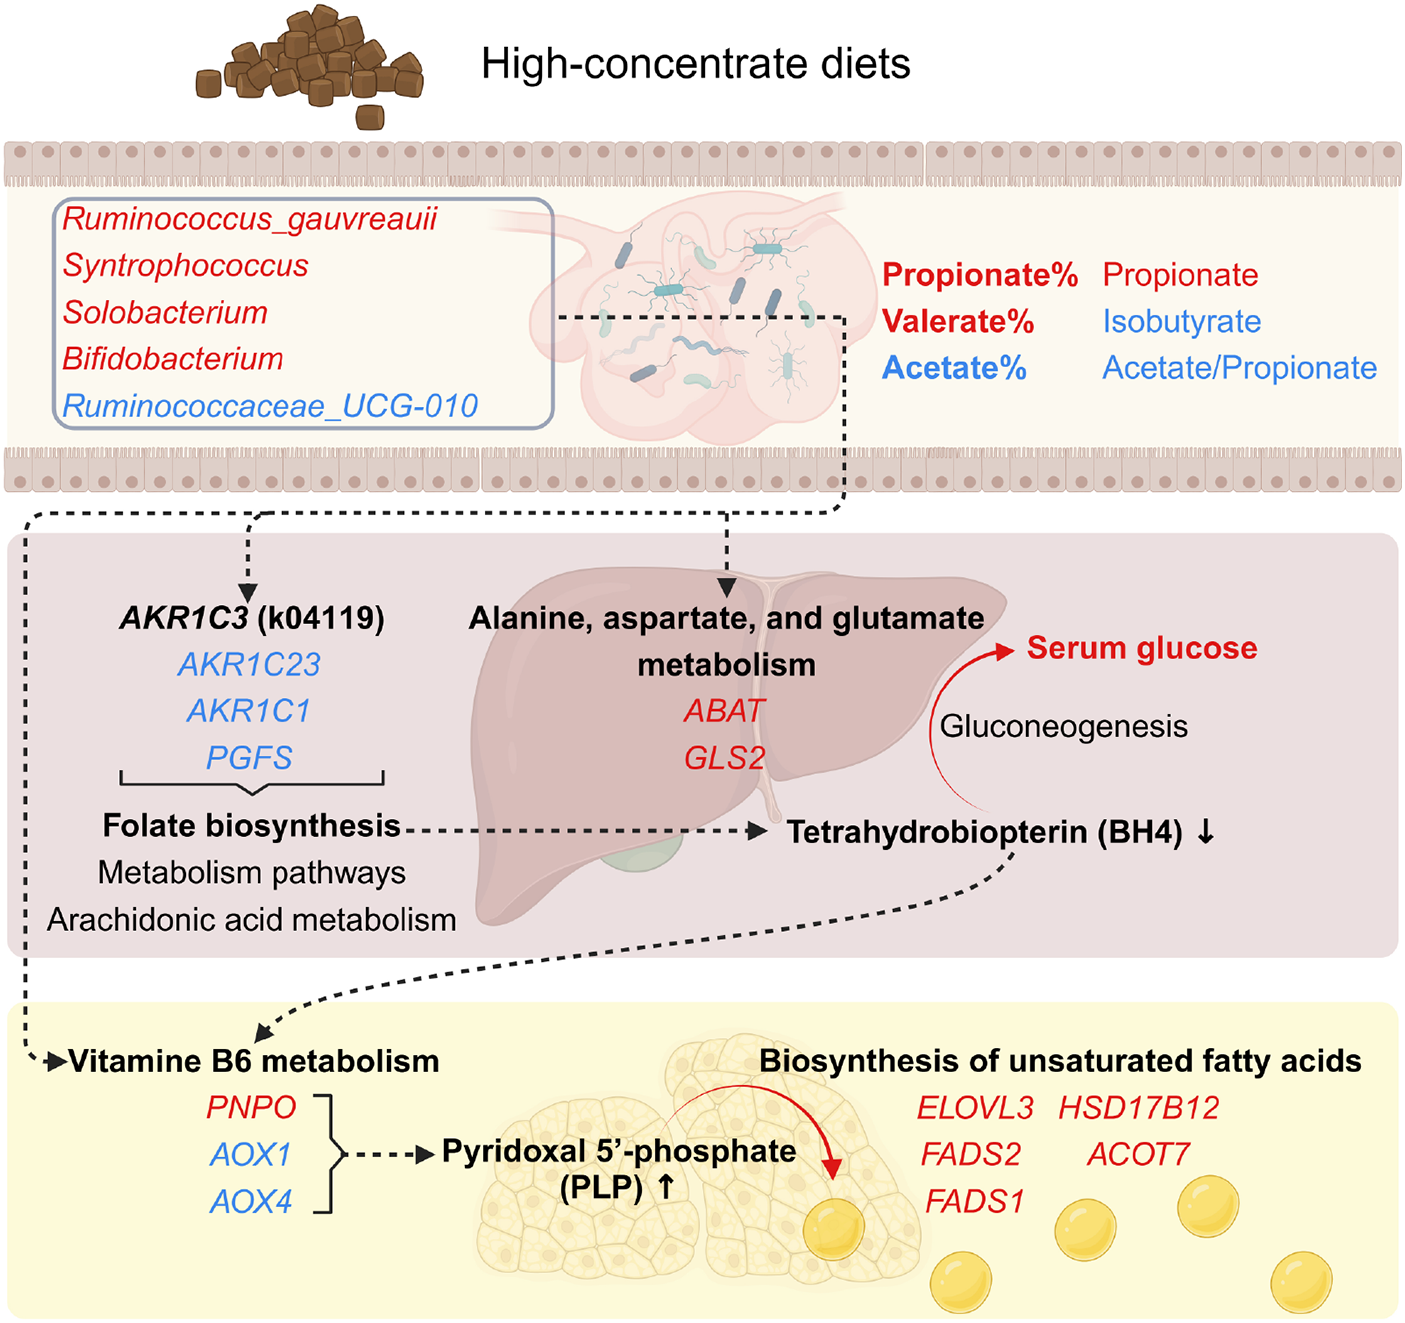
Feeding high-concentrate diets is a common strategy to enhance sheep production efficiency, but it can also disrupt rumen function, liver metabolism, and fat deposition, ultimately affecting animal health and production outcomes (Ma et al., Reference Ma, Wang and Elmhadi2021; Xie et al., Reference Xie, Xu and Wang2021; Zhang et al., Reference Zhang, Zhang and Su2024b). These impacts are closely linked to changes in the rumen microbial community, which interacts with host transcriptomic responses in liver and adipose tissues (Cui et al., Reference Cui, Lin and Lai2023; Li et al., Reference Li, Zhao and Jian2023; Wang et al., Reference Wang, Zhang and Zhou2023). Recent evidence indicates that complex interactions exist among the gut microbiota, intestine, adipose tissue, and liver (Castells-Nobau et al., Reference Castells-Nobau, Moreno-Navarrete and de la Vega-correa2024). Previous studies have demonstrated a strong association between the rumen microbiota and fat deposition in sheep (Zhang et al., Reference Zhang, Zhang and Li2024c). In this study, we explored the potential interactions among the rumen microbiota, liver, and tail fat tissue, providing foundational evidence for the role of keystone rumen microbes in regulating tail fat deposition through the proposed rumen–liver–tail adipose axis (Fig. 6).
Integrated pathways of host metabolism through the rumen-liver-tail adipose axis intervened by high-energy diets. This diagram illustrates the interconnected metabolic pathways within the rumen-liver-tail adipose axis under the effects of high-energy diets. Key components include the role of keystone rumen microbes in shaping rumen fermentation profiles; hepatic metabolic shifts, characterized by altered folate biosynthesis and reduced tetrahydrobiopterin (BH4) production; and increased biosynthesis of unsaturated fatty acids in tail adipose tissue, driven by modifications in vitamin B6 metabolism. Red represents increased activity or levels, blue represents decreases, and arrows highlight potential mechanistic or functional connections.

Our findings demonstrate that high-concentrate diets significantly alter the rumen microbiota, reducing Bacteroidetes and increasing Firmicutes abundance. This microbial shift leads to dysbiosis and microbial remodeling, impacting rumen digestion and fermentation (Li et al., Reference Li, Khafipour and Krause2012; Rivera-Chacon et al., Reference Rivera-Chacon, Pacífico and Ricci2024). The application of co-occurrence network analysis serves as an invaluable tool in finding the keystone taxa and elucidating the interactions between microbial taxa (Fuhrman, Reference Fuhrman2009). Through co-occurrence network analysis and different dietary comparisons, we identified 5 keystone rumen bacterial taxa, including Ruminococcus_gnavus, Syntrophococcus, Solobacterium, Bifidobacterium, and Ruminococcaceae_UCG-010. Ruminococcus_gnavus are a member of the Firmicutes phylum and widely recognized as an important component of the gut microbiota of humans and other animals, but their role in the rumen remains unclear. Ruminococcus_gnavus are classified as mucin-degrading bacteria, utilizing glycoside hydrolases to break down the mucus layer and produce propionate (Li et al., Reference Li, Shao and Mou2021). Their increased abundance has been associated with intestinal mucosal barrier disruption and gastrointestinal diseases (Png et al., Reference Png, Lindén and Gilshenan2010). In our study, Ruminococcus_gnavus were significantly positively correlated with propionate levels in the rumen and linked to host phenotypes through the proportion of valerate within the total VFAs. Syntrophococcus is a key bacterial genus in post-weaning calves and is considered to play a critical role in the establishment and optimization of rumen function (Wang et al., Reference Wang, Chai and Zhao2022). Syntrophococcus belongs to the Lachnospiraceae family and is capable of utilizing various carbohydrates for the production of acetate (Valdez‐Vazquez et al., Reference Valdez‐Vazquez, Morales and Escalante2017). Interestingly, our study found that the increased abundance of Syntrophococcus was significantly associated with the proportion of valerate within the total VFAs and linked to tail fat deposition. Syntrophococcus is closely associated with elevated valerate levels in rumen fluid (Molinero et al., Reference Molinero, Conti and Walker2022). These findings suggest a role for Syntrophococcus in rumen microbial remodeling and valerate production. We also observed that the abundances of beneficial bacteria Bifidobacterium and harmful bacteria Solobacterium significantly increased following the feeding of a high-concentrate diet. Solobacterium is thought to be associated with obesity and diabetes (Jie et al., Reference Jie, Yu and Liu2021; Yu et al., Reference Yu, Wang and Li2024), while Bifidobacterium participates in anti-adipogenic, anti-diabetic, and anti-atherosclerotic activities through the production of conjugated linoleic acid (Russell et al., Reference Russell, Ross and Fitzgerald2011). This phenomenon likely stems from microbial cross-talk during rumen microbiota remodeling, where bacteria modulate community dynamics through quorum sensing-mediated interactions (Won et al., Reference Won, Oyama and Courtney2020). Notably, the high-concentrate diet reduced the relative abundance of Ruminococcaceae_UCG-010, which serves as a key node in the rumen bacterial co-occurrence network. Ruminococcaceae_UCG-010 belongs to the Ruminococcaceae family and is capable of fermenting cellulose and resistant polysaccharides into VFA, including acetate and butyrate (Wang et al., Reference Wang, Ma and Diao2019). Overall, our findings highlight the importance of these key rumen bacteria in rumen function and host metabolism.
On the other hand, liver transcriptomic analysis revealed that high-concentrate diets downregulate the hepatic folate biosynthesis pathway, disrupting tetrahydrobiopterin (BH4) synthesis, a cofactor critical for systemic energy metabolism (Kim and Han, Reference Kim and Han2020). A previous study reported that dietary supplementation with exogenous folate could alter hepatic folate biosynthesis in chickens and inhibit body fat deposition (Du et al., Reference Du, Pang and Zhang2023). Tetrahydrobiopterin-deficient mice exhibit obesity, fat deposition, glucose intolerance, insulin resistance, and impaired brown adipose tissue function (Oguri et al., Reference Oguri, Fujita and Abudukadier2017). BH4 is synthesized from 6-pyruvoyl-tetrahydropterin by members of the aldo-keto reductase 1 (AKR1) family (Iino et al., Reference Iino, Tabata and Takikawa2003). In our study, the downregulation of AKR1C23, AKR1C1, and PGFS, key genes in the aldo-keto reductase family, was associated with alterations in glucose and lipid metabolism, which may contribute to increased fat deposition. Additionally, BH4 contributes to gluconeogenesis in an endothelial nitric oxide synthase-dependent manner (Abudukadier et al., Reference Abudukadier, Fujita and Obara2013). Amino acids play an important role in gluconeogenesis by providing carbon precursors for anabolic pathways through the TCA cycle. High-concentrate diets treatment upregulated the alanine, aspartate, and glutamate metabolism pathway and increased serum glucose levels. Among these, glutaminase 2 (GLS2) catalyzes the hydrolysis of glutamine to glutamate (Hu et al., Reference Hu, Zhang and Wu2010). Under the action of 4-aminobutyrate aminotransferase, the metabolic product of glutamate, γ-aminobutyric acid, is converted into succinic semialdehyde, which is ultimately catalyzed to form succinate (Belal et al., Reference Belal, Goudenège and Bocca2022). These findings align with previous reports linking BH4 deficiency to obesity, insulin resistance, and adipose dysfunction (Oguri et al., Reference Oguri, Fujita and Abudukadier2017). Furthermore, in tail adipose tissue, glycine, serine, and threonine metabolism pathways were enriched, with upregulation of PSAT1, a key enzyme in serine biosynthesis (Choi et al., Reference Choi, Rawat and Högström2022), and sarcosine dehydrogenase (SARDH), involved in glycine metabolism (Ducker and Rabinowitz, Reference Ducker and Rabinowitz2017). In high-fat diet-induced obese rats, transcriptomic analysis revealed that hepatic SARDH expression was increased (Gu et al., Reference Gu, Xie and Wang2009). Considering the critical role of folic acid and amino acids in one-carbon metabolism, these changes suggest adaptive metabolic mechanisms in folic acid and amino acid contributed to tail fat deposition.
WGCNA revealed significant associations between tail fat deposition and pathways involved in vitamin B6 metabolism and unsaturated fatty acid biosynthesis. The active form of vitamin B6, pyridoxal 5’-phosphate, plays a pivotal role in fatty acid metabolism (Senadheera et al., Reference Senadheera, Turchini and Thanuthong2012). Feeding high-concentrate diets induces upregulation of PNPO, a gene responsible for pyridoxal 5’-phosphate synthesis (Wilson et al., Reference Wilson, Plecko and Mills2019), and downregulation of AOX2 and AOX4, which convert pyridoxal to its excretory form in the mouse brain (Ding et al., Reference Ding, Wen and Ma2023). Notably, AOX4-/- mice exhibit constitutive deficits in fat deposition (Terao et al., Reference Terao, Barzago and Kurosaki2016). These changes likely enhance vitamin B6 availability, promoting lipid biosynthesis and deposition. Additionally, upregulation of genes such as ELOVL3 and FADS2 were involved in fatty acid elongation. The Elovl (elongation-of-very-long-chain-fatty acids) gene family encodes the rate-limiting enzymes in long-chain fatty acid synthesis, playing a critical role in the biosynthesis of complex lipids (Guillou et al., Reference Guillou, Zadravec and Martin2010). ELOVL3 is predominantly expressed in the liver and adipose tissue and is responsible for synthesizing saturated and/or monounsaturated very long-chain fatty acids, which contribute to lipid droplet formation (Jakobsson et al., Reference Jakobsson, Westerberg and Jacobsson2006). The increased expression of ELOVL3 contributes to fat deposition in newborn goats (Liu et al., Reference Liu, Fan and Zhang2022b). Additionally, 17-beta-hydroxysteroid dehydrogenase type 12 (HSD17B12) is essential in the elongation of long-chain fatty acids, and elevated transcription of HSD17B12 may result in increased subcutaneous fat deposition in sheep (Liu et al., Reference Liu, Feng and Yousuf2022a). Fatty acid desaturase (FADS) is the first rate-limiting enzyme in the biosynthesis of long-chain polyunsaturated fatty acids (PUFAs). Enhanced FADS2 expression facilitates lipid droplet accumulation in goat mammary epithelial cells (Wu et al., Reference Wu, Luo and Xia2023). These findings suggest that the elongation of unsaturated fatty acid chains may play a crucial role in tail fat deposition.
Additionally, compared to the HC dietary group, LC diet with Caragana microphylla silage reduced blood levels of the anti-inflammatory cytokine IL-10 and the antioxidant enzyme GSH-Px in sheep. Although numerous studies have shown that silage generally enhances immune responses and antioxidant capacity in ovine blood (Wang et al., Reference Wang, Zhang and Zhou2023; Zheng et al., Reference Zheng, Wang and Li2025), this discrepancy may be due to differences in silage source and its fermented quality.
Conclusion
In summary, this study underscores the intricate interplay between rumen microbiota, liver metabolism, and tail adipose deposition in sheep fed high-concentrate diets. Keystone rumen microbes such as Ruminococcus_gauvreauii, Syntrophococcus, and Ruminococcaceae_UCG-010 emerge as critical mediators linking microbial fermentation products to host metabolic responses. In the liver, disruptions in folate biosynthesis and altered metabolic pathways suggest potential targets for dietary or microbial interventions. Meanwhile, in tail adipose tissue, pathways associated with vitamin B6 metabolism and fatty acid elongation play central roles in regulating lipid deposition. These findings provide a comprehensive understanding of the rumen-liver-tail adipose axis, offering mechanistic insights and potential strategies to optimize sustainable sheep production while mitigating risks of metabolic disorders.
Supplementary material
The supplementary material for this article can be found at https://doi.org/10.1017/anr.2025.10017.
Date availability statement
The raw reads of the 16S rRNA gene sequencing of the ruminal microbiota are available at National Center for Biotechnology Information (NCBI) Sequence Read Archive (SRA) (accession number PRJNA1072003; PRJNA636952; PRJNA698723; PRJNA636681). The RNA-seq of tail adipose tissue and liver are available at NCBI SRA (accession number PRJNA1158691; PRJNA820168).
Acknowledgements
This work was supported by the Special Youth Scientist Fund of Bayannur Research Institute, China Agricultural University (2024BYNECAU002), Hainan Provincial Natural Science Foundation of China (324QN289), and the China Agriculture Research System (CARS-38). We sincerely thank all members of our laboratory at the State Key Laboratory of Animal Nutrition and Feeding, China Agricultural University, for their assistance in the sampling and analysis of the samples.
OA Funding statement
Open access funding provided by Wageningen University & Research.
Author contributions
Zeping Zhang: methodology, formal analysis, investigation, visualization, validation, writing – original draft. Shuran Zhao: formal analysis, visualization, methodology. Boyan Zhang: methodology. Liheng Wu & Yongqiang Li: resources, investigation. Hailing Luo: resources. Bing Wang: conceptualization, resources, supervision, funding acquisition, writing – review & editing.
Conflict of interest
The authors declare that they have no conflicts of interest.


 Open access