


I. INTRODUCTION
Carbadox, C11H10N4O4 (sold under the brand name Mecadox, among others), is a veterinary antibiotic drug used to treat infections in swine, particularly dysentery. It has been shown to be carcinogenic and to cause birth defects in laboratory animals, resulting in its being banned in several countries.
The systematic name (CAS Registry Number 6804-07-5) is methyl N-[(E)-(1,4-dioxidoquinoxaline-1,4-diium-2-yl)methylideneamino]carbamate. A two-dimensional molecular diagram is shown in Figure 1. We are unaware of any published X-ray powder diffraction data on carbadox.
The 2D molecular structure of carbadox.

This work was carried out as part of a project (Kaduk et al., Reference Kaduk, Crowder, Zhong, Fawcett and Suchomel2014) to determine the crystal structures of large-volume commercial pharmaceuticals and include high-quality powder diffraction data for them in the Powder Diffraction File (Gates-Rector and Blanton, Reference Gates-Rector and Blanton2019).
II. EXPERIMENTAL
Carbadox, a commercial reagent, was purchased from TargetMol (Batch #113752) and was used as-received. The yellow powder was packed into a 1.5 mm diameter Kapton capillary and rotated during the measurement at ~50 Hz. The powder pattern was measured at 295 K at beam line 11-BM (Antao et al., Reference Antao, Hassan, Wang, Lee and Toby2008; Lee et al., Reference Lee, Shu, Ramanathan, Preissner, Wang, Beno, Von Dreele, Ribaud, Kurtz, Antao, Jiao and Toby2008; Wang et al., Reference Wang, Toby, Lee, Ribaud, Antao, Kurtz, Ramanathan, Von Dreele and Beno2008) of the Advanced Photon Source at Argonne National Laboratory using a wavelength of 0.458208(2) Å from 0.5–50° 2θ with a step size of 0.001° and a counting time of 0.1 s/step. The high-resolution powder diffraction data were collected using twelve silicon crystal analyzers that allow for high angular resolution, high precision, and accurate peak positions. A mixture of silicon (NIST SRM 640c) and alumina (NIST SRM 676a) standards (ratio Al2O3:Si = 2:1 by weight) was used to calibrate the instrument and refine the monochromatic wavelength used in the experiment.
The pattern was initially indexed using DICVOL06 (Louër and Boultif, Reference Louër and Boultif2007) as incorporated into FOX (Favre-Nicolin and Černý, Reference Favre-Nicolin and Černý2002) on a primitive monoclinic unit cell with a = 15.39751(22), b = 21.47282(9), c = 6.90792(10) Å, β = 94.8164(10)°, V = 2275.888(18) Å3, and Z = 8. The suggested space group was P2 1/n. A reduced cell search in the Cambridge Structural Database (Groom et al., Reference Groom, Bruno, Lightfoot and Ward2016) yielded four hits but no carbadox derivatives.
The carbadox molecule was downloaded from PubChem (Kim et al., Reference Kim, Chen, Cheng, Gindulyte, He, He, Li, Shoemaker, Thiessen, Yu, Zaslavsky, Zhang and Bolton2023) as Conformer3D_CID_135511839.sdf, converted to a *.mol2 file using Mercury (Macrae et al., Reference Macrae, Sovago, Cottrell, Galek, McCabe, Pidcock, Platings, Shields, Stevens, Towler and Wood2020), and converted to a Fenske-Hall Z-matrix using OpenBabel (O'Boyle et al., Reference O'Boyle, Banck, James, Morley, Vandermeersch and Hutchison2011). Although a structure was obtained using FOX, the unit cell did not account for several peaks between 5° and 8° 2θ. The pattern was thus re-indexed using a larger number of peaks (31) with DICVOL14 (Louër and Boultif, Reference Louër and Boultif2014) on a primitive monoclinic unit cell with a = 13.8212, b = 21.4595, c = 16.3396 Å, β = 110.097°, V = 4551.21 Å3, and Z = 16. This cell is among the 2× supercells yielded by NBS*LATTICE (Himes and Mighel, Reference Himes and Mighel1985). Although the space group suggested by FOX was #14, two weak peaks adjacent to the lowest-angle strong peak are 100 and 10-1 (Figure 2) and thus violate the glide plane. The true space group is thus P2 1 (as suggested by EXPO2014), and thus, there are eight molecules in the asymmetric unit. A reduced cell search in the Cambridge Structural Database (Groom et al., Reference Groom, Bruno, Lightfoot and Ward2016) yielded two hits but no carbadox derivatives.
The low-angle portion of the carbadox diffraction pattern, illustrating the 100 and 10-1 peaks that violate glide planes and demonstrate that the space group is P2 1. Image generated using JADE Pro (MDI, 2023).

The initial P2 1/n cell was transformed to the c-unique supercell with Materials Studio (Dassault Systèmes, 2022) using the matrices suggested by NBS*LATTICE. The space group was set to P1, and the unit cell was converted to the conventional b-unique cell using the matrix [100/00-1/010]. A coordinate transformation of x + 1/4,y,z + 1/4 was applied, and the space group was changed to P2 1.
Rietveld refinement was carried out using GSAS-II (Toby and Von Dreele, Reference Toby and Von Dreele2013). Only the 2.0–25.0° portion of the pattern was included in the refinement (d min = 1.058 Å). Initial refinements used eight rigid carbadox molecules but yielded some close intermolecular contacts. Thus, all non-H bond distances and angles were subjected to restraints (plus planar restraints for the dioxidoquinoxaline ring systems) based on a Mercury/Mogul Geometry check (Bruno et al., Reference Bruno, Cole, Kessler, Luo, Motherwell, Purkis, Smith, Taylor, Cooper, Harris and Orpen2004; Sykes et al., Reference Sykes, McCabe, Allen, Battle, Bruno and Wood2011). The Mogul average and standard deviation for each quantity were used as the restraint parameters. The restraints contributed 8.6% to the final χ 2. The hydrogen atoms were included in calculated positions, which were recalculated during the refinement using Materials Studio (Dassault Systèmes, 2022). The Uiso of the heavy atoms were grouped by chemical similarity. The Uiso for the H atoms were fixed at 1.3× the Uiso of the heavy atoms to which they are attached. A 6th-order spherical harmonic preferred orientation model was used; the texture index was 1.149. The peak profiles were described using a uniaxial size broadening model, with 001 as the unique axis. The background was modeled using a 3-term shifted Chebyshev polynomial and a peak at 6.27° 2θ to model the scattering from the Kapton capillary and any amorphous component.
The final refinement of 476 variables using 23,037 observations and 384 restraints yielded the residuals Rwp = 0.2156 and (Goodness of Fit (GOF) = 3.87). The residuals are higher than would normally be considered acceptable, but this is a very large refinement using relatively limited data. The largest peak (1.35 Å from C319) and hole (2.13 Å from O292) in the difference Fourier map were 1.82(41) and –1.80(41) eÅ–3, respectively. The largest errors in the difference plot (Figure 3) are in the intensities of some of the peaks and probably represent an incomplete model for the preferred orientation. There are also some unindexed peaks, indicating the presence of at least one crystalline impurity.
The Rietveld plot for the refinement of carbadox. The blue crosses represent the observed data points, and the green line is the calculated pattern. The cyan curve is the normalized error plot, and the red line is the background curve. The vertical scale is the square root of the intensities.

The structure was optimized (fixed experimental unit cell) with density functional techniques using VASP (Kresse and Furthmüller, Reference Kresse and Furthmüller1996) through the MedeA graphical interface (Materials Design, 2016). The calculations were carried out on 16 2.4 GHz processors (each with 4 Gb RAM) of a 64-processor HP Proliant DL580 Generation 7 Linux cluster at North Central College. The calculation used the GGA-PBE functional, a plane wave cutoff energy of 400.0 eV, and a k-point spacing of 0.5 Å–1 leading to a 1 × 1 × 1 mesh, and took ~295 h. The system is a semiconductor, with a direct band gap of 1.440 eV. A single-point density functional calculation (fixed experimental cell) and population analysis were carried out using CRYSTAL23 (Erba et al., Reference Erba, Desmaris, Casassa, Civalleri, Donà, Bush, Searle, Maschio, Daga, Cossard, Ribaldone, Ascrizzi, Marana, Flament and Kirtman2023). The basis sets for the H, C, N, and O atoms in the calculation were those of Gatti et al. (Reference Gatti, Saunders and C.1994). The calculation was run on a 3.5 GHz PC using eight k-points and the B3LYP functional, and took ~30 h. Neither PLATON (Spek, Reference Spek2009, Reference Spek2020) nor Materials Studio detected additional symmetry in the refined or optimized structure, so the space group seems to be P2 1.
To modify the degree of preferred orientation, several different specimens of carbadox were prepared and measured on a Bragg-Brentano diffractometer with Cu radiation using flat plate specimens and on a Debye–Scherrer diffractometers with Mo radiation using capillary specimens.
III. RESULTS AND DISCUSSION
Although not a protein, the crystal structure of carbadox is a very large one to be solved and refined using powder diffraction data. Searches of the Cambridge Structural Database for high-Z′ powder structures yielded the results as shown in Table I. Only 9.7% of the 3391 powder structures have Z′ > 1, and only two have Z′ = 8. These two molecules are 5,7-dihydroxy-2-phenyl-4H-chromen-4-one (Chrysin, Chadha et al., Reference Chadha, Bhalla, Nandan, Chadha and Karan2017; IYIWIY) and perdeutero-4-methylpyridine-N-oxide (Damay et al., Reference Damay, Carretero-Genevrier, Cousson, Rodriguez-Carvajal, Van Beek and Fillaux2006; ZZZVCO03). Both of these are also nearly planar molecules.
Powder structures in the CSD with different numbers of molecules in the asymmetric unit (Z′).

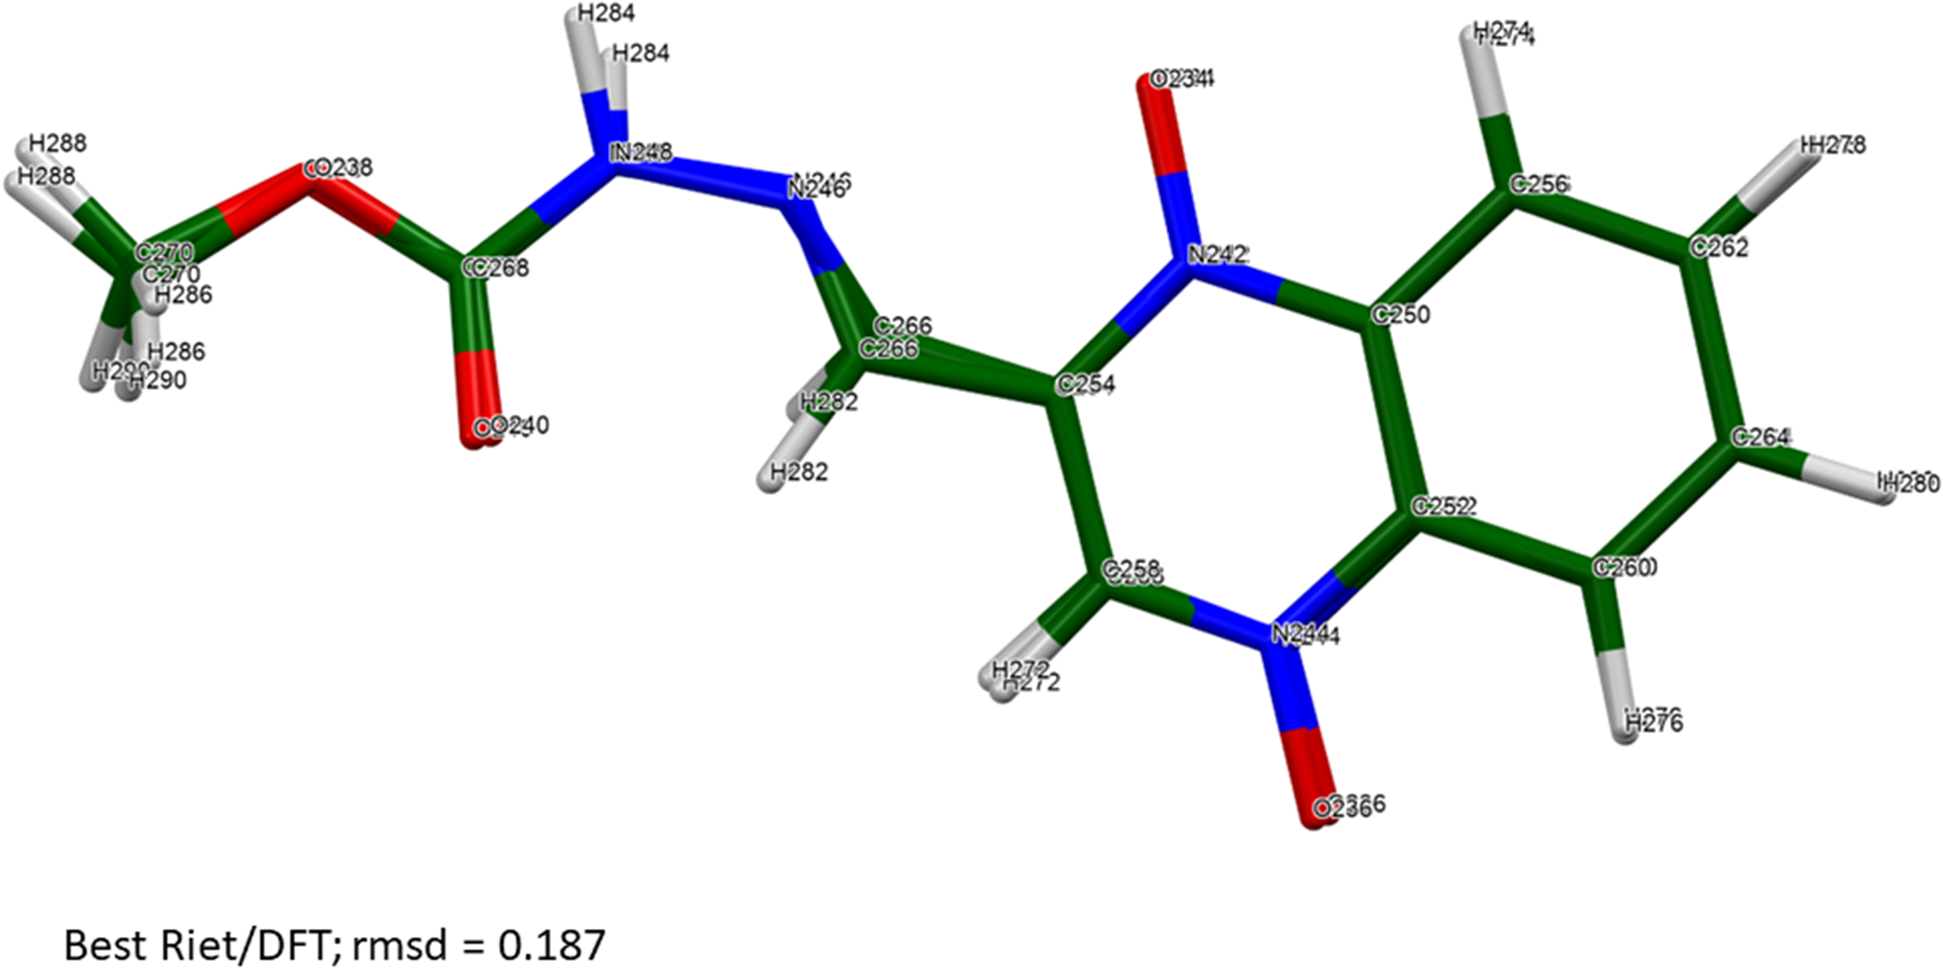
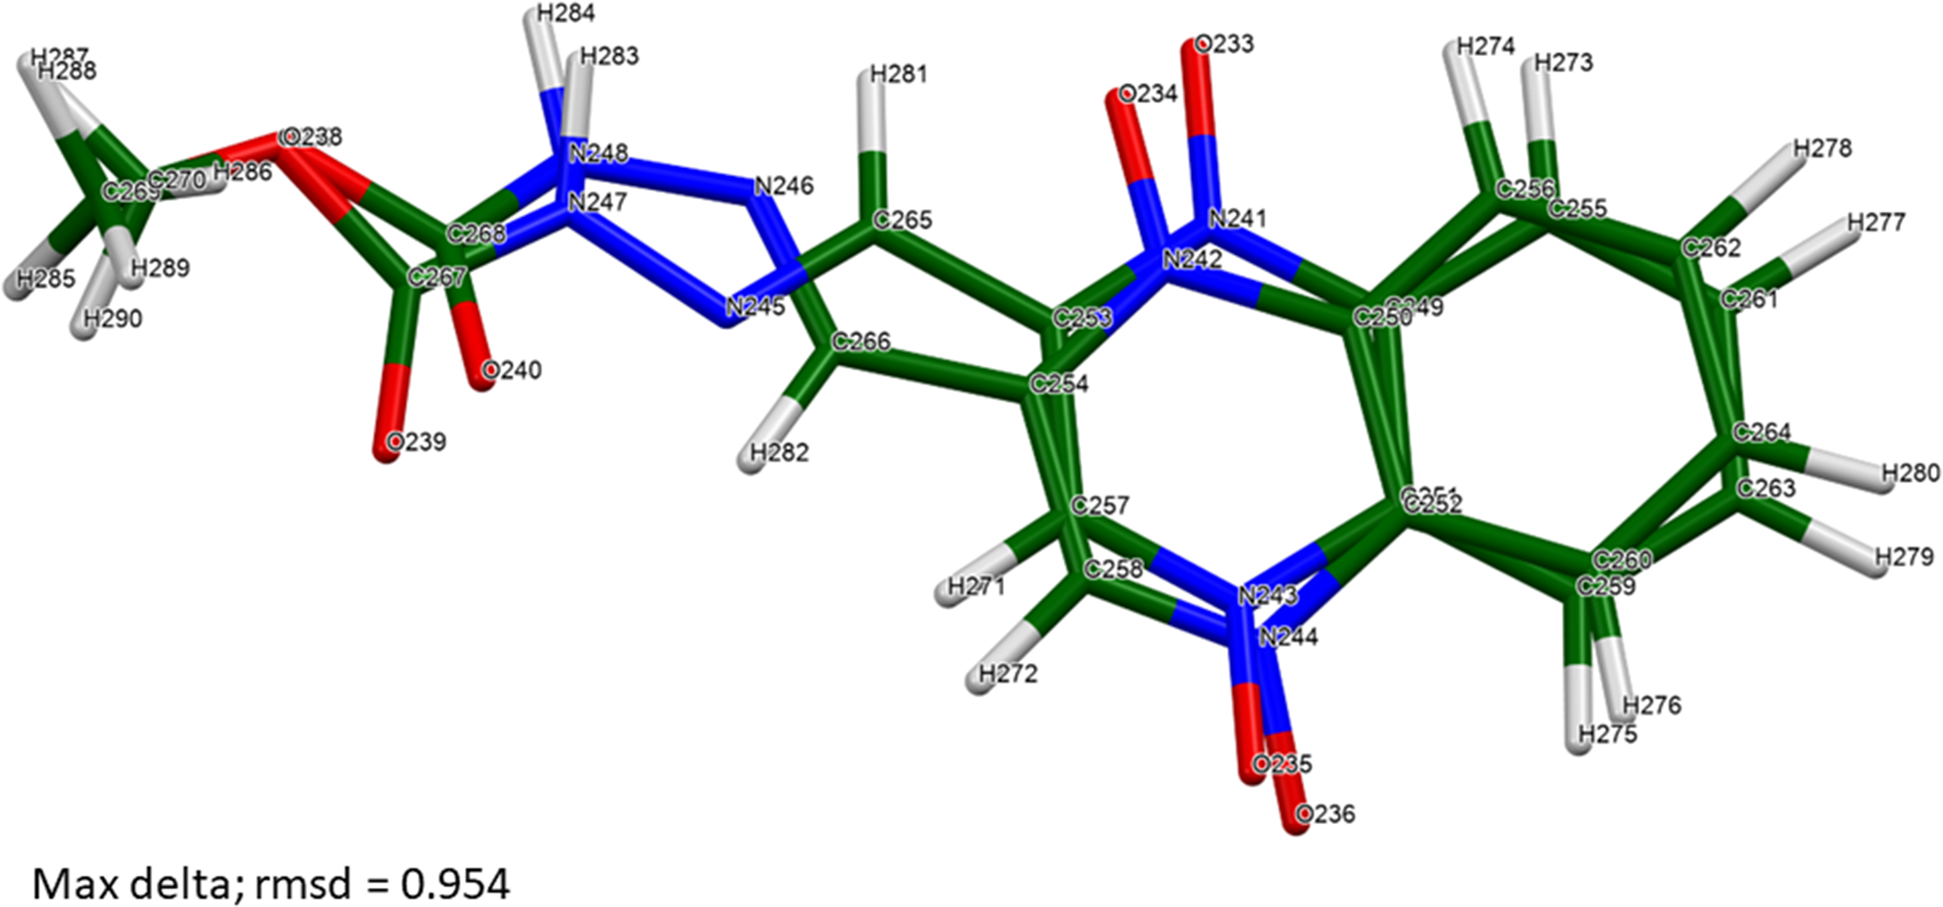
The root-mean-square Cartesian displacements between the Rietveld-refined and DFT-optimized molecules lie partly within and partly outside the normal range for correct structures (Table II; van de Streek and Neumann, Reference van de Streek and Neumann2014). The best agreement (root mean square displacement (rmsd) = 0.187 Å) is for molecule 6 (Figure 4), and the worst is for molecule 3 (rmsd = 0.601 Å; Figure 5). The refinement of a very large number of parameters using relatively limited data on an oriented specimen almost certainly means that the refined structure is less accurate and less precise than usual, so such disagreements are to be expected. As expected, the side chains of the carbadox molecules deviate the most from the overall molecular plane. There is the possibility of tautomerism in the carbadox molecule, and there might be more than one tautomer coexisting in the crystalline form. The remaining discussion will focus on the DFT-optimized structure, as it is likely more accurate. The asymmetric unit is illustrated in Figure 6.
Root-mean-square Cartesian displacements between the Rietveld-refined and DFT-optimized structures of carbadox molecules.

The best agreement (molecule 6) between the Rietveld-refined and DFT-optimized structures of a carbadox molecule. Image generated using Mercury (Macrae et al., Reference Macrae, Sovago, Cottrell, Galek, McCabe, Pidcock, Platings, Shields, Stevens, Towler and Wood2020).
The worst agreement (molecule 3) between the Rietveld-refined and DFT-optimized structures of a carbadox molecule. Image generated using Mercury (Macrae et al., Reference Macrae, Sovago, Cottrell, Galek, McCabe, Pidcock, Platings, Shields, Stevens, Towler and Wood2020).

The asymmetric unit of carbadox. Image generated using Mercury (Macrae et al., Reference Macrae, Sovago, Cottrell, Galek, McCabe, Pidcock, Platings, Shields, Stevens, Towler and Wood2020).

The eight independent molecules vary in conformation (Table III). The best, average, and worst agreements are illustrated in Figures 7–9.
The two carbadox molecules (7 and 8) are most similar. Image generated using Mercury (Macrae et al., Reference Macrae, Sovago, Cottrell, Galek, McCabe, Pidcock, Platings, Shields, Stevens, Towler and Wood2020).

The two molecules (5 and 6) represent the average similarity between carbadox molecules. Image generated using Mercury (Macrae et al., Reference Macrae, Sovago, Cottrell, Galek, McCabe, Pidcock, Platings, Shields, Stevens, Towler and Wood2020).

The two carbadox molecules (4 and 5) are most different. Image generated using Mercury (Macrae et al., Reference Macrae, Sovago, Cottrell, Galek, McCabe, Pidcock, Platings, Shields, Stevens, Towler and Wood2020).
Root-mean-square Cartesian displacements (Å) between the independent carbadox molecules in the DFT-optimized structure.

The crystal structure is characterized by roughly parallel stacking of the carbadox molecules parallel to the bc-plane (Figure 10). The hydrogen bonds (discussed below) link the molecules both within and between the planes. The Mercury Aromatics Analyser indicates two moderate interactions with distances of 3.79 and 5.81 Å between molecules 2/4 and 1/4, respectively, and eight weaker interactions with longer distances.
The crystal structure of carbadox, viewed down the c-axis. Image generated using Diamond (Crystal Impact, 2022).

Almost all of the bond distances, bond angles, and torsion angles fall within the normal ranges indicated by a Mercury Mogul Geometry check (Macrae et al., Reference Macrae, Sovago, Cottrell, Galek, McCabe, Pidcock, Platings, Shields, Stevens, Towler and Wood2020). Two of the N=N double bonds (N16–N14 = 1.331 Å, average = 1.377(12) Å, Z-score = 3.7 and N74–N72 = 1.339 Å, Z-score = 3.0) are flagged as unusual. The angles between the side chain and the ring system (C33–C21–N9 and equivalents) range from 117.1 to 125.8° and are all flagged as unusual. The average angle for this type is 120.3(3)°, but the population is small. The standard deviation on the average is exceptionally small, resulting in inflated Z-scores ranging from 6.1 to 14.0. Some of the torsion angles between the ring system and the side chain (N13–C33–C21–N9 and equivalents) are flagged as unusual but with few hits. Some of the N–N torsion angles (C268–N248–N246–C266 and equivalents) are also flagged as unusual. The carbadox molecule is indeed fairly unusual.
Quantum chemical geometry optimization of the isolated individual molecules (DFT/B3LYP/6-31G*/water) using Spartan ‘20 (Wavefunction, 2022) indicated that there are two configurations of carbadox molecules (Figure 11) that are related by an approximate 180° rotation about the C–C bond between the ring system and the side chain: molecules 1–5 and molecules 6–8. Molecules 6–8 are approximately 6.3 kcal/mol higher in energy than the other configuration. The local minimum-energy molecules are all planar, while the ones in the crystal structure deviate significantly from planarity.
Molecules 1 and 8 illustrate the two different configurations of the carbadox molecule.

Hydrogen bonds are prominent in the crystal structure (Table IV). Each of the amino groups (the only classical donor in the molecule) forms a N–H⋯O hydrogen bond to an oxygen atom of the 1,4-dioxidoquinoxaline ring system of another molecule. The result is four pairs of hydrogen-bonded molecules, which form rings with graph set R2,2(14) (Etter, Reference Etter1990; Bernstein et al., Reference Bernstein, Davis, Shimoni and Chang1995; Shields et al., Reference Shields, Raithby, Allen and Motherwell2000) (Figures 12–15). These hydrogen-bonded pairs (molecules 1/5, 2/6, 3/8, 4/7) lie in the planes of the ring stacking. There are a variety of intra- and intermolecular C–H⋯O and C–H⋯N hydrogen bonds. The intermolecular ones link the molecules perpendicular to the stacking planes.
The hydrogen bonds between molecules 1 and 5. Image generated using Mercury (Macrae et al., Reference Macrae, Sovago, Cottrell, Galek, McCabe, Pidcock, Platings, Shields, Stevens, Towler and Wood2020).

The hydrogen bonds between molecules 2 and 6. Image generated using Mercury (Macrae et al., Reference Macrae, Sovago, Cottrell, Galek, McCabe, Pidcock, Platings, Shields, Stevens, Towler and Wood2020).

The hydrogen bonds between molecules 3 and 8. Image generated using Mercury (Macrae et al., Reference Macrae, Sovago, Cottrell, Galek, McCabe, Pidcock, Platings, Shields, Stevens, Towler and Wood2020).

The hydrogen bonds between molecules 4 and 7. Image generated using Mercury (Macrae et al., Reference Macrae, Sovago, Cottrell, Galek, McCabe, Pidcock, Platings, Shields, Stevens, Towler and Wood2020).

Hydrogen bonds (CRYSTAL23) in carbadox.

a Intramolecular.
The Bravais–Friedel–Donnay–Harker (BFDH; Bravais, Reference Bravais1866; Friedel, Reference Friedel1907; Donnay and Harker, Reference Donnay and Harker1937) morphology suggests a slightly platy morphology for carbadox, with {001} as major faces, suggesting the possibility of preferred orientation. A 6th-order spherical harmonic preferred orientation model was included in the refinement. The refined texture index was 1.145, indicating that the preferred orientation was significant in this rotated capillary specimen. The distribution of the 001 axis is consistent with this picture (Figure 16), but the texture is more complex than a simple platy model (Figure 17). Other mountings of carbadox specimens yielded even greater preferred orientation (Figure 18 and Table V).
The BFDH crystal morphology of carbadox. The red, green, and blue unit cell edges are the a-, b-, and c-axes, respectively. Image generated using Mercury (Macrae et al., Reference Macrae, Sovago, Cottrell, Galek, McCabe, Pidcock, Platings, Shields, Stevens, Towler and Wood2020).

The axial distribution of the 001 vector in the capillary specimen of carbadox.

Variation in texture with different specimen preparations (see Table V for specimen mounting methods). The colors of the file names in the upper right match those of the diffraction patterns. The laboratory patterns have been converted to the synchrotron wavelength using JADE Pro. Image generated using JADE Pro (MDI, 2023).

Texture indices in carbadox specimens.

IV. DEPOSITED DATA
The powder pattern of carbadox from this synchrotron data set has been submitted to ICDD for inclusion in the Powder Diffraction File. The Crystallographic Information Framework (CIF) files containing the results of the Rietveld refinement (including the raw data) and the DFT geometry optimization were deposited with the ICDD. The data can be requested at pdj@icdd.com.
ACKNOWLEDGEMENTS
The use of the Advanced Photon Source at Argonne National Laboratory was supported by the U. S. Department of Energy, Office of Science, Office of Basic Energy Sciences under Contract No. DE-AC02-06CH11357. This work was partially supported by the International Centre for Diffraction Data. We thank Lynn Ribaud and Saul Lapidus for their assistance in the data collection.
CONFLICTS OF INTEREST
The authors have no conflicts of interest to declare.


 Open access