


The current study is based on field observations of coastal processes of movement and subsidence that affect the mudflat sediments on the receding western Dead Sea shore and the development of subsidence features – subsidence strips and clustered sinkholes – in the exposed mudflats. The present study continues a preliminary study of the properties of clayey sediments of the exposed mudflats based on laboratory analyses (Shoval, Reference Shoval2023).
The rapid dropping of the Dead Sea level in recent decades represents an interesting case of the impacts of sea-level retreat on coastal processes. The coastal environment is sensitive to changes in sea level and their impacts on coastal processes, in particular on coastal landslides (Budetta et al., Reference Budetta, Santo and Vivenzio2008; Vardy et al., Reference Vardy, L’Heureux, Vanneste, Longva, Steiner and Forsberg2012; Devoto et al., Reference Devoto, Biolchi, Bruschi, Díez, Mantovani, Pasuto, Margottini, Canuti and Sassa2013; Leshchinsky et al., Reference Leshchinsky, Olsen, Mohney, Glover-Cutter, Crook, Allan and Mathews2017; Chacón et al., Reference Chacón, Alameda-Hernández, Chacón, Delgado, El and Fernández2019; Soldati et al., Reference Soldati, Devoto, Prampolini, Pasuto, Gauci and Schembri2019). Climate-related sea-level changes have recently received increased attention due to global warming and the impacts of climate change on coastal landslides (Jakob & Lambert, Reference Jakob and Lambert2009; Doi et al., Reference Doi, Matsuura, Osawa, Shibasaki and Tosa2020; Alberti et al., Reference Alberti, Olsen, Allan and Leshchinsky2022). Effects of human activity on coastal landslides and subsidence have also been recorded (Notti et al., Reference Nott, Galve, Mateos, Monserrat, Lamas-Fernández and Fernández-Chacón2015; Candela & Koster, Reference Candela and Koster2022).
The retreat at the western Dead Sea shore has exposed littoral sediments and mudflats on the shore (Arkin & Gilat, Reference Arkin and Gilat2000) and caused land subsidence (Baer et al., Reference Baer, Schattner, Wachs, Sandwell, Wdowinski and Frydman2002, Reference Baer, Gavrieli, Swaed and Nof2024; Abelson et al., Reference Abelson, Baer, Shtivelman, Wachs, Raz and Crouvi2003, Reference Abelson, Yechieli, Crouvi, Baer, Wachs, Bein, Shtivelman, Enzel, Agnon and Stein2006, Reference Abelson, Aksinenko, Kurzon, Pinsky, Baer, Nof and Yechieli2018; Nof et al., Reference Nof, Baer, Ziv, Raz, Atzori and Salvi2013, Reference Nof, Abelson, Raz, Magen, Atzori, Salvi and Baer2019; Yechieli et al., Reference Yechieli, Abelson and Baer2016; Shviro et al., Reference Shviro, Haviv and Baer2017) and the emergence of clustered sinkholes (Yechieli et al., Reference Yechieli, Abelson, Bein, Crouvi and Shtivelman2006; Frumkin et al., Reference Frumkin, Ezersky, Al-Zoubi, Akkawi and Abueladas2011; Abelson et al., Reference Abelson, Yechieli and Baer2017a; Ezersky et al., Reference Ezersky, Legchenko, Eppelbaum and Al-Zoubi2017; Abelson, Reference Abelson, Kafri and Yechieli2021). Coastal processes and the formation of sinkholes have also been reported from the eastern Dead Sea shore (Taqieddin et al., Reference Taqieddin, Abderahman and Atallah2000; Closson, Reference Closson2005; Closson et al., Reference Closson, Abou-Karaki, Klinger and Jad Hussein2005; Closson & Abou-Karaki, Reference Closson and Abou-Karaki2009a,Reference Closson and Abou-Karakib; Al-Halbouni et al., Reference Al-Halbouni, Holohan, Saberi, Alrshdan, Sawarieh and Closson2017, Reference Al-Halbouni, Holohan, Taheri, Watson, Polom and Schöpfer2019; Watson et al., Reference Watson, Holohan, Al-Halbouni, Saberi, Sawarieh and Closson2019).
Most previous work on the subsidence features at the western Dead Sea shore has been focused on the emergence of sinkholes (most recently by Ezersky & Frumkin, Reference Ezersky and Frumkin2020, Reference Ezersky and Frumkin2021; Abelson, Reference Abelson, Kafri and Yechieli2021). The present study expands on the coastal processes of movement and subsidence that affect the clayey sediments of the exposed mudflats on the receding western Dead Sea shore and on the development of subsidence strips – narrow subsidence strips with/without clustered sinkholes and wide subsidence strips with clustered sinkholes – in the exposed mudflats. The properties of the mudflat sediments that promote movement and subsidence and the development of the subsidence features are considered.
The current study also examines the extension of subsidence features in exposed mudflats. The arrangement of the clustered sinkholes on the western Dead Sea shore (Abelson et al., Reference Abelson, Yechieli and Baer2017a) is attributed to subsidence of the sediments along lineaments (Ezersky & Frumkin, Reference Ezersky and Frumkin2013), tracking the existing tectonic faults of the Dead Sea Rift along the Dead Sea shore (Abelson et al., Reference Abelson, Baer, Shtivelman, Wachs, Raz and Crouvi2003, Reference Abelson, Yechieli, Crouvi, Baer, Wachs, Bein, Shtivelman, Enzel, Agnon and Stein2006; Yechieli et al., Reference Yechieli, Abelson, Wachs, Shtivelman, Crouvi, Baer, Yuhr, Alexander and Beck2003, Reference Yechieli, Abelson, Bein, Crouvi and Shtivelman2006, Reference Yechieli, Abelson and Baer2016). However, doubts have recently been raised regarding the connection between the formation of clustered sinkholes and fault lines. These doubts are based on the understanding that the sinkhole sites on the Dead Sea shore often appear at the boundary of the subsurface rock–salt layer (Ezersky & Frumkin, Reference Ezersky and Frumkin2013; Abelson et al., Reference Abelson, Yechieli and Baer2017a). Although a large number of faults have crossed the Dead Sea shore (Garfunkel, Reference Garfunkel1981), sinkholes are usually developed in a single narrow strip 50–100 m wide, approximately parallel to the Dead Sea shore (Ezersky et al., Reference Ezersky, Legchenko, Eppelbaum and Al-Zoubi2017). In addition, the fault escarpments and cracks in the Dead Sea coastal area resemble in appearance the surface expressions of landslides (Baer et al., Reference Baer, Schattner, Wachs, Sandwell, Wdowinski and Frydman2002). The occurrence of landslides due to lake-level lowering has been reported from the eastern Dead Sea shore by Closson et al. (Reference Closson, Abou-Karaki and Hallot2010), as has the development of sinkholes along tension cracks by Closson & Abou-Karaki (Reference Closson and Abou-Karaki2009b). In the present study, a contribution of slow mass movement seaward to the coastal processes on the receding Dead Sea shore is indicated.
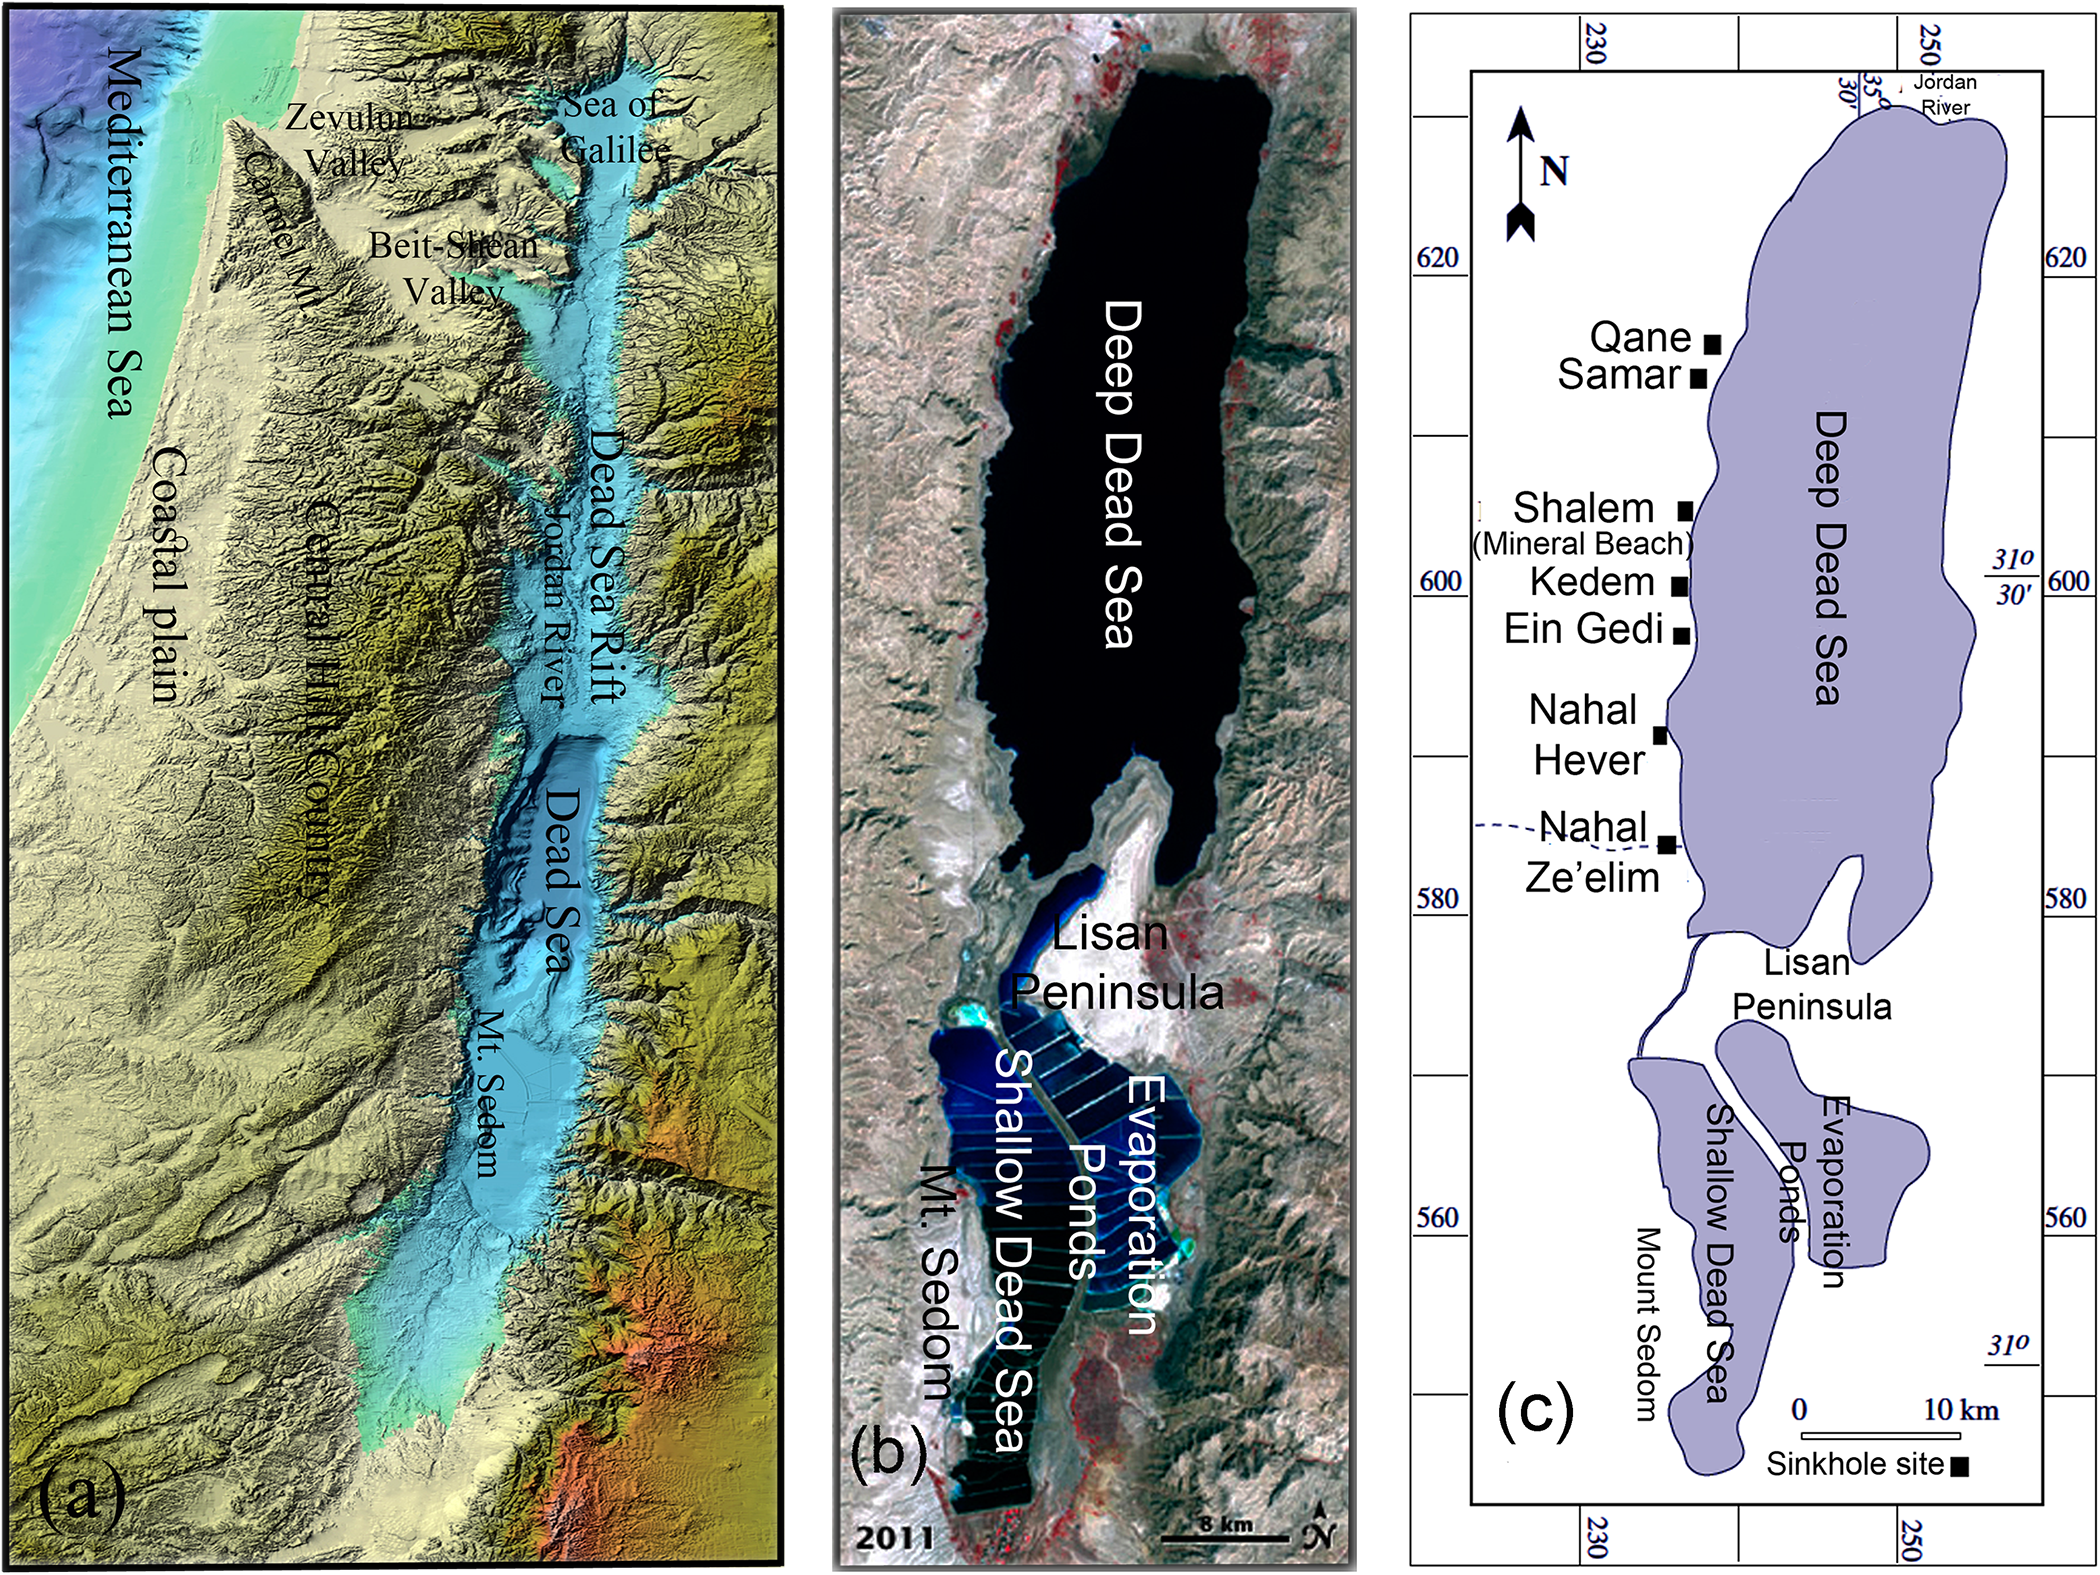
Maps of the Dead Sea region. (a) Location map of the Dead Sea (modified from the digital shaded relief map of the region by Hall & Calvo, Reference Hall and Calvo2005, the Geological Survey of Israel: https://www.gov.il/he/pages/israel-and-regions-aerial-photo-map). (b) Satellite map of the Dead Sea Valley (based on NASA image by Simmon, Reference Simmon2012, using Landsat data from the United States Geological Survey: https://visibleearth.nasa.gov/images/77592/the-dead-sea). (c) Map of the studied sites on the western Dead Sea shore; coordinates on the map are of the new Israel Mercator grid in kilometres.

The clays of the Dead Sea were analysed previously by Nathan et al. (Reference Nathan, Shoval and Sandler1990, Reference Nathan, Shoval and Sandler1992, Reference Nathan, Sandler and Shoval1994) and the clay minerals of the Sedom Formation were analysed previously by Shoval & Zlatkin (Reference Shoval and Zlatkin2009). The geotechnical characteristics of sediments on the western Dead Sea shore have been reported by Ezersky & Livne (Reference Ezersky and Livne2013), and on the eastern Dead Sea shore they have been reported previously by Taqieddin et al. (Reference Taqieddin, Abderahman and Atallah2000), Khlaifat et al. (Reference Khlaifat, Al-Khashman and Qutob2010) and Salameh et al. (Reference Salameh, Alraggad and Amaireh2019). Geotechnical studies of evaporitic-lacustrine sediments in the saline environment of the Dead Sea have been conducted by Frydman et al. (Reference Frydman, Charrach and Goretsky2008, Reference Frydman, Charrach and Goretsky2014). Viscoelastic modelling of sinkhole precursory subsidence along the Dead Sea shore has been proposed previously by Atzori et al. (Reference Atzori, Baer, Antonioli and Salvi2015) and Baer et al. (Reference Baer, Magen, Nof, Raz, Lyakhovsky and Shalev2018).
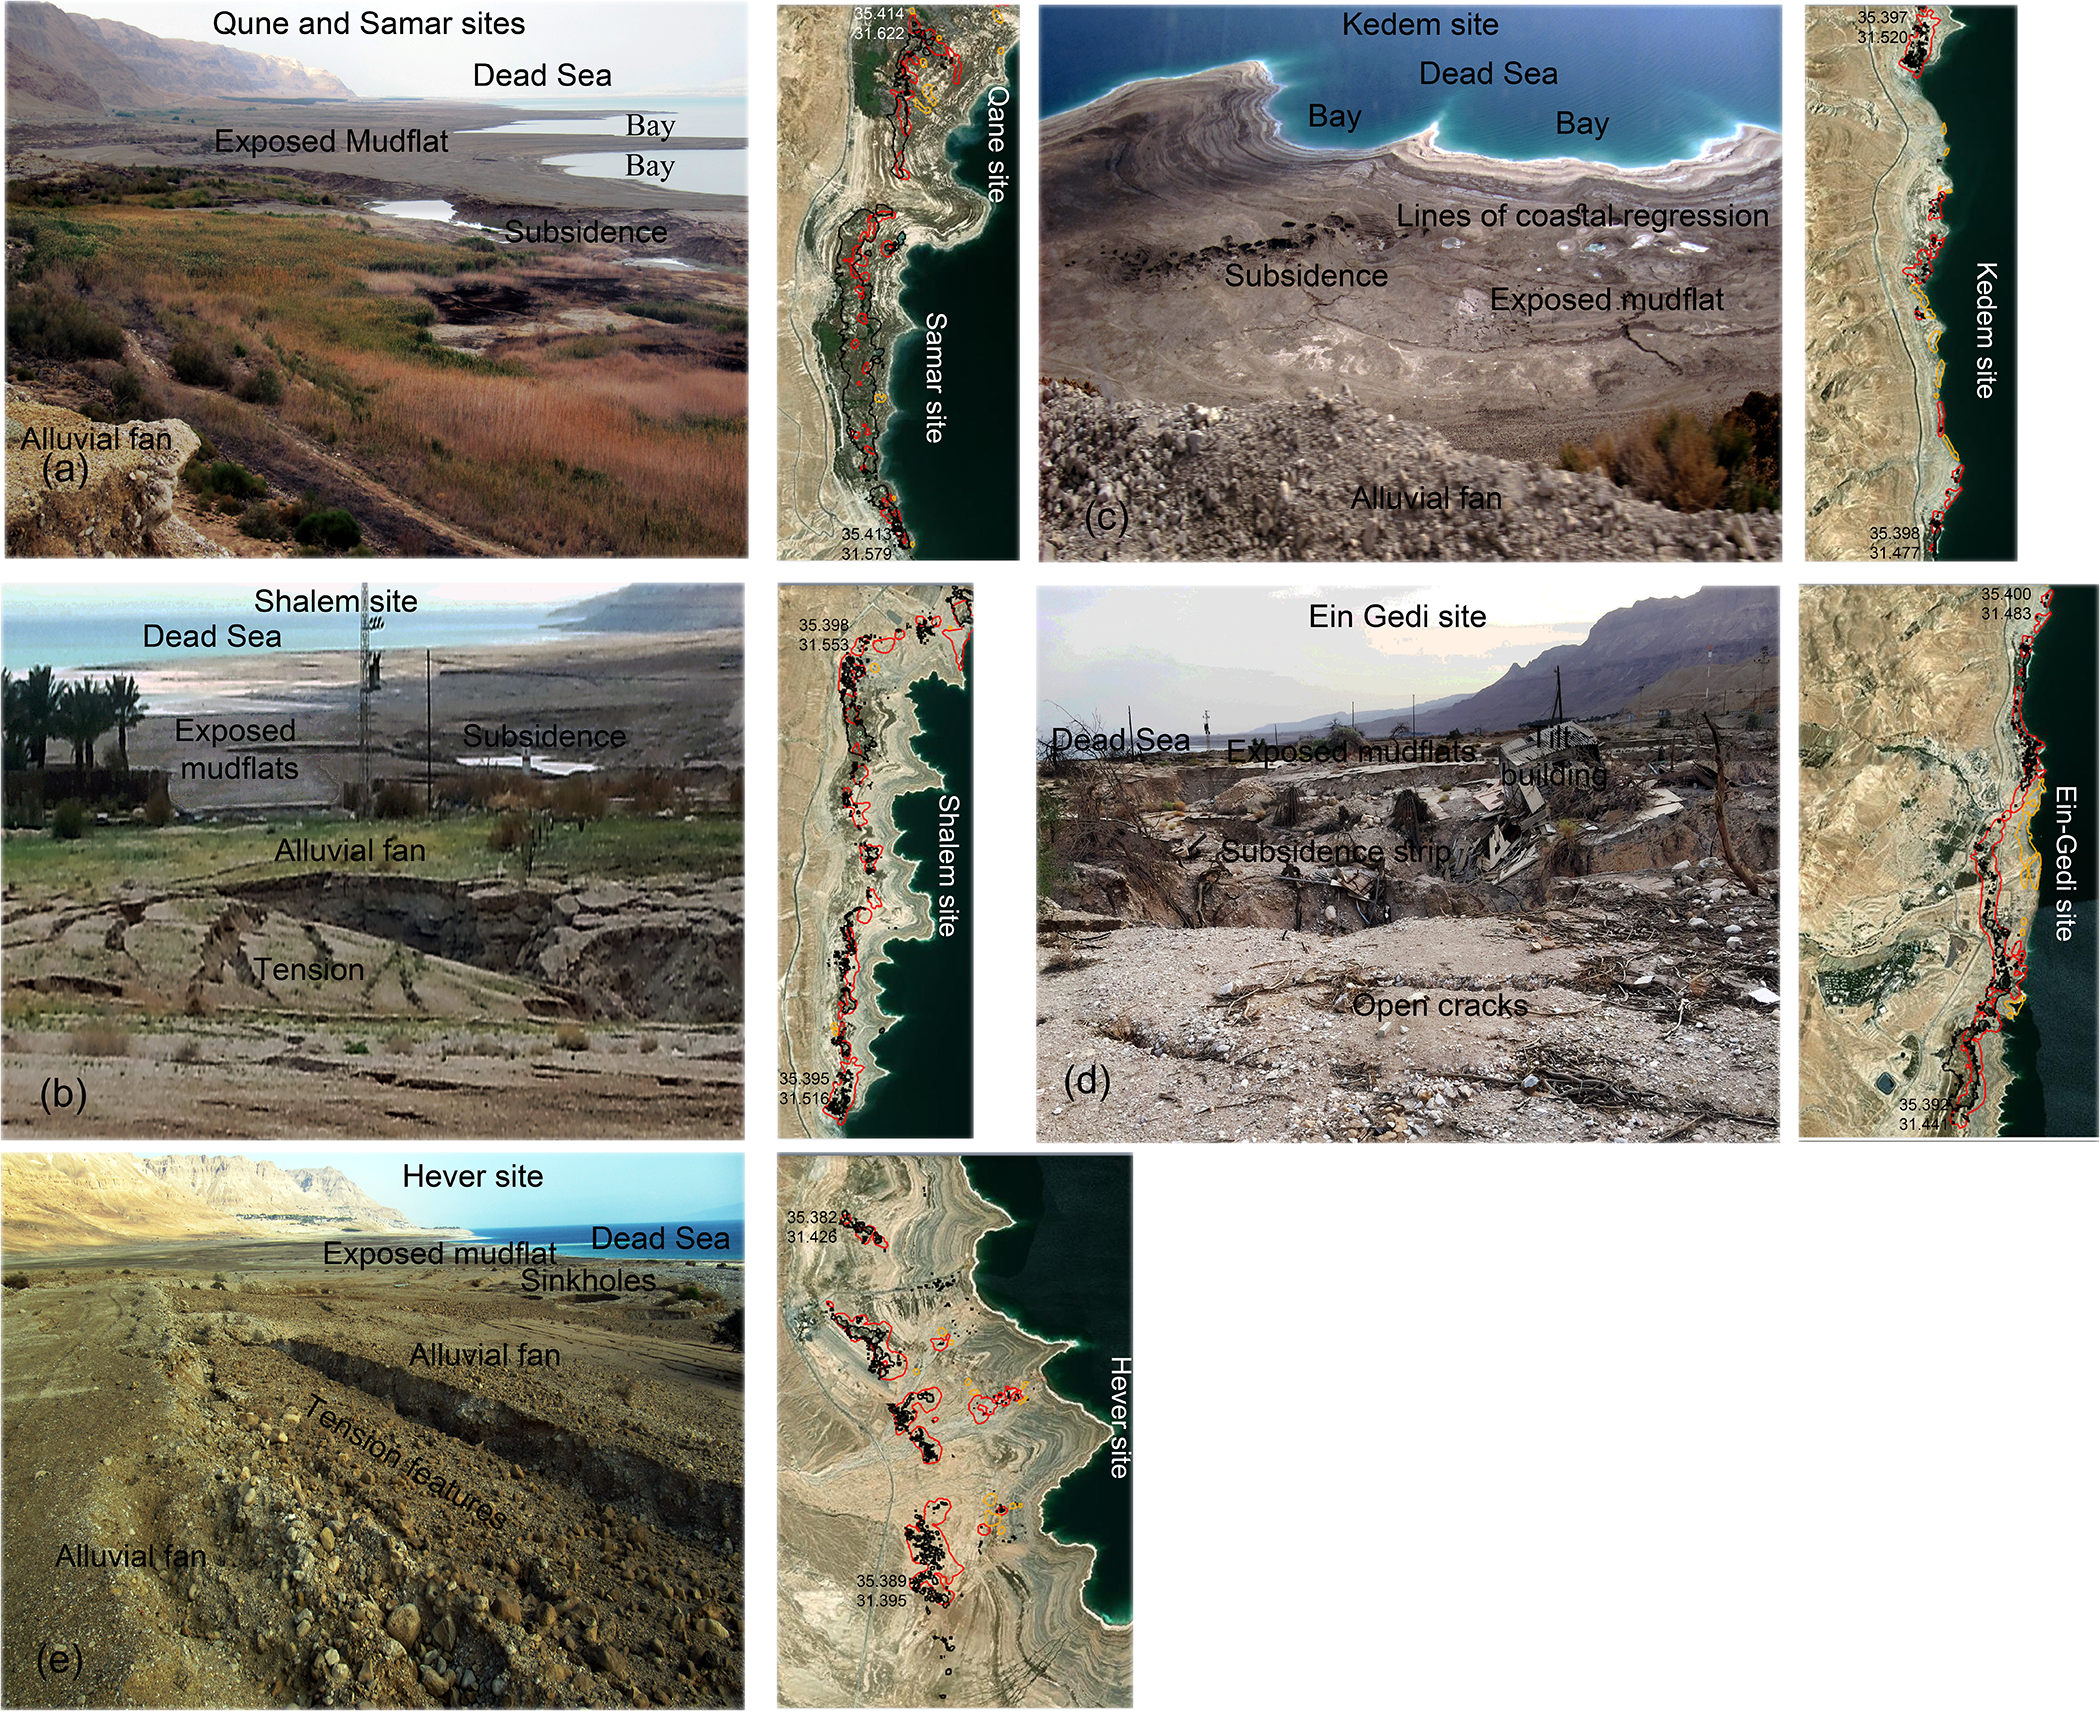
Photographs of the site morphologies and location maps of (a) Samar site, (b) Shalem site, (c) Kedem site, (d) Ein Gedi site and (e) Hever site. The location maps were modified from official maps of the Geological Survey of Israel provided on the website ‘Dead Sea sinkholes and subsidence monitoring’: https://egozi.gsi.gov.il/WebApps/hazards/sinkholes_subsidence/. Coordinates are given on the location maps. The photographs of the site morphologies were taken in the field by the author.

Methodology
Based on field observations, the present study investigates coastal processes of movement and subsidence that affect the mudflat sediments on the receding western Dead Sea shore, and it documents the development of subsidence features – subsidence strips and clustered sinkholes – in the exposed mudflats. The laboratory analyses of the clayey sediments of the exposed mudflats were performed in a preliminary study (Shoval, Reference Shoval2023) and are summarized in the ‘Results’ section below. Official data published by the Geological Survey of Israel were also utilized.
The studied area on the western Dead Sea shore
The Dead Sea is located in the Dead Sea Basin, which is part of the Dead Sea Rift (Fig. 1a). This sea is a hypersaline terminal desert lake that terminates the drainage system of the Jordan River (Fig. 1a). The Dead Sea level is the lowest exposed place on Earth’s continents, currently ∼440 m below mean sea or ocean level (BMSL). The lake fills the deep northern Dead Sea basin ‘Deep Dead Sea’ (Fig. 1b), with the deepest underwater point being ∼730 m BMSL; and the shallow southern part ‘Shallow Dead Sea’ (Fig. 1b), separated by the Lisan Peninsula, is occupied by evaporation ponds (Neev & Hall, Reference Neev and Hall1979). The studied sites are located on the western shore of the Deep Dead Sea (Fig. 1c).
Sites morphology and location maps
The fieldwork was carried out at the Samar, Shalem, Kedem, Ein Gedi and Hever sites on the western Dead Sea shore (Fig. 1c). The studied sites are located within a 50 km-long and 1 km-wide strip along the shore. Photographs of the site morphologies and location maps are shown in Fig. 2.
Results
Field observations at the studied sites
The field observations document coastal processes of movement and subsidence and the formation of subsidence features at the studied sites on the receding western Dead Sea shore.
Features of receding on the western Dead Sea shore
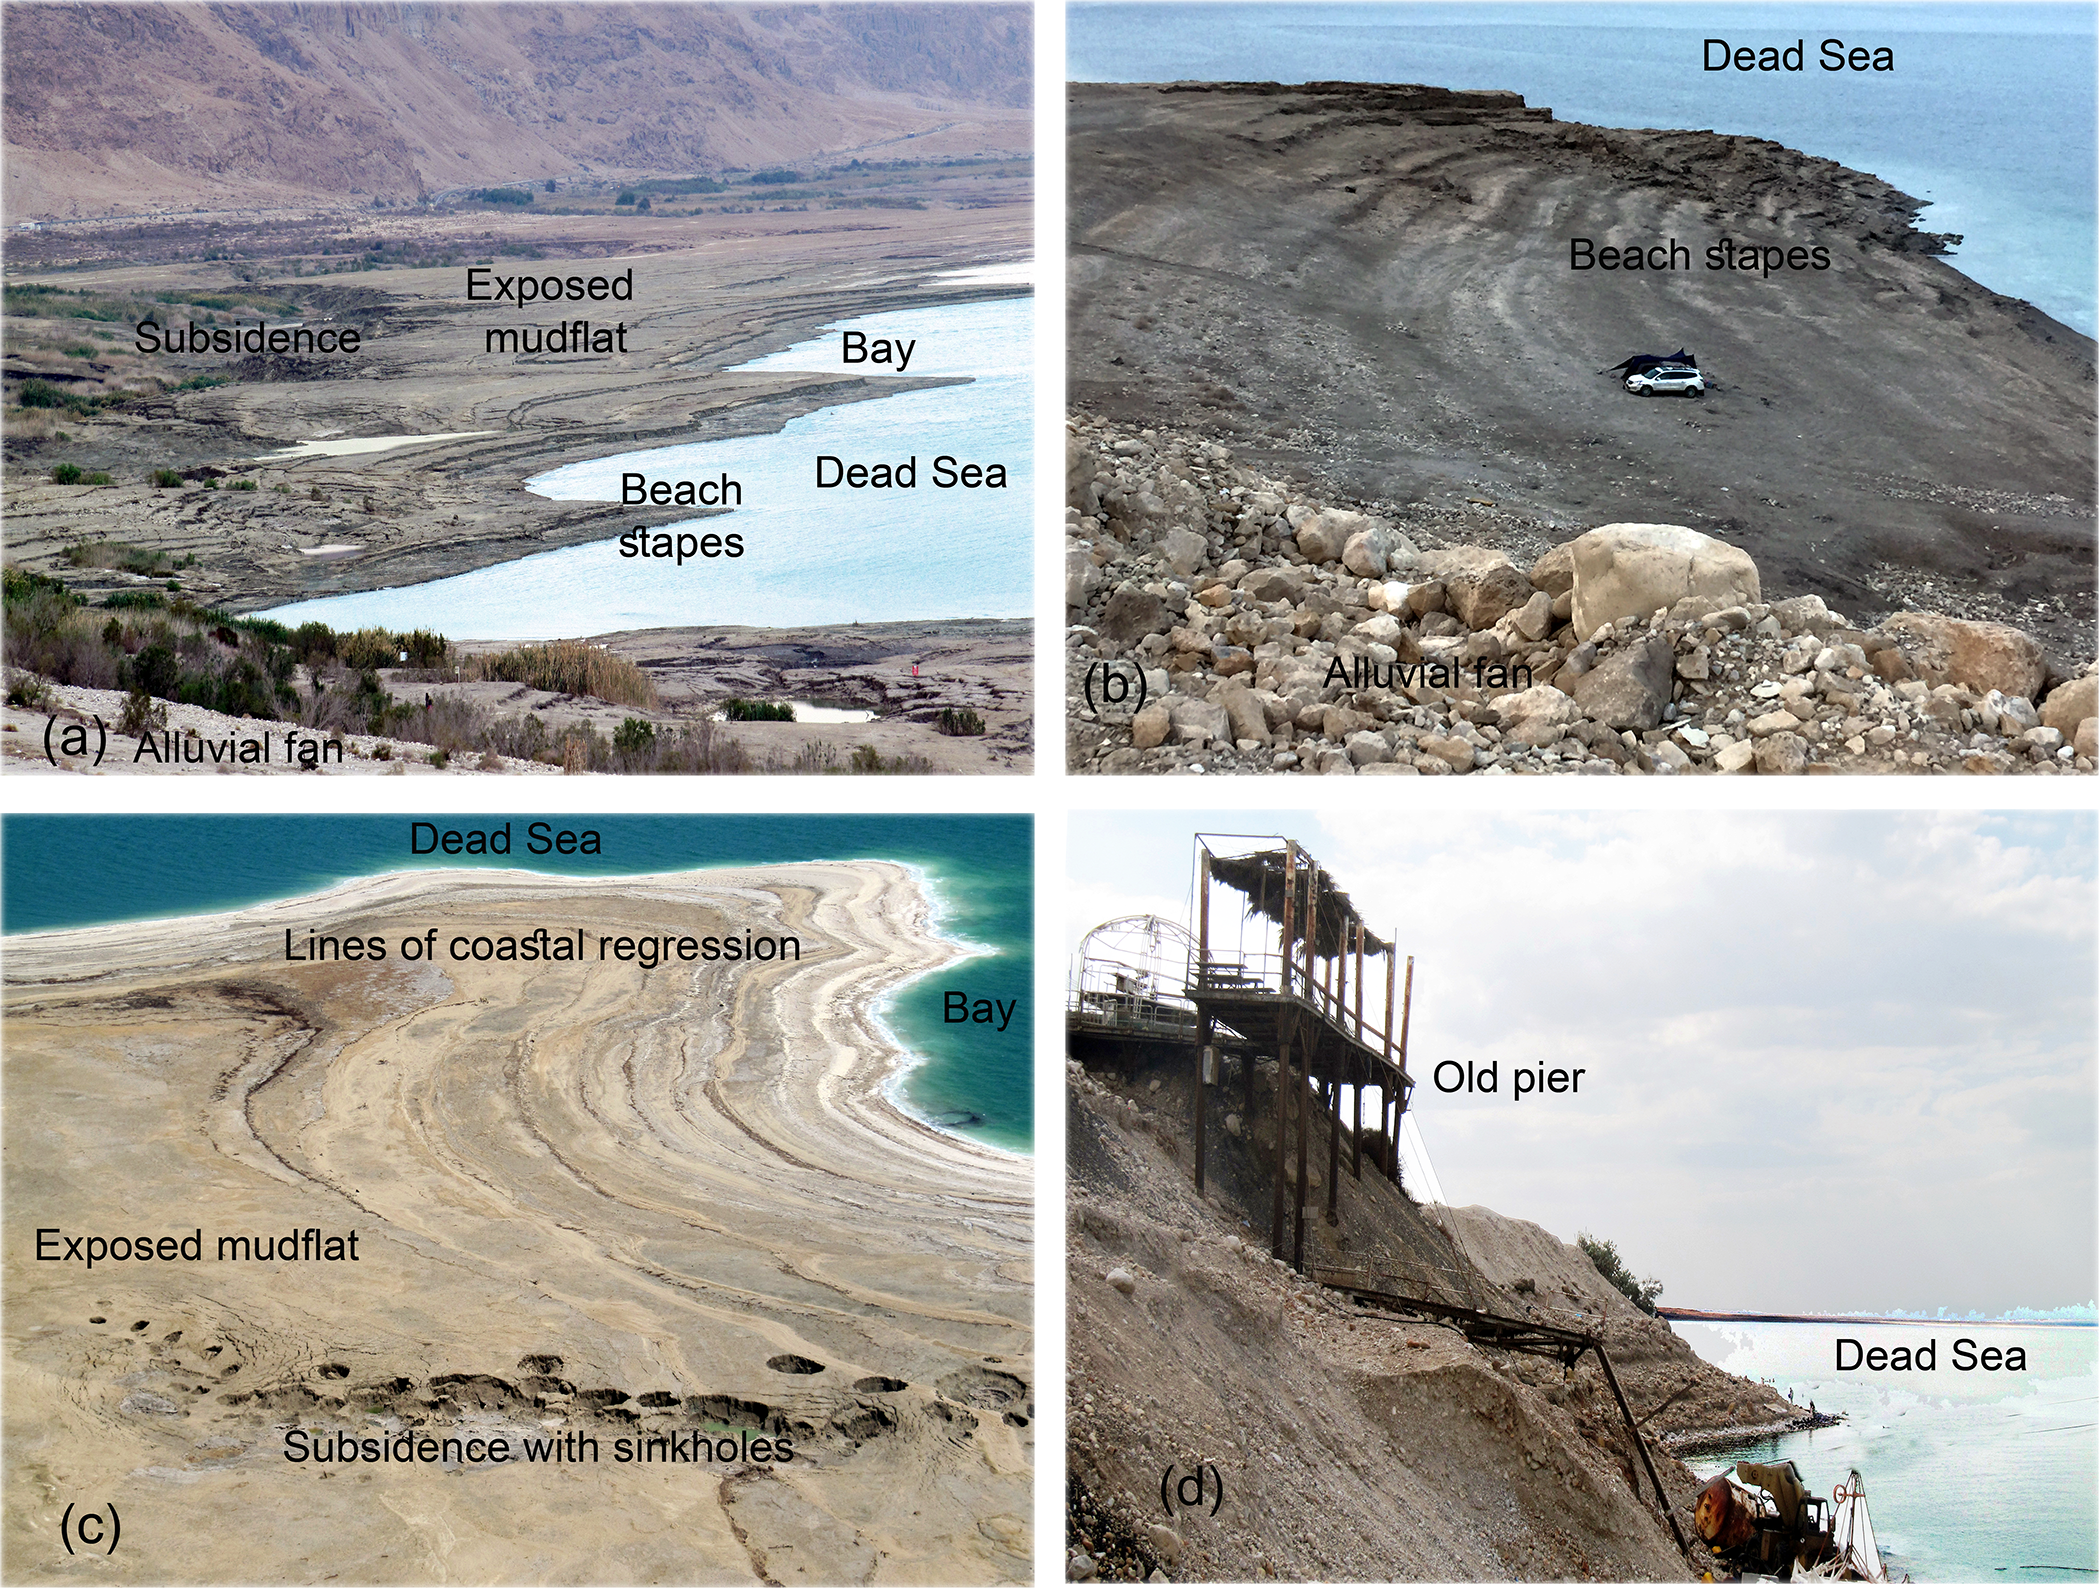
The progressive retreat of the Dead Sea is evident by the exposure of mudflats (Fig. 3a), the formation of beach stapes and lines of coastal regression (Fig. 3b,c). The coastal receding is marked by the disintegration of an old pier from the current beach(Fig. 3d).
Features of receding on the western Dead Sea shore. (a) Exposure of mudflats. (b) Beach stapes in an exposed mudflat (Kedem site). (c) Lines of coastal regression in an exposed mudflat (Kedem site). (d) Disintegration of an old pier from the current beach (Ein Gedi site).

Main geomorphic features at the studied sites
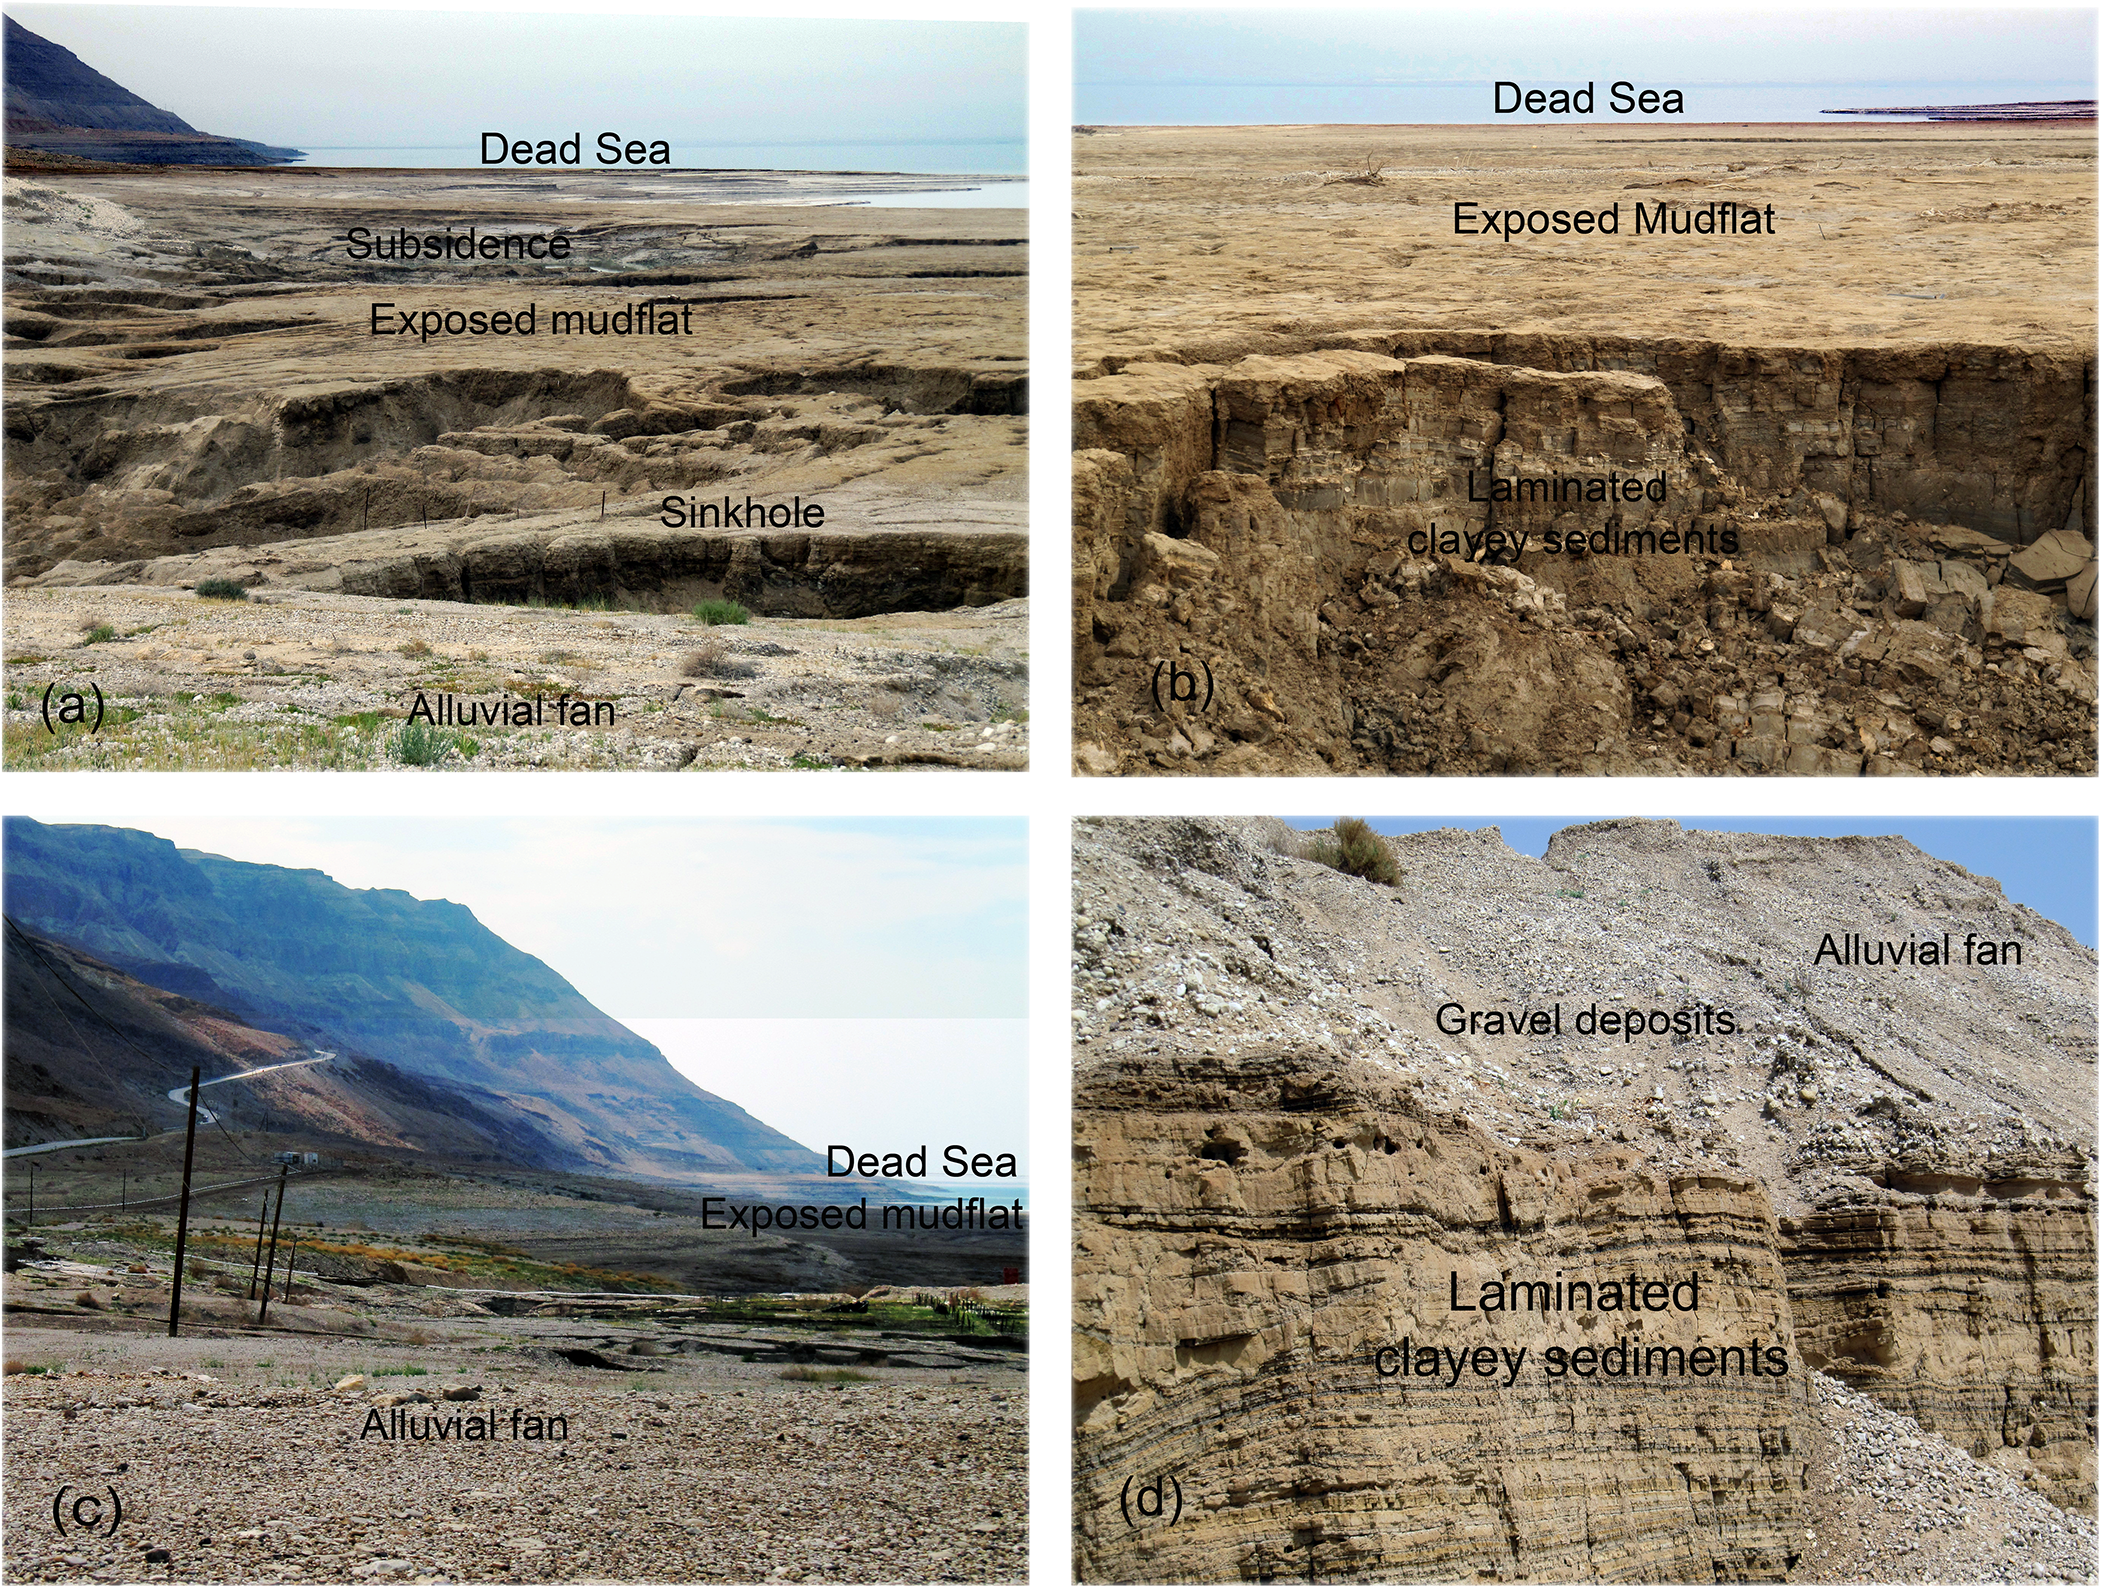
The main geomorphic features at the studied sites are exposed mudflats and alluvial fans (Fig. 4). The exposed mudflats with subsidence features are generally located at the lower Dead Sea shore closer to the coastline (Fig. 4a). The mudflats contain laminated clayey sediments (Fig. 4b). The alluvial fans are generally located on the higher Dead Sea shore (Fig. 4c). Gravel deposits of the alluvial fans overlie the mudflat sediments (Fig. 4d).
Main geomorphic features at the studied sites. (a) Exposed mudflats with subsidence features (Shalem site). (b) Mudflat sediments containing laminated clayey sediments (Shalem site). (c) Alluvial fans on the higher Dead Sea shore (Shalem site). (d) Gravel deposits of the alluvial fan overlying the mudflat sediments (Hevar site).

Subsidence features in exposed mudflats
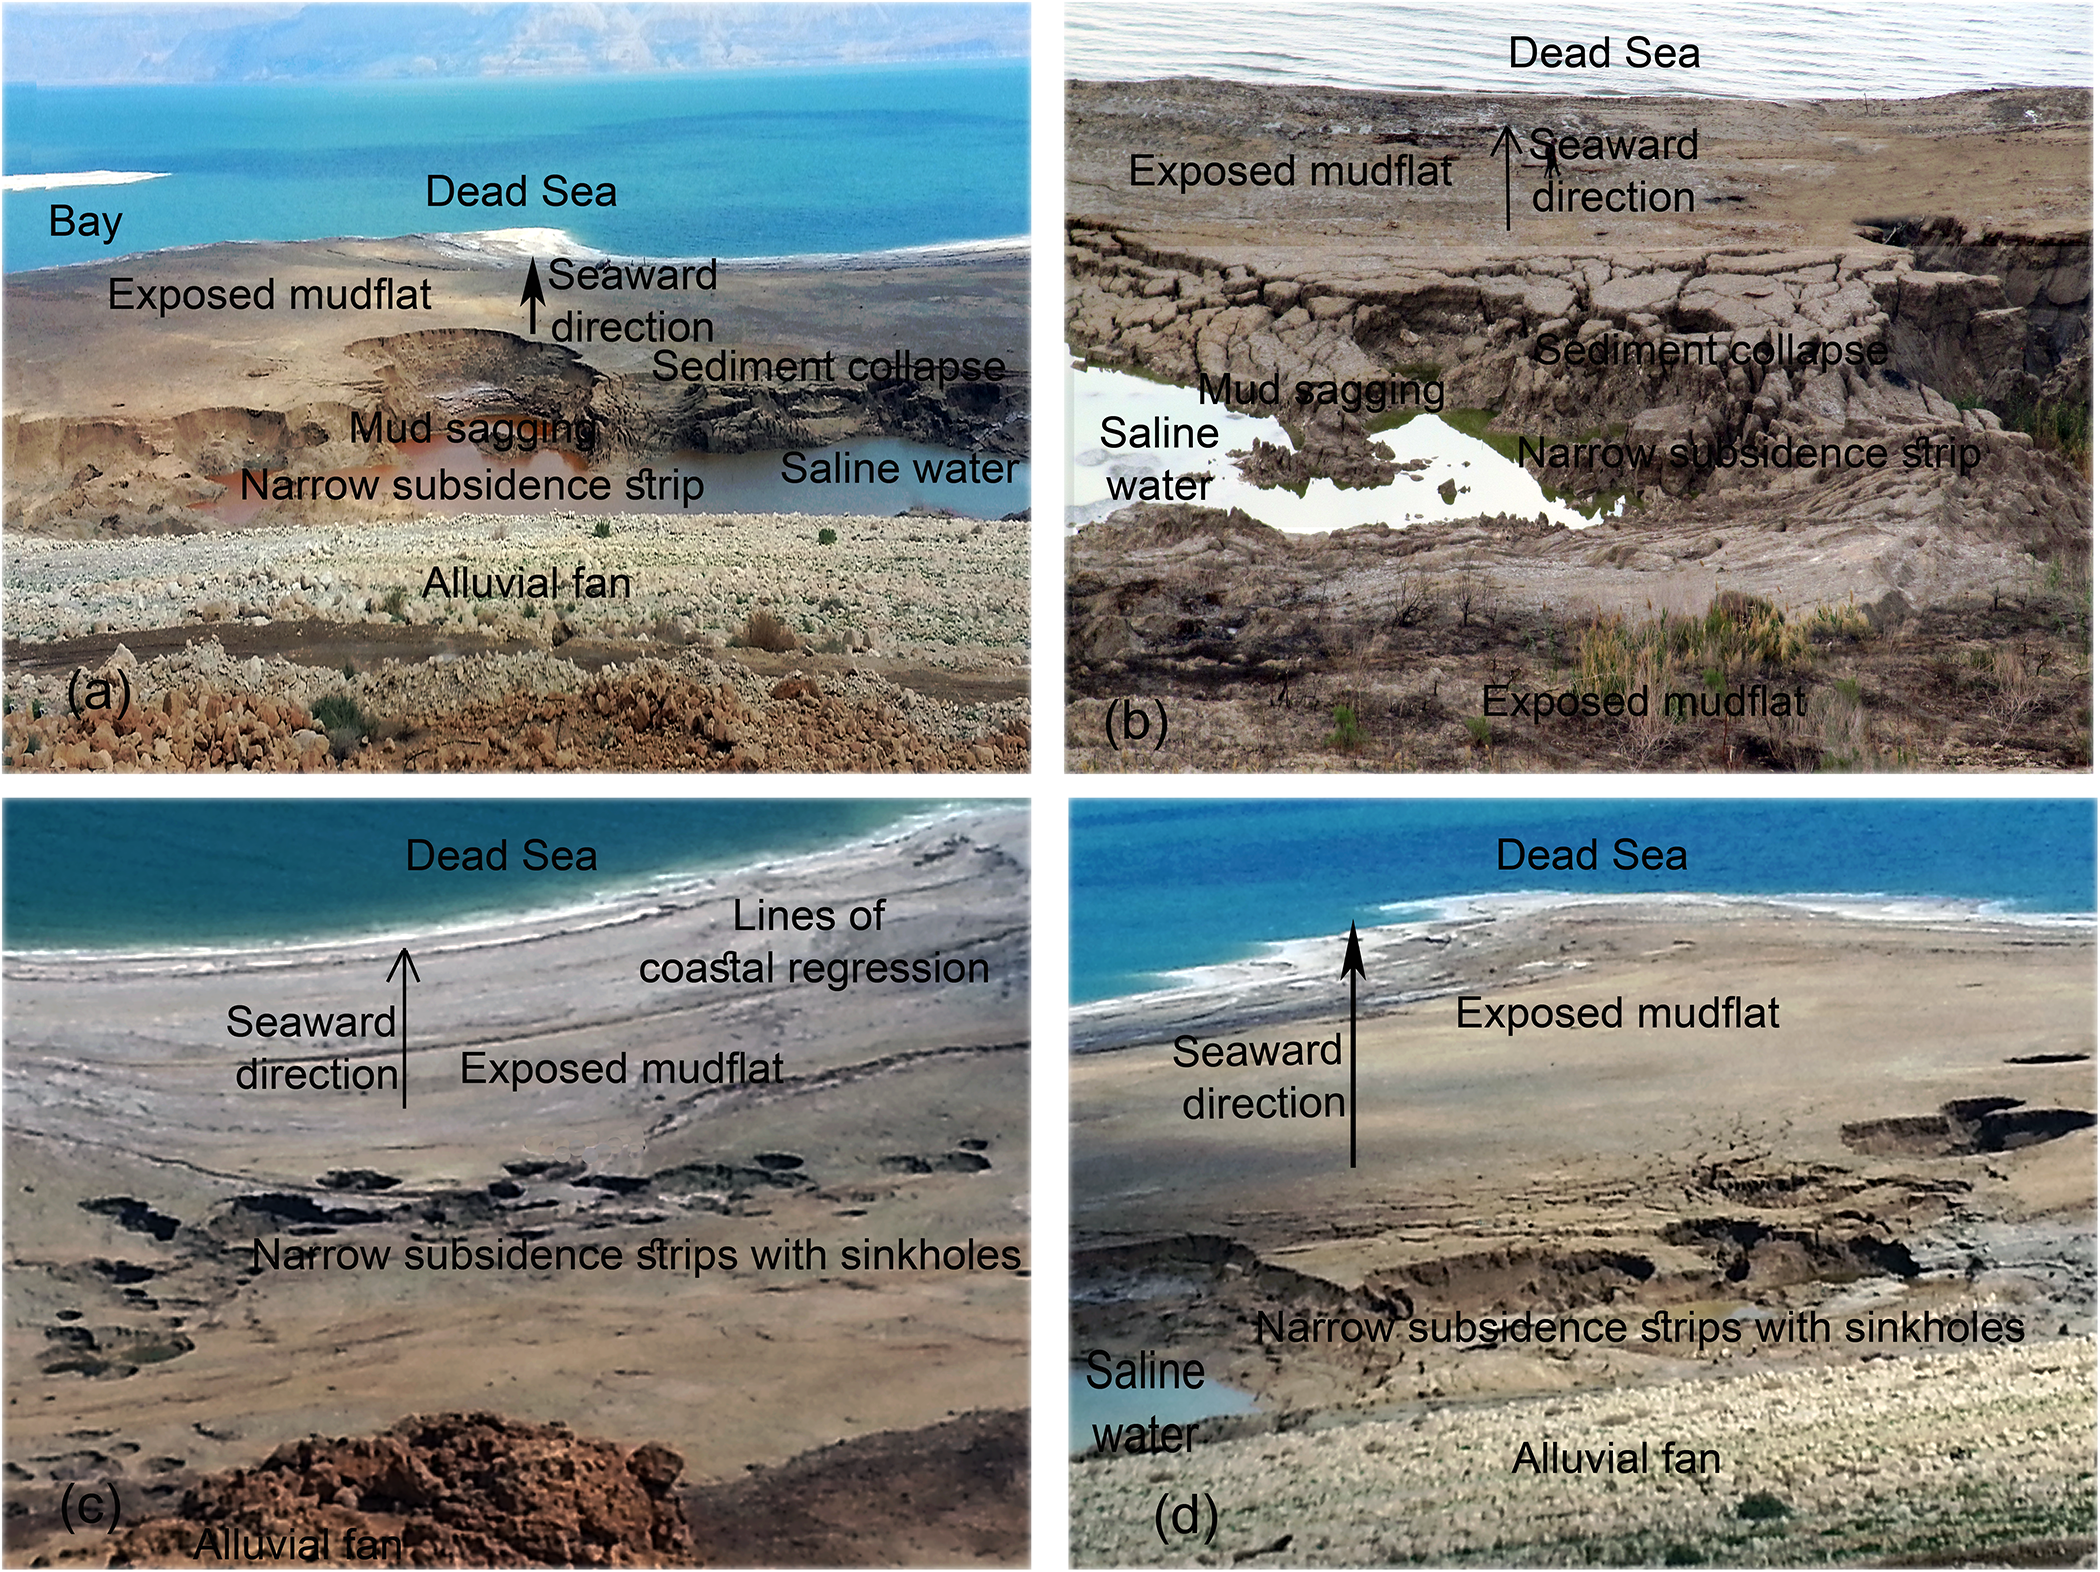
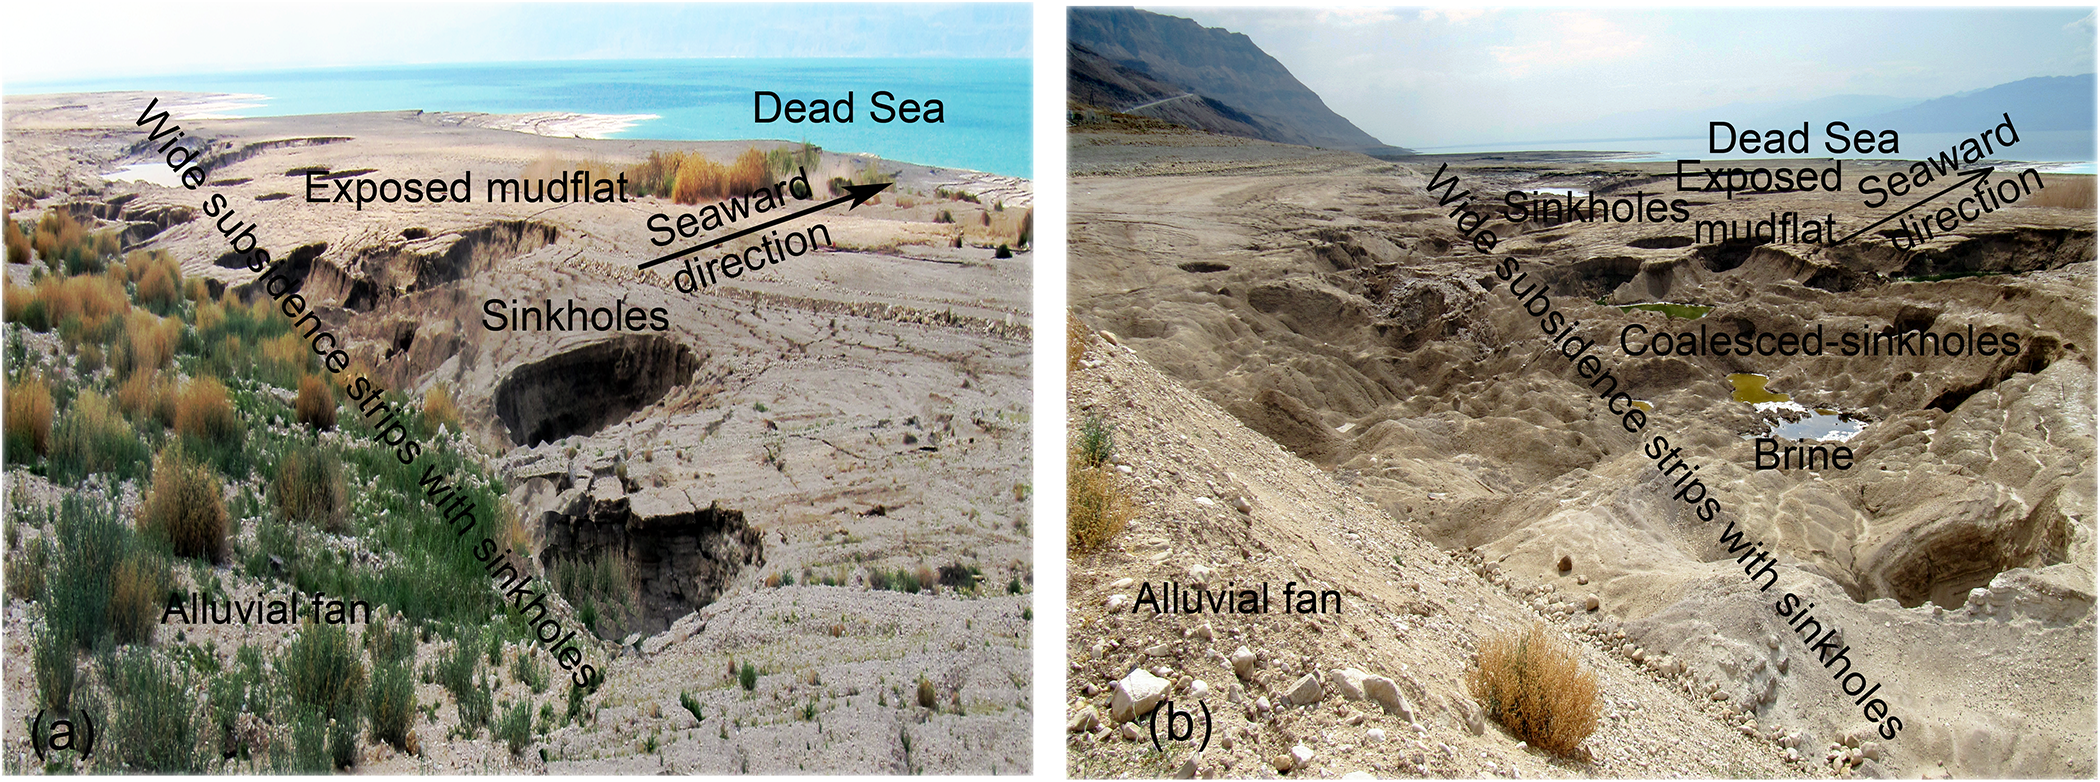
The subsidence features in the exposed mudflats on the western Dead Sea shore include narrow subsidence strips with/without clustered sinkholes (Fig. 5) and wide subsidence strips with clustered sinkholes (Fig. 6). At specific sites, subsidence features extend in the exposed mudflats up to 1 km long and up to 200 m wide (Yechieli et al., Reference Yechieli, Abelson, Bein, Crouvi and Shtivelman2006, Reference Yechieli, Abelson and Baer2016).
Narrow subsidence strips in exposed mudflats. (a,b) Movement and subsidence of mudflat sediments in narrow subsidence strips (Samar site). (c,d) Collapse of mudflat sediments in clustered sinkholes in narrow subsidence strips (Kedem site).

Wide subsidence strips with clustered sinkholes in exposed mudflats. (a,b) Increased subsidence of mudflat sediments in wide subsidence strips with clustered sinkholes (Shalem site).

Movement and subsidence of mudflat sediments are visible in the narrow subsidence strips (Fig. 5a,b). Collapse of mudflat sediments occurs in clustered sinkholes in narrow subsidence strips (Fig. 5c,d). Increased subsidence of mudflat sediments is visible in wide subsidence strips with clustered sinkholes (Fig. 6). Subsidence strips and clustered sinkholes extend in exposed mudflats aligned approximately parallel to the shoreline (Figs 5 & 6), and they are gradually broadening over time.
Sinkholes in exposed mudflats
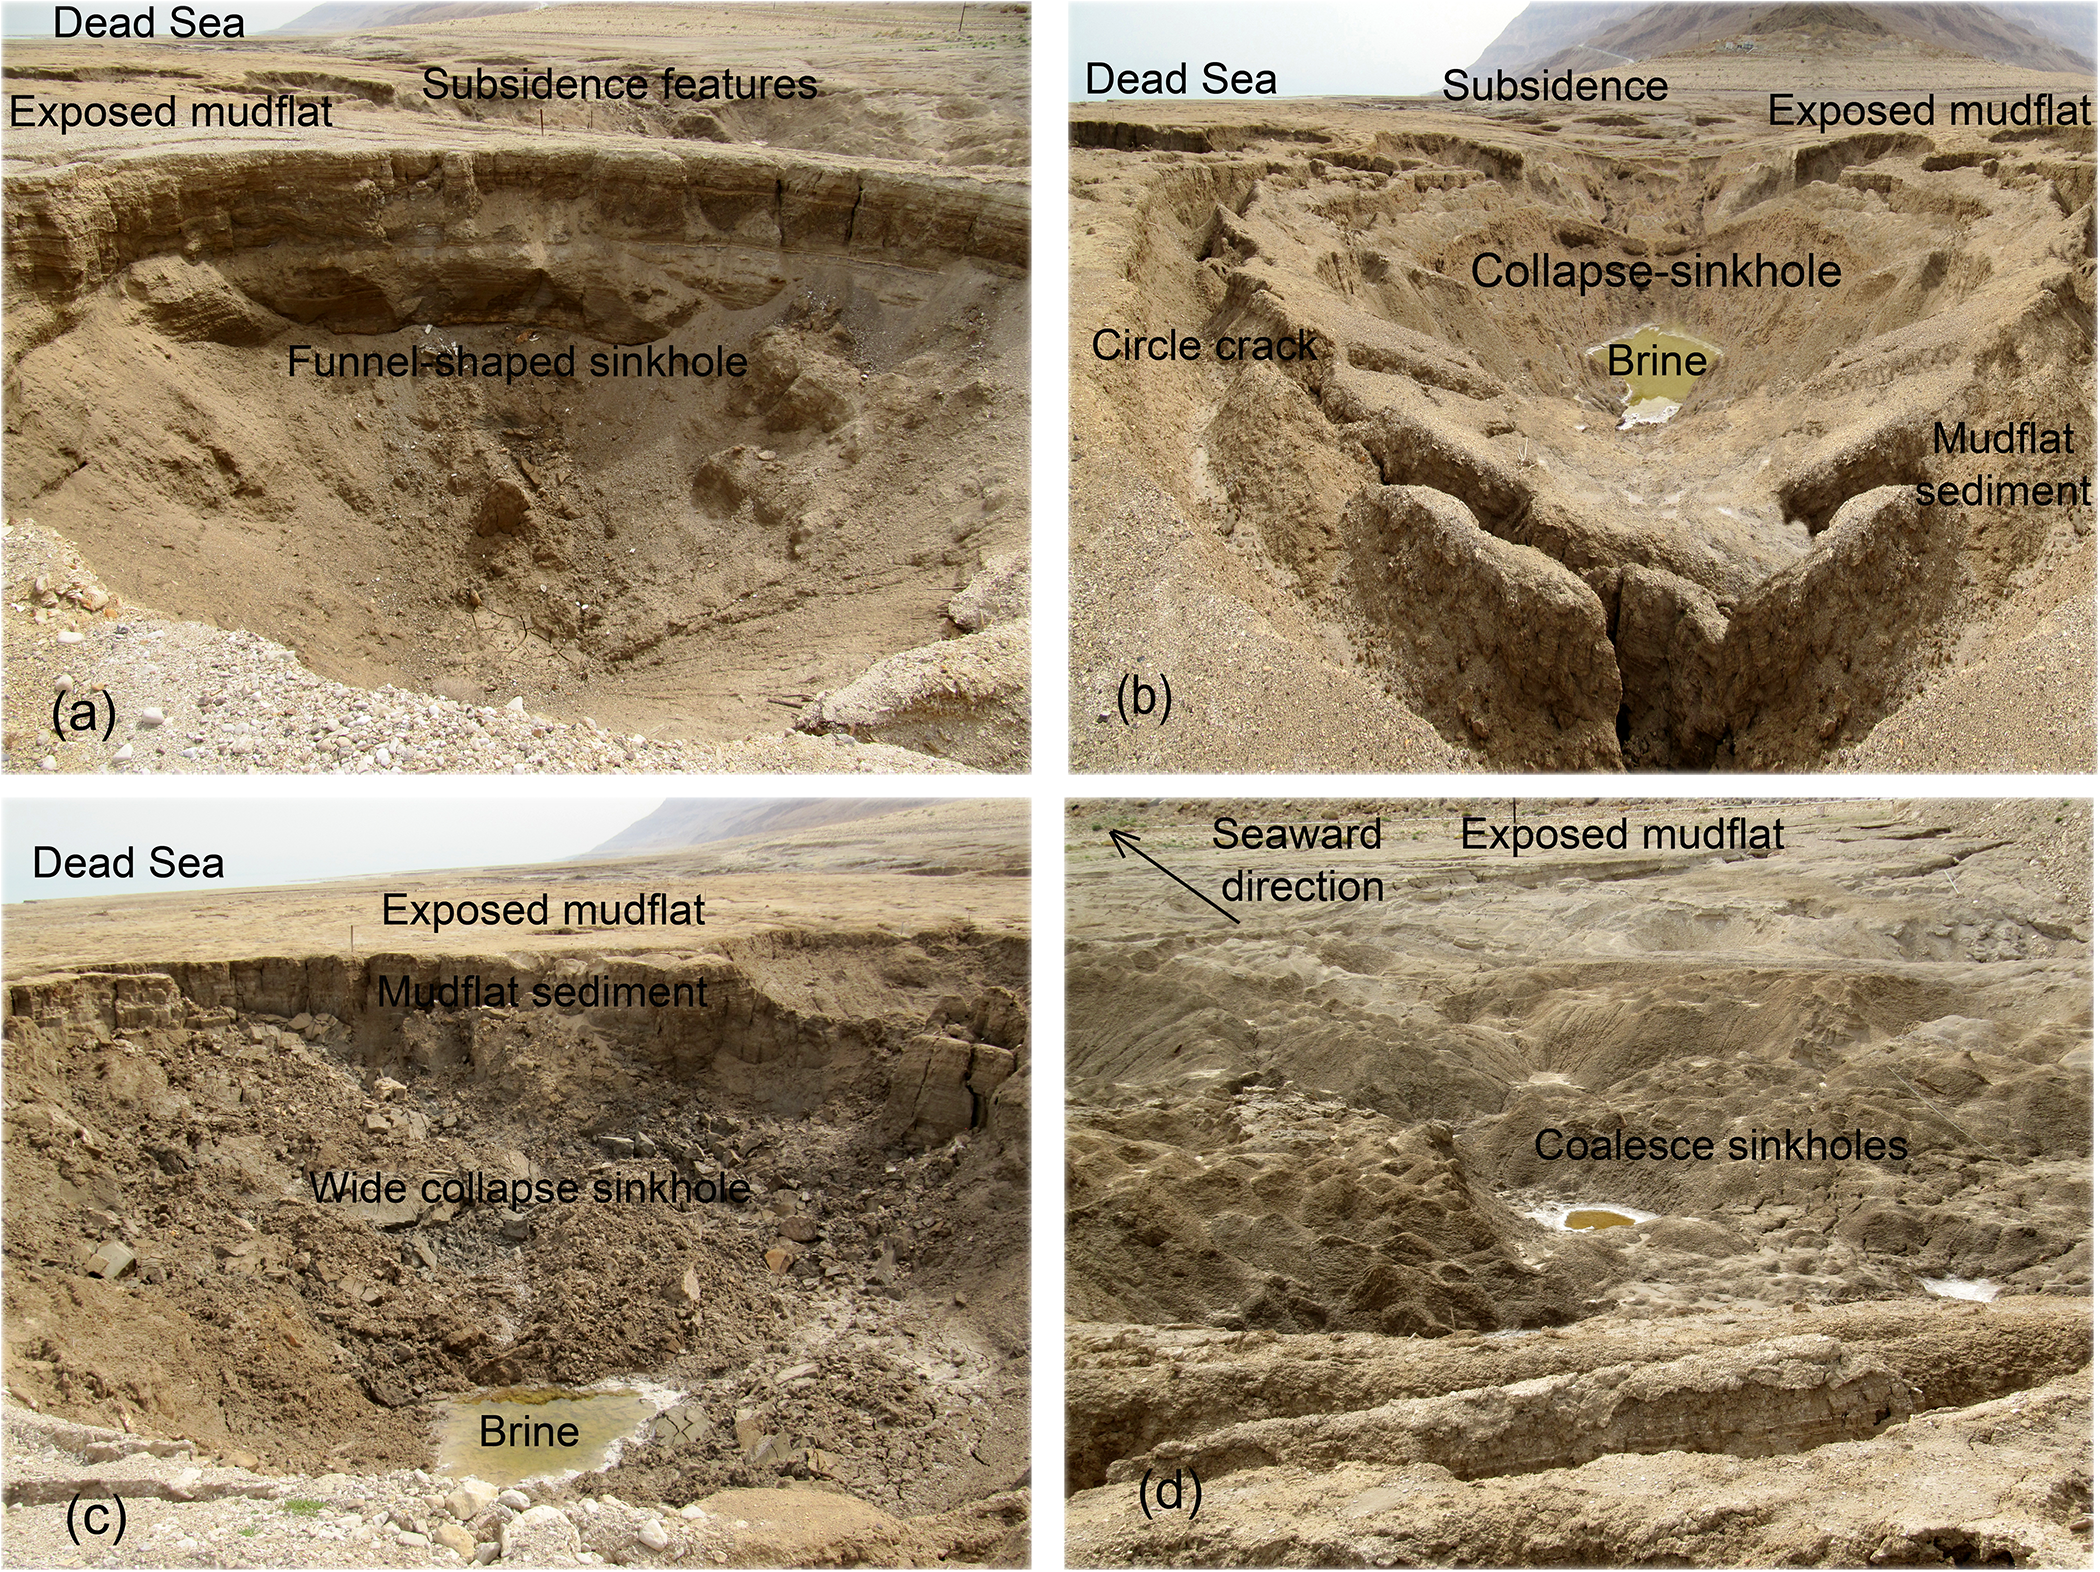
Clustered sinkholes occur in narrow subsidence strips (Fig. 5c,d) and in wide subsidence strips (Fig. 6). Collapse of mudflat sediments is visible in the sinkholes (Fig. 7a,b). The sinkholes are widening in exposed mudflats from funnel-shaped sinkholes, collapse-sinkholes, wide collapse-sinkholes to coalesce-sinkholes (Fig. 7). The diameter of individual sinkholes ranges from 2 to 15 m and extend up to a depth of 7 m (Arkin & Gilat, Reference Arkin and Gilat2000).
Widening of sinkholes. (a) A funnel-shaped sinkhole, (b) a collapse-sinkhole, (c) a wide collapse-sinkhole and (d) coalesce-sinkholes (Shalem site).

Cracking features in alluvial fans
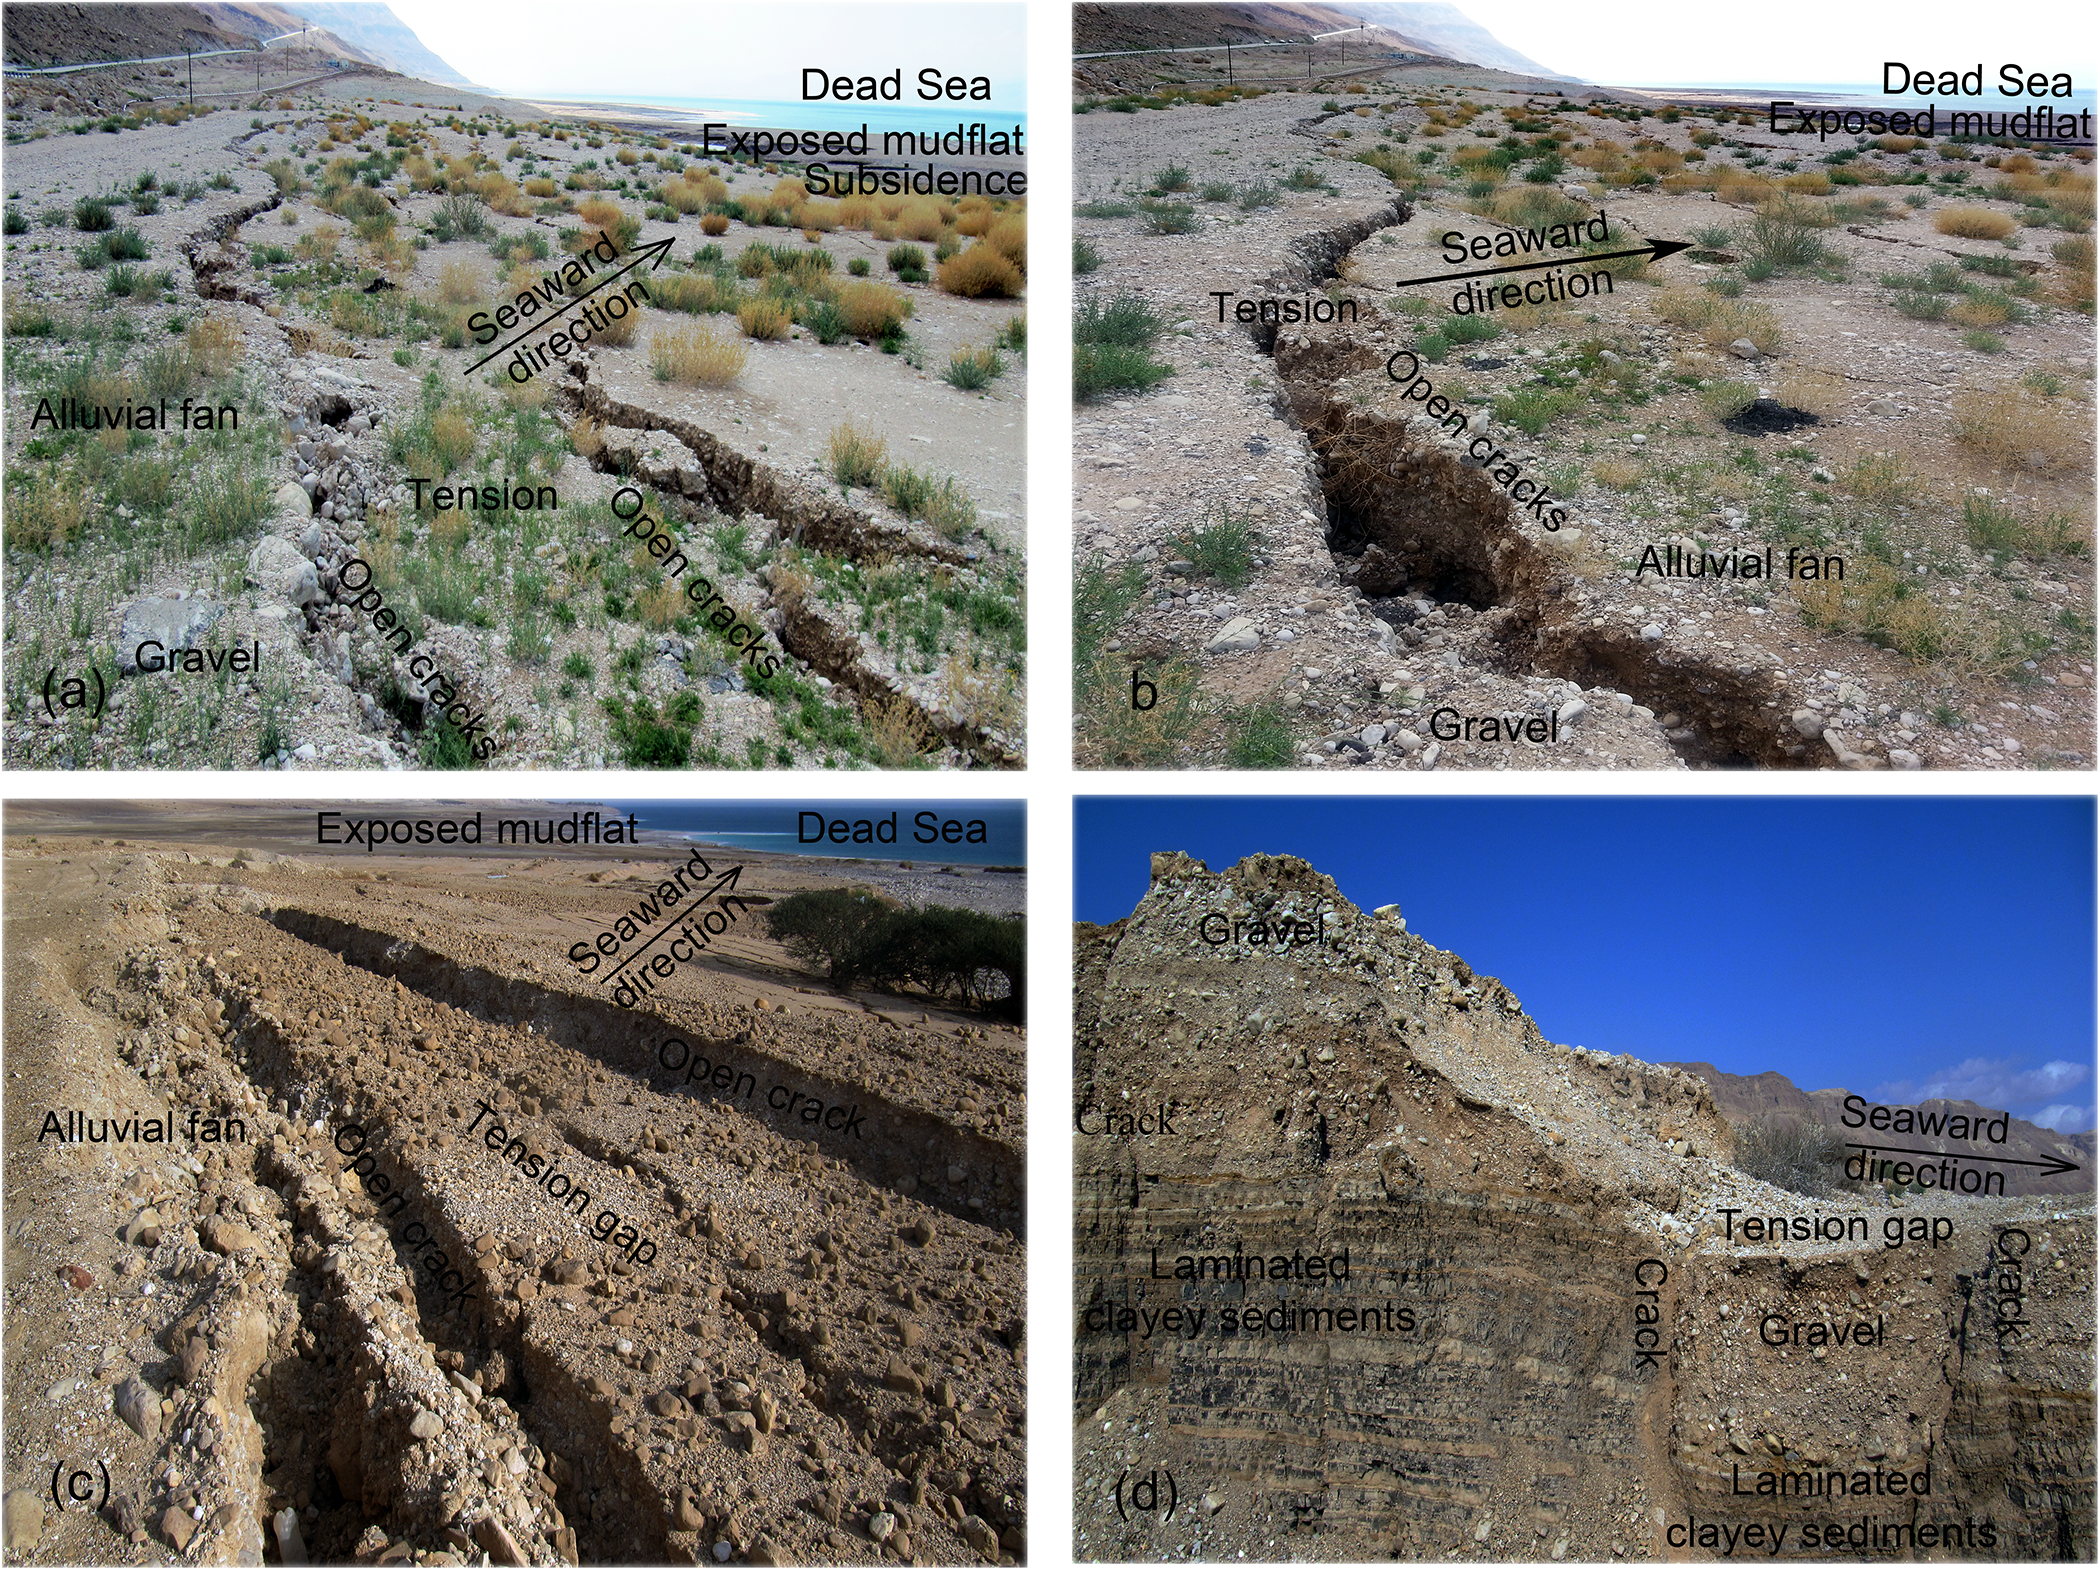
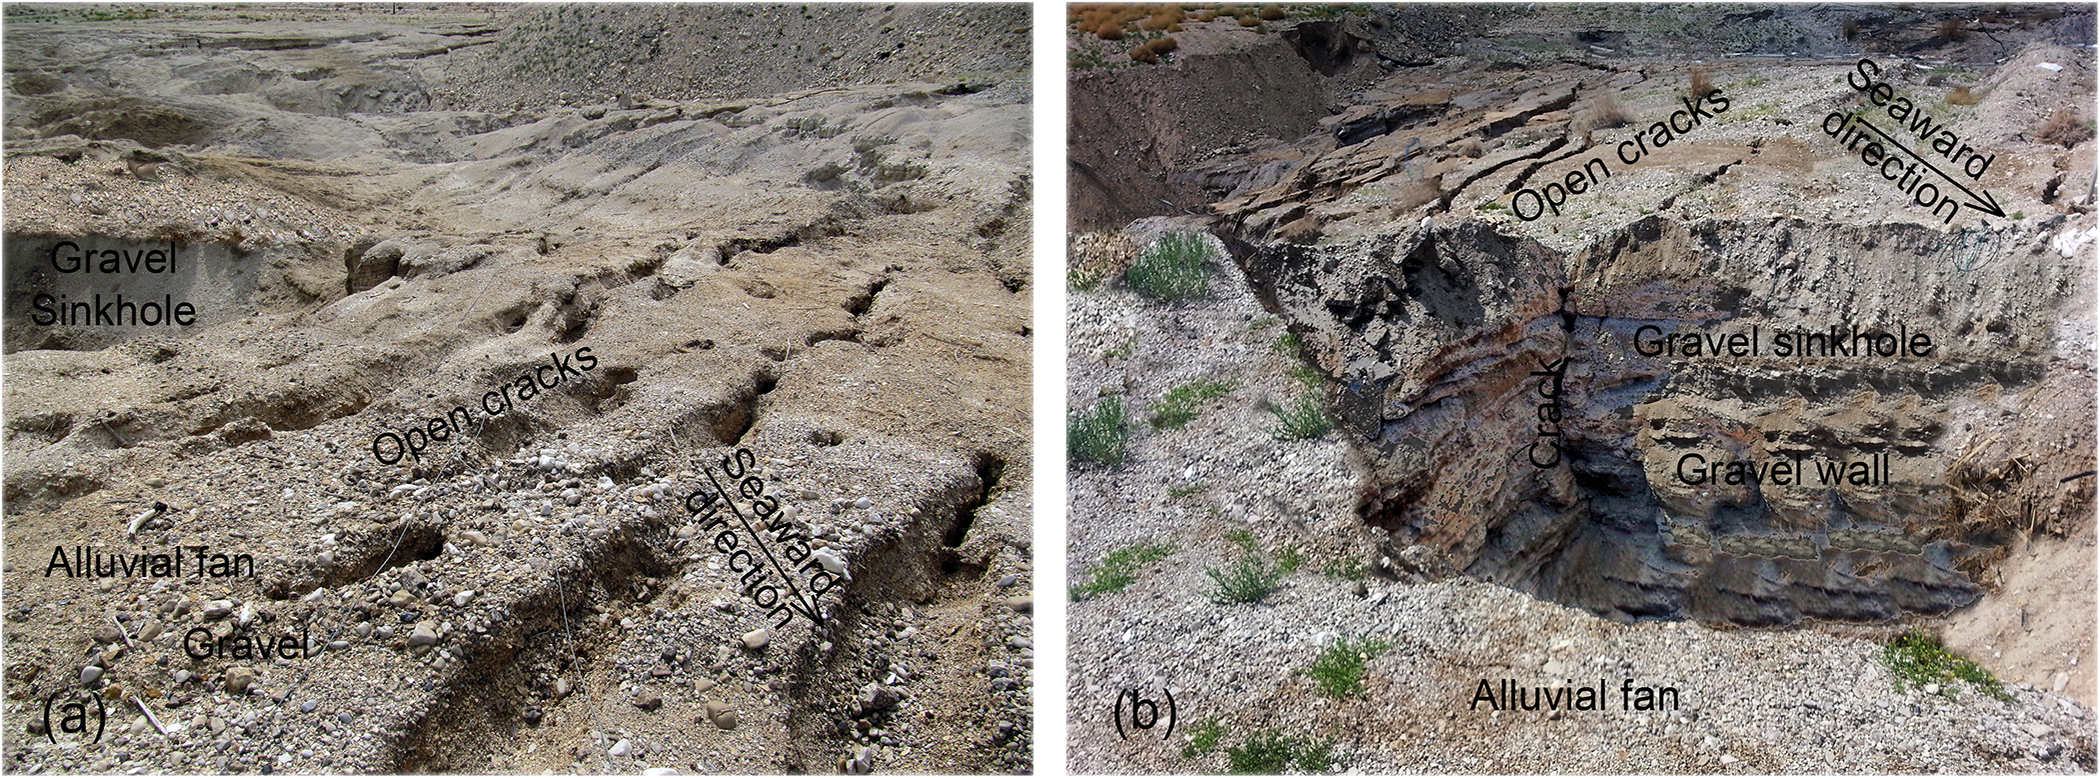
Cracking and the formation of open cracks (Fig. 8a,b) and tension gaps (Fig. 8c,d) affect the alluvial fans on the higher Dead Sea shore (Fig. 8). The cracking features are aligned approximately parallel to the shoreline and gradually widen with time (Fig. 8a–c). Gravel sinkholes also occur in alluvial fans (Arkin & Gilat, Reference Arkin and Gilat2000; Ezersky & Livne, Reference Ezersky and Livne2013). Gravel sinkholes with open cracks and collapse of gravel deposits in gravel sinkholes are observed (Fig. 9).
Cracking features crossing alluvial fans on the higher Dead Sea shore. (a) Open cracks in an alluvial fan (Shalem site). (b) Broadening of open cracks (Shalem site). (c) Tension gap in an alluvial fan (Hever site). (d) Profile of a tension gap (Hever site).

Gravel sinkholes in alluvial fans. (a) A gravel sinkhole with open cracks (Shalem site). (b) Collapse of gravel deposits in a gravel sinkhole (Shalem site).

Composition of the mudflat sediments at the studied sites
The properties of the clayey sediments that promote movement and subsidence of the mudflat sediments and the development of the subsidence features are the unconsolidated fine-particle texture, the bulk and clay mineralogical compositions, the water content and the salinity. Fine-particle sizes of 2–5 µm were reported for the decalcified clay fraction of mudflat sediments in a preliminary study (Fig. 10 in Shoval, Reference Shoval2023). The fine detritus material and the suspended sediments of the Ze’elim Formation (mudflat sediments) have grain-size peaks at 5–10 and 2–4 µm, respectively (Haliva-Cohen et al., Reference Haliva-Cohen, Stein, Goldstein, Sandler and Starinsky2012).
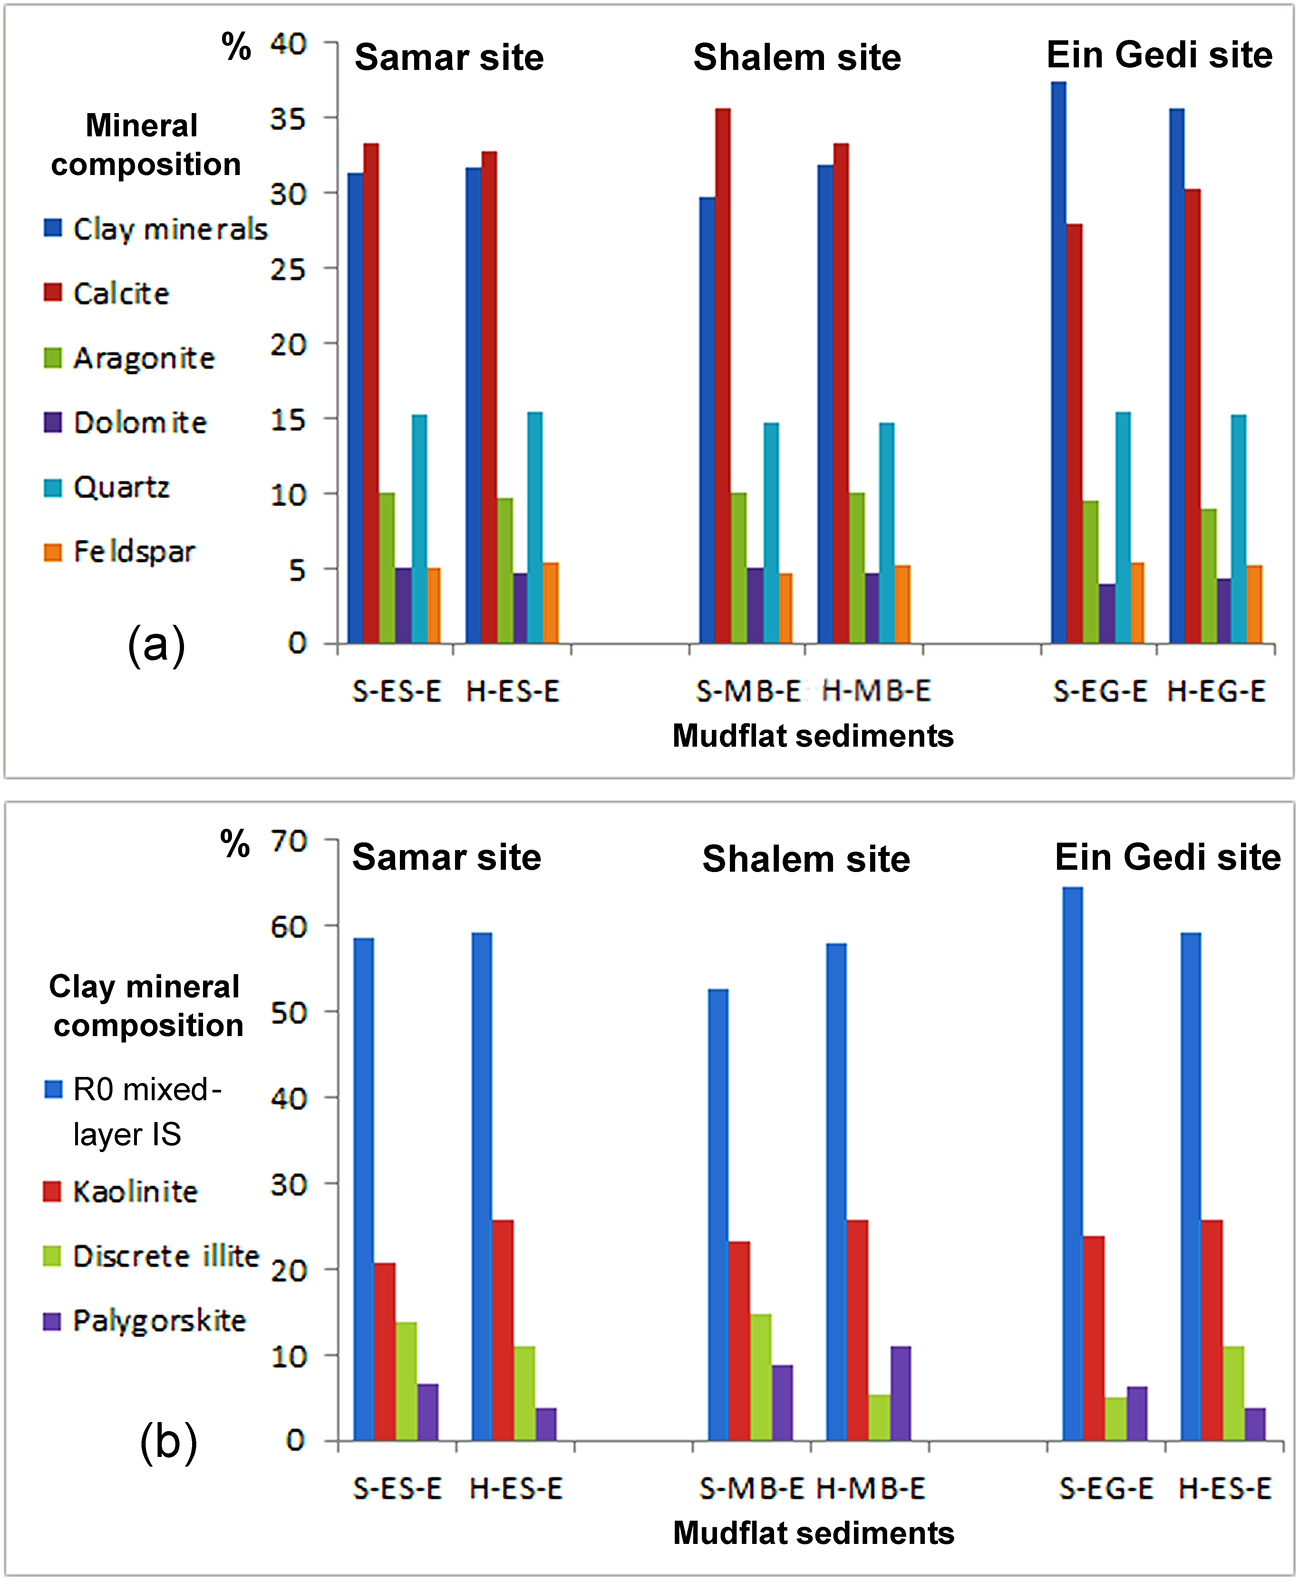
Mineralogical composition of the mudflat sediments at the studied sites (based on data from Shoval, Reference Shoval2023). (a) Bulk mineralogical composition. (b) Clay mineral composition. IS = illite–smectite. E = average results for specimens of the same type; EG = Ein Gedi site; ES = Samar site; H = mudflat sediment in sinkhole; MB = Shalem site; S = mudflat sediment in subsidence strip.

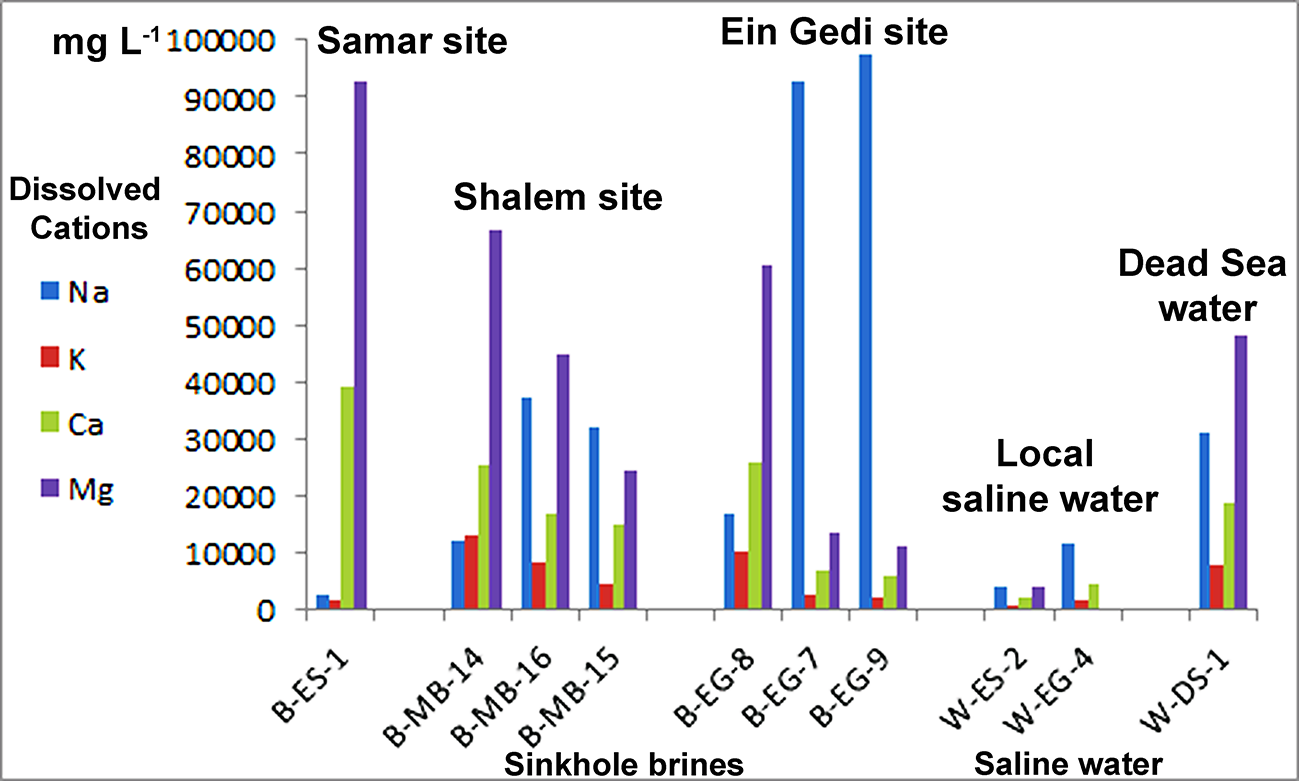
Concentrations of dissolved cations (mg L–1) in saline water and in sinkhole brines from the studied sites (based on data from Shoval, Reference Shoval2023). B = brine; DS = Dead Sea; EG = Ein Gedi site; ES = Samar site; MB = Shalem site; W = saline water.

Mineralogical composition and clay mineral composition
Laboratory analyses of the mudflat sediments were performed in a preliminary study (Shoval, Reference Shoval2023). Figure 10 summarizes the bulk mineralogical composition and the clay mineral composition of the mudflat sediments at the studied sites. The histograms in Fig. 10 show average results for specimens of the same type at individual sites. In Fig. 10a, the mineralogical composition is calculated with the total clay mineral contents. The bulk mineralogical composition consists of clay minerals and carbonate minerals (calcite, aragonite and dolomite), with some quartz and feldspar (Fig. 10a). The main clay minerals present are R0 mixed-layer illite–smectite and kaolinite with minor discrete illite and palygorskite (Fig. 10b).
Salinity of the mudflat sediments
The salinity of the mudflat sediments is identified by the presence of saline water and brine and precipitated gypsum and halite (Frydman et al., Reference Frydman, Charrach and Goretsky2008). Local saline water is associated with subsidence features in exposed mudflats (Fig. 5a,b). Brine accumulates within sinkholes (Fig. 7b,c). Saline groundwater has been reported in shallow aquifers along the Dead Sea shore (Yechieli, Reference Yechieli2000; Ezersky & Frumkin, Reference Ezersky and Frumkin2017). Figure 11 summarizes the concentrations of dissolved cations (mg L–1) in saline water and in sinkhole brines from the studied sites (data from Shoval, Reference Shoval2023). Na and Mg are the main cations present in the brines (Fig. 11). The variation in the composition of the sinkhole brines is due to local precipitation of salts at the bottom of the sinkholes, consisting of halite, gypsum and possibly carnallite and bischofite (Zilberman-Kron, Reference Zilberman-Kron2008).
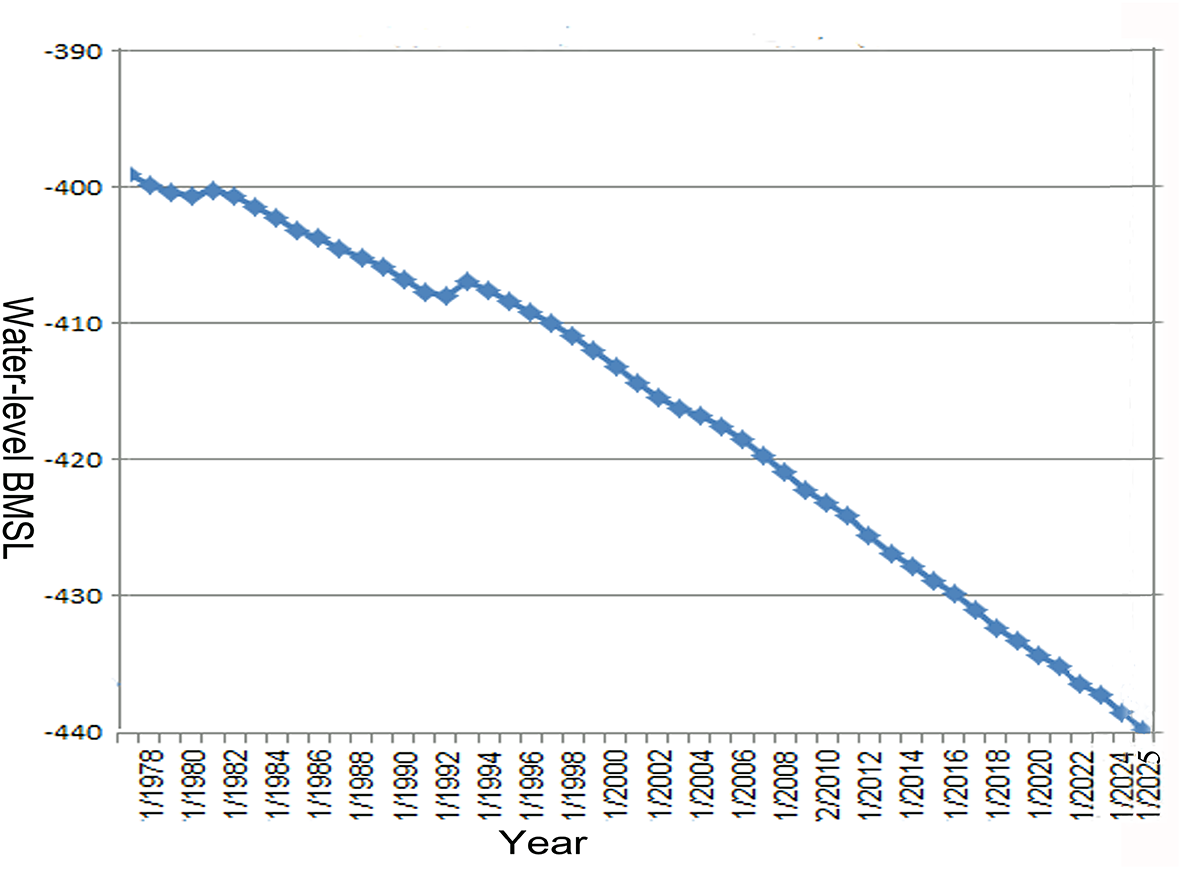
Diagram of the rapid drop in the Dead Sea water level over the years 1978–2025 (official data from the Israeli Hydrological Service: https://data.gov.il/dataset/https-www-data-gov-il-dataset-683/resource/823479b4-4771-43d8-9189-6a2a1dcaaf10). BMSL = below mean sea or ocean level (m).

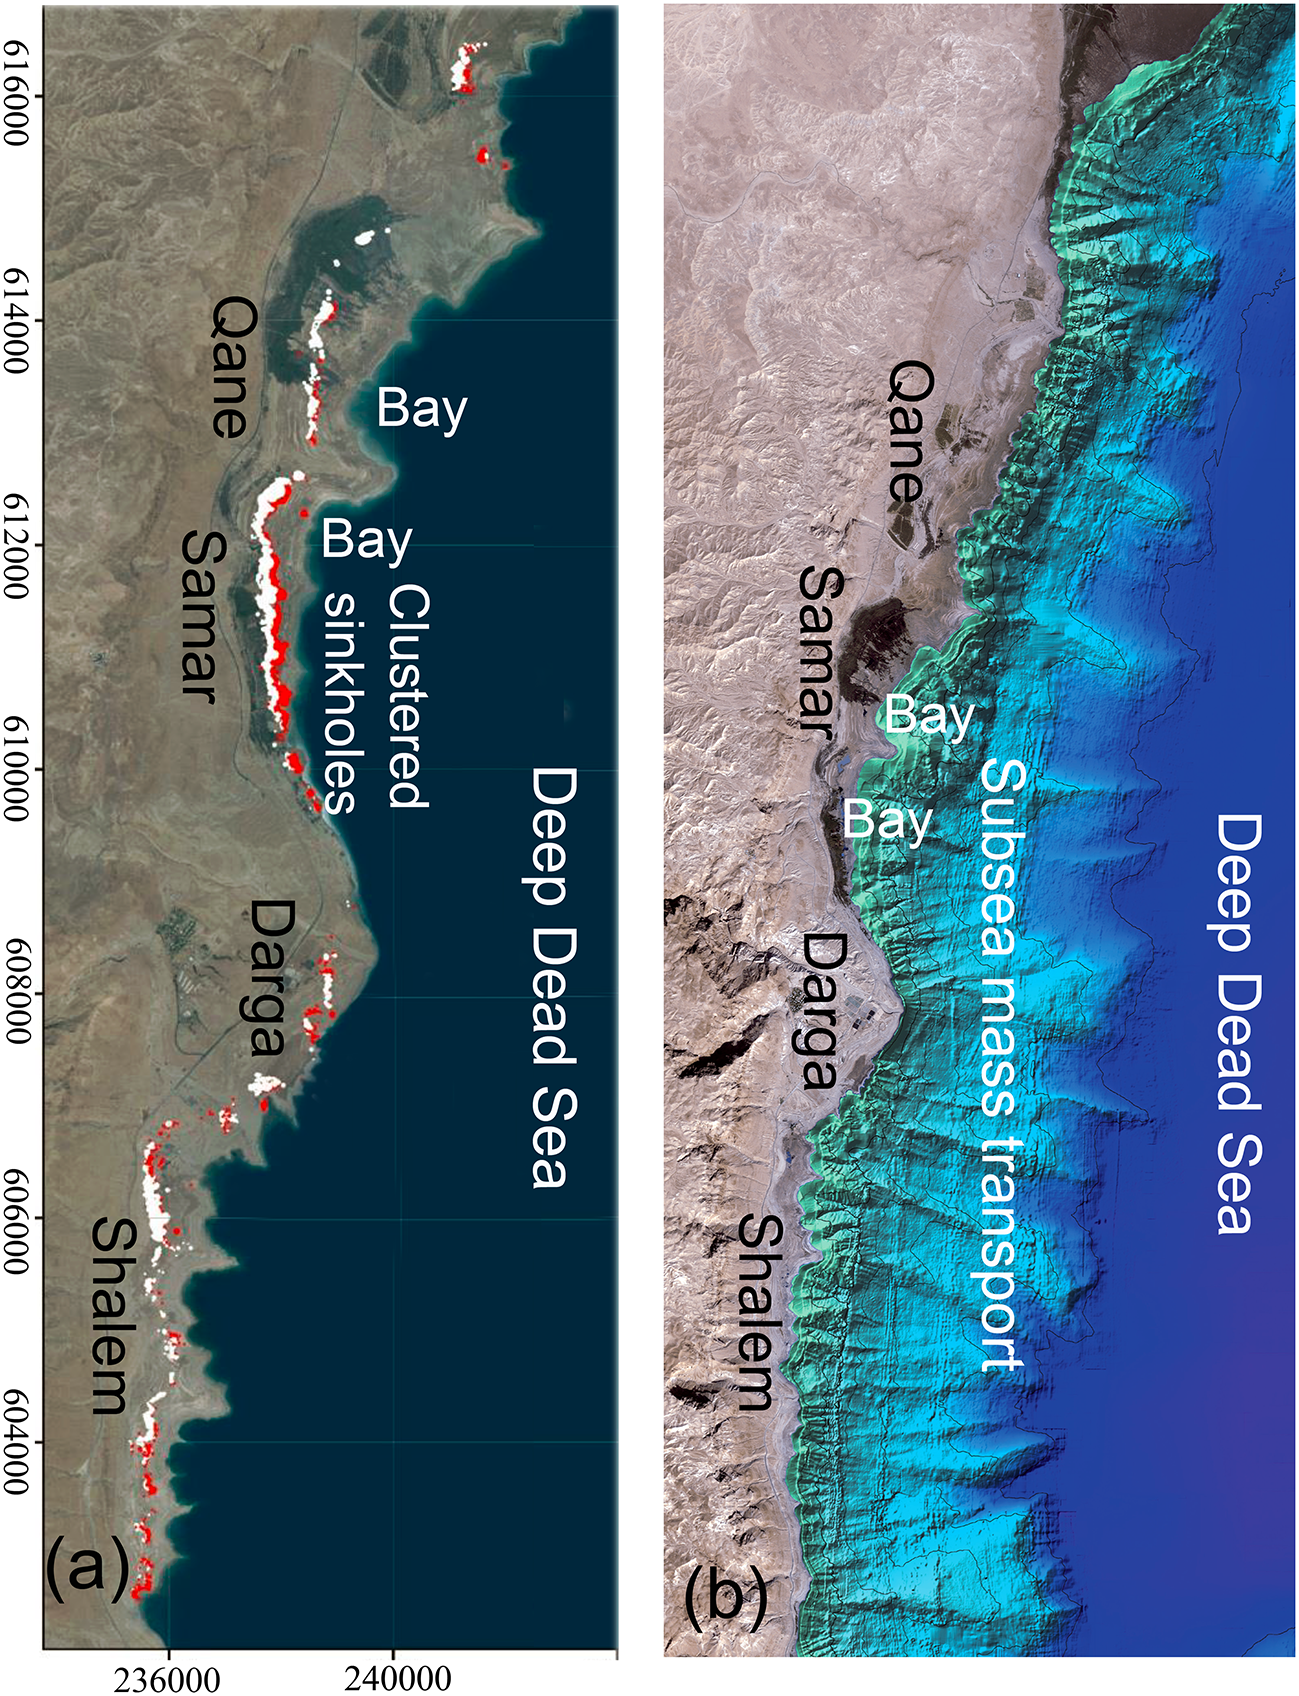
(a) Satellite photograph map of the western Dead Sea, illustrating the approximately shoreline-parallel extending of subsidence features and the seaward migration of newly formed clustered sinkholes (red) relative to older sinkholes (white; the coordinates in the frame are of the new Israel Mercator grid in kilometres; modified from the Satellite Photograph Map of the Dead Sea region by Abelson et al., Reference Abelson, Yechieli and Baer2017a; the Geological Survey of Israel: https://www.gov.il/BlobFolder/reports/abelson-et-al-report-2017/he/report_2017_GSI-24-2017.pdf). (b) Multibeam bathymetric map of the western Dead Sea, illustrating the bathymetric morphology of the coastal margin and subsea mass transport on the subsea slope (modified from the bathymetric map of the Dead Sea by Sade et al., Reference Sade, Hall, Sade, Amit, Tibor and Schulze2014; the Geological Survey of Israel: https://www.gov.il/BlobFolder/generalpage/dead-sea-relief-map/he/img_BLA_Shaded-batimetry_map-Dead-Sea-Poster-Front-300dpi.pdf).

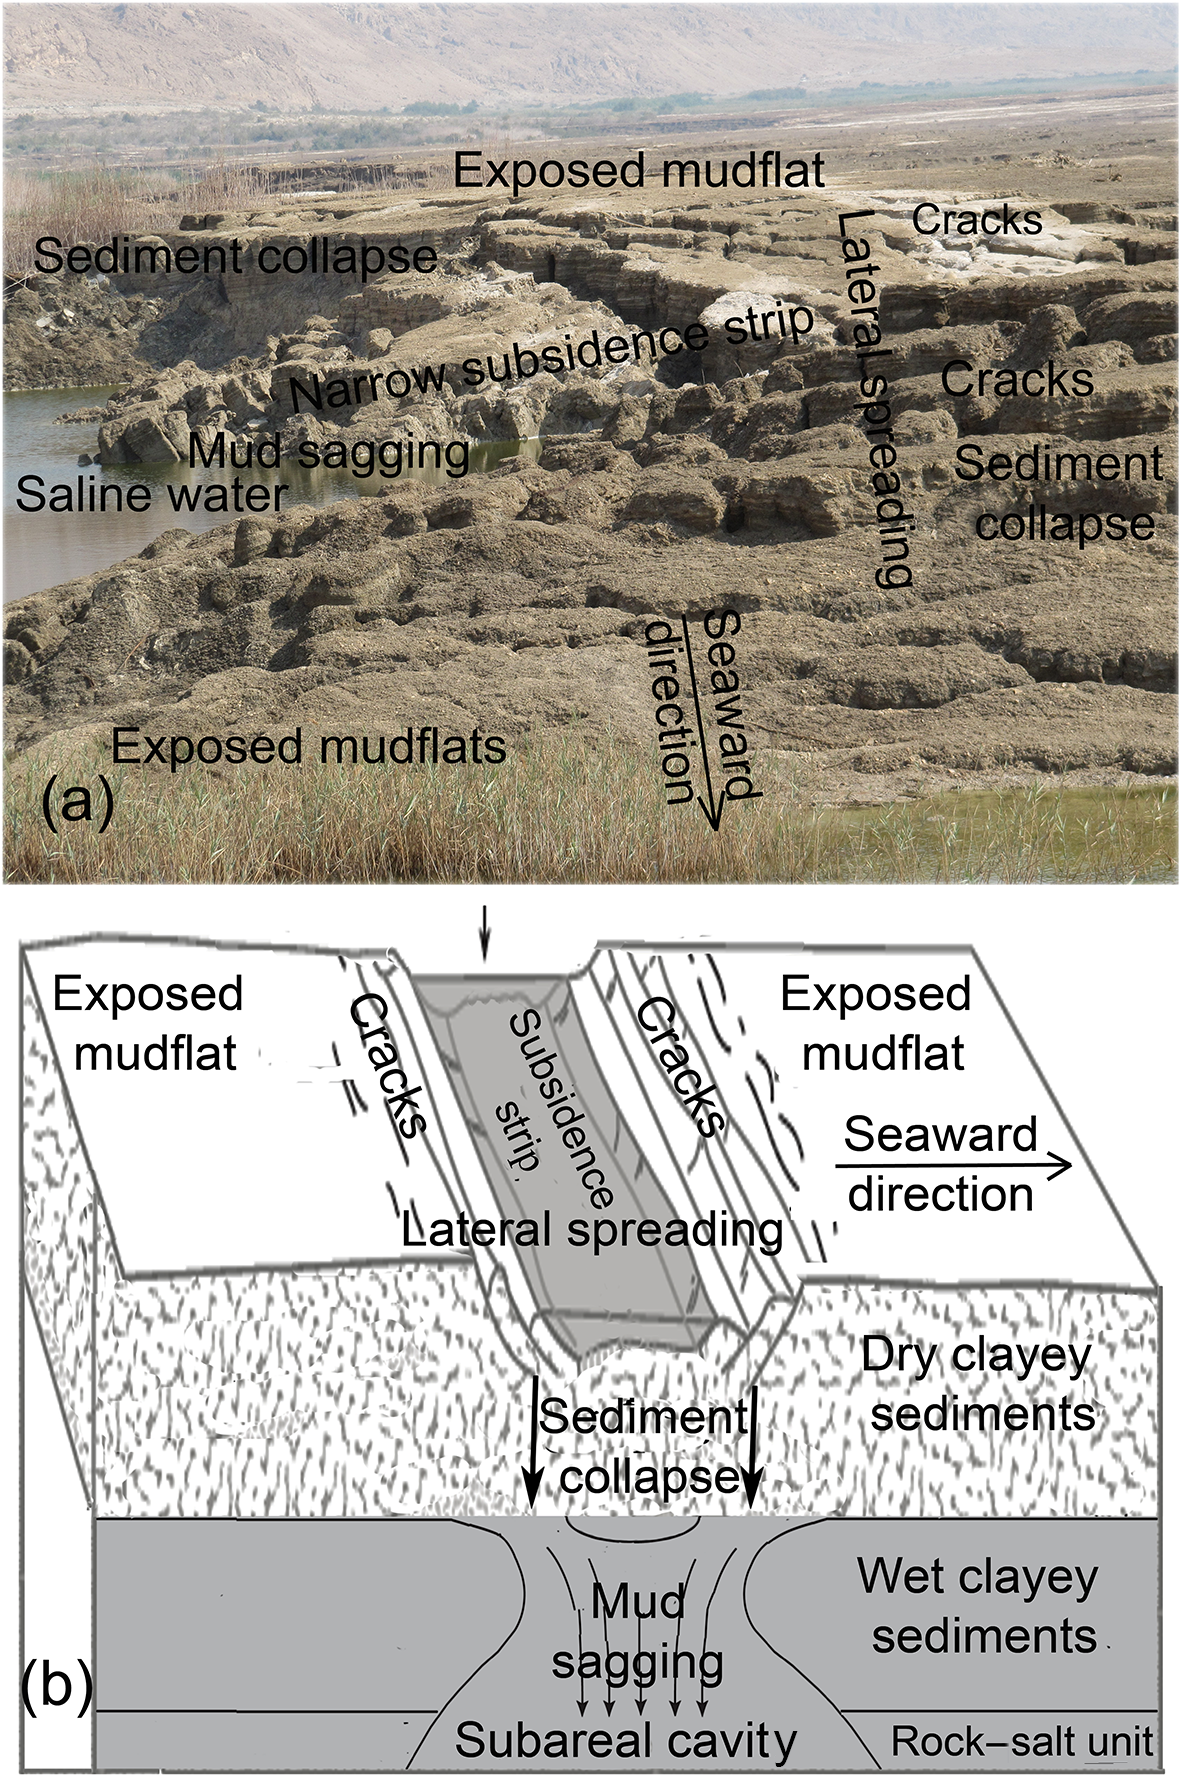
The formation of a narrow subsidence strip. (a) Movement and subsidence in mudflat sediments via lateral spreading (Samar site). (b) Illustration of subsidence in the formation of a narrow subsidence strip, which involves sediment collapse and mud sagging.

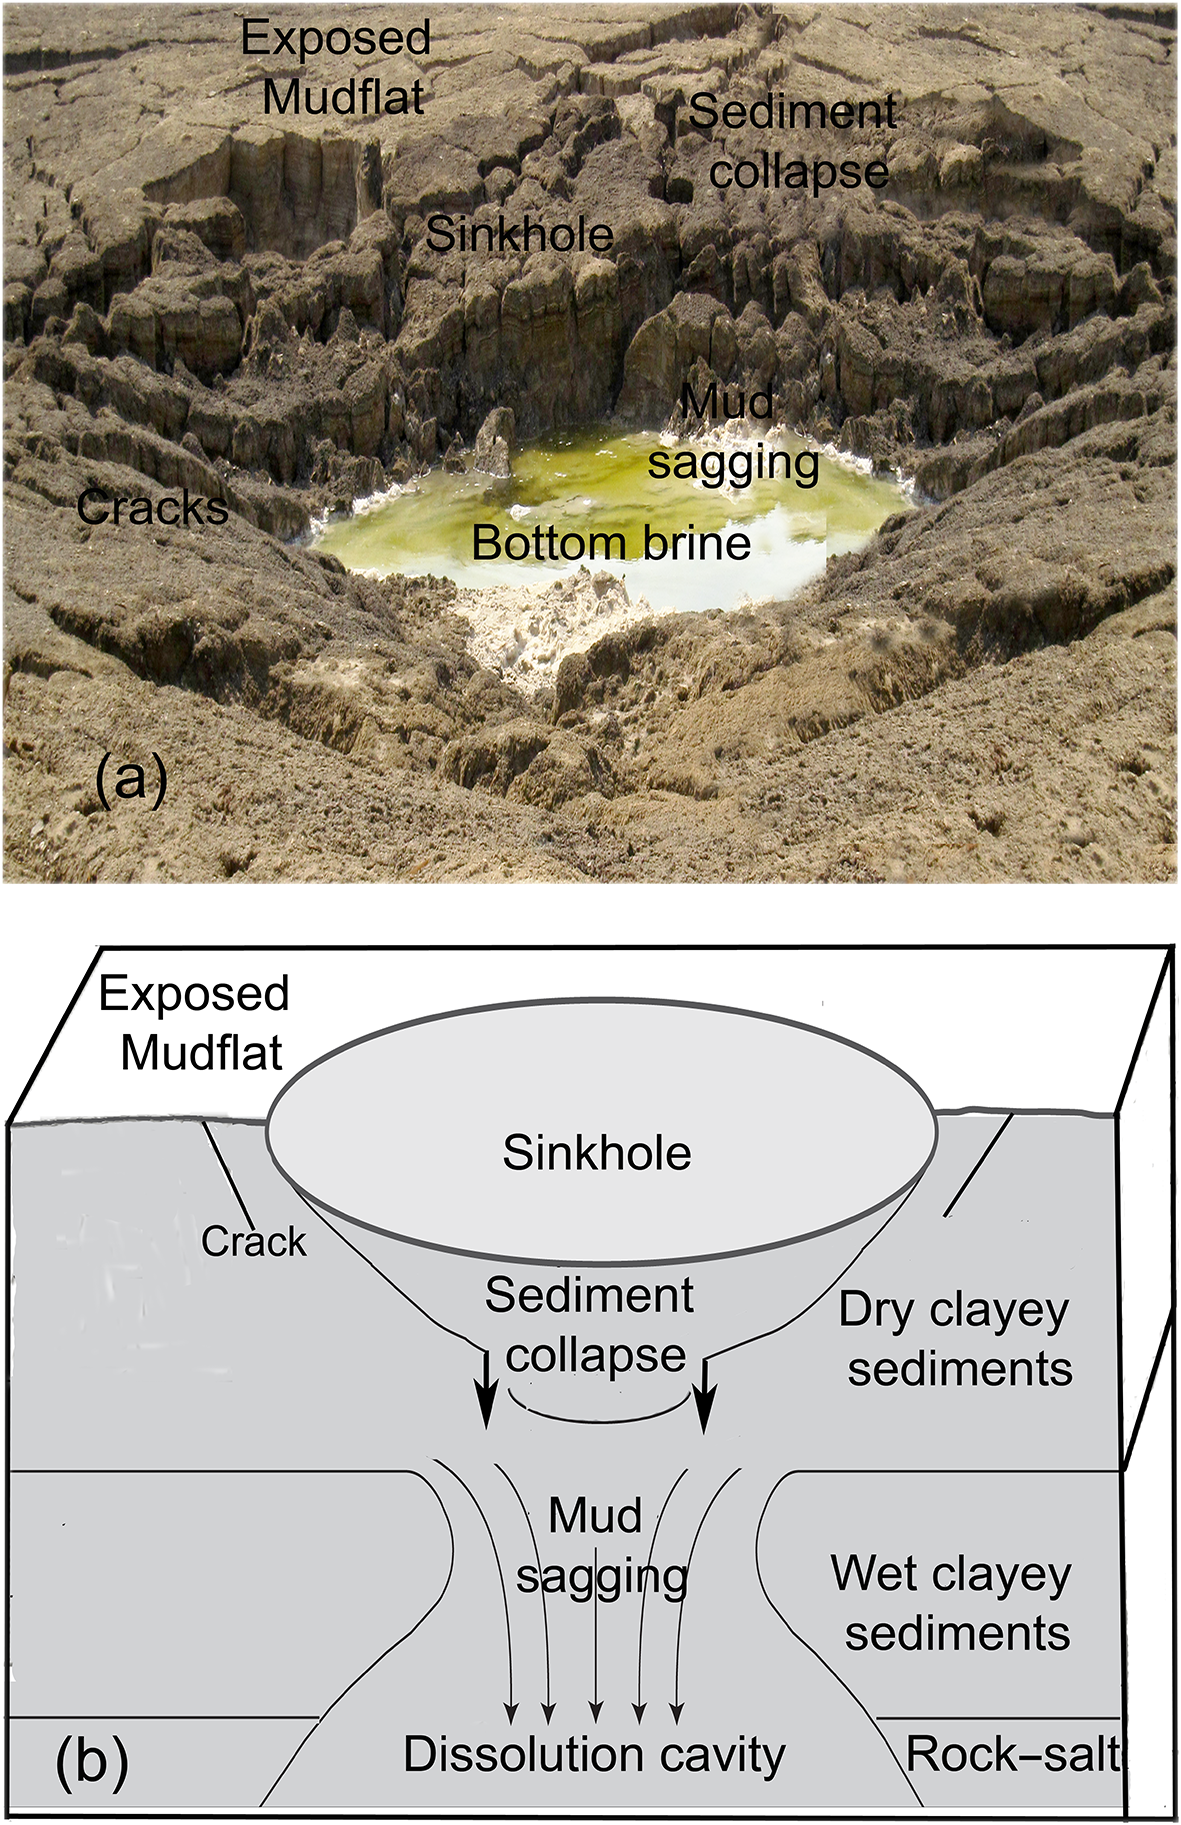
The emergence of a sinkhole containing bottom brine in exposed mudflats. (a) Subsidence of mudflat sediments in the sinkhole (Shalem site). (b) Illustration of subsidence into a subsurface dissolution cavity resulting in the emergence of a sinkhole, which involves sediment collapse and mud sagging (modified from Shoval, Reference Shoval2023).

Discussion
The impact of the Dead Sea retreat on coastal processes
The coastal processes on the receding Dead Sea shore and the subsidence features are part of the adjustment of the Dead Sea periphery to the lowering of its base level. In recent decades, the Dead Sea has experienced a rapid drop in its water level (Lipchin et al., Reference Lipchin, Antonius, Rishmawi, Afanah, Orthofer and Trottier2004; Ghazleh et al., Reference Ghazleh, Abed, Kempe, Badescu and Cathcart2011; Vey et al., Reference Vey, Al-Halbouni, Haghighi, Alshawaf, Vüllers and Güntner2021), rapid retreat (Bookman (Ken-Tor) et al., Reference Bookman (Ken-Tor), Enzel, Agnon and Stein2004) and a lowering of its base level (Watson et al., Reference Watson, Holohan, Al-Halbouni, Saberi, Sawarieh and Closson2019). Figure 12 highlights the drop in the Dead Sea water level over the years 1978–2025. Over the past 47 years, the water level of the Dead Sea has dropped by ∼40 m, and on 27 February 2025 it stood at 439.78 m BMSL. The average rate of decline in these years was ∼85 cm per year. Figure 3 shows some of the features of this receding on the western Dead Sea shore.
The retreat at the western Dead Sea shore exposed littoral sediments (Fig. 3a) and mudflats (Fig. 4a,b) and contributed to the development of subsidence strips (Figs 5 & 6) and the emergence of sinkholes (Fig. 7). The sinkholes first appeared in the 1980s when the Dead Sea level was ∼400 m BMSL, and their number has increased over the years as the water level has dropped (Ezersky et al., Reference Ezersky, Legchenko, Eppelbaum and Al-Zoubi2017; Abelson et al., Reference Abelson, Aksinenko, Kurzon, Pinsky, Baer, Nof and Yechieli2018). Since their first appearance, over 6000 sinkholes have been documented on the western Dead Sea shore (Yechieli et al., Reference Yechieli, Abelson and Baer2016; Abelson et al., Reference Abelson, Yechieli, Baer, Lapid, Behar, Calvo and Rosensaft2017b), and their formation continues today. In the western Dead Sea, the newly formed clustered sinkholes are migrating seawards (Fig. 13a). Figure 13b shows the bathymetric morphology of the coastal margin and subsea mass transport on the subsea slope.
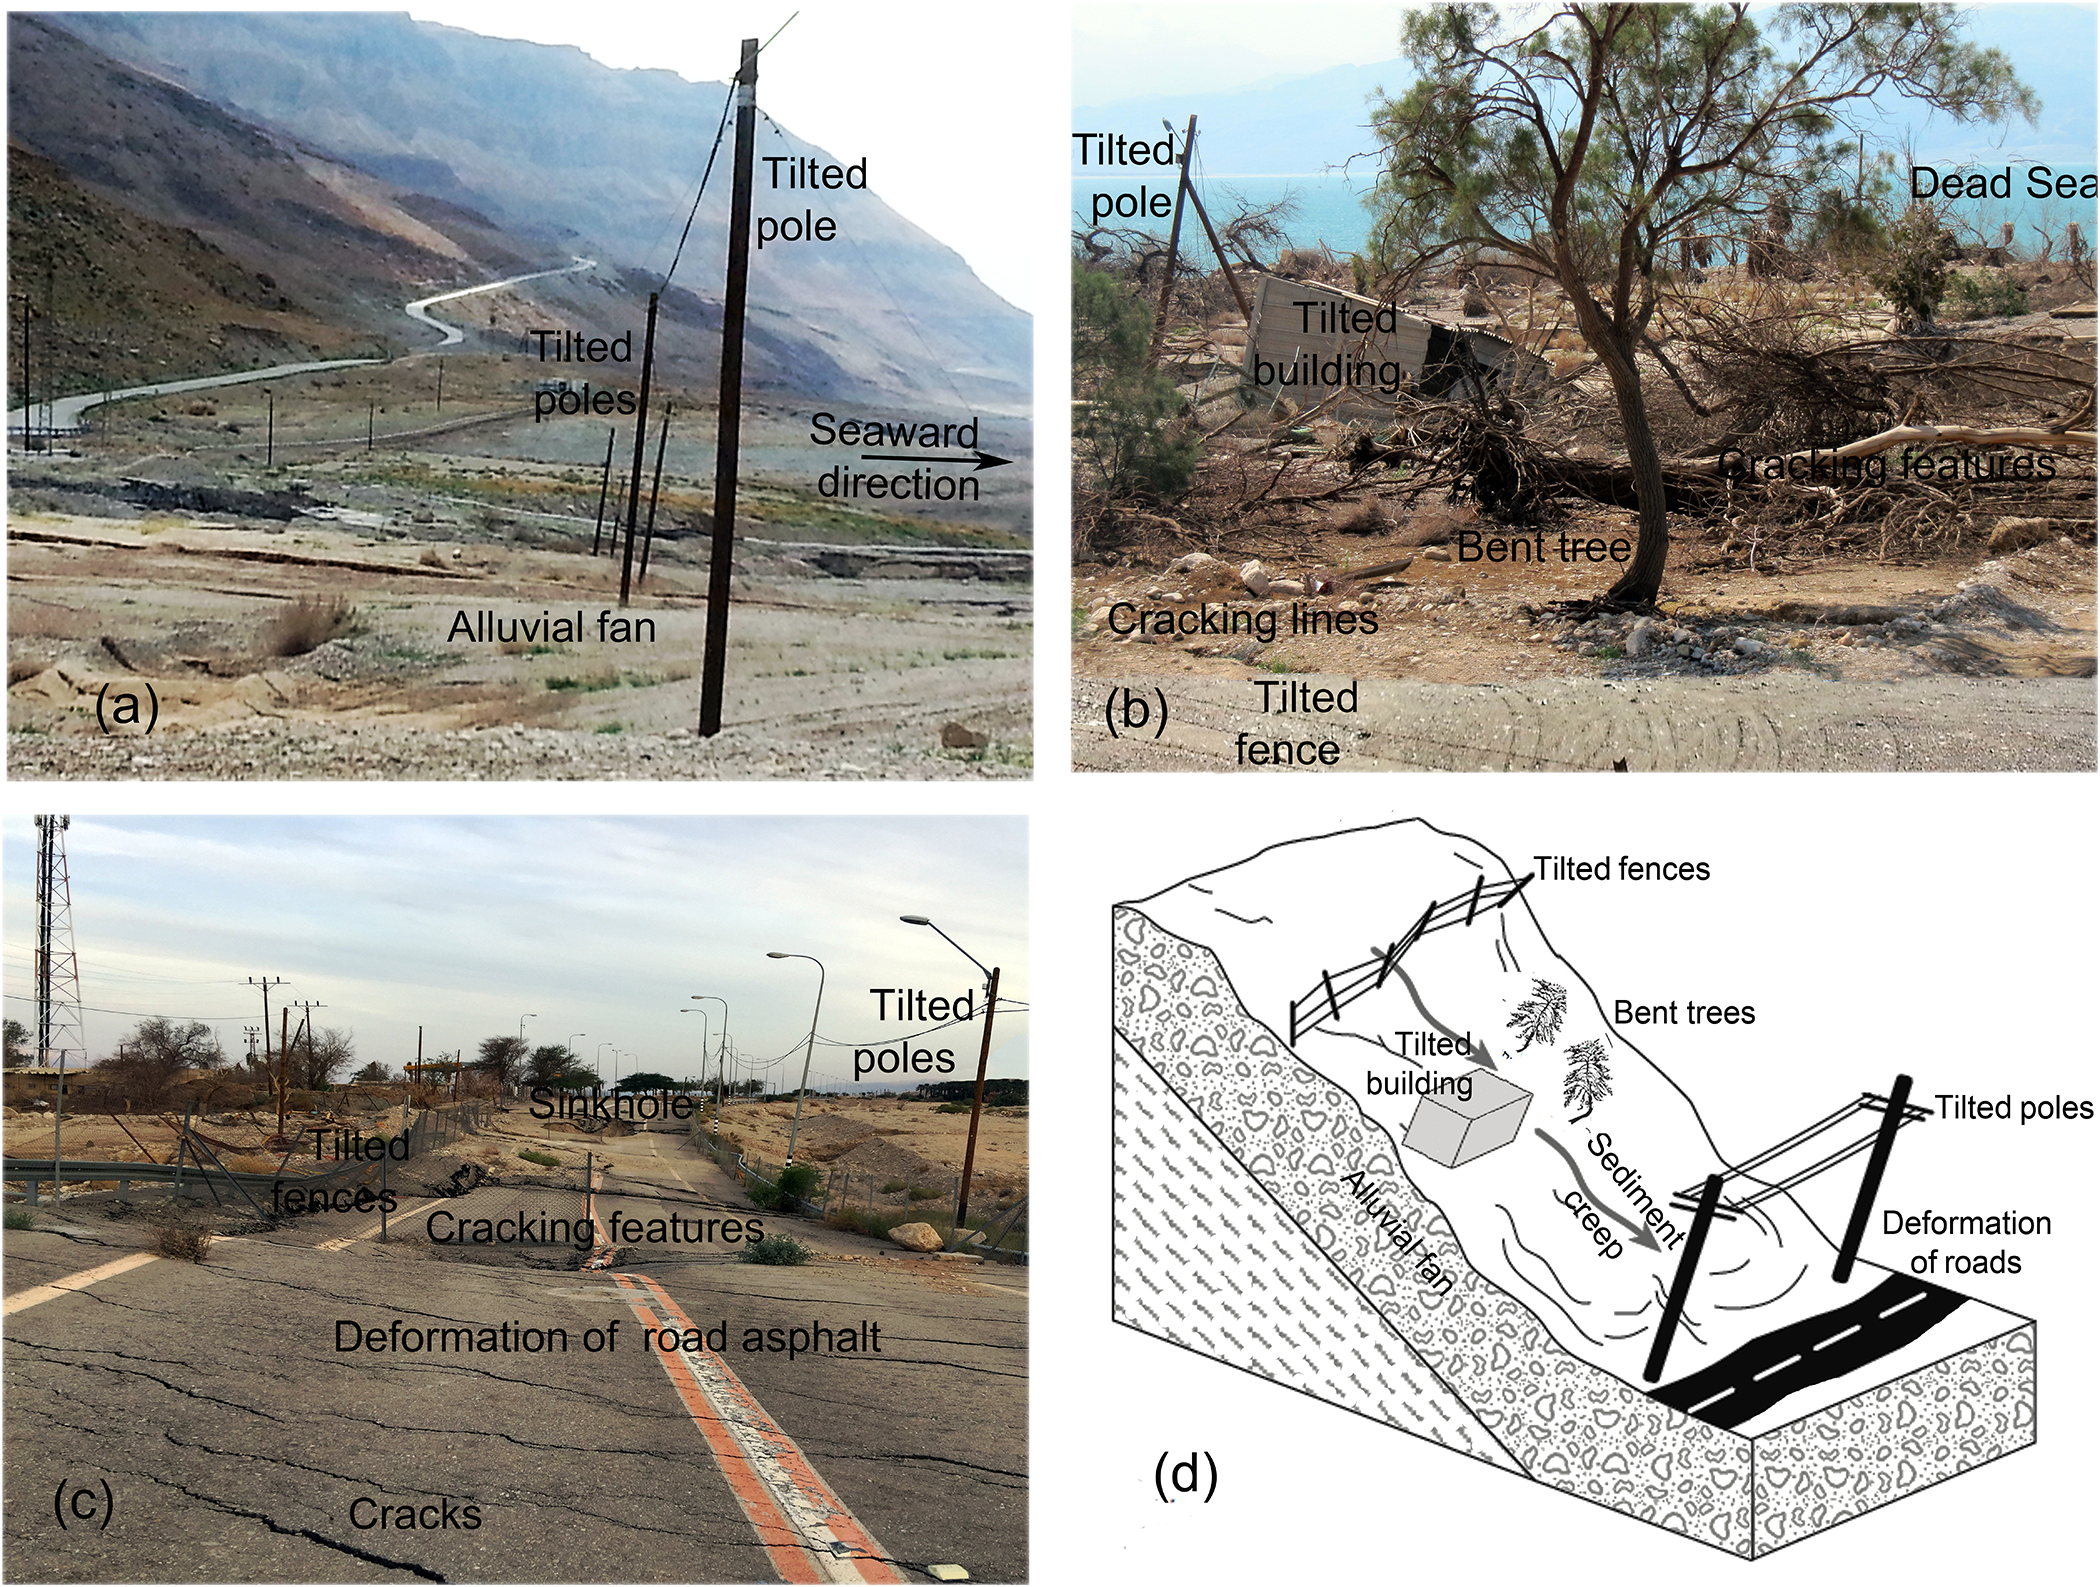
Indications of sediment creep in the alluvial fans. (a) Tilted poles downslope in the alluvial fan (Shalem site). (b) Bent trees, tilted buildings, tilted poles and tilted fences along with cracking features (Ein Gedi site). (c) Tilted poles, tilted fences and deformation of road asphalt along with cracking features (Ein Gedi site). (d) Illustration of the indications of sediment creep in the alluvial fans.

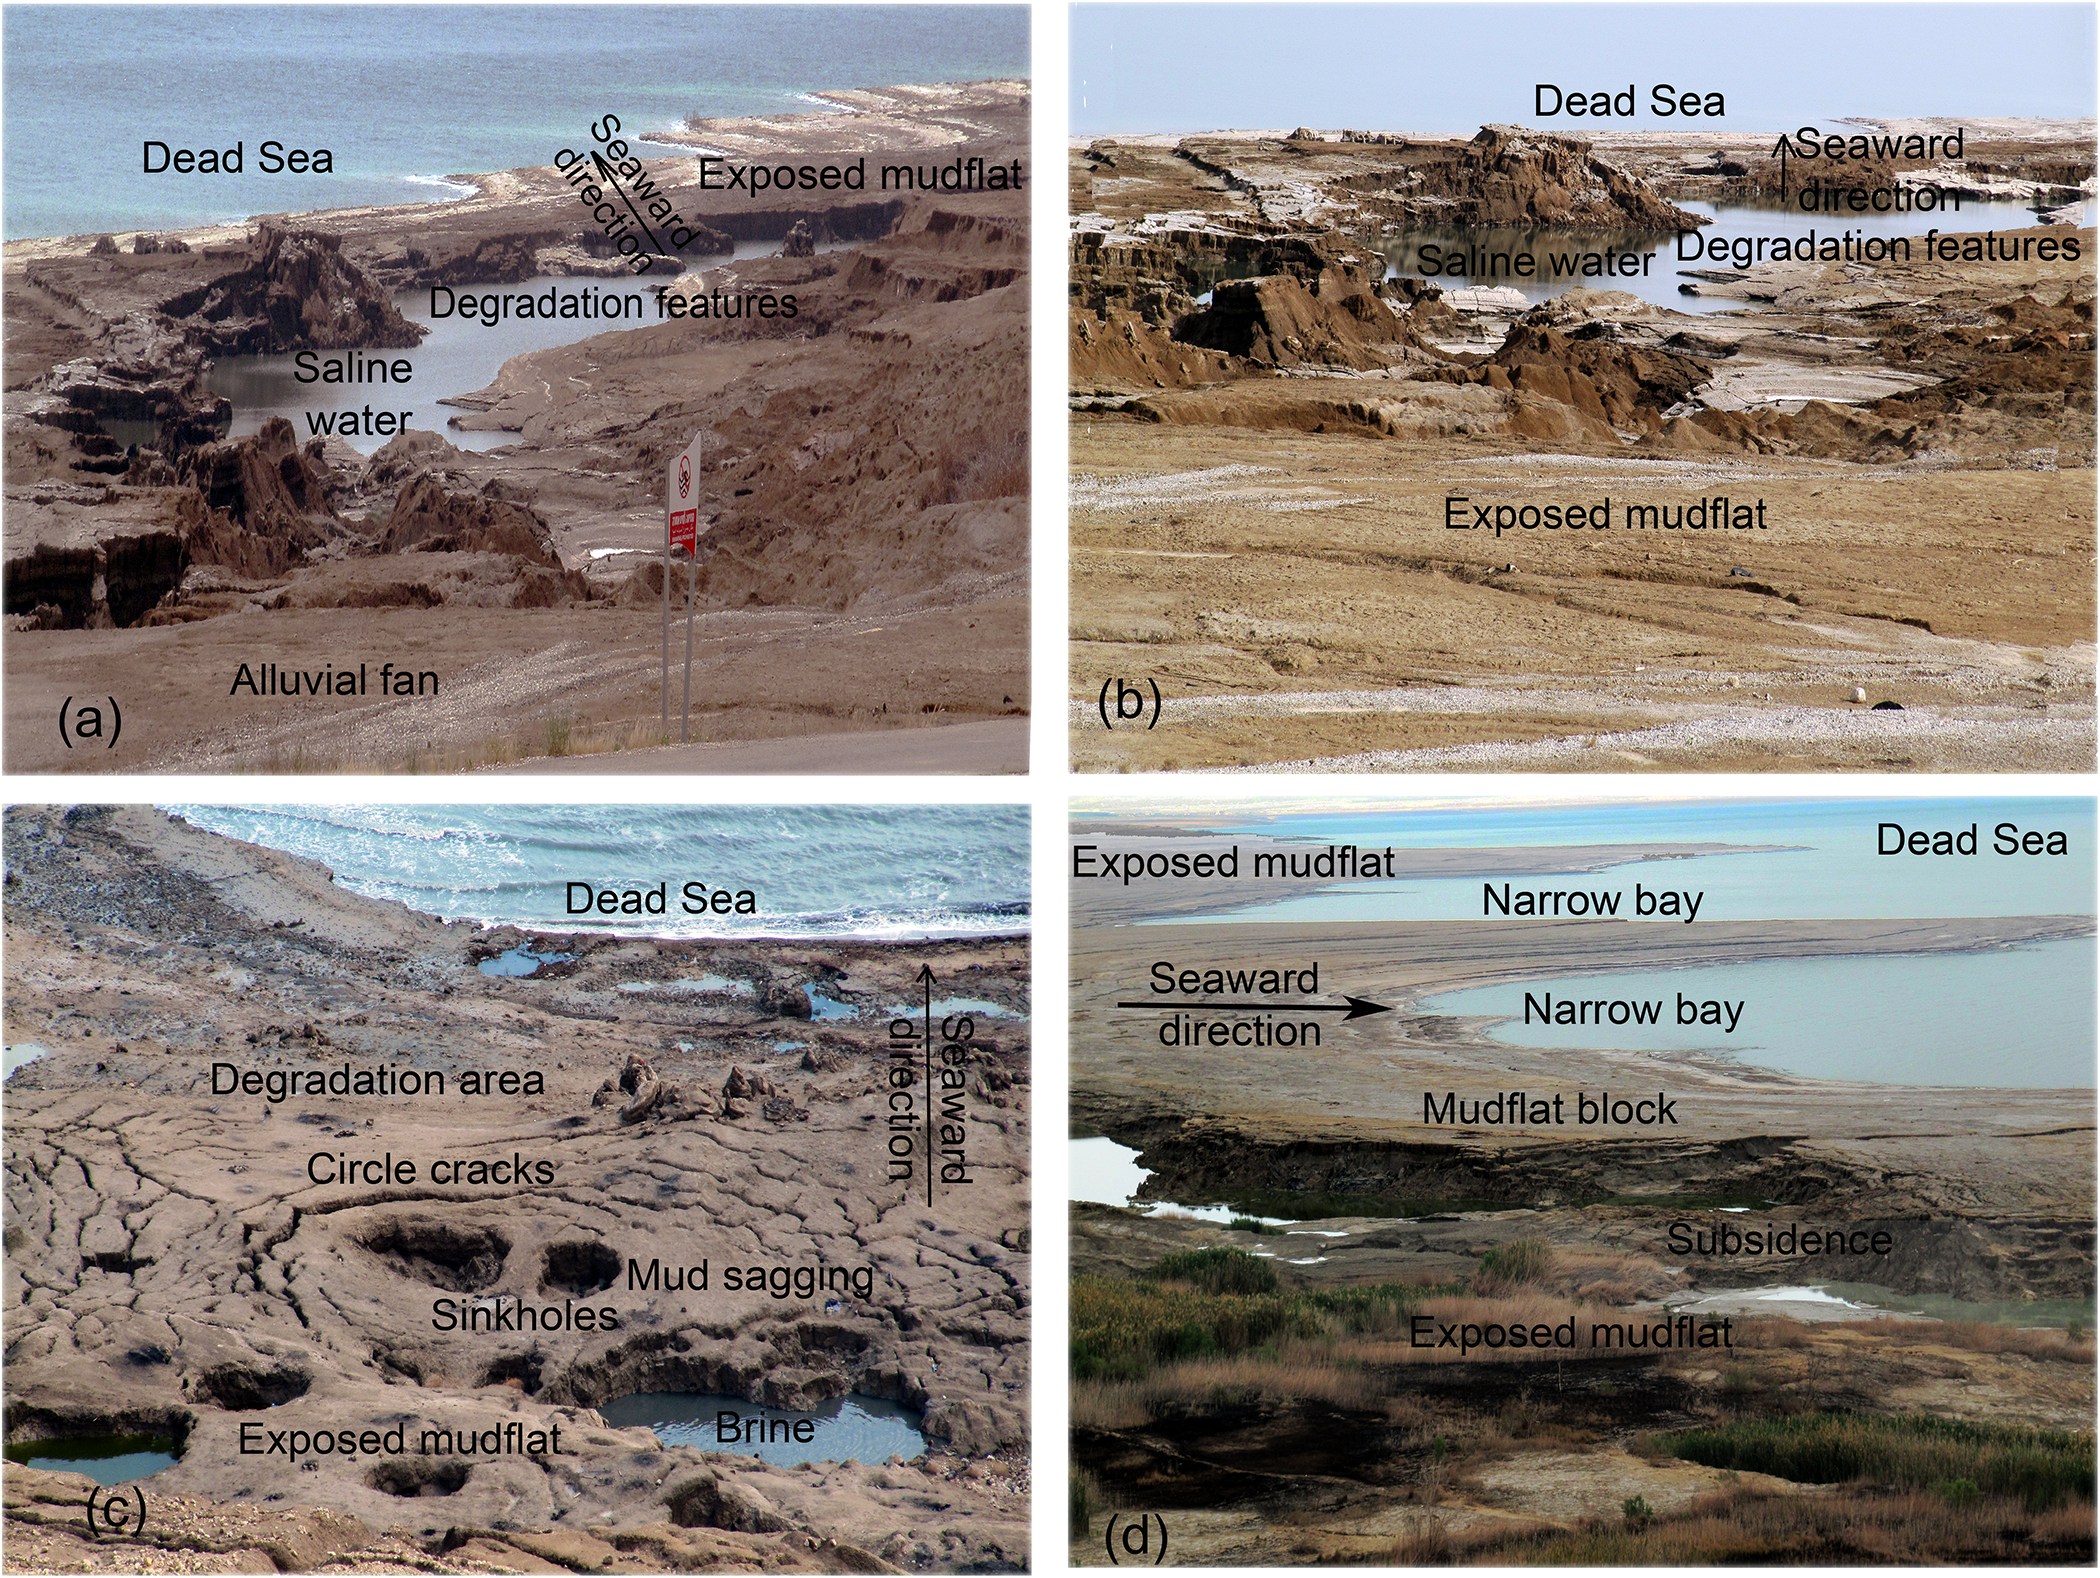
Processes affecting mudflat sediments on the coastal margin. (a–c) Coastal degradation with/without sinkholes along the coastline (Ein Gedi site). (d) Development of narrow coastal bays (Samar site).

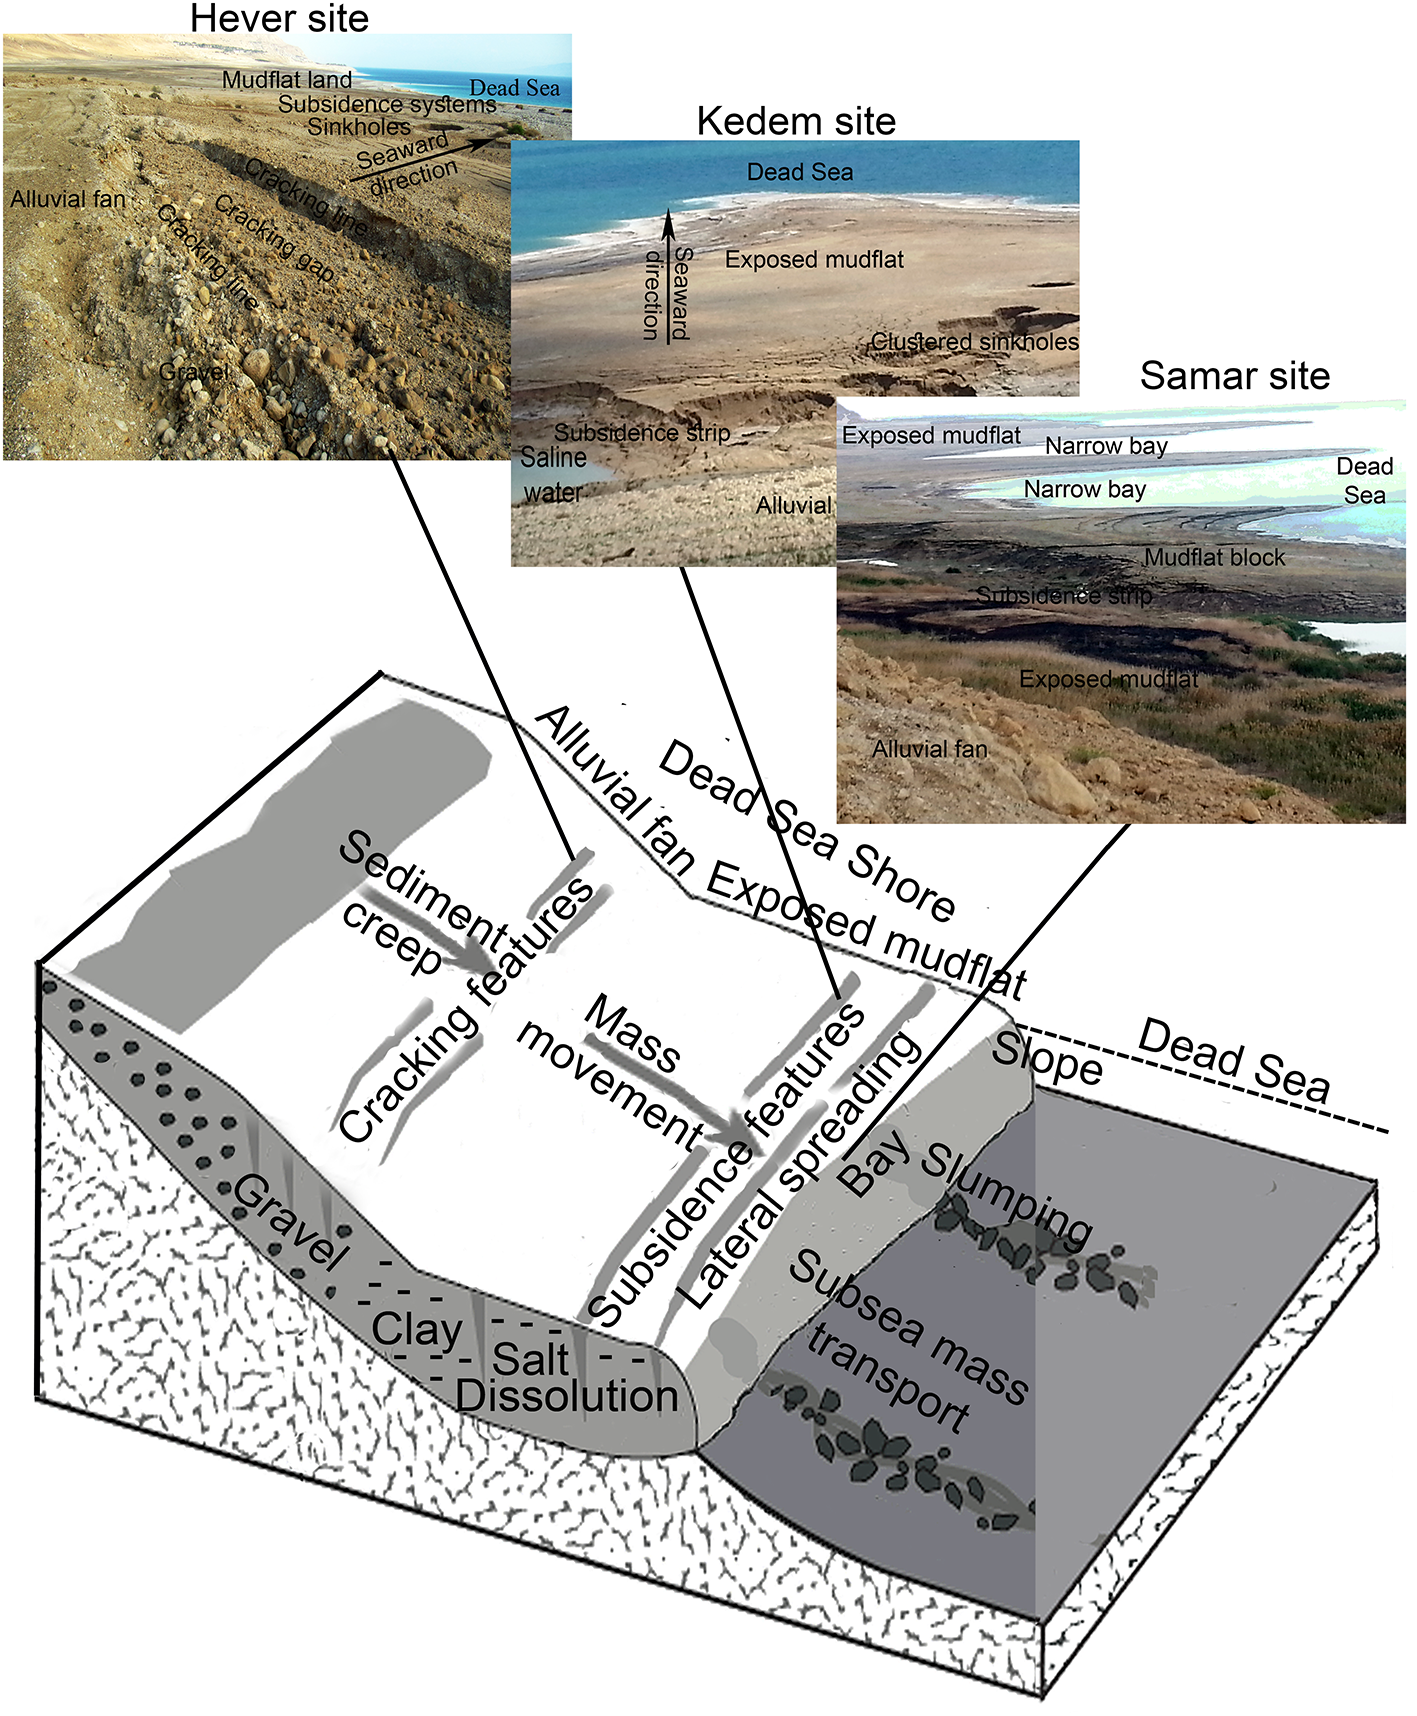
Summary of indications of the contribution of slow mass movement seaward to the coastal processes on the receding Dead Sea shore. See text for more details.

Properties of clays that promote movement and subsidence
The abundance of clay minerals contributes to movement, subsidence, displacement, landsliding and sliding of sediments and soils (Bhandary et al., Reference Bhandary, Yatabe, Takata, Sassa, Fukuoka, Wang and Wang2005; Brooks, Reference Brooks2013; Di Maio et al., Reference Di Maio, Scaringi and Vassallo2015). The presence of smectitic clay layers in clayey sediments facilitates movement and subsidence (Al-Homoud et al., Reference Al-Homoud, Khoury and Al-Omari1996). The ability of smectite layers to adsorb water and swell (Yariv & Cross, Reference Yariv and Cross2012) provides the muddy and lubricant properties of the clayey sediments under wet conditions, thus initiating sliding processes. Movement and subsidence are promoted by soaking with saline water and brine (Mariotti et al., Reference Mariotti, Kearney and Fagherazzi2016, Reference Mariotti, Kearney and Fagherazzi2019). Saturation of smectitic clay with sodium leads to clay dispersion (Pearson & Bauder, Reference Pearson and Bauder2006) and increases the muddy and lubricant properties of the clayey sediments.
The subsidence of the clayey sediments during the development of the subsidence features in the exposed mudflats (Figs 5 & 6) involves sediment collapse of dry mudflat sediments near the surface and mud sagging of wet mudflat sediments at the subsurface. The near-surface collapse of the dry mudflat sediments (Fig. 4a,b) is favoured by their unconsolidated fine-particle texture, composed of clay and carbonate minerals (Fig. 10a), and by the lack of significant cohesion (Ezersky & Livne, Reference Ezersky and Livne2013). The subsurface mud sagging of wet mudflat sediments (Fig. 5a,b) is promoted by the soaking with saline water and brine and by their muddy and lubricant properties under wet conditions due to the abundance of swelling smectitic clay (Fig. 10b) saturated with Na and Mg (Fig. 11).
The development of narrow subsidence strips
Field observations indicate that the development of narrow subsidence strips with/without clustered sinkholes (Fig. 5) occurs by movement and subsidence in mudflat sediments via lateral spreading (Fig. 14). Lateral spreading in clayey sediments and soils is described previously by Buma & Van Asch (Reference Buma, Van Asch, Dikau, Brundsen, Schrott and Ibsen1996) and Pasuto et al. (Reference Pasuto, Soldati, Tecca and Shroder2022). The lateral spreading locally interrupts the continuity of the mudflat sediments, causing subsidence of the clayey sediments and the formation of the narrow subsidence strips (Fig. 14a). Figure 14b illustrates the movement and subsidence in the formation of narrow subsidence strips, which involves the collapse of dry mudflat sediments near the surface and mud sagging of wet mudflat sediments at the subsurface.
A approximately shoreline-parallel extending of narrow subsidence strips in exposed mudflats (Fig. 5) and their gradual broadening over time suggest the contribution of slow mass movement seaward.
The development of wide subsidence strips
Wide subsidence strips with clustered sinkholes (Fig. 6) were developed via increased subsidence in mudflat sediments due to progressive dissolution within a subsurface rock–salt unit. Land subsidence with sinkholes on the Dead Sea shore due to salt dissolution within a subsurface rock–salt unit was reported previously by Baer et al. (Reference Baer, Schattner, Wachs, Sandwell, Wdowinski and Frydman2002), Abelson et al. (Reference Abelson, Baer, Shtivelman, Wachs, Raz and Crouvi2003, Reference Abelson, Yechieli, Crouvi, Baer, Wachs, Bein, Shtivelman, Enzel, Agnon and Stein2006), Nof et al. (Reference Nof, Baer, Ziv, Raz, Atzori and Salvi2013, Reference Nof, Abelson, Raz, Magen, Atzori, Salvi and Baer2019), Filin et al. (Reference Filin, Avni, Baruch, Morik, Arav and Marco2014) and Yechieli et al. (Reference Yechieli, Abelson and Baer2016). Salt–karst systems on the western shore were reported previously by Avni et al. (Reference Avni, Lensky, Dente, Shviro, Arav and Gavrieli2016) and Baer et al. (Reference Baer, Gavrieli, Swaed and Nof2024), and on the eastern shore by Watson et al. (Reference Watson, Holohan, Al-Halbouni, Saberi, Sawarieh and Closson2019).
It seems that an earlier formation of narrow subsidence strips in exposed mudflats (Fig. 5) promotes broadening into wide subsidence strips with clustered sinkholes (Fig. 6), as the former served as a preferential subsurface pathway for groundwater, thereby increasing the dissolution and salt karstification within the subsurface rock–salt unit.
An approximately shoreline-parallel extending of wide subsidence strips in exposed mudflats (Fig. 6) and their gradual broadening over time suggest the contribution of slow mass movement seaward.
The emergence of clustered sinkholes in exposed mudflats
The emergence of sinkholes occurs by subsidence of mudflat sediments into subsurface cavities, which result from dissolution within a subsidence rock–salt unit (Shalev et al., Reference Shalev, Lyakhovsky and Yechieli2006; Frumkin et al., Reference Frumkin, Ezersky, Al-Zoubi, Akkawi and Abueladas2011; Ezersky & Frumkin, Reference Ezersky and Frumkin2020, Reference Ezersky and Frumkin2021; Abelson, Reference Abelson, Kafri and Yechieli2021). Figure 15 shows the emergence of a sinkhole containing bottom brine in exposed mudflats via subsidence of mudflat sediments. Figure 15b illustrates the subsidence into a subsurface dissolution cavity in the emergence of the sinkholes, which involves the collapse of dry mudflat sediments near the surface and mud sagging of wet mudflat sediments at the subsurface. Geophysical methods confirm the existence of clay layers saturated with brine at the base of the sinkholes, and dense mud was found within the dissolution cavity at the subsurface salt–rock unit through the drilling of boreholes (Ezersky et al., Reference Ezersky, Legchenko, Kamerlynck and Al-Zoubi2009).
Increased subsidence in the formation of the sinkholes in exposed mudflats due to dissolution within the cavities in the subsurface rock–salt unit caused progressive widening from funnel-shaped sinkholes, collapse-sinkholes, wide collapse-sinkholes to coalesce-sinkholes (Fig. 7).
Coastal processes affecting gravel deposits in alluvial fans
In the alluvial fans on the higher Dead Sea shore, the retreat at the western Dead Sea shore formed cracking features: open cracks (Fig. 8a,b) and tension gaps (Fig. 8c,d). Figure 16 highlights indications of the movement of gravel deposits in alluvial fans via sediment creep seaward through slow mass movement. Indications of sediment creep in the alluvial fans are the presence of tilted poles downslope, bent trees, tilted buildings, tilted fences and deformation of road asphalt along with cracking features (Fig. 16a–c; Sharpe, Reference Sharpe1938; Parizek & Woodruff, Reference Parizek and Woodruff1957). Figure 16d illustrates the indications of sediment creep in the alluvial fans.
In the alluvial fans, the approximately shoreline-parallel extension of the cracking features – open cracks and tension gaps (Fig. 8a–c) – and their gradual broadening over time confirm the contribution of slow mass movement seaward. The location of the alluvial fans on the higher Dead Sea shore (Fig. 4c) appears to be significantly above the subsurface rock–salt layer, where this layer occurs. Thus, the movement of gravel deposits in the alluvial fans is less affected by subsurface dissolution.
Processes affecting mudflat sediments on the coastal margin
Processes of coastal degradation along the coastline (Fig. 17a–c) and the development of narrow coastal bays (Fig. 17d) affect the mudflat sediments on the coastal margin. The scarred slopes of the Dead Sea provide evidence of intensive subsea landsliding (Lensky et al., Reference Lensky, Calvo, Sade, Gavrieli, Katz and Hall2014). The bathymetric morphology of the coastal margin (Fig. 13b) indicates subsea mass transport on the subsea slope (Lensky et al., Reference Lensky, Calvo, Sade, Gavrieli, Katz and Hall2014). Mass transport deposits as seismites in the Dead Sea depocenter have been reported previously by Lu et al. (Reference Lu, Waldmann, Ian Alsop and Marco2017).
The narrow coastal bays along the coastline (Fig. 17d) are considered to be scars resulting from slumping of littoral sediments on the subsea slope (Alsop & Weinberger, Reference Alsop and Weinberger2020). These bays are currently visible along the shoreline due to the receding of the western Dead Sea shore. The subsea mass transport on the shelf slope has been well documented previously (Shepard & Dill, Reference Shepard and Dill1966; Masson et al., Reference Masson, Harbitz, Wynn, Pedersen and Løvholt2006, Reference Masson, Wynn, Talling, Krastel, Behrmann, Völker, Stipp, Berndt and Urgeles2010; Vanneste et al., Reference Vanneste, Forsberg, Glimsdal, Harbitz, Issler, Kvalstad, Margottini, Canuti and Sassa2013).
Summary of indications of the contribution of slow mass movement seaward
Figure 18 summarizes the indications of the contribution of slow mass movement seaward to the coastal processes on the receding Dead Sea shore. The indications in the exposed mudflats are the approximately shoreline-parallel extension of the subsidence features – subsidence strips and clustered sinkholes – (Fig. 5) and their gradual broadening over time (Fig. 6). The indications in the alluvial fans include seaward sediment creep (Fig. 16), the approximately shoreline-parallel extension of cracking features – open cracks and tension gaps – (Fig. 8a–c) and their gradual broadening over time.
In exposed mudflats, indications of a contribution of slow mass movement seaward (Fig. 18) could be supported by the occurrence of lateral spreading of clayey sediments in the narrow subsidence strips (Fig. 14) and by the seaward migration of newly formed clustered sinkholes (Fig. 13a). The coastal degradation alongside the coastline (Fig. 17a–c) and the development of narrow coastal bays (Fig. 17d) also involve the movement of mudflat sediments towards the subsea slope. Subsea mass transport on the subsea slope is indicated by the bathymetric morphology of the coastal margin (Fig. 13b).
Conclusions
(1) The coastal processes on the receding Dead Sea shore and the subsidence features are parts of the adjustment of the Dead Sea periphery to the lowering of its base level. The coastal processes of movement and the subsidence of clayey sediments affect the formation of subsidence features – subsidence strips and clustered sinkholes – in the exposed mudflats.
(2) The subsidence of the clayey sediments in the development of the subsidence features in the exposed mudflats involves sediment collapse of the dry mudflat sediments near the surface and mud sagging of the wet mudflat sediments in the subsurface. The near-surface sediment collapse is favoured by its unconsolidated fine-particle texture composed of clay and carbonate minerals and by the lack of significant cohesion. The subsurface mud sagging is promoted by the soaking with saline water and brine and by its muddy and lubricant properties under wet conditions due to the abundance of swelling smectitic clays saturated with Na and Mg.
(3) Narrow subsidence strips with/without clustered sinkholes were developed through the movement and subsidence in the mudflat sediments via lateral spreading. The lateral spreading locally interrupts the continuity of the mudflat sediments, causing subsidence of the clayey sediments and the formation of narrow subsidence strips.
(4) Wide subsidence strips with clustered sinkholes were developed through increased subsidence in mudflat sediments due to the progress of dissolution within a subsurface rock–salt unit. It seems that an earlier formation of narrow subsidence strips in exposed mudflats promotes the broadening into wide subsidence strips with clustered sinkholes, as the former served as a preferential subsurface pathway for groundwater that increased the dissolution and salt karstification within the subsurface rock–salt unit.
(5) Increased subsidence in the formation of the sinkholes in exposed mudflats due to the progress of dissolution within the cavities in the subsurface rock–salt unit is caused progressive widening from funnel-shaped sinkholes, collapse-sinkholes, wide collapse-sinkholes to coalesce-sinkholes.
(6) A contribution of slow mass movement seaward to the coastal processes on the receding Dead Sea shore is indicated. The indications in the exposed mudflats are the approximately shoreline-parallel extension of the subsidence features and their gradual broadening over time. The indications in the alluvial fans are the features of sediment creep seaward, the approximately shoreline-parallel extension of cracking features and their gradual broadening over time.
Acknowledgements
Part of this study was conducted while the author was a visiting scientist at the Institute of Earth Sciences at the Hebrew University of Jerusalem. The author thanks Professor Oded Navon of this institute for his collaboration.
Financial support
This research was supported by the research funds of the Open University of Israel’s Research Authority (Award Number: 37226 in year 2018, awarded to S. Shoval).
Competing interests
The author has no competing interests to declare. The author is the sole contributor. The work submitted is an original scientific study (research article) and was prepared and written by the author as a professor at the Open University of Israel. The author consents for publication in this journal. There are no biological applications.
Data availability statement
The raw database is available from the author. The data are mainly based on field observations by the author. All field photographs are by the author and were taken by the author in the field. Other figures are based on public domain information from NASA, public reports of the Geological Survey of Israel and official maps of the Geological Survey of Israel on the website ‘Dead Sea sinkholes and subsidence monitoring’ (https://egozi.gsi.gov.il/WebApps/hazards/sinkholes_subsidence/).
Declaration
This manuscript has not previously been published elsewhere. While under review for Clay Minerals, it was not submitted to any other publication.

 Open access