


Introduction
Antarctica is among the most remote and inaccessible continents and is notorious for its extreme climatic conditions, insurmountable geographical barriers and pristine environments. These features make Antarctica a perfect model to study the biological responses of local flora and fauna to adverse climatic conditions, as well as their biodiversity, distribution, population genetics and associated microbial communities (e.g. Peck et al. Reference Peck, Convey and Barnes2006, McGaughran et al. Reference McGaughran, Stevens, Hogg and Carapelli2011, Convey & Peck Reference Convey and Peck2019, Guidetti et al. Reference Guidetti, Massa, Bertolani, Rebecchi and Cesari2019, Cakil et al. Reference Cakil, Garlasché, Iakovenko, Di Cesare, Eckert and Guidetti2021, Leo et al. Reference Leo, Nardi, Cucini, Frati, Convey and Weedon2021).
Antarctica is commonly divided into three main terrestrial biological regions: the sub-Antarctic, the Maritime Antarctic and Continental Antarctica, characterized by different climatic features, biodiversity and ecosystem development (Convey Reference Convey2017). Within each of these regions, these features are broadly similar, although the overall Antarctic biogeography is far more complex, with 16 Antarctic Conservation Biogeographic regions currently recognized (Terauds & Lee Reference Terauds and Lee2016), many of them hosting biodiversity that shows considerable regional endemism (Convey et al. Reference Convey, Biersma, Casanova-Katny, Maturana, Oliva and Ruiz-Fernández2020). The most extreme conditions are experienced in the continental region (the entire continental landmass apart from the western side of the Antarctic Peninsula), making this one of the most challenging environments for life on Earth (Obryk et al. Reference Obryk, Doran, Fountain, Myers and McKay2020).
It is well known that air temperatures registered by standard meteorological stations and satellite infrastructures, while relevant for the study of large-scale climatic features, are not capable of capturing the fine-scale climatic dynamics in local microhabitats occupied by terrestrial biodiversity (Lembrechts et al. Reference Lembrechts, van den Hoogen, Aalto, Ashcroft, De Frenne and Kemppinen2021). This is also the case in Antarctica, where multiple studies have highlighted the heterogeneity of air, ground, freshwater and even intertidal temperatures (Davey et al. Reference Davey, Pickup and Block1992, Quayle et al. Reference Quayle, Peck, Peat, Ellis-Evans and Harrigan2002, Peck et al. Reference Peck, Convey and Barnes2006, Convey et al. Reference Convey, Coulson, Worland and Sjöblom2018, Clarke & Beaumont Reference Clarke and Beaumont2020), reinforcing the notion that climatic parameters should be recorded at small and biologically relevant physical and temporal scales (Peck et al. Reference Peck, Convey and Barnes2006, Convey et al. Reference Convey, Coulson, Worland and Sjöblom2018). Microhabitats can be influenced by multiple different abiotic factors (e.g. radiation, water availability, soil composition, ground topography, etc.) that act on fine geographical scales and can lead to substantial temperature differences across microhabitats and between microhabitat and open-air temperatures (Woods et al. Reference Woods, Dillon and Pincebourde2015, Hrbáček et al. Reference Hrbáček, Cannone, Kňažková, Malfasi, Convey and Guglielmin2020). Furthermore, in nivean regions, accumulated snow operates as a thermal insulator, to the extent that sub-nivean temperatures rarely drop below -15°C and frequently remain close to 0°C, allowing (or even forcing) invertebrates, plants and microorganisms to be metabolically active even when the air temperature is substantially lower (e.g. Convey et al. Reference Convey, Abbandonato, Bergan, Beumer, Biersma and Bråthen2015, Reference Convey, Coulson, Worland and Sjöblom2018).
There has long been intense interest in the adaptations and responses of Antarctic species to the extreme environmental stresses that they experience, in particular that of temperature (Peck et al. Reference Peck, Convey and Barnes2006, Denlinger & Lee Reference Denlinger and Lee2010, Giovannini et al. Reference Giovannini, Altiero, Guidetti and Rebecchi2018, Cucini et al. Reference Cucini, Leo, Nardi, Greco, Manfrin, Giulianini and Carapelli2021). However, the majority of microenvironmental data available for southern polar microhabitats originates from the sub-Antarctic and Maritime Antarctic (e.g. Davey et al. Reference Davey, Pickup and Block1992, Quayle et al. Reference Quayle, Peck, Peat, Ellis-Evans and Harrigan2002, Reference Quayle, Convey, Peck, Ellis-Evans, Butler and Peat2003, Convey et al. Reference Convey, Coulson, Worland and Sjöblom2018), while data for inland continental areas are more limited (Moorhead et al. Reference Moorhead, Wall, Virginia and Parsons2002, Guglielmin et al. Reference Guglielmin, Worland and Cannone2012). In this study, we collate microclimatic data from two Continental Antarctic microhabitats in order to better understand the environmental conditions experienced by the micro-arthropods (Collembola and Acari) and other micro-invertebrates (Tardigrada, Nematoda and Rotifera), which are the dominant groups of terrestrial faunal biodiversity represented in Continental Antarctica (Convey Reference Convey2017). To do so, we collected temperature data over a continuous period of 1 year from selected microhabitats in Victoria Land. These monitoring sites were chosen to be representative of two types of habitats known to harbour rich communities of these invertebrate groups and non-vascular plants (Sinclair Reference Sinclair2001, Cesari et al. Reference Cesari, McInnes, Bertolani, Rebecchi and Guidetti2016, Convey et al. Reference Convey, Biersma, Casanova-Katny, Maturana, Oliva and Ruiz-Fernández2020): shallow freshwater ponds, known to host populations of Nematoda, Rotifera and Tardigrada; and soils under scattered rock coverage, where Acari and Collembola are frequently observed at high densities. The microhabitat temperature data obtained were also compared with the standard meteorological record from the closest automatic weather station (AWS; Mario Zucchelli Station - Eneide) in order to track variation on appropriate biologically relevant scales, following the Scientific Committee on Antarctic Research Antarctic Nearshore and Terrestrial Observing System (SCAR ANTOS; see www.scar.org) mission. The data obtained are intended to contribute to a step change in knowledge of the environmental parameters directly influencing terrestrial biota and possibly to aid with the development of mathematical models (e.g. Wagner et al. Reference Wagner, Trutschnig, Bathke and Ruprecht2018), improving the prediction of microhabitat parameters based on standard meteorological air temperature records.
Materials and methods
Site description and data collection
Microhabitat temperature records were obtained using four temperature data loggers (Aquatic 2 TG-4100, Tinytag) of 50 mm height and 51 mm diameter, with a recording range of -40°C to 70°C and a resolution of 0.01°C. The loggers were deployed during the Italian National Antarctic Program (PNRA) expedition in January 2019 and recovered 1 year later. Temperatures were recorded every hour and the analyses presented cover the period 25 January 2019 to 24 January 2020. Data loggers were positioned in different locations close to the Italian research station Mario Zucchelli Station, namely in the areas of Campo Antenne (three specific locations; 74°42.075'S, 164°06.003′E) and Oasi (one location; 74°41.599′S, 164°06.055′E) (Fig. 1). The three locations at Campo Antenne included two in soil under rocks (Campo Antenne 1 and Campo Antenne 2) and one in a freshwater pond (small pond Campo Antenne) (Fig. S1). In Oasi, temperatures were recorded in a freshwater pond (Oasi) (Fig. S2). These sites were selected in order to monitor environmental conditions experienced by Acari, Collembola, Tardigrada and Rotifera, groups that have been studied in various disciplines in the same area.
Locations of sites in Victoria Land (in red) with respect to the Italian research station Mario Zucchelli Station (MZS; in black). AWS = automatic weather station.

The two data loggers recording soil temperatures were positioned below small-sized (< 50 cm) white/grey granite rocks exposed amongst the gravel and coarse-grained soil that characterize the area. The undersides of these stones can be colonized by type I hypolithic communities (Cowan et al. Reference Cowan, Khan, Pointing and Cary2010) that provide habitats for the springtail Cryptopygus terranovus (Carapelli et al. Reference Carapelli, Leo and Frati2017) and the mite Stereotydeus delicatus (Brunetti et al. Reference Brunetti, Siepel, Fanciulli, Nardi, Convey and Carapelli2021). The two data loggers recording freshwater temperatures were placed on the bottoms of shallow permanent ponds of ~30 m diameter and 40 cm depth that remained partly covered by ice during the summer period. The pond benthos comprised sediments and rocks of different sizes (ranging from 2 to 30 cm diameter), providing the typical microenvironment for tardigrade and rotifer species (Cesari et al. Reference Cesari, McInnes, Bertolani, Rebecchi and Guidetti2016, Dartnall Reference Dartnall2017). Standard meteorological data from the closest AWS, Eneide Station, at 82 m above sea level and 300 m from Mario Zucchelli Station, provided air temperatures. The distances between the AWS and the two study sites were 379 and 657 m (Fig. 1). Data and information regarding the AWS were obtained from the PNRA's ‘MeteoClimatological Observatory at Mario Zucchelli Station (MZS) and Victoria Land’ (http://www.climantartide.it).
Data analyses
Temperature data were imported into R v.3.4.4 and analysed/plotted to extract the information reported below. Daily means and daily excursions were compared between the two pond sites and the two soil sites on a monthly basis using a two-way repeated measure analysis of variance (ANOVA) test in GraphPad (Prism; San Diego, CA, USA). The factors used were ‘day', for matching repeated measures, and ‘site’ (pond sites with n = 2 vs soil sites with n = 2). The AWS Eneide data were not included in this analysis due to a lack of replicates.
Cumulative degree days were calculated as the sum of mean daily temperature above 0°C multiplied by the number of days with that mean temperature following Convey et al. (Reference Convey, Coulson, Worland and Sjöblom2018). The thaw period, which is useful for assessing the duration of positive temperature, was calculated here as the time between thawing (> 1°C) at the beginning of the summer and refreezing (< -1°C) at its end. The ‘zero curtain period’ was calculated as the period when the temperature remained between -1°C and +1°C, regardless of any larger variability in external temperature, at the onset and fall of the warm season.
Results
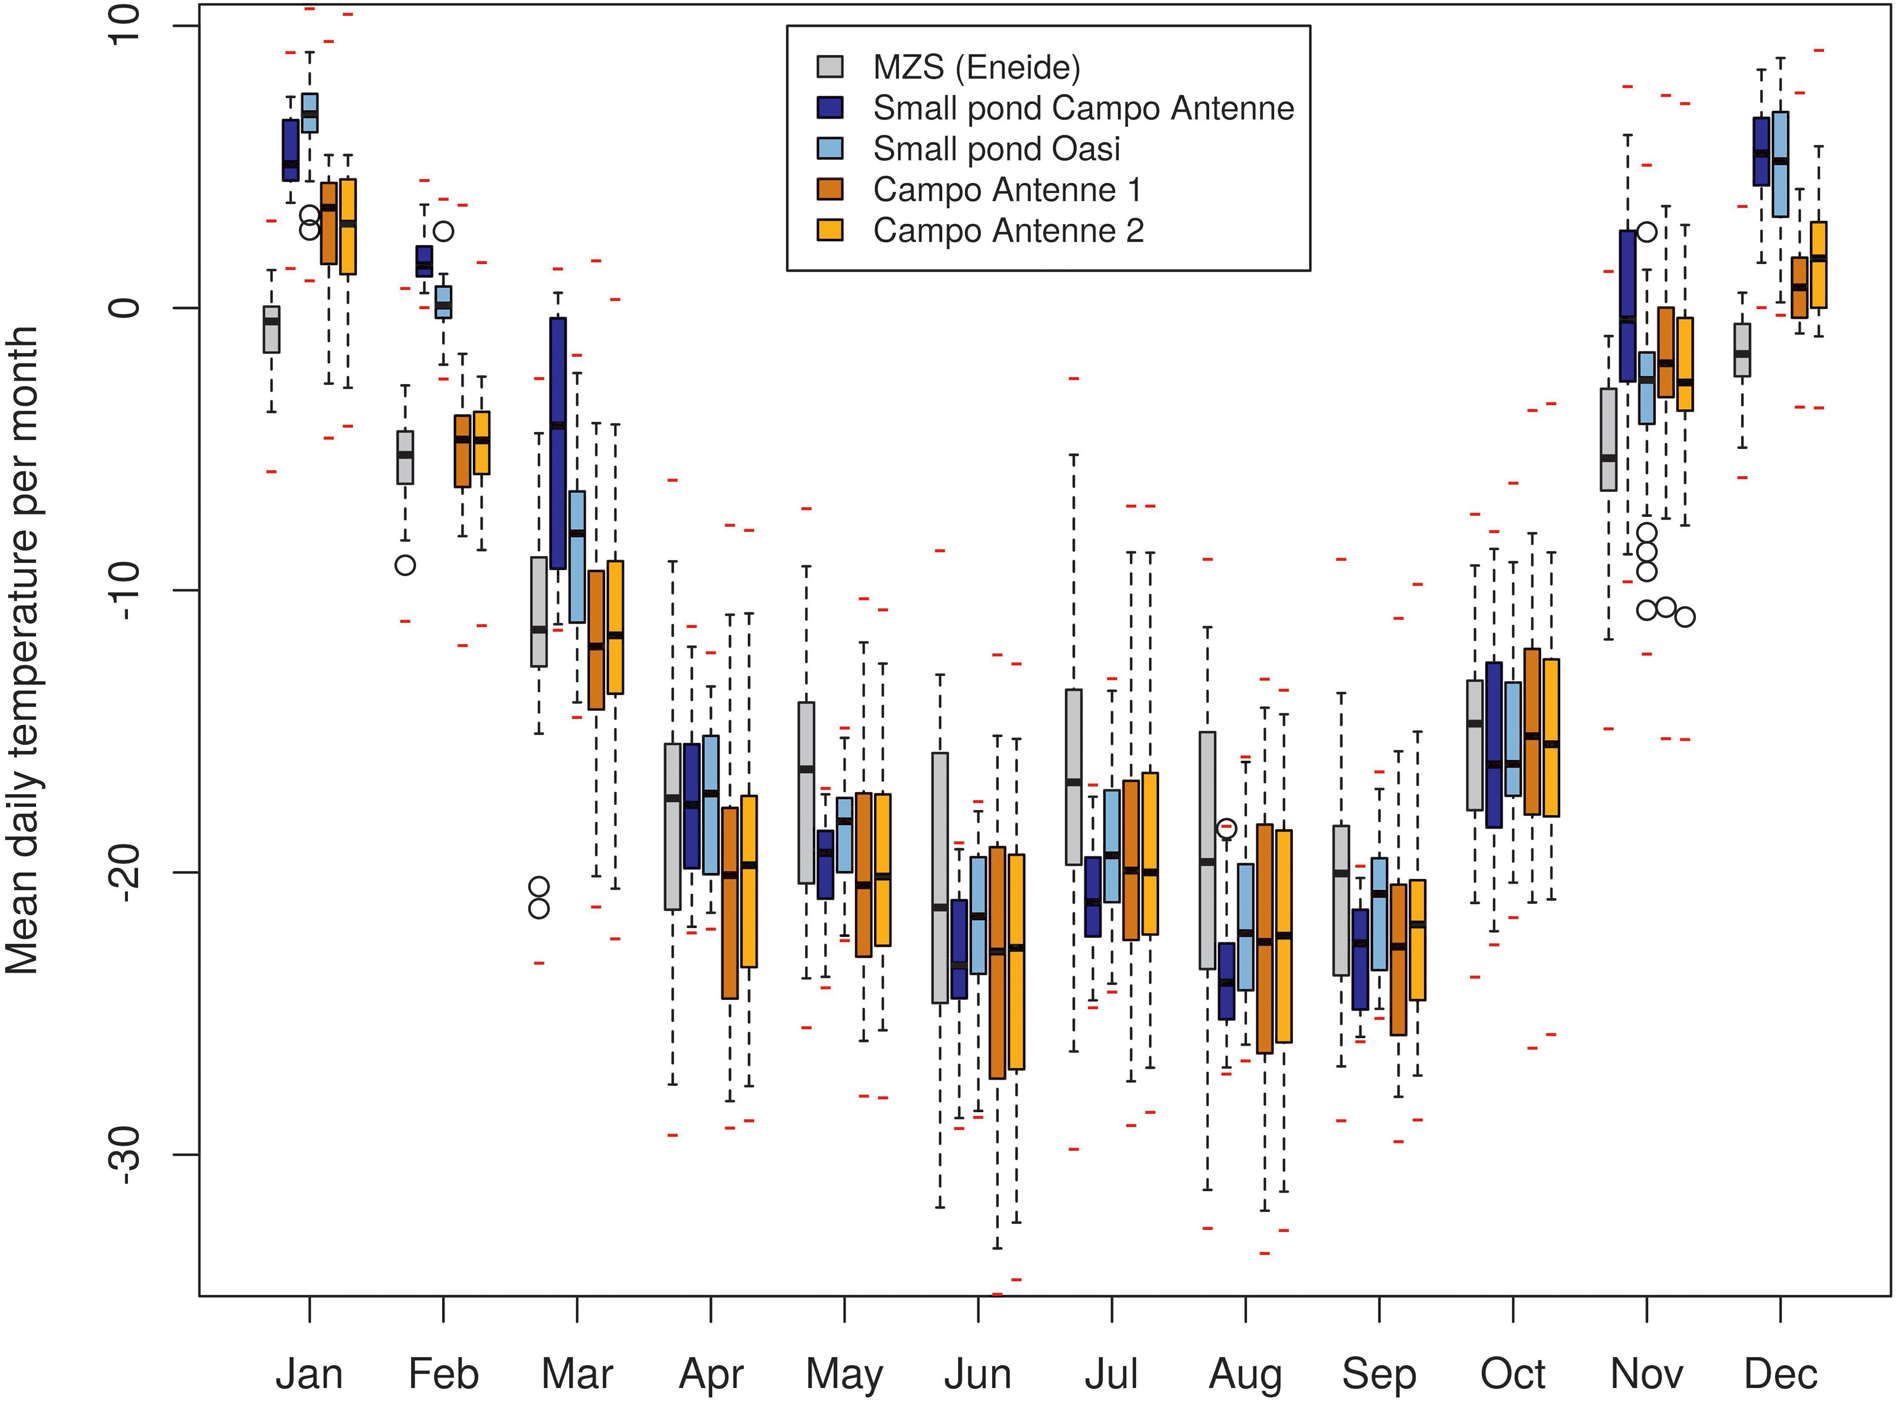
Based on minimum, maximum and average temperature values, four main temporal phases were apparent in the data obtained during this study (Fig. 2). During the summer (from November to February), average daily soil and pond temperatures ranged between -5°C and +6°C. In March, during the autumn, maximum temperatures rapidly dropped below 0°C and average temperatures dropped below -10°C, with almost no positive temperatures recorded. During winter, in April to September, the lowest temperatures were recorded, with average daily temperatures typically in the range of -18°C to -22°C. The beginning of spring, marked by increasing temperatures, was apparent in October, with a rapid increase of temperatures in November (to average temperatures of ~0°C). The AWS registered the absolute minimum temperature of all of the sites (-35.8°C), while the absolute maximum temperature of 11.9°C was recorded in the Oasi pond in summer (Table I). Overall, during the whole year of data collection, mean temperatures showed marked variability at the different sites. While differences in annual means were limited (up to ~2°C; Table I), large differences were observed in specific periods of the year (Fig. 2). On a monthly basis, strong dissimilarities between sites were observed during summer (7.5°C in January between Oasi and Eneide), contrasting with more uniformity in winter/spring (0°C in July between Campo Antenne 2 and Oasi and 0.34°C in October between the ponds). The Eneide AWS generally recorded lower temperatures than the soils and ponds during summer/autumn (up to 7.5°C lower in January) but slightly warmer and generally comparable temperatures during winter/spring. This last result is slightly at odds with the observation that microhabitats, at variance with the AWS, are covered by snow and hence thermally buffered, and so in order to investigate this further, temperatures registered in July (the month where this effect is more evident) were considered in more detail (Fig. S3). Temperature profiles displayed clear and coordinated fluctuations on a one- to multi-day scale, although the rate of temperature change differed across sites. In days characterized by an increase in temperature (e.g. 9, 21 and 23 July), the AWS showed the highest rates of temperature change, followed by the soil sites and pond sites. Therefore, in these short periods of warming, the AWS quickly reached higher temperatures than the soil and pond sites. The same effect was visible based on the comparison of daily minima/means/maxima, with minima being similar across sites, while maxima were slightly higher at the AWS in comparison with the soil and pond sites (Fig. S3). This suggests that thermal buffering, provided by snow cover and the higher thermal capacities of soil and water compared to air, may have led to the decrease in average temperatures, as it did not allow soil and pond sites to gain thermal energy from short warm periods in winter, unlike in summer.
Distribution of mean daily temperature by month. Boxes indicate the interquartile range, whiskers indicate quartiles ±1.5 interquartile range, black marks indicate monthly medians, red marks indicate point (hourly) absolute minima and maxima and empty circles indicate outliers. MZS = Mario Zucchelli Station.
Absolute minimum, maximum, annual mean and daily ranges (minimum and maximum of mean daily temperatures) for each of the monitoring sites and the Eneide automatic weather station (AWS).

Considerable differences were also apparent between sites in terms of daily temperature excursions (Fig. 3). The Eneide AWS showed daily air temperature excursions of between ±3°C and ±4°C (in the warmest season) and up to ±6°C (in the coldest period). In contrast, the microhabitat sites displayed the opposite pattern, with the highest daily excursions occurring during summer and the lowest occurring during winter. The soil sites recorded limited daily excursions from autumn (March) to the end of winter (September) (±4°C to ±5°C), which increased to ±6.0°C to ±8.2°C during the period from October to February. The two ponds showed a similar overall pattern, although with lower variability, with excursions during autumn and winter ranging between approximately ±0.8°C and ±1.4°C and increasing to ±3°C to ±5°C during the summer.
Distribution of daily excursions by month. Boxes indicate the interquartile range, whiskers indicate quartiles ±1.5 interquartile range, black marks indicate monthly medians and empty circles indicate outliers. MZS = Mario Zucchelli Station.

The two-way repeated measures ANOVA test identified a significant difference (P < 0.05) between temperatures registered at the pond sites (small pond Campo Antenne and small pond Oasi) vs the soil sites (Campo Antenne 1 and Campo Antenne 2) in 4 out of 12 months, namely December–February and April. The difference in March was marginally non-significant (P = 0.085).
The same test identified significant differences between daily excursions registered at pond sites and soil sites in all months with the exception of December. Details of both analyses are given in Tables S1 & S2.
Focusing on the warmer months of the biologically active season (November–March), temperature patterns at the different study locations varied substantially (Fig. 4). While mean daily temperatures in December and January were consistently > 0°C in all four microhabitats (with minimal exceptions; see Fig. 4), sub-zero temperatures were still observed for short time intervals. In the two pond sites, sub-zero temperatures were recorded on two different days (average 11.5 h per day) at Oasi (but not at Campo Antenne). In the two soil sites, sub-zero temperatures were recorded on 46 and 52 different days (Campo Antenne 1 and Campo Antenne 2, respectively) for averages of 11.4 and 10.1 h. In the same period, sub-zero temperatures were recorded on all days except for one for an average of 17.6 h at the Eneide AWS.
Mean daily temperatures during the biologically active season. Black dotted line indicates 0°C, grey dotted lines indicate ±1°C (upper panel). Cumulative degree days (calculated as described in Convey et al. Reference Convey, Coulson, Worland and Sjöblom2018) for each site (lower panel). Figure cut separates data collected in 2019 (right) and 2020 (left). Sites are colour coded following the legend in upper panel. MZS = Mario Zucchelli Station.

The first site to register increasing temperatures at the end of winter was the small pond at Campo Antenne (mid-November), followed by the two soil sites and, finally, the pond at Oasi (end of November). In contrast, the Eneide AWS registered the first positive air temperature data only in late December, remaining well below zero through November (Fig. 4).
During December and January, the general patterns of temperature variation were similar across all four microhabitat sites on a multi-day/weekly time scale. Over this period, mean air temperatures were generally in the range -2°C to 0°C, with occasional peaks > 1°C and < -3°C. The soil and pond sites were warmer than the air by ~4°C and 8°C, respectively, ranging between 0°C and 9°C (Fig. 4).
Temperatures in the soil and pond sites started to decrease gradually from the end of January, with some clear differences arising between the sites. Temperatures fell earlier and more rapidly in the soil sites and in the air from late January, while the water temperatures in the ponds declined more slowly and they remained warmer through to mid-March, with a maximum difference of 5°C between pond and soil microhabitats (Fig. 4). This resulted in a 3–5 week delay in the onset of winter temperatures in the ponds.
The sum of cumulative degree days showed a consistent increase at the soil and pond sites until the end of January when it levelled off (Fig. 4), indicating the onset of autumn. The heating rate differed between the two microhabitat types, with the ponds accumulating approximately twice as much energy as the soil sites and continuing to accumulate energy for a further 2 weeks in autumn after the soil sites had plateaued. The cumulative degree days in air temperature remained almost flat, with air temperature only rarely and briefly being above the freezing point.
The overall thaw period was short based on air temperatures (two distinct 7 day periods), contrasting with the soil (64–66 days) and pond microhabitats (87–112 days). The difference between the microhabitats was due to substantial differences in the freezing dates (January–March), while their spring thaws were almost simultaneous (Table II).
Seasonal thaw and freeze dates. Dates are when the first day was registered (at the beginning of the biologically active season) with a mean daily temperature > 1°C and the first day (at the end of the active season) when mean daily temperature dropped to < -1°C. Intervals are given as inclusive of the two extremes.

a Air temperatures recorded at the Eneide AWS were almost continuously < 1°C, with only two short periods of thaw (3–9 and 21–27 January).
AWS = automatic weather station.
The zero curtain period was longer in the pond (4–9 thawing days and 14 freezing days) than the soil microhabitats (2 thawing days and 3–4 freezing days) (Table III).
Zero curtain (ZC) periods at the beginning and end of the biologically active season. The initiation and end dates and the ZC length (days) are indicated.

Discussion
Environmental conditions in Antarctic terrestrial microhabitats where micro-arthropods (Collembola and Acari) and micro-invertebrates (Nematoda, Rotifera and Tardigrada) occur have been studied in the Maritime Antarctic region (Davey et al. Reference Davey, Pickup and Block1992, Quayle et al. Reference Quayle, Peck, Peat, Ellis-Evans and Harrigan2002, Reference Quayle, Convey, Peck, Ellis-Evans, Butler and Peat2003, Convey et al. Reference Convey, Coulson, Worland and Sjöblom2018), but they have received less attention in Continental Antarctica (Moorhead et al. Reference Moorhead, Wall, Virginia and Parsons2002, Bokhorst et al. Reference Bokhorst, Huiskes, Convey, Sinclair, Lebouvier, Van de Vijver and Wall2011, Obryk et al. Reference Obryk, Doran, Fountain, Myers and McKay2020 and references therein). Very few studies in either region have reported year-round microhabitat temperature variation. In this study, we provide fine-scale descriptions and analyses of temperature variation in soil/rock and pond microhabitats from the Victoria Land coastline in Continental Antarctica and compare these with patterns and ranges of air temperature data from the local Eneide AWS.
The macroclimatic data from Eneide AWS were consistent with the recently proposed timeline for the McMurdo Dry Valleys seasons, namely summer (November–February), autumn (March), winter (April–September) and spring (October) (Obryk et al. Reference Obryk, Doran, Fountain, Myers and McKay2020). Absolute maximum air temperatures were in line with those previously reported, whereas absolute minima were considerably milder (-35.8°C, Eneide AWS, compared to -65.7°C, Lake Vida, Dry Valleys; Obryk et al. Reference Obryk, Doran, Fountain, Myers and McKay2020), probably resulting from the position of the current study area close to the coast (Bravo et al. Reference Bravo, Bascuñán-Godoy, Pérez-Torres, Corcuera, Gusta, Wisniewski and Tanino2009).
Our microhabitat temperature data indicate that temperatures diverged considerably between the pond and soil sites, being to a large extent uncoupled with the standard air temperature record of the Eneide AWS, a feature that is consistent with previous studies (Quayle et al. Reference Quayle, Convey, Peck, Ellis-Evans, Butler and Peat2003, Guglielmin et al. Reference Guglielmin, Worland and Cannone2012, Convey et al. Reference Convey, Coulson, Worland and Sjöblom2018). Based on mean temperatures (Fig. 2) and daily excursions (Fig. 3), differences were mostly evident in the summer, when the pond and rock/soil microhabitats experienced considerably longer periods of positive temperatures suitable for biological activity (see also Bokhorst et al. Reference Bokhorst, Huiskes, Convey, Sinclair, Lebouvier, Van de Vijver and Wall2011). The pond microhabitats were consistently warmer than those of rock/soil, indicative of the increased heat capacity of water (Convey et al. Reference Convey, Coulson, Worland and Sjöblom2018 and references therein). The dates of spring thaw and autumn freeze and the duration of the zero curtain period also indicated that milder and more stable conditions were experienced in both microhabitats with respect to the standard air temperature and specifically in ponds with respect to soil microhabitats (Tables II & III). Air and soil temperature data showed larger daily temperature variations than those experienced in ponds (Figs 3 & 4), as also noted by Peck et al. (Reference Peck, Convey and Barnes2006). The different thermal capacities of air, soil and water are clearly reflected in the differing accumulation of thermal energy in each and the considerable difference in thawing days between the sites (only a few days in the air, 2 months in soils and over 3 months in ponds; Table II).
Differences were also apparent between the soil and pond microhabitats. Temperatures in the soil increased rapidly at the beginning of summer and remained high throughout the season before decreasing almost as rapidly as did air temperatures at the end of the summer, leading to a shorter overall thaw period and a reduced zero curtain period (Fig. 4 & Table III). The greater absorption of solar energy by rocks and soils compared to snow and ice is well known (Peck Reference Peck2004; Convey et al. Reference Convey, Coulson, Worland and Sjöblom2018), but due to the smaller thermal capacity of these substrates compared to water this energy is more rapidly lost from the microhabitat (Convey et al. Reference Convey, Coulson, Worland and Sjöblom2018 and references therein).
The microhabitat temperature regimes documented here support the notion of terrestrial and freshwater biota facing relatively benign thermal conditions in the summer months as described by Bokhorst et al. (Reference Bokhorst, Huiskes, Convey, Sinclair, Lebouvier, Van de Vijver and Wall2011), with mean daily temperatures, although chronically low, being largely positive, as well as a lack of exposure to extreme cold. Biological activity (feeding, growth and reproduction) is only possible in the relatively short summer period and is strongly affected by microenvironmental variation in that period, requiring life history strategies characterized by considerable flexibility in the timing of developmental events (Convey Reference Convey1996). As an example, the Antarctic tardigrade species Acutuncus antarcticus is capable of completing its life cycle in a relatively short period in suitable conditions (60–90 days) and has low reproductive output (Altiero et al. Reference Altiero, Giovannini, Guidetti and Rebecchi2015). These traits, along with its parthenogenetic reproduction and well-developed cryptobiotic capabilities, are advantageous for exploiting the short period in which conditions are suitable for growth and reproduction during the summer, and they underlie the species' wide distribution on the Antarctic continent (Cesari et al. Reference Cesari, McInnes, Bertolani, Rebecchi and Guidetti2016). Based on estimates of thermal sum required to support the development of the Continental Antarctic springtail Cryptopygus sverdrupi Sømme (Reference Sømme1996), native to Dronning Maud Land, it was estimated that the life cycle would take multiple years to complete, with as little as 1–2 months of activity possible in any one summer. Similarly, research on soil nematodes in the Dry Valleys has identified that developing individuals require multi-year life cycles (Moorhead et al. Reference Moorhead, Wall, Virginia and Parsons2002, Porazinska et al. Reference Porazinska, Wall and Virginia2002, Yeates et al. Reference Yeates, Scott, Chown and Sinclair2009), even though under laboratory conditions the same species can complete its life cycle in as few as 7–8 weeks (de Tomasel et al. Reference De Tomasel, Adams, Tomasel and Wall2013).
In contrast, the microhabitat temperatures experienced at the study locations during the long winter period were as severe or even slightly more severe than in the standard air temperature record, with no strong evidence for thermal buffering by surface snow cover (probably occurring during the winter), as described from multiple locations in the Maritime Antarctic and High Arctic (Davey et al. Reference Davey, Pickup and Block1992, Convey et al. Reference Convey, Abbandonato, Bergan, Beumer, Biersma and Bråthen2015, Reference Convey, Coulson, Worland and Sjöblom2018). None of the micro-arthropods (Acari and Collembola) occurring in this region are known to be capable of anhydrobiosis, and members of both groups are freezing-intolerant, surviving freezing-temperature exposure by supercooling through the use of antifreeze compounds (Denlinger & Lee Reference Denlinger and Lee2010). Although specific studies of supercooling ability have not been carried out on species occurring at this site, Antarctic species using this strategy generally do not survive exposure to temperatures from -30°C to -35°C. On the other hand, many tardigrade species (and other micro-invertebrates) can survive full dehydration and freezing (Sømme Reference Sømme1996, Treonis & Wall Reference Treonis and Wall2005, Altiero et al. Reference Altiero, Giovannini, Guidetti and Rebecchi2015, Giovannini et al. Reference Giovannini, Altiero, Guidetti and Rebecchi2018), which would permit their survival in the freeze-dried soil habitats of Antarctica. However, if frozen in a hydrated state, as would happen when small ponds freeze solid in winter, inoculative freezing becomes a real risk and survival rates can be much lower, as documented in an experimental study by Convey & Worland (Reference Convey and Worland2000). Such factors could underlie the extremely patchy distributions that characterize these micro-invertebrates, driven by the extremely sparse availability of locations with suitable microhabitat conditions, and they also reinforce the isolation of populations at small physical/geographical intra-regional scales (e.g. as reported for some Victoria Land springtails by Collins et al. Reference Collins, Hogg, Convey, Barnes and McDonald2019). Based on such studies, it is reasonable to hypothesize that summer temperatures, and especially the length of the permissive season and the accumulation of thermal energy over short periods suitable for biological activity, may have a major if not primary influence on terrestrial invertebrate life cycles, with the winter microenvironmental regime being a possible second limiting factor influencing their distribution.
Conclusions
Our observations, in line with recent studies in Arctic and Antarctic regions (Convey et al. Reference Convey, Abbandonato, Bergan, Beumer, Biersma and Bråthen2015, Reference Convey, Coulson, Worland and Sjöblom2018), generally suggest that microhabitats are protected/buffered from the temperature minima observed in the open air and that this effect is substantial during the Antarctic summer. Freshwater pond habitats and, to a lesser extent, soil habitats experienced substantially milder microclimatic conditions with respect to standard air temperatures in terms of 1) higher temperatures, 2) a longer season with conditions suitable for biological activity and 3) more limited daily thermal variation.
In order to monitor variation in abiotic conditions in Victoria Land and other terrestrial and freshwater microhabitats of Continental Antarctica, further multi-year studies are necessary to better understand the temperature variation and trends over time to which the native microfauna is exposed.
Supplemental material
Two supplemental tables and three supplemental figures can be found at https://doi.org/10.1017/S0954102022000050.
Acknowledgements
The authors are grateful to the two anonymous reviewers for their constructive comments and to the MeteoClimatological Observatory at MZS for allowing the use of their data.
Financial support
This work was supported by the ‘Progetto Nazionale Ricerche in Antartide’ (PNRA) [PNRA16_00234]. PC is supported by Natural Environment Research Council (NERC) core funding to the British Antarctic Survey (BAS) ‘Biodiversity, Evolution and Adaptation’ Team.
Author contributions
AC, RG and LR designed the study and acquired funding. AC collected the data and supervised the work. RG and LR provided instruments. CC, LM and FN analysed the data. CC and FN drafted the manuscript. PC and LM critically revised the initial draft and made significant suggestions. All authors read and agreed on the final version of this manuscript.


 Open access