

Introduction
Psychological research has long established that humans are predisposed to a positive‐negative asymmetry. They attach more value to negative events compared to positive events of equivalent magnitude (Baumeister et al., Reference Baumeister, Bratslavsky, Finkenauer and Vohs2001). A similar negativity bias is often observed in politics as voters are more likely to punish elected politicians for failures than reward them for successes (Hood, Reference Hood2007; Nielsen & Baekgaard, Reference Nielsen and Baekgaard2015). As a result, rational politicians are commonly thought to be more eager to avoid blame for poor outcomes (Soroka, Reference Soroka2006) than to claim credit for high‐performance public services (Nielsen & Baekgaard, Reference Nielsen and Baekgaard2015). Although this observation naturally draws attention to politicians’ blame‐shifting and credit‐claiming actions, we still know very little about how politicians attribute responsibility for good and poor policy outcomes across multiple stakeholders. Yet, in any given policy area, multiple relevant stakeholders can be allocated (part of the) credit or blame for policy outcomes (including, of course, the politicians themselves). To advance our understanding of the political calculations underlying such responsibility attributions by politicians, this article takes an experimental approach to investigate whether and how local politicians distribute blame and credit among relevant stakeholders in a given policy domain.Footnote 1
Our between‐subjects survey‐experimental research design randomly assigns local politicians in Norway (N = 1073) to vignettes that vary in two ways across respondents. Our first treatment relates to primary education policy outcomes in the respondents’ jurisdiction and describes these outcomes in either positive or negative terms (i.e., good vs. poor performance). Comparing how respondents attribute responsibility for policy outcomes across both treatment conditions allows us to obtain causal estimates of whether different stakeholders are attributed credit or blame by politicians, depending on good/poor performance in a policy field where local politicians retain considerable discretion in setting and implementing local policies (more details below). Our second treatment highlights the electoral importance of the described policy outcomes for one group of respondents while not mentioning this for the other group. This allows us to tap into the role of political competition by evaluating whether responsibility attribution decisions are conditional on politicians’ perceptions of the electoral salience of policy outcomes to voters. Our central outcome variable is the respondents’ opinions about the main responsible actors for the presented outcomes (including politicians inside and outside the local governing coalition, street‐level bureaucrats, local residents and higher levels of government).
We show that local politicians attribute primary education outcomes in their local authority predominantly to school personnel – both when performance is poor (and school personnel is the main target of blame) and even more so when performance is good (and school personnel receives most of the credit). Stressing the importance of performance outcomes for election results does not affect this result. Still, a key finding from our analysis is that neither politicians inside nor outside the local governing coalition engage in local party‐political ‘blame games’ in Norway's consensus‐oriented political setting (Bukve, Reference Bukve1996; Gravdahl, Reference Gravdahl1998; Martinussen, Reference Martinussen2002; Monkerud, Reference Monkerud2007). This does not mean that partisanship is unimportant in our setting. In fact, we observe that local politicians attribute more responsibility to higher levels of government under poor performance relative to good performance (Heinkelmann‐Wild & Zangl, Reference Heinkelmann‐Wild and Zangl2020; Maestas et al., Reference Maestas, Atkeson, Croom and Bryant2008; Mortensen, Reference Mortensen2012), especially when the national government does not include the respondent's own party. In other words, local politicians assign credit/blame to higher levels of government depending on their partisan (mis)alignment. This indicates that blame dynamics remain affected by partisan forces in consensus‐oriented political settings at the local government level, but may take on a ‘multi‐level’ form compared to what is commonly observed in adversarial political systems (such as the United Kingdom, Canada or the United States).
Our analysis provides three main contributions. First, we study a setting characterized by a political consensus culture (i.e., local governments in Norway). In adversarial political settings (e.g., Canada, the United Kingdom or the United States), politicians in power and in the opposition have diverging incentives for the attribution of responsibility for policy outcomes since good news to one group of politicians is bad news to the other (Kumlin, Reference Kumlin2011; Weaver, Reference Weaver1986). This has often been found to trigger majority‐opposition blame games (Heinkelmann‐Wild & Zangl, Reference Heinkelmann‐Wild and Zangl2020; Heinkelmann‐Wild et al., Reference Heinkelmann‐Wild, Kriegmair, Rittberger and Zangl2020; Jilke & Bækgaard, Reference Jilke and Bækgaard2020; Mortensen, Reference Mortensen2016). In political consensus cultures, however, blame dynamics may have to move away from such adversarial tactics. Hence, our study emphasizes how politicians’ responsibility attribution decisions can work very differently under consensus democracy compared to adversarial systems.
Second, although politicians may be able to influence performance outcomes in a policy domain (thus allowing them to take credit or face blame), they are usually constrained by the decisions of a set of other relevant actors and stakeholders. For instance, with respect to primary education (our policy area of interest), performance outcomes may be affected by the actions of, among others, higher‐level governments, local civil servants, school staff, parents, and pupils. These thereby offer multiple targets for responsibility attribution. Most previous work, however, takes into account only one ‘target’. As we discuss below, this may induce misleading inferences when a wider variety of targets is available to politicians. In sharp contrast, we experimentally evaluate multiple stakeholders, which provides an important opportunity to explore the political calculations that go into blame and credit attributions.
Third, extant research has increased our understanding of the reactive and anticipatory strategies politicians employ when facing negative or positive outcomes (Sulitzeanu‐Kenan, Reference Sulitzeanu‐Kenan2006; Weaver, Reference Weaver1986) as well as the institutional factors affecting such behaviours (Hinterleitner, Reference Hinterleitner2020). Anticipatory strategies are built into the institutional structures of the governance system and intend to obscure who holds responsibility for policy outcomes. Examples include outsourcing public services, public–private partnerships, collaborative networks or vertical and horizontal divisions of authority in multilevel governance structures. Reactive strategies are employed when negative outcomes have already materialized and generally entail a framing challenge for politicians to turn the tide of blame: for example, (re)interpreting events and their causes, reframing meanings or topics, constructing narrative distinctions or shifting blame onto others (Bach & Wegrich, Reference Bach and Wegrich2019; Hood, Reference Hood2011; Moynihan, Reference Moynihan2012; Weaver, Reference Weaver1986). Previous work investigating such strategies predominantly looks at blame and credit separately, with blame receiving much more attention than credit (Hinterleitner, Reference Hinterleitner2020; Leong & Howlett, Reference Leong and Howlett2017). As the ‘acts of ascribing blame and giving credit are closely linked’ (Leong & Howlett, Reference Leong and Howlett2017, p. 602), our experimental research design looks at both issues simultaneously in order to compare them directly.
Theoretical background and hypotheses
Rational re‐election motivated politicians are generally expected to have an interest in claiming credit for good outcomes or avoiding blame for poor performance (Nielsen & Baekgaard, Reference Nielsen and Baekgaard2015; Soroka, Reference Soroka2006). Yet, such actions naturally imply that credit is in part taken away from other relevant actors or stakeholders or that some part of the blame becomes placed at other actors’ feet. Such decisions are unlikely to be politically innocuous and may have implications for politicians’ legitimacy as well as electoral support (Leong & Howlett, Reference Leong and Howlett2017; Moynihan, Reference Moynihan2012; Nielsen & Baekgaard, Reference Nielsen and Baekgaard2015). As a consequence, politicians need to take into account the broader political consequences of where they place responsibility for policy outcomes and must carefully consider how they distribute blame and credit among all relevant stakeholders within a policy field. Clearly, shifting blame onto others is only one possible option when facing poor policy outcomes. Politicians may also work to minimize any perception of failure or move public attention elsewhere (Hansson, Reference Hansson2018a, Reference Hansson2018b). Moreover, the same policy may be perceived differently by distinct social groups depending on who benefits or is harmed (Pal & Weaver, Reference Pal and Weaver2003). While acknowledging these complications for devising optimal responsibility attribution strategies, our analysis focuses on blame‐shifting because it constitutes a direct analogue to credit claiming (Leong & Howlett, Reference Leong and Howlett2017).
So where do politicians lay blame and credit for poor and good outcomes? Naturally, claiming credit for positive policy outcomes is one credible option for politicians that hold legislative power (Weaver, Reference Weaver1986). It is also a rational electoral strategy since politicians can thereby ‘appeal to constituents who may not otherwise support them’ (Schaffner, Reference Schaffner2006, p. 492). Attributing part of the responsibility for positive policy outcomes to other stakeholders (e.g., parents, civil servants or school staff in the case of education policy) may be considered when local politicians have no clear and/or undisputed ‘culpable control’ over the policy outcomes in question (Alicke, Reference Alicke2000; James et al., Reference James, Jilke, Petersen and Van de Walle2016; Leland et al., Reference Leland, Mohr and Piatak2021; Piatak et al., Reference Piatak, Mohr and Leland2017). Even so, other political stakeholders are likely to be excluded from any such credit‐giving. This would be counter‐productive from an electoral perspective since it works to decrease one's own chances of gaining votes and seats on election day.
Reversely, the ‘culpable control’ (Alicke, Reference Alicke2000) of politicians holding direct legislative power can act as a lightning rod for criticism. As such, these politicians obtain a strong incentive to shift at least part of this blame elsewhere (Hansson, Reference Hansson2018a). In adversarial political systems (Lijphart, Reference Lijphart1989, Reference Lijphart1999; McRae, Reference McRae1997), politicians on the other side of the political aisle constitute a prime target as part of majority‐opposition blame games (Heinkelmann‐Wild & Zangl, Reference Heinkelmann‐Wild and Zangl2020; Heinkelmann‐Wild et al., Reference Heinkelmann‐Wild, Kriegmair, Rittberger and Zangl2020; Jilke & Bækgaard, Reference Jilke and Bækgaard2020; Mortensen, Reference Mortensen2016). However, insights from adversarial systems may not travel one‐to‐one to consensus‐oriented systems. In such systems, politics tends to be less confrontational but rather builds on what Lijphart (Reference Lijphart1989, Reference Lijphart1999) refers to as a political consensus culture. Such systems rely on compromise and agreement as the general norm during political decision‐making and tend to take into account a broader range of opinions during decision‐making processes (Lijphart, Reference Lijphart1989, Reference Lijphart1999; Martinussen, Reference Martinussen2002), including even coalition formation processes after elections (Gravdahl, Reference Gravdahl1998; Houlberg & Holm‐Pedersen, Reference Houlberg and Holm‐Pedersen2014; Martinussen, Reference Martinussen2002; Serritzlew et al., Reference Serritzlew, Skjæveland and Blom‐Hansen2008). Although the electoral incentives of election‐motivated politicians remain at odds in a political consensus culture – since vote gains of one party are to the electoral detriment of all other parties (Kumlin, Reference Kumlin2011; Weaver, Reference Weaver1986) – the non‐adversarial nature of such systems can nonetheless be expected to influence the strategic behaviour of politicians with respect to responsibility attribution decisions.
More specifically, reciprocal partisan blame games are likely to be considerably weakened in a consensus‐oriented political setting. In turn, vertical blame‐shifting to political actors at other levels of government may gain in importance. Practices of vertical blame‐shifting have been observed across a range of settings. Heinkelmann‐Wild and Zangl (Reference Heinkelmann‐Wild and Zangl2020), for instance, find that governments in European Union countries shift blame up to European institutions (known as ‘Blaming Brussels’), while Maestas et al. (Reference Maestas, Atkeson, Croom and Bryant2008) and Mortensen (Reference Mortensen2012) show that regional elected officials in the United States and Denmark, respectively, shift blame towards the central government. In similar vein, the European Union and United Nations institutions have been observed to shift blame down to their member states (Heinkelmann‐Wildt & Zangl, Reference Heinkelmann‐Wild and Zangl2020). When other politicians at the same government level become less evident as a target of blame in consensus‐oriented political environments, shifting blame vertically up or down the political ladder – or to other stakeholders including bureaucrats (e.g., Hinterleitner, Reference Hinterleitner2018; Nielsen & Moynihan, Reference Nielsen and Moynihan2017) or public companies (e.g., Mortensen, Reference Mortensen2016) – can be expected to gain in importance. Hence, we expect:
Hypothesis 1: Politicians that hold legislative power claim credit for good policy outcomes and diffuse blame for poor policy outcomes across non‐political stakeholders.
Hypothesis 2: In consensus‐oriented political settings, vertical partisan blame‐shifting (to political actors at other levels of government) is more important than horizontal partisan blame‐shifting (to political actors at the same level of government).
For parties and/or politicians that do not ‘have an effective voice in formulating policy’ (Weaver, Reference Weaver1986, p. 391), claiming credit for good outcomes is generally not a credible option – except by maintaining, for instance, that they laid the groundwork for current success stories. As such, politicians that do not hold legislative power may in most cases be constrained to attribute responsibility for good outcomes to stakeholders other than themselves. Naturally, attributing such responsibility to other politicians at the same level of government is not a rational strategy since this would make it harder to beat those politicians on election day. Hence, we hypothesize that politicians that do not hold legislative power distribute credit for good outcomes predominantly to non‐political stakeholders in the relevant policy domain (e.g., civil servants, school staff or parents and pupils in the case of education policy). Note also that politicians lacking legislative power would mainly attribute responsibility for poor outcomes to their direct political opponents in adversarial political systems (Lijphart, Reference Lijphart1989, Reference Lijphart1999; McRae, Reference McRae1997). Yet, as mentioned above, this possibility is considerably weakened in political consensus cultures, and shifting blame vertically up or down the political ladder or to other stakeholders is expected to prevail (see also Hypothesis 2). Hence, we expect:
Hypothesis 3: Politicians that lack legislative power attribute responsibility for good and poor policy outcomes to non‐political stakeholders.
Hypothesis 4: In consensus‐oriented political settings, vertical partisan blame‐shifting arises equally among politicians holding and lacking direct legislative power.
We should note at this point that politicians – much like voters (e.g., Healy et al., Reference Healy, Kuo and Malhotra2014; Lodge & Hamill, Reference Lodge and Hamill1986; Rudolph, Reference Rudolph2003; Tilley & Hobolt, Reference Tilley and Hobolt2011) – are likely to view and interpret real‐world conditions through a partisan lens (e.g., Butler & Pereira, Reference Butler and Pereira2018; Butler et al., Reference Butler, Volden, Dynes and Shor2017; Pereira, Reference Pereira2022; Schönhage & Geys, Reference Schönhage and Geys2022, Reference Schönhage and Geys2023). As strong partisans, they can, therefore, be expected to over‐estimate their own party's role in creating policy successes, while seeing bad outcomes as more likely to be caused by other parties. This suggests a potentially important role for politicians’ partisan perceptual biases in how they attribute responsibility for good and poor outcomes across multiple stakeholders (Hobolt & Tilley, Reference Hobolt and Tilley2014). Observe, however, that the presence of any such partisan biases in politicians would likewise lead to Hypotheses 1 and 4, but not Hypotheses 2 and 3. The reason is that partisan biases would be expected to remain equally strong when considering political actors at the same or other levels of government. We return to this in our results section and conclusion discussion.
Electoral salience of policy outcomes
Our argumentation thus far relies on the notion that the distribution of credit and blame by politicians is affected by their desire to maintain legitimacy as well as electoral support (Leong & Howlett, Reference Leong and Howlett2017; Moynihan, Reference Moynihan2012; Nielsen & Baekgaard, Reference Nielsen and Baekgaard2015). This implies that politicians’ distributional choices may be affected by the perceived importance of performance information to those ultimately holding politicians to account for their actions, namely citizens. Citizens’ attention to, and use of, performance information increases the ‘political weight’ attached to such information (Ho, Reference Ho2006, p. 227), and this heightened external pressure may give elected officials additional incentives to respond to it (Hinterleitner, Reference Hinterleitner2020; Miller, Reference Miller2017). In other words, the salience of policy outputs can be expected to influence politicians’ responsibility attributions for good and poor outcomes across multiple stakeholders.
More specifically, we maintain that when citizens do not care about performance information, there is no need for politicians to shift blame for poor performance and no benefit to claiming credit for good performance. This changes when citizens are believed to care (a lot) about public performance since the ‘political relevancy and credibility’ of performance information then intensifies (Ho, Reference Ho2006, p. 233). Hence, we expect that increasing politicians’ awareness of the potential electoral implications of performance information intensifies their incentives to attribute responsibility for good outcomes to themselves and shift blame for poor outcomes elsewhere. This leads to our fifth and final hypothesis.
Hypothesis 5: Claiming credit and shifting blame by politicians intensifies in line with the perceived electoral impact of performance outcomes.
Experimental research design and data
Research design and setting
To examine our hypotheses, we need a design that enables causal estimates of the extent to which politicians allocate credit and blame in response to equivalent good and poor policy outcomes. To this end, we rely on a survey experiment among currently active elected politicians. The random assignment of politicians to experimental vignettes creates groups that are similar on average on (un)observed characteristics, allowing us to ascribe any difference in responsibility attributions across groups to differences in the vignettes (Tilley & Hobolt, Reference Tilley and Hobolt2011). Respondents were recruited using the KODEM facility at the University of Bergen (https://www.uib.no/en/nfp/138306/kodem), which hosts a large panel of elected representatives at all levels of government in Norway. The survey was piloted in October 2020 and fielded in November–December 2020. In total, we received 1073 complete responses (a response rate of 89.9 per cent of the panel). Our research design was pre‐registered at the AEA RCT Registry (http://www.socialscienceregistry.org/trials/5640) and obtained a positive advice from the Ethical Committee for Social Sciences and Humanities at Vrije Universiteit Brussel.
It is important to our experiment that we select a setting with a large number of comparable politicians, who have at last some degree of ‘culpable control’ over policy outcomes (Alicke, Reference Alicke2000; James et al., Reference James, Jilke, Petersen and Van de Walle2016; Leland et al., Reference Leland, Mohr and Piatak2021; Piatak et al., Reference Piatak, Mohr and Leland2017). The municipal governments in Norway provide such a setting since they are politically responsible for the provision of several key welfare services (including primary education, health care and childcare; Jacobsen, Reference Jacobsen2003). We focus on primary education (i.e. children aged 6–16 years) for two main reasons. First, performance outcomes in primary education are affected by the decisions of many different stakeholders. While primary education is highly regulated at the national level in terms of educational content and aims, schools and local politicians maintain considerable discretion within the detailed framework imposed by the state (Fimreite, Reference Fimreite2003; Geys & Sørensen, Reference Geys and Sørensen2016; Jacobsen, Reference Jacobsen2003). Teachers, school principals and parents likewise can have a significant influence on educational outcomes. This setting, therefore, offers local politicians several targets for responsibility attribution, which allows us to study blame/credit distribution strategies in this policy domain. Second, primary education on average takes up 30 per cent of municipal budgets in Norway (Statistics Norway, 2021b) and constitutes a meaningful share of local government activity. Moreover, as mentioned, local politicians retain considerable discretion in setting local primary education policy. For instance, state regulations set a maximum class size and the maximum number of pupils per teacher, but local governments can influence class size and school staffing ratios below this upper limit. Hence, such variables are not standardized across schools and municipalities, which gives local politicians influence over educational outcomes via local policy decisions (Fimreite, Reference Fimreite2003; Jacobsen, Reference Jacobsen2007). Crucially, these local decisions matter for policy outcomes since variation in municipal spending on primary education has been found to significantly affect pupil performance in Norway (Hægeland et al., Reference Hægeland, Raaum and Salvanes2012) as well as elsewhere (De Witte et al., Reference De Witte, Geys and Solondz2014; Hyman, Reference Hyman2017).
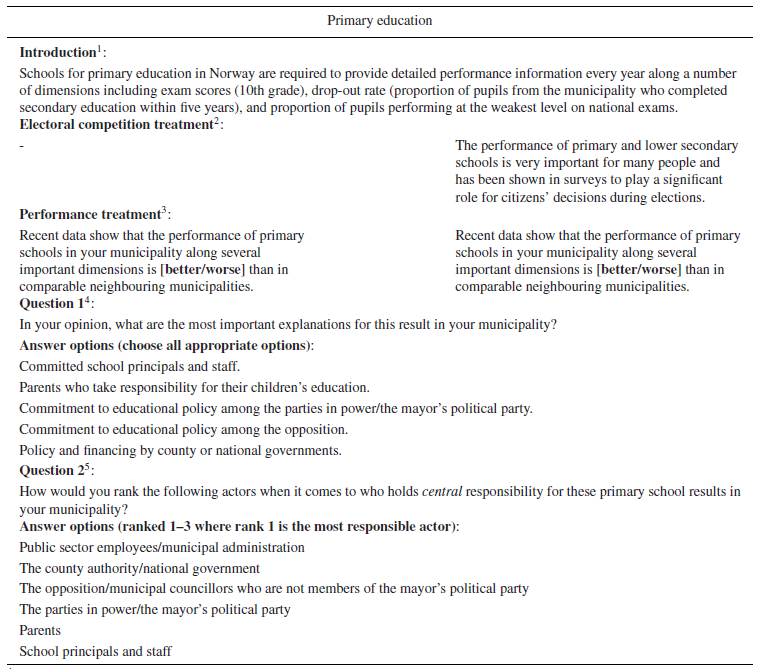
We implemented a 2×2 between‐subjects experimental research design. Each group of respondents was shown a vignette consisting of two parts (Appendix Table A.1). The first part of the vignette presented the policy area and some of its core policy outcomes: ‘Schools for primary education in Norway are required to provide detailed performance information every year along a number of dimensions including exam scores (10th grade), and proportion of pupils performing at the weakest level on national exams’. The second part introduced experimental variation in two dimensions. First, respondents were randomly assigned (with equal probability) to treatments where we highlighted (or not) the electoral importance of performance outcomes: ‘The performance of primary and lower secondary schools is very important for many people and has been shown in surveys to play a significant role for citizens’ decisions during elections’. This was a priming treatment to obtain exogenous variation in the perceived electoral impact of policy outcomes. It also intended to draw respondents’ attention to the fact that performance information often has high salience to voters. Second, respondents were randomly assigned to one of two treatment groups (with equal probability), which varied in the provision of a negative or positive description of policy outcomes. Specifically, respondents were told that outcomes in their municipality ‘are better [worse] than the average of comparable neighboring municipalities along several important dimensions’.Footnote 2 The negative frame was intended to induce blame‐shifting behaviour, whereas the positive frame was intended to assess credit‐claiming behaviour.
After these vignettes, participants were asked two questions. The first is a multiple‐choice question: ‘In your opinion, what are the most important explanations for this result in your municipality?’ (henceforth referred to as ‘most important explanation’). The five response options allowed attributing responsibility to school principals and staff, parents, politicians in the governing majority, opposition politicians and higher‐level governments (presented in randomized order). These options allow for strategies whereby politicians deflect credit and blame vertically or horizontally, follow different strategies for shifting blame and taking credit, and – by allowing respondents to provide multiple answers – diffuse credit and blame across multiple stakeholders (Hood, Reference Hood2011; McGraw, Reference McGraw1990, Reference McGraw1991). Still, since merely highlighting stakeholders’ importance fails to imply any order of importance, we subsequently also asked respondents to ‘rank the following actors when it comes to who holds central responsibility for these primary school results in your municipality’ (henceforth ‘rank responsible actor’). Respondents could rank up to three actors chosen from the same five answer options offered on the previous question plus ‘employees in the public sector/municipal administration’ (again presented in randomized order). Unranked actors were assigned the value 4 in our recoding of this question.
Naturally, for both practical and ethical reasons we were unable to randomly assign respondents as (not) holding power in the local government. We, therefore, have to rely on non‐experimental variation, which we do by exploiting the characteristics of the Norwegian consensus‐oriented local political system (Bukve, Reference Bukve1996; Gravdahl, Reference Gravdahl1998; Martinussen, Reference Martinussen2002). Although Norway does not have a parliamentary system at the local level, it is generally the case that after local elections a coalition of parties forms that effectively controls a majority of the seats in the local council. Politicians from this coalition can then approve policy decisions by majority vote in the council, whereas politicians outside this coalition lack similar direct policy influence (Martinussen, Reference Martinussen2002; Monkerud, Reference Monkerud2007). Building on this institutional framework, our survey contained a question asking politicians to self‐categorize as a member (coded as 1) or not (coded as 0) of the local governing coalition (‘posisjon’ and ‘opposisjon’ in Norwegian).Footnote 3 It is important to observe that the random allocation of our treatments across respondents makes it equally likely that politicians inside and outside the local governing coalition ended up in our various treatment groups (see Online Appendix Table OA.2). Any (un)observable differences across both groups of politicians thus can be expected to affect responses to both treatments in the same way, and should not bias the inferences drawn from our analysis.
Before we turn to the data and our findings, one common concern with survey‐based research is that answers provided by politicians in a fully anonymous survey need not always coincide with what they would do in a publicly observable setting. However, previous work strongly suggests that politicians’ (private) responses to surveys do reveal important information about their likely behaviour in public (Baekgaard et al., Reference Baekgaard, Blom‐Hansen and Serritzlew2015; Houlberg & Holm‐Pedersen, Reference Houlberg and Holm‐Pedersen2014; Saiegh, Reference Saiegh2009; Serritzlew et al., Reference Serritzlew, Skjæveland and Blom‐Hansen2008; Steiner & Mader Reference Steiner and Mader2019). Moreover, experimental variation across multiple treatments is beneficial in this respect. Any observed differences across treatments cannot be explained by a common tendency to shield or shade one's true opinions. This would require that this tendency differs in line with the various experimental treatments, which seems unlikely.
Data
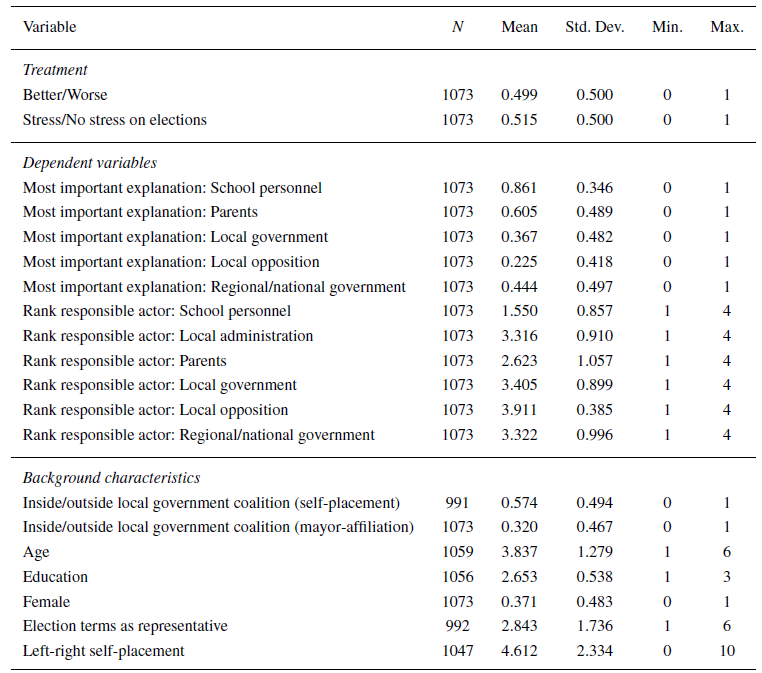
Summary statistics for all variables included in our analysis are provided in Table 1. Starting with respondents’ background characteristics in the bottom row, we find that just over 57 per cent of respondents self‐categorize as being part of the local governing coalition (while 32 per cent are a member of the party of the mayor), 37 per cent are female, and the average respondent is in their second term in office. We also observe that respondents are on average highly educated (68 per cent have some university/college education) and are middle‐aged or older (64 per cent are 50 years or older). Information about municipal politicians from Statistics Norway (2021a) indicates that our sample is broadly representative of Norwegian municipal politicians in terms of party affiliation and gender. However, there is an over‐representation of older and higher educated respondents in our sample, and an under‐representation of respondents from the southern‐most region of Norway (see Online Appendix Table OA.1). Although this skewness by region, education and age does not affect the validity of our research design and theoretical inferences, it may limit the generalizability of our findings across the overall population of Norwegian municipal politicians.
Summary statistics

Note: Better/Worse equals 1 (0) for respondents in the ‘better’ (‘worse’) performance treatment. Inside/outside local government coalition (self‐placement) is based on a question asking politicians to self‐categorize as a member (coded as 1) or not (coded as 0) of the local governing coalition (‘posisjon’ and ‘opposisjon’ in Norwegian in the survey). Inside/outside local government coalition (mayor‐affiliation) equals 1 when the respondent is from the same party as the mayor, 0 otherwise. Age is categorized into six 10‐year groups. Education is categorized into three groups (1 ‘no education/elementary school’, 2 ‘upper secondary’ and 3 ‘university/university college’). Female equals 1 for female and 0 for male. Election terms as representative counts the number of (4‐year) legislative terms in municipal councils, ranging from 1 for the first term to 6 for six or more terms. Left‐right self‐placement ranges from 0 (extreme left) to 10 (extreme right).
The middle row of Table 1 shows the mean values for our dependent variables. These suggest that local politicians, on average, attribute primary education outcomes mainly to school personnel (mentioned by 86 per cent of respondents and ranked on average at 1.55 on the four‐point ranking from 1 to 4) and parents (61 per cent of respondents and ranked on average at 2.62). This appears reasonable given the very strong controllability linkage between these actors and student performance (Alicke, Reference Alicke2000). A substantial share of respondents also points to the regional/national government (44 per cent), which reflects that higher levels of government provide the detailed legal framework within which schools and local politicians make their decisions about the implementation of primary education policies (see above). Finally, while politicians ascribe more responsibility to the local government (37 per cent of respondents) relative to the local opposition (23 per cent of respondents), both these response options are ranked very low (below rank position 3 on average). This suggests that local politicians do not place themselves first in line to claim credit or accept blame for primary education outcomes despite their influence over local outcomes in this policy domain. We should also point out that politicians on average select 2.5 answer options on the ‘most important explanation’ question, with 10 per cent selecting four (and 9 per cent selecting all five) answer options. This suggests that politicians are aware of multiple stakeholders affecting school performance and suggests a high risk of biased inferences in studies focusing on only one credit/blame target.
Finally, the top row of Table 1 indicates that both treatments were distributed equally across the sample. Yet, for the internal validity of our design, it is also important that treatments were randomly assigned across respondents in our sample. Online Appendix Table OA.2 evaluates this for all available individual‐level background characteristics and shows no statistically significant differences for the performance treatment, while three variables are significant at the 10 per cent level for the election stress treatment. Still, testing the individual and joint significance of all background variables using logistic regression models shows no significant differences: that is, a chi2 test of joint significance equals p > 0.31 for both treatments, and each individual variable always has p > 0.13. Moreover, we verified that treatments were randomly assigned across a range of municipality‐level characteristics (e.g., public expenditures on education, voter turnout, population size, age and gender composition, and unemployment level). Overall, therefore, the random assignment of our treatments created largely similar groups. To assess whether any minor differences between treatment and control groups matter to our findings, we conduct robustness tests controlling for individual‐level background characteristics (reported in Online Appendix Section A).
Empirical findings
Main results
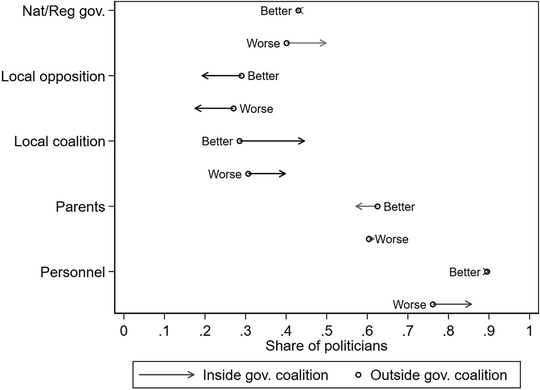
We start our analysis by assessing the responsibility attribution decisions of politicians inside and outside the local governing coalition (Hypotheses 1–4). We address this in Figure 1 by breaking down what politicians deem the most important explanation(s) for the performance information presented in our vignette across respondents who categorize themselves as belonging to the local governing coalition (57 per cent of our sample) or not (43 per cent of our sample).Footnote 4 Each arrowhead (circle) in Figure 1 shows the mean response by politicians inside (outside) the local governing coalition. Higher values thereby indicate that an answer option is chosen by a larger share of politicians within a given group. The length of the arrow corresponds to the difference between both groups of politicians, while the direction of the arrow indicates whether politicians inside the local governing coalition are more (arrow to the right) or less (arrow to the left) likely to choose a given answer option. Figure 1 also differentiates between respondents in the better performance treatment (‘Better’) and worse performance treatment (‘Worse’) in order to assess how respondents distribute blame and credit across both treatment conditions. Online Appendix Tables OA.3 and OA.4 provide full details of these results including the mean values, standard deviations and significance levels. Online Appendix Tables OA.5 and OA.6 offer robustness checks using (ordered) logistic regression models with and without individual‐level control variables.
Performance treatment effects across politicians inside and outside the local governing coalition. Note: The dependent variable of the analysis reflects respondents’ answers to the survey question ‘In your opinion, what are the most important explanations for this result in your municipality?’ Each arrowhead in the figure shows the mean response by politicians inside the local governing coalition, while each circle shows the mean response by politicians outside the local governing coalition. The length of the arrow thus corresponds to the difference between both groups. We also differentiate between respondents in the better performance treatment (‘Better’) and worse performance treatment (‘Worse’). Full details of the results – including means, standard deviations and significance levels – are provided in Online Appendix Table OA.3. The related t‐test results using the ranked dependent variable are in Table OA.4 in the Online Appendix.

Figure 1 indicates that politicians inside the local governing coalition are significantly more likely than politicians outside the local governing coalition to point towards themselves as an important explanation when faced with positive school performance information (t = 3.62; p < 0.01). Politicians inside the local governing coalition are also significantly less likely to point to politicians outside the local governing coalition (t = 2.50; p < 0.05). Naturally, the mirror image of the latter result is that politicians outside the local governing coalition – when compared to politicians from the coalition in power – credit themselves significantly more and credit local politicians in power significantly less. This pattern of findings suggests that politicians claim some credit for good policy outcomes, while at the same time being unwilling to attribute much credit to their direct electoral opponents. This is consistent with the first part of Hypotheses 1 and 3.
Turning now to the negative school performance treatment, we observe that politicians inside the local governing coalition again are less likely to mention the politicians outside the local governing coalition as an important explanation (t = 2.56; p < 0.05) and rank such politicians lower among responsible actors (t = 3.03; p < 0.01). This result would suggest that politicians inside the local governing coalition do not shift blame for poor results to their direct electoral opponents. Taking into account the similar observation in the good performance treatment, one explanation is that politicians inside the local governing coalition simply do not credit any other politician with any influence at all – either positive or negative – and consider themselves much more important for any type of outcome. This is confirmed by the observation that politicians inside the local governing coalition mention themselves significantly more (t = 2.13; p < 0.05) compared to politicians outside the local governing coalition when performance is poor. Note also that the mirror image of the latter observation is that politicians outside the local governing coalition do not mention the local government more frequently in the worse performance treatment compared to the better performance treatment. Hence, consistent with Hypotheses 1 and 3, local politicians do not actively focus blame for poor performance on other political stakeholders at their own level of government. Our findings thus provide no evidence of the type of horizontal partisan blame games commonly observed in adversarial political settings.Footnote 5
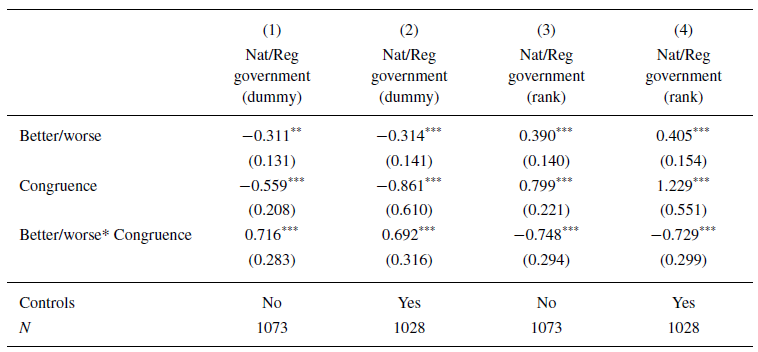
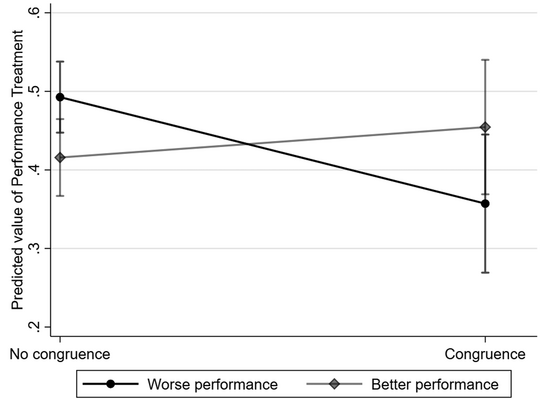
Interestingly, however, the results in Table 2 show that blame‐shifting and credit‐claiming are nonetheless strongly affected by partisan forces across levels of government in the consensus‐oriented political setting under analysis (Hypotheses 2 and 4). This table reports the results from (ordered) logistic regression models where the dependent variable equals 1 when respondents mention higher‐level governments as the most important explanation for the policy outcome described in the vignette (0 otherwise; in columns (1) and (2)), or the rank assigned to higher‐level governments among the responsible actors (in columns (3) and (4)). All models include an indicator variable for the poor versus good performance treatment, an indicator variable equal to 1 when the politician's party is aligned with the national government (0 otherwise; Congruence), and the interaction between both these variables. To ease interpretation of the findings, Figure 2 presents predicted probabilities for (un)aligned politicians across poor versus good performance treatments based on the estimates in Column (1) of Table 2. Online Appendix Tables OA.10 and OA.11 provide robustness checks using simple t‐tests for the differences in the mean response of politicians whose parties are (un)aligned with the party in the national government (Online Appendix Figure OA.1 provides a graphical presentation of these t‐tests).
Performance treatment effects and cross‐level political congruence

Note: Entries are (ordered) logistic regression coefficients. Models 1 and 2 are based on logistic regressions where the dependent variable equals 1 when respondents mention higher‐level governments as the most important explanation for the policy outcome described in the vignette (0 otherwise). Models 3 and 4 are based on ordered logistic regressions with the dependent variable indicating the rank assigned to higher‐level governments among the responsible actors. Better/Worse equals 1 (0) for respondents in the ‘better’ (‘worse’) performance treatment. Congruence is an indicator variable equal to 1 if the respondent is from a political party that is aligned with the national government and 0 otherwise. Standard errors in parentheses
*** p < 0.01, **p < 0.05, *p < 0.1.
Predicted probabilities on performance treatment effects under cross‐level political congruence. Note: The figure displays predicted probabilities based on Model 1 in Table 2. The underlying logistic regression includes a dependent variable equal to 1 when respondents mention higher‐level governments as the most important explanation for the policy outcome described in the vignette (0 otherwise). Key explanatory variables are an indicator for the ‘better’ (‘worse’) performance treatment, an indicator for respondents from a political party that is (un)aligned with the national government (i.e., congruence vs no congruence), and their interaction. More details in the note for Table 2. We also include 95 per cent confidence intervals.

The top row in Table 2 illustrates that politicians whose party is in opposition at higher levels of government (i.e., Congruence = 0) are statistically significantly less likely to mention higher‐level governments in the good‐performance treatment (or rank higher‐level governments high among the responsible actors; p < 0.01 across all models). The significant interaction effect suggests that the reverse holds for politicians whose party is in government at higher levels of government: that is, they are more likely to mention higher‐level governments in the good‐performance treatment. The same observation is visible on the left‐hand side of Figure 2. Similarly, the middle row in Table 2 indicates that politicians whose party is in power at higher levels of government (i.e., Congruence = 1) are statistically significantly less likely to mention higher‐level governments in the poor‐performance treatment (or rank higher‐level governments high among the responsible actors; p < 0.01 across all models). Again, the significant interaction effect highlights that this reverses among politicians whose party is in the national opposition: that is, these are more likely to mention higher‐level governments in the poor‐performance treatment. This observation is illustrated on the right‐hand side of Figure 2. Taken together, these results indicate that partisan dynamics remain present even in consensus‐oriented political settings, but that they take on a cross‐level form compared to what is commonly observed in adversarial political systems (in line with Hypothesis 3).
Table 3 takes these findings one step further by evaluating whether – and, if so, to what extent ‐ such cross‐level partisan credit‐blame dynamics arise equally among politicians inside as well as outside the local governing coalition (Hypothesis 4). We thereby estimate the same regression models as in Table 2 but include only the subsample of politicians inside (Panel I in Table 3) or outside the local governing coalition (Panel II in Table 3). The findings suggest a similar pattern across both sets of politicians, in line with Hypothesis 4. Yet, our results are statistically and substantively stronger (and more robust) for politicians inside the local governing coalition. This indicates that cross‐level partisan blame dynamics are strengthened by membership in the local governing coalition. We speculate that this could in part derive from the fact that becoming a local representative in our Norwegian setting is an important stepping stone into national politics, particularly when one gains experience as a member of the local governing coalition (Cirone et al., Reference Cirone, Cox and Fiva2021). This tentative explanation, however, requires further corroboration in future research.
Performance treatment effects and cross‐level political congruence ‐ politicians inside/outside the local governing coalition
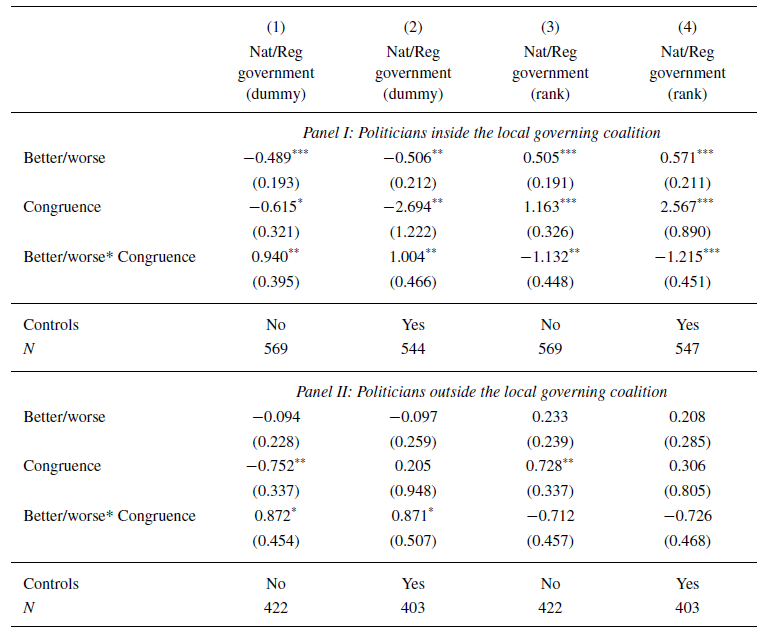
Note: Entries are (ordered) logistic regression coefficients. Models 1 and 2 are based on logistic regressions where the dependent variable equals 1 when respondents mention higher‐level governments as the most important explanation for the policy outcome described in the vignette (0 otherwise). Models 3 and 4 are based on ordered logistic regressions with the dependent variable indicating the rank assigned to higher‐level governments among the responsible actors. Better/Worse equals 1 (0) for respondents in the ‘better’ (‘worse’) performance treatment. Congruence is an indicator variable equal to 1 if the respondent is from a political party that is aligned with the national government and 0 otherwise. Panel I includes only politicians who self‐categorize as a member of the local governing coalition, while Panel II includes only politicians who do not self‐categorize as a member of the local governing coalition. Standard errors in parentheses.
*** p < 0.01, **p < 0.05, *p < 0.1.
Stronger performance treatment effects when stressing election relevance?
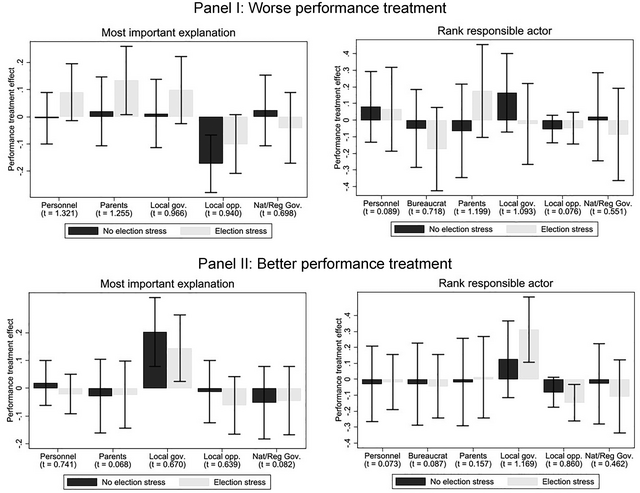
Hypothesis 5 maintains that credit claiming and blame‐shifting are likely to strengthen when performance information is perceived by politicians to have higher electoral importance. We assess this hypothesis with difference‐in‐difference tests of whether blame and credit allocations differ across politicians inside and outside the local governing coalition (first difference) and by election stress versus no election stress (second difference). We perform these tests separately for politicians randomized into receiving negative and positive performance information. The results are reported in Figure 3. Overall, the analysis does not lend support for this hypothesis, as the results are never statistically significant. This suggests that stressing the electoral importance of policy outcomes for local elections has no significant impact on politicians’ responsibility attributions in our setting.
Effects of being inside/outside the local government coalition conditional on election stress and policy performance outcomes. Panel I: Worse performance treatment. Panel II: Better performance treatment. Note: Each bar in the figure shows the mean difference in responses by politicians inside/outside the local governing coalition. Positive values indicate that the answer options are chosen more frequently (or ranked as more important) by politicians inside versus outside the local governing coalition. (See note to Figure 1 for further details.) In all figures, we differentiate between respondents in the ‘election stress’ treatment (grey bars) and ‘no election stress’ treatment (black bars), and the I‐beams show 95 per cent confidence intervals. Panel I includes only respondents in the ‘worse performance’ treatment, whereas panel II includes only respondents in the ‘better performance’ treatment.

Concluding discussion
Our analysis investigated how politicians attribute responsibility for good and poor policy outcomes among a substantial set of stakeholders within one important policy field (i.e., primary education). Using a between‐subjects survey experiment fielded among 1073 Norwegian local politicians, we observe that politicians in the local governing coalition more often point to themselves under good performance relative to politicians outside the local governing coalition. This is consistent with politicians claiming credit for good performance when the circumstances allow them to do so (Bueno, Reference Bueno2023; Cruz & Schneider, Reference Cruz and Schneider2017; Giger & Nelson, Reference Giger and Nelson2011). However, these credit‐claiming effects are very modest in size and are much less prominent than the attribution of primary education outcomes to school personnel and parents. In fact, schools and parents are placed ahead of national and local politicians regardless of whether performance is good or bad, which strongly suggests that local politicians’ allocation of blame and credit in our setting closely reflects the controllability linkage between specific stakeholders and student performance (Alicke, Reference Alicke2000; James et al., Reference James, Jilke, Petersen and Van de Walle2016; Leland et al., Reference Leland, Mohr and Piatak2021; Piatak et al., Reference Piatak, Mohr and Leland2017).
A key finding of our analysis is that local politicians are keen to shift blame vertically to higher‐level governments particularly when the national government majority does not include the respondent's own party. This behaviour is consistent with the idea that cross‐level blame dynamics – which have been documented in previous work (e.g., Heinkelmann‐Wild & Zangl, Reference Heinkelmann‐Wild and Zangl2020; Maestas et al., Reference Maestas, Atkeson, Croom and Bryant2008; Mortensen, Reference Mortensen2012) – remain affected by partisan forces in settings characterized by a political consensus culture. Yet, it also suggests that the allocation of credit and blame is likely to work very differently in consensus democracies and more adversarial systems as we find no evidence of horizontal blame‐shifting. In doing so, it emphasizes the importance of institutional and cultural context for how blame and credit unfold (see also Hinterleitner, Reference Hinterleitner2020). An important lesson of our study is, therefore, that future work should take care to measure multiple targets of credit and blame allocation to allow for a better exploration of differences and similarities in how these dynamics unfold across institutional and cultural differences.
One might wonder to what extent this finding reflects blame‐shifting rather than systematic biases of partisans who tend to overestimate the successes of their own party and the failures of other parties. In this regard, it is important to observe that local politicians in our setting do not engage in horizontal partisan blame games. That is, they are not more likely to point to other parties at the local level and absolve themselves of responsibility when results are poor. This observation is at odds with expectations about politicians shifting blame to competing parties at their own level of government (Heinkelmann‐Wild & Zangl, Reference Heinkelmann‐Wild and Zangl2020; Heinkelmann‐Wild et al., Reference Heinkelmann‐Wild, Kriegmair, Rittberger and Zangl2020; Jilke & Bækgaard, Reference Jilke and Bækgaard2020; Mortensen, Reference Mortensen2016), and thus fits poorly with partisanship playing a dominant role in how local politicians attribute responsibility. There is indeed little reason to expect that politicians’ partisan biases play out differently when they attribute responsibility to political actors at the same or other levels of government. Naturally, this does not imply that partisan biases are irrelevant in our setting. Further research would be well advised to analyse the relative importance of politicians’ strategic choice to shift blame (or take credit), and their (partial) self‐delusion about the true source of observed policy outcomes.
Limitations imposed by our data suggest additional extensions to our work. First, as with all empirical research using data from one setting, some caution is needed about the broader relevance of our findings. Future empirical studies should engage in the assessment of blame and credit allocation in other consensus‐oriented political settings in order to validate our findings. Furthermore, more direct comparisons across institutional and cultural contexts would be useful to obtain estimates about the extent of any differences in dynamics across adversarial and consensus‐oriented settings. Second, our vignettes present a hypothetical scenario with limited and general information about primary school outcomes. More precise information about the policy outcomes or indications that similar information is made available to the electorate may increase the salience of the experimental treatment and enrich the inferences drawn. Finally, the dependent variable describes intended rather than actual allocation of blame and credit. While politicians’ (private) responses to surveys are informative about their likely real‐world behaviour (Baekgaard et al., Reference Baekgaard, Blom‐Hansen and Serritzlew2015; Houlberg & Holm‐Pedersen, Reference Houlberg and Holm‐Pedersen2014; Saiegh, Reference Saiegh2009; Serritzlew et al., Reference Serritzlew, Skjæveland and Blom‐Hansen2008; Steiner & Mader Reference Steiner and Mader2019), it would be important to complement our research with observation studies of the actual behaviour of elected politicians. This would strengthen our findings even further.
Acknowledgements
The authors are grateful to all respondents for their time, to the KODEM team at the University of Bergen for their feedback on the experimental design, and FWO Vlaanderen (grant nr. G000218N) for financial support. We also gratefully acknowledge insightful comments from three anonymous referees, Mads Nordmo Arnestad, Tobias Bach, Jon Fiva, Elisabeth Ivarsflaten, Allan Sikk, Rune Sørensen and participants at EPSA and research seminars at the University of Bergen and Konstanz University.
Data Availability Statement
Data availability statement is available as document in Wiley repository system.
[Correction added on 8 August 2023, after first online publication: Data availability statement has been added in this version.]
Online Appendix
Additional supporting information may be found in the Online Appendix section at the end of the article:
Online Appendix
Dataset
Data availability statement
Appendix
Survey experiment design

1 In Norwegian: ‘Grunnskoler i Norge er pålagt å rapportere detaljert årlig resultatinformasjon for en rekke dimensjoner inkludert avgangskarakterer (10. trinn), frafall (andel elever fra kommunen som har fullført videregående innen fem år), og andel elever på laveste mestringsnivå i nasjonalprøver’.
2 In Norwegian: ‘Resultatene i grunnskolen er veldig viktige for mange mennesker og har i spørreundersøkelser vist seg å spille en vesentlig rolle for innbyggernes beslutninger under valget’.
3 In Norwegian: ‘Ny data viser at resultatene til grunnskoler i din kommune er bedre [verre] enn gjennomsnittet av sammenlignbare nabokommuner langs flere viktige dimensjoner’.
4 In Norwegian: ‘Etter din mening, hva er de viktigste forklaringene til resultatene i din kommune?’
5 In Norwegian: ‘Etter din mening, hvem har størst ansvar for resultatene i din kommune?’


 Open access