


Significant Outcomes
-
• Major depressive disorder is associated with reduced heart rate variability, particularly during sleep, which reveals more pronounced pathological alterations.
-
• Heart rate variability of patients show low adaptation during the entire sleep period underscores its potential as a biological indicator for clinical assessment of major depressive disorder.
Limitations
-
• The cross-sectional design could not detect a causal relationship between major depressive disorder and heart rate variability.
-
• In natural clinical practice, it was difficult to completely exclude confounding factors such as treatment and comorbidities in this study. And, the small number of male samples and the artefacts in the fragment which was analysed may affect the results.
-
• Due to the limited accessibility and ease of implementation of sleep monitoring equipment, measuring SS-HRV may difficult in clinical practice or study.
IntroductionFootnote 1
Major depressive disorder (MDD) is a common mental disorder. The autonomic nervous system (ANS) is involved in the physiological progress of mood, and various depressive symptoms are associated with ANS dysfunction, particularly somatic symptoms such as pain, palpitations, bloating, and sleep disturbances (Otte et al., Reference Otte, Gold, Penninx, Pariante, Etkin, Fava, Mohr and Schatzberg2016; Won & Kim, Reference Won and Kim2016; Park et al., Reference Park, Rosenblat, Lee, Pan, Cao, Iacobucci and Mcintyre2019).
Heart rate variability (HRV) reflects regular fluctuations of the normal-to-normal (NN) R-R interval in adjacent cardiac cycles and is closely associated with the regulation of the cardiac ANS. Therefore, it is often used as a quantitative indicator of ANS activity. HRV analysis often involves the use of time- and frequency-domain metrics. The time-domain indices include the standard deviation (SD) of all NN intervals (SDNN), the square root of the mean of the sum of the squares of the differences between adjacent NN intervals (RMSSD), and the percentage difference between adjacent NN intervals >50 ms (pNN50). SDNN is considered to reflect overall variability, whereas RMSSD and pNN50 are considered measures that predominantly reflect parasympathetic modulation of the heart. Frequency-domain indices include the variance of all NN intervals <0.4 Hz (TP); high-frequency (HF) power of 0.15–0.4 Hz, reflecting parasympathetic nervous system function; low-frequency (LF) power of 0.04–0.15 Hz, which reflects vagal influence mainly and is correlated with baroreflex sensitivity; very low frequency (VLF) power of 0.003–0.04 Hz, reflecting long-term regulatory mechanisms such as body temperature or hormone levels. Nonlinear analysis is used to calculate HRV metrics such as SD1, SD2, approximate entropy (ApEn), sample entropy (SampEn), α1, and α2 (Cygankiewicz & Zareba, Reference Cygankiewicz and Zareba2013; Reyes del Paso et al., Reference Reyes Del Paso, Langewitz, Mulder, Van Roon and Duschek2013; Shaffer and Ginsberg, Reference Shaffer and Ginsberg2017). Therefore, a decrease in HRV implies an alteration in the ANS function (Huikuri & Stein, Reference Huikuri and Stein2013).
Numerous studies have confirmed that patients with MDD have a reduced HRV. A meta-analysis of 21 studies with 4,232 participants showed that SDNN, RMSSD, HF, LF, and VLF decreased, and LF/HF increased in patients with MDD who did not receive medications than in healthy controls (Koch et al., Reference Koch, Wilhelm, Salzmann, Rief and Euteneuer2019). Consistent results were found in patients with MDD aged <18 years and >60 years (Brown et al., Reference Brown, Karmakar, Gray, Jindal, Lim and Bryant2018; Koenig et al., Reference Koenig, Schreiner, Klimes-Dougan, Ubani, Mueller, Lim, Kaess and Cullen2018). Even low HRV levels may be an aetiological factor for MDD (Jandackova et al., Reference Jandackova, Britton, Malik and Steptoe2016; Huang et al., Reference Huang, Shah, Su, Goldberg, Lampert, Levantsevych, Shallenberger, Pimple, Bremner and Vaccarino2018).
MDD is associated with the ANS dysregulation, and low HRV levels may relate to vulnerability to MDD (Borrione et al., Reference Borrione, Brunoni, Sampaio-Junior, Aparicio, Kemp, Benseñor, Lotufo and Fraguas2018; Hong et al., Reference Hong, Park, Ryu, Ha and Jeon2022). Therefore, an in-depth study of MDD-related HRV is of great importance to understanding the aetiology of MDD. Sleep disturbance is a common clinical symptom of MDD and is also closely related to heart disease. Sleep assessments should be included in cardiovascular risk evaluation, especially for patients with MDD. Sleep-state HRV (SS-HRV) may be more likely to reveal the pathological features of MDD compared with resting state HRV (RS-HRV). However, previous HRV studies were mostly based on RS electrocardiography (ECG) data, whereas very little high-quality research exists on SS-HRV in patients with MDD. Therefore, this study aimed to comprehensively analyse the RS- and SS-HRV of patients with MDD compared with healthy volunteers to explore the characteristics of HRV in patients with MDD and provide new scientific evidence for the study of the aetiology of MDD.
Methods
Participants
Patients with MDD from outpatients and inpatients of the Third Affiliated Hospital of Sun Yat-sen University or volunteers recruited through advertisements were enrolled in this study. Health controls were recruited through advertisements. This study was approved by the Ethics Committee of the Third Affiliated Hospital of Sun Yat-sen University ([2022]02-139-01). Informed consent was obtained from all participants in the study.
The inclusion criteria were: unlimited genders, age of 18–44 years, education level higher than primary school education, Han nationality, and informed consent status. Patients with MDD met the Diagnostic and Statistical Manual of Mental Disorders, Fifth Edition (DSM-5) diagnostic criteria for MDD screening using the Structured Clinical Interview for DSM-5 (SCID-5-RV) (Philips, Reference Philips2020), scored ≥20 points on the Hamilton Depression Scale 24 version (HAMD 24) (O’Sullivan et al., Reference O’sullivan, Fava, Agustin, Baer and Rosenbaum1997), had not taken tricyclic antidepressants in the past 4 weeks, and had not received regular cognitive behavioural therapy in the past 3 months. The healthy control group did not meet the DSM-5 diagnostic criteria for mental disorders screening using the SCID-5-RV and scored <8 on the HAMD 24.
Exclusion criteria were (1) hypertension, coronary heart disease, multiple sclerosis, muscular dystrophy, Parkinson’s disease, epilepsy, diabetes, and other severe or unstable physical diseases, (2) sleep apnoea syndrome, and (3) female sex with age >40 years, and perimenopausal symptoms, and irregular menstrual cycles (variation: >7 days).
Sample calculation by the formulation: N = 2*[(t ɑ +t β )*s / δ]^2, N was sample size, s was standard deviation, δ was the difference in mean from pre-experiment, t ɑ was 1.96, and t β was 1.65.
HRV data acquisition and analysis
Data acquisition
HRV data were collected in a dedicated sleep monitoring room that was quiet, clean, ventilated, and at an appropriate temperature (according to per participant). The participants entered the sleep monitoring room uniformly from 9 to 10 p.m. The collection ended at approximately 7 a.m. the next day.
Preparation before the examination
Participants were asked to wash their hair and shave on the examination day; consumption of tea, coffee, or other caffeinated beverages was prohibited 12 h prior, smoking and drinking were also prohibited, and no food or strenuous exercise was permitted 2 h prior.
Equipment
The electroencephalography (EEG) and ECG modules of the Cadwell Easy III EEG (Cadwell Laboratories, Inc.) were used to record the EEG and ECG data of the participants, and the accompanying computer software was used to store data and confirm sleep stages. The sampling rates for ECG and EEG are both 4,100 Hz.
Sleep staging rules
Sleep staging was performed according to the Manual for the Scoring of Sleep and Associated Events from the American Academy of Sleep Medicine (Berry et al., Reference Berry, Brooks, Gamaldo, Harding, Lloyd, Marcus and Vaughn2015).
Acquisition process steps
(1) Resting-state HRV (RS-HRV)
After the participants were accustomed to the environment, the researchers set up the ECG module, had the participants lie down on the bed, and read the instructions: ‘Please lie down quietly for the next 10 min and stay awake during the period; open your eyes, you are allowed to blink, please keep looking diagonally forward; stay relaxed and breathe naturally and evenly; please try to empty yourself, do not think about any problems and do not recall any events’. ECG signals were recorded continuously for 10 min after the participants were ready.
(2) Sleep-state HRV (SS-HRV)
After the RS-HRV data collection was completed, the researchers set up the EEG module and had the participants lie down on the bed, relax, close their eyes, and not turn their eyeballs for 30 s to obtain background EEG, after which they were required to fall asleep as soon as possible according to their sleeping habits and minimise the use of electronic products. ECG and EEG data were continuously recorded during sleep.
Analysing software
HRV analysis was performed on ECG using Kubios HRV Premium software (Shanghai Yuyan Instruments Co, Ltd). It has built-in beat detection for PPG data. And it has automatic noise detection algorithm, and automatic beat correction algorithm for correcting missed, extra and misaligned beats from RR interval data. Optimal trend removal using the smoothness priors method had operated during the analysis.
The analysis period was 10 min of RS, the first 10 min of the first non-rapid eye movement (NREM) after sleep (NREM-1), the first 10 min of the first rapid eye movement (REM) after sleep (REM-1), the last 10 min of the last NREM after sleep (NREM-2), and the last 10 min of the last REM after sleep (REM-2).
Analysis indices were time-domain indicators (RMSSD, SDNN, and pNN50), frequency-domain indicators (HF, LF, LF/HF, and VLF), and nonlinear indicators (SD1, SD2, SD2/SD1, ApEn, SampEn, α1, and α2). Frequency-domain indicators were calculated by FFT model. The HF, LF, and VLF values were transformed from the original value in ms^2 to the value in log ms^2 to fit the normal distribution.
Polysomnography, sleep staging, and HRV analysis were performed by one experienced psychiatric doctor. And the results of sleep staging and HRV analysis were checked by another experienced doctor.
Statistical analysis
The participants’ clinical and HRV data were entered into the Statistical Product and Service Solution (SPSS) 25.0 software package to create a database. Statistical significance was set at p < 0.05.
An independent samples U-test or chi-squared test was performed on general data between the MDD and HC groups. Independent samples t-test or U-test was performed on RS-HRV data between the MDD and HC groups, whereas repeated measures analysis of variance (ANOVA) was performed on NREM-HRV and REM-HRV data between the MDD and HC groups. ANOVA or H-test was performed on RS-HRV, NREM-HRV, and REM-HRV data within the MDD and HC groups.
Results
Participant characteristics
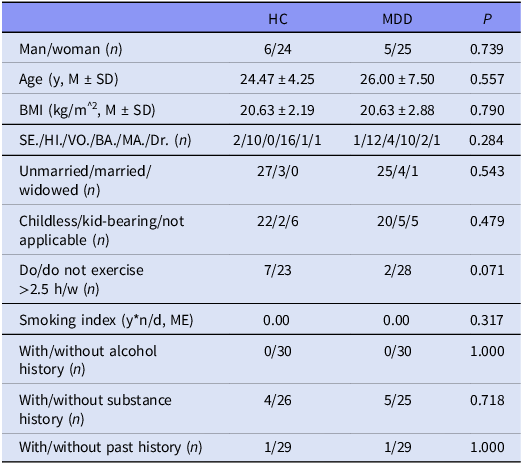
Thirty healthy volunteers (HC group) and 30 patients with MDD (MDD group) recruited in this study were matched for sex, age, body mass index (BMI), education level, marital history, exercise status, smoking and alcohol history, substance history, and medical history (Table 1).
Participant characteristic differences between MDD and HC groups

n, number; y, year; M, mean; SD, standard deviation; SE., secondary education; HI., high school; VO., vocational university.
Of the 30 patients with MDD, 25 (83.3%) had major depressive episodes, 23 (76.7%) had no other DSM-5 diagnosis, and seven (23.3%) had comorbidities: five with generalised anxiety disorder, one with social anxiety disorder, and one with anorexia nervosa. Except for one patient who received no clinical treatment, the remaining patients received at least one type of medication: 27 received antidepressant treatment and two received mood stabiliser (combined with physical therapy in 18 cases), and no one received regular psychotherapy or beta-blockers.
Group comparisons of HRV between MDD and HC groups
Group comparisons of RS-HRV
As shown in Table 2, in the RS, RS-HRV indices, including SDNN, RMSSD, pNN50, HF, LF, VLF, SD1, and SampEn were all significantly lower in the MDD group than in the HC group.
Group comparisons of RS-HRV between the MDD and HC groups (M ± SD)

Group comparisons of NREM-HRV
Table 3 shows the results of repeated measures ANOVA on NREM-HRV in the MDD and HC groups. SDNN, RMSSD, pNN50, HF, LF, and VLF were lower in the MDD group than in the HC group. Regarding the fractal NREM-HRV indices, the MDD group had lower SD1, SD2, and SampEn values and higher SD2/SD1, α1, and α2 values than the HC group. All these differences were statistically significant.
Group comparisons of NREM-HRV between the MDD and HC groups (M ± SD)

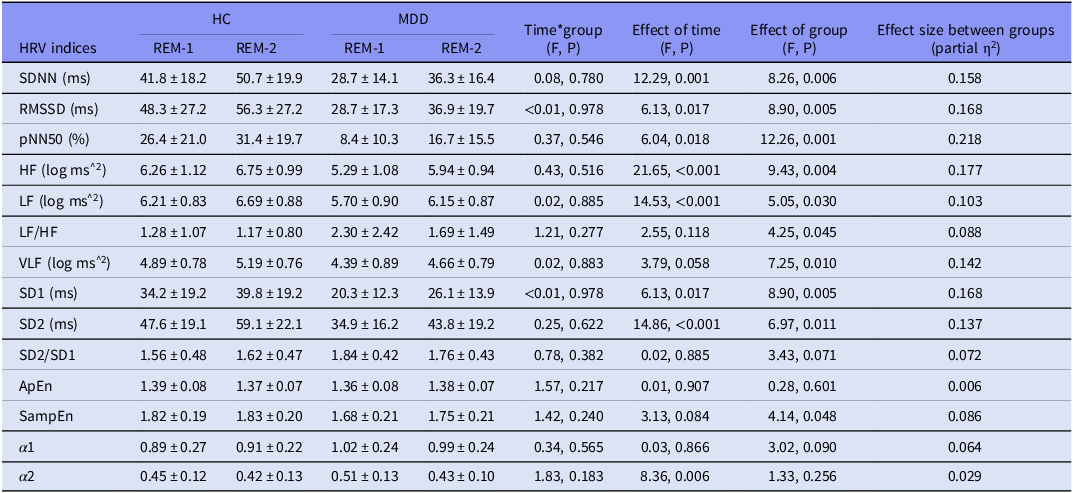
Group comparisons of REM-HRV
Table 4 shows the results of repeated measures ANOVA on REM-HRV in the MDD and HC groups. SDNN, RMSSD, pNN50, HF, LF, and VLF were lower in the MDD group than in the HC group, whereas LF/HF was higher in the MDD group than in the HC group. All these differences were statistically significant. Among the fractal HRV indices, SD1, SD2, and SampEn were significantly lower in the MDD group than in the HC group.
Group comparisons of REM-HRV between the MDD and HC groups (M ± SD)

Within-group comparisons of HRV among different sleep stages
ANOVA or H-test and pairwise comparison of HRV in the five stages (RS, NREM-1, REM-1, NREM-2, and REM-2) were performed within the two groups. The results were as follows. Within the HC group, SDNN, LF, LF/HF, VLF, SD1, SD2, SD2/SD1, α1, and α2 were not equal between the different stages. Within the MDD group, HF, LF/HF, VLF, and α2 were not equal between the different stages (Table 5).
Differences in HRV among sleep stages within a group (ANOVA)

N1, NREM-1; R1, REM-1; N2, NREM-2; R2, REM-2; &: Post hoc used Bonferroni method.
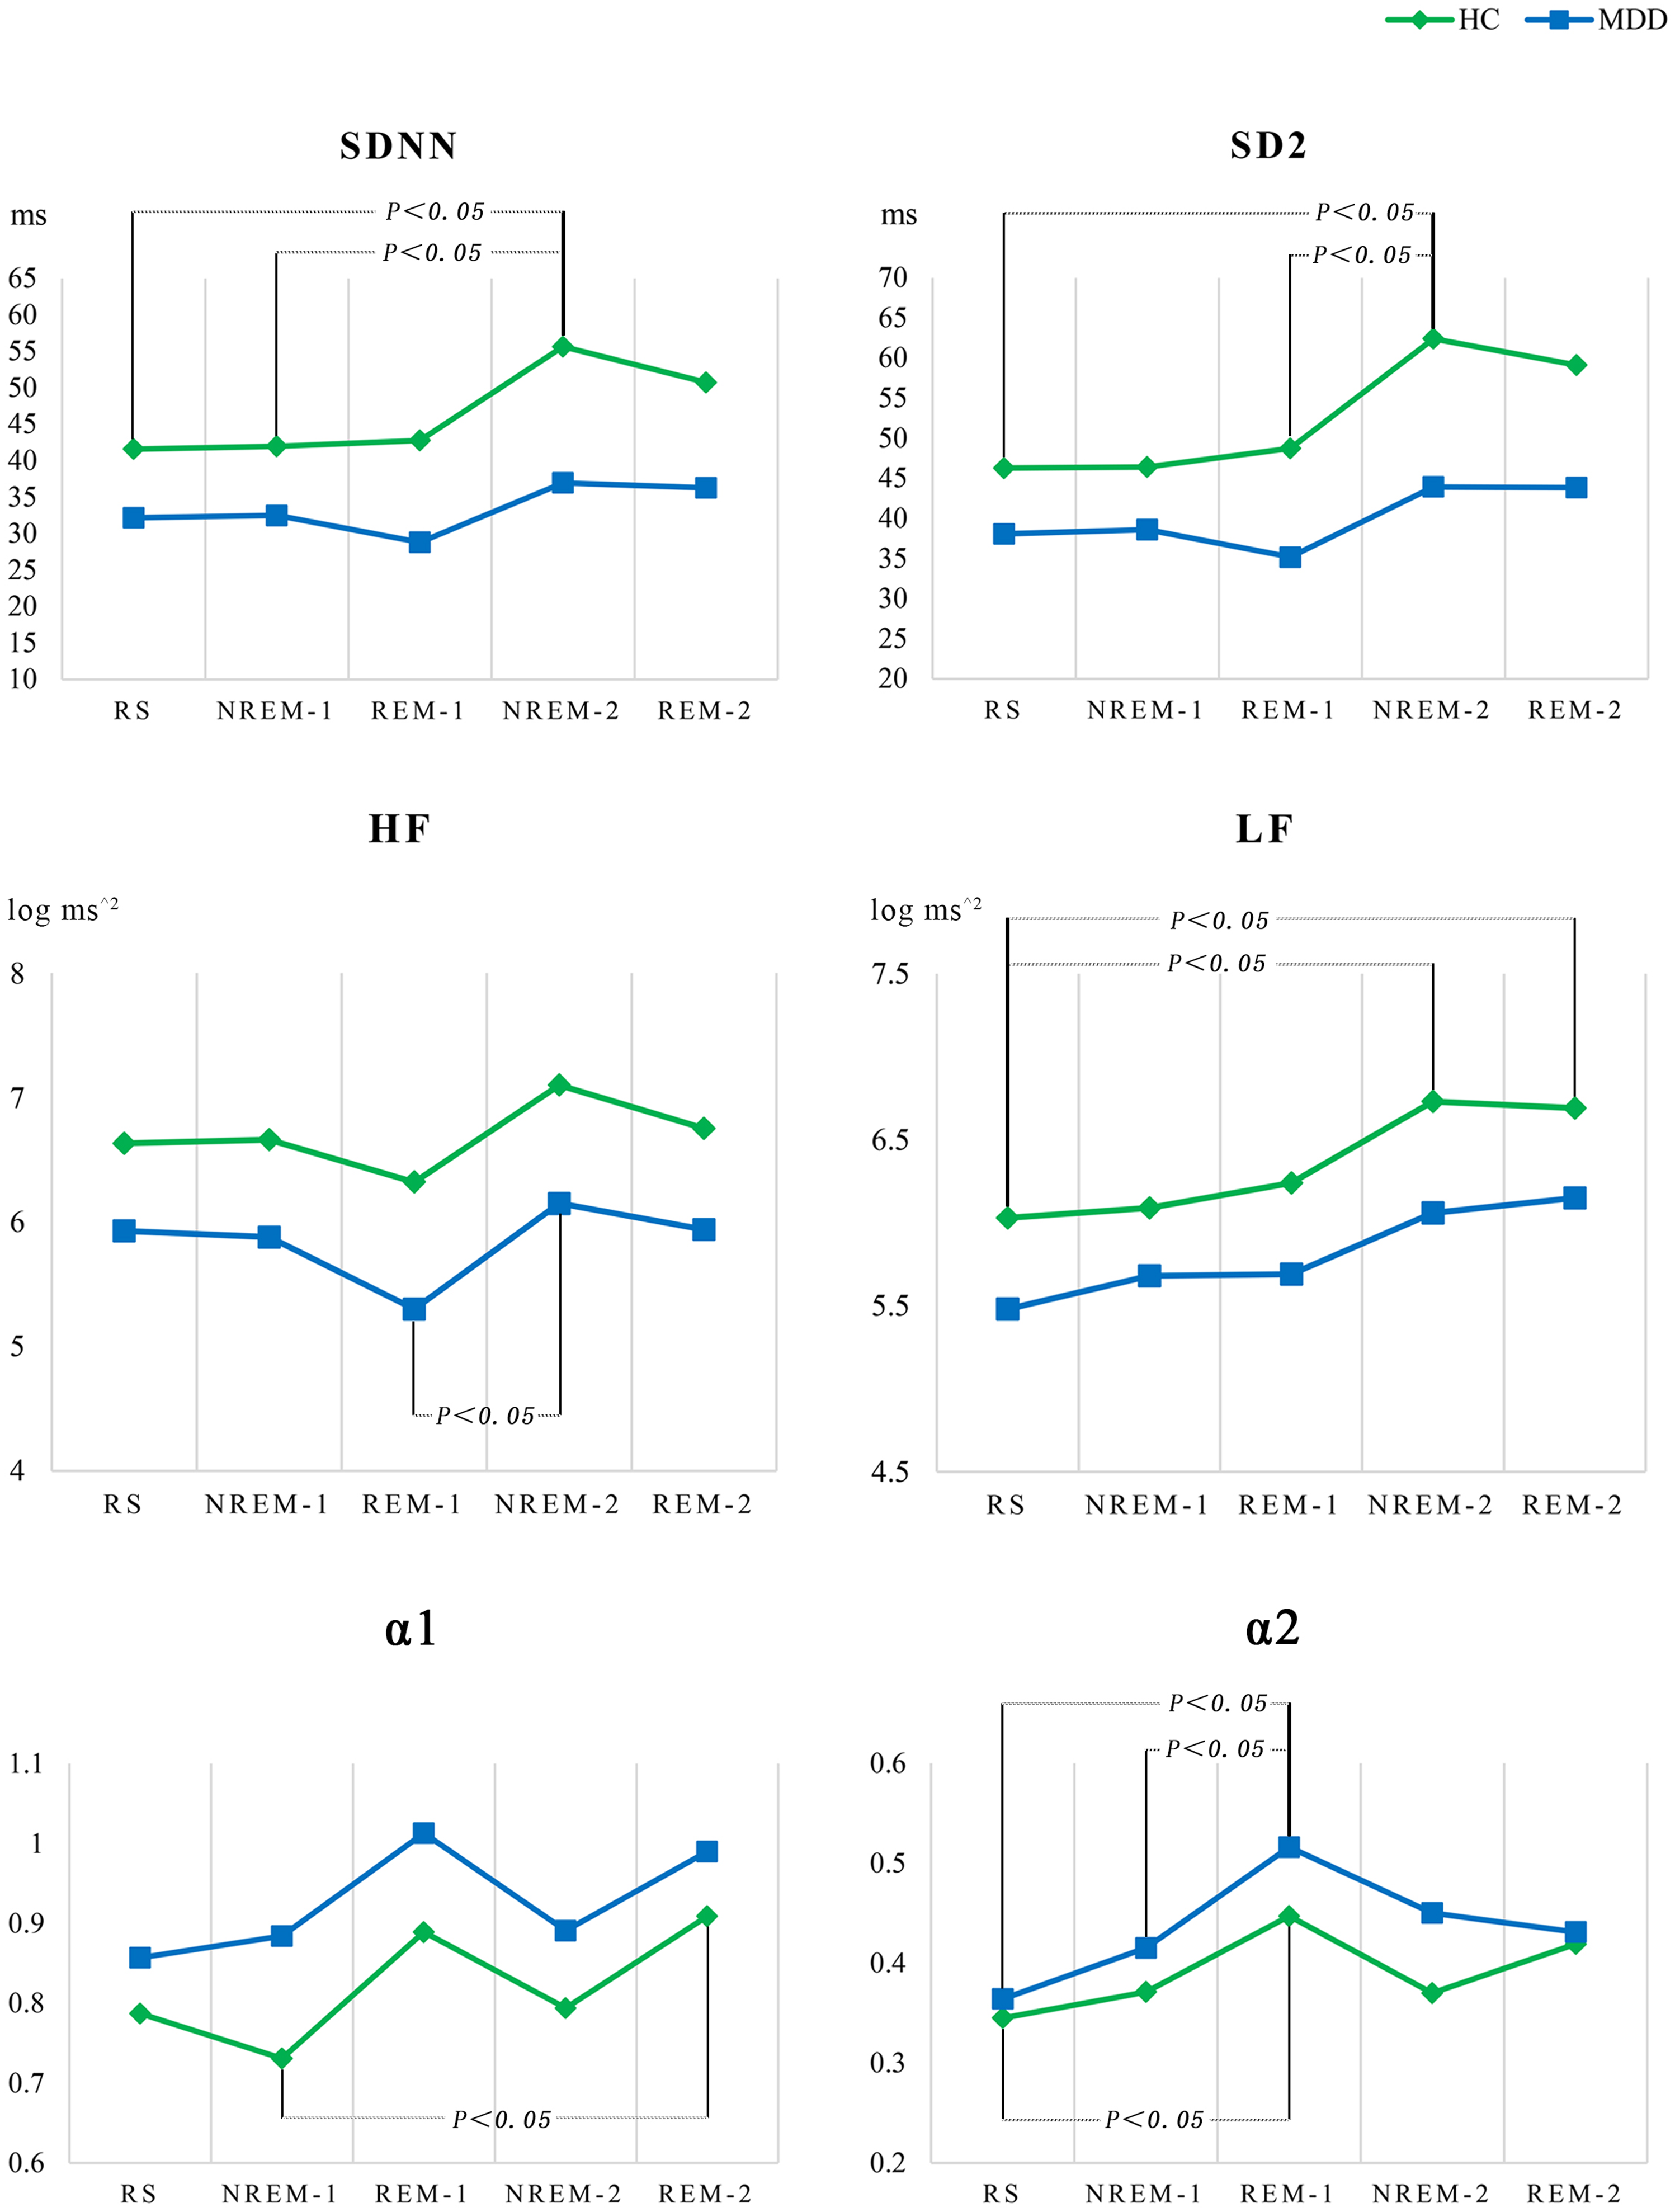
Figure 1 shows the five stages as the abscissa and the mean values of SDNN, HF, LF, SD2, α1, and α2 as the ordinates to draw a line graph and mark the two points with significant differences within each group. The change in SDNN, LF, SD2, and α1 in the different states were more evident in the HC group than in the MDD group, whereas the change in HF and α2 in the different states were more evident in the MDD group than in the HC group. SDNN, HF, LF, and SD2 of the last sleep cycle showed an increasing trend compared with the first sleep cycle in both groups.
Line chart of HRV changes among sleep stages within the MDD and HC groups.

Discussion
This study comprehensively analysed the RS- and SS-HRV of patients with MDD and found that: (1) patients with MDD had reduced HRV in both states; (2) the HRV in patients showed low adaptation during the entire sleep period; (3) SS-HRV could reveal more pathological changes than RS-HRV in MDD.
First, consistent with Koch’s meta-analysis of previous studies (Koch et al., Reference Koch, Wilhelm, Salzmann, Rief and Euteneuer2019), the present study found RS-HRV indices, including SDNN, RMSSD, pNN50, HF, LF, and VLF, were lower in patients with MDD than in healthy controls. These results suggest a reduction in the parasympathetic activity in patients with MDD. Low cardiac vagal modulation assessed using HRV may be a common risk factor for MDD and cardiovascular morbidity (Fraguas & de Souza, Reference Fraguas and De Souza2021) and appears to serve as a mechanism for elevated diastolic blood pressure in people with depression histories (Yang et al., Reference Yang, Daches, Yaroslavsky, George and Kovacs2020). Notably, the present study found that fractal HRV indices such as SD1 and SampEn were significantly lower in patients with MDD than in healthy controls. SD1 refers to the standard deviation of the distance between the points and the line y = x in the Poincaré plot; it is identical to RMSSD in reflecting short-term HRV and correlates with the baroreflex sensitivity (Ciccone et al., Reference Ciccone, Siedlik, Wecht, Deckert, Nguyen and Weir2017; Shaffer & Ginsberg, Reference Shaffer and Ginsberg2017). SampEn and ApEn are algorithms that determine the regularity of a data series based on the presence of patterns (Delgado-Bonal & Marshak, Reference Delgado-Bonal and Marshak2019). A larger SampEn or ApEn indicates that the signal (fluctuations in successive RR intervals) is less predictable (Shaffer & Ginsberg, Reference Shaffer and Ginsberg2017). Therefore, decreased SampEn indicates low complexity of the ANS in patients with MDD. In general, both the Poincaré plot and SampEn describe the chaotic features of HRV and reflect the adaptive capacity of the cardiac vagus nerve to internal or external environmental changes. The mechanism of the altered chaotic features of electrophysiological signals in patients with MDD remains unclear and may involve central and peripheral nervous system impairments due to chronic stress.
Second, the present study revealed altered SS-HRV in patients with MDD. Compared with the healthy controls, patients with MDD had generalised reduced SS-HRV indices beyond the RS, especially decreased SD2 and increased LF/HF, SD2/SD1, α1, and α2. SD2 refers to the standard deviation of the distance between the points and the line y = x + b (b refers to the mean value of the RR interval) and is associated with the LF (Shaffer & Ginsberg, Reference Shaffer and Ginsberg2017). SD2/SD1 is associated with LF/HF which as an index of sympathovagal balance was challenged. (Reyes del Paso et al., Reference Reyes Del Paso, Langewitz, Mulder, Van Roon and Duschek2013). Therefore, the meaning of increased LF/HF and SD2/SD1 ratios in patients with MDD still unclear. α1 and α2 were derived from Detrended Fluctuation Analysis (DFA), indicating the correlation between continuous RR intervals at different time standards. α1 mainly reflects the baroreflex sensitivity, whereas α2 mainly reflects the degree of restriction of the RR interval fluctuations (Shaffer & Ginsberg, Reference Shaffer and Ginsberg2017). Larger values are associated with a lower baroreflex sensitivity and a more regular RR interval. Therefore, the increase in α1 and α2 values in the present study suggested low flexibility of the ANS in patients with MDD. This finding was consistent with that in the study by Kwon et al., who calculated the HRV indicators of light, deep, and REM sleep in patients with MDD and found increased α1 during REM sleep (Kwon et al., Reference Kwon, Yoon, Choi, Choi, Lee and Park2019).
Third, the HRV in patients with MDD showed low adaptation during the entire sleep period. HRV was measured at five consecutive time points: the RS before sleep, first NREM, first REM, last NREM, and last REM stages. The HRV changes between different time points were less pronounced in patients with MDD than in healthy controls; however, the developing trends were similar. This finding aligns with previous research conclusion: hyporeactivity as evidenced by the lower fluctuation of HF is a hallmark of depression during sleep and stress (Schiweck et al., Reference Schiweck, Piette, Berckmans, Claes and Vrieze2019). In addition, most HRV indicators (SDNN, RMSSD, pNN50, HF, LF, SD1, and SD2) tended to increase in the last sleep cycle than in the first sleep cycle in both patients with MDD and healthy controls. This was consistent with Kontos et al.’s study, which revealed that SDNN and LF in healthy children and adolescents increased significantly during penultimate and final REM sleep (Kontos et al., Reference Kontos, Baumert, Lushington, Kennedy, Kohler, Cicua-Navarro, Pamula and Martin2020). These findings suggest that sleep could improve HRV; however, patients could not recover enough from sleep.
Finally, the present study found that the SS showed more HRV indicators than RS, with significant differences between the two groups. As shown in Figure 1, the HF in NREM-1 did not increase but decreased compared with RS in the MDD group; HF in REM-1 had a distinct downward trend compared with NREM-1. Regarding such a result, we speculate to be associated with the difficulty in parasympathetic activity in NREM and excessive sympathetic activity in REM in patients with MDD. RS refers to being awake and quiet, sitting or lying down, with eyes open, and not thinking in particular. During sleep, individuals have spontaneous mental activity, and ANS levels fluctuate with sleep stages. NREM sleep is dominant by parasympathetic activity (Grimaldi et al., Reference Grimaldi, Papalambros, Reid, Abbott, Malkani, Gendy, Iwanaszko, Braun, Sanchez, Paller and Zee2019), whereas REM sleep is dominant by sympathetic activity (Boudreau et al., Reference Boudreau, Dumont, Kin, Walker and Boivin2011; Boudreau et al., Reference Boudreau, Yeh, Dumont and Boivin2012; Boudreau et al., Reference Boudreau, Yeh, Dumont and Boivin2013). According to the fluctuation characteristics of SS-HRV, methods of using HRV to monitor the state of consciousness and determine REM have been developed (Yoon et al., Reference Yoon, Hwang, Choi, Lee, Jeong and Park2017; Zorko et al., Reference Zorko, Frühwirth, Goswami, Moser and Levnajić2019). In addition, healthy people with difficulty relieving fatigue after sleep have decreased TP during sleep (Gorlova et al., Reference Gorlova, Ichiba, Nishimaru, Takamura, Matsumoto, Hori, Nagashima, Tatsuse, Ono and Nishijo2019). Non-medicated MDD has prolonged sympathetic activity overnight with REM often spends overtaking time in the first half of the night (Murphy & Peterson, Reference Murphy and Peterson2015). Two research found MDD exhibited significant reductions in parasympathetic-related HRV indices during sleep, but no mention of which period the HRV was analysed (Yang et al., Reference Yang, Tsai, Yang, Kuo, Chen and Hong2011). These evidences suggest that SS-HRV may reveal more pathological changes than RS-HRV in MDD. A study has shown that coexisting short sleep duration and depression may expose individuals to a higher risk of cardiovascular disease (Jin et al., Reference Jin, Zhang, Song, Wu and Yang2022). Further clinical trials are needed to determine whether insomnia treatment can reduce the incidence of cardiovascular events.
The most valuable of this study is providing an operable method to analysis HRV of MDD during sleep, which may more sensitive to reveal ANS changes. While, this study had some limitations. First, the cross-sectional design could not detect a causal relationship between MDD and HRV. Second, in natural clinical practice, it was difficult to completely exclude confounding factors such as treatment and comorbidities in this study. And, the small number of male samples and the artefacts in the fragment which was analysed may affect the results. Third, due to the limited accessibility and ease of implementation of sleep monitoring equipment, measuring SS-HRV may difficult in clinical practice or study.
In conclusion, patients with MDD had a generalised reduction in HRV in both RS and SS and decreased dynamic changes during sleep. Altered ANS activity has been implicated in MDD pathology. It is hoped that in the future, more studies will focus on the relationship between SS-HRV and clinical features or treatment effects of MDD. With the accumulation of research data and theoretical exploration, SS-HRV is expected to become a useful biological indicator for clinical assessment of MDD severity and prediction of treatment efficacy.
Data availability statement
The data that support the findings of this study are available from the corresponding author upon reasonable request.
Author contributions
Design and direction of the study performed by Nianhong Guan and Xianglan Wang. Experiment implementation, statistical analysis, and article writing performed by Shurui Chen, Minfeng Cheng, Xi Fang, and Zhibin Tang.
Funding statement
This work was supported by the Key Projects of Guangzhou Municipal Health Science and Technology Program [grant number 2022A031003].
Competing interests
None.
Ethical standards
The authors assert that all procedures contributing to this work comply with the ethical standards of the relevant national and institutional committees on human experimentation and with the Helsinki Declaration of 1975, as revised in 2008. This study was approved by the Ethics Committee of the Third Affiliated Hospital of Sun Yat-sen University ([2022]02-139-01). Informed consent was obtained from all participants in the study.
Role of the fund source
The funding source was not involved in the study design; the collection, analysis or interpretation of the data; the writing of the report; or the decision to submit the article for publication.


 Open access