Business historians have repeatedly investigated the process of economic natural selection in the business sector, focusing on the question posed by Tom McGovern in an article title: “Why do successful companies fail?”Footnote 1 McGovern analyzes the decline of Dunlop and its exit from the tire industry it had dominated. Similarly, Christopher McDonald charts the decline of Western Union, a mighty company in the 1950s that finally collapsed under the weight of its losses by the 1990s, with nothing remaining today except a money transfer service and a name.Footnote 2 Joseph Amankwah-Amoah and Yaw Debrah explain the decline of Air Afrique from its “glorious days” and its eventual exit from the industry.Footnote 3
In this article we explore a complementary question in economic natural selection: Why do unsuccessful companies survive? We focus on the airline industry, where Warren Buffett, the famously expert investor, made a statement challenging the standard economic analysis: “The worst sort of business is one that grows rapidly, requires significant capital to engender the growth, and then earns little or no money. Think airlines. Here a durable competitive advantage has proven elusive ever since the days of the Wright Brothers. Indeed, if a farsighted capitalist had been present at Kitty Hawk, he would have done his successors a huge favor by shooting Orville down.”Footnote 4 In an interview Buffett said, “As of 1992 … the money that had been made since the dawn of aviation by all of this country's airline companies was zero. Absolutely zero.”Footnote 5
Such a long period without profit runs counter to the standard conclusions of the microeconomics and industrial organization literatures. “Those who realize positive profits are the survivors; those who suffer losses disappear,” wrote Armen Alchian in his classic paper on economic natural selection.Footnote 6 The industrial organization text by Frederic M. Scherer and David Ross argues that “firms departing too far from the [profit maximization] optimum, either deliberately or by mistake, will disappear. If the process of economic selection continues long enough, the only survivors will be the firms that did a tolerably good job of profit maximization.”Footnote 7
How long is “long enough”? Buffett contends that the airline industry failed to deliver profits in its first nine decades.Footnote 8 In the period between the millennium and the Great Financial Crisis, Buffett's zero profit then turned into a cumulative loss of nearly $60 billion. And yet—remarkably, in light of the standard economic model—not a single major airline was liquidated or taken over in the period 2000–2008. This article attempts to provide explanations for this most puzzling episode in an already counterintuitive long-term experience. It outlines interactions between, on the one hand, the supreme corporate survivor GE—the only continuous member of the Dow Jones Industrial Index from 1886 to 2018, led for two decades by “the best manager of the twentieth century,” Jack Welch—and, on the other, the airline industry, which witnessed many failures between deregulation in 1978 and the millennium.Footnote 9 Those interactions are related to the emergence in the 1990s of a new model of financing airlines—through aircraft leasing—and GE's dominance of the aircraft leasing business.
This article is a multidisciplinary study of the 2000-to-2008 period but is set in the historical context of the airline industry, the emergence of airline leasing in the mid-1990s, and the strategy of GE. Some aspects of the narrative are supported by statistical analyses that use data stretching back to 1949. Thus, the article unusually blends case study and statistical methods; this is also relevant given recent methodological discussions about the need to encourage a plurality of research methods and concerns about the dearth of detailed case studies published in financial history.Footnote 10 We begin by analyzing the aggregate losses experienced by the sector from 2000 to 2008, drawing on business-level and industry-level data to show that this period marked a significant change for the worse. Yet none of the major airlines filed for Chapter 7 bankruptcy in those years. They survived with weaker finances than would previously have spelled failure, and their weakness is not readily explained by the main market-level variables on which econometricians had previously relied to predict industry profits.
We next describe the role played in their survival by the “accommodating” creditor, GE Commercial Aviation Services (GECAS), the finance arm of GE, the conglomerate supplier of leasing finance, engines, and servicing. GE repeatedly extended support to distressed operators mainly through leasing finance. We explain the institutional characteristics of the industry that combined with a special conjunction of circumstances to accord GE the extraordinary financial and market power it enjoyed up to the 2008 financial crisis.
We explore the distribution of the gains and losses accruing respectively to GE, the airlines, and passengers from this relationship, offering a partial answer—at least for this period—to the question posed by Adam Pilarski's book title: “Why can't we make money from aviation?”Footnote 11 Upstream suppliers in the air transport industry supply chain were making profits, but not the airlines. Meanwhile, passengers benefited from the competition among surviving but ailing airlines: the long-run trend decline in fares accelerated and choice of flights expanded.
The penultimate section offers a postscript and follows the experience of GE and of airlines after 2008. It describes a dramatic reversal of fortunes that gives an extra perspective on the earlier episode. GE has recently suffered a declining share price, resulting in its removal from the Dow Jones Index for the first time since 1886, and has shrunk into a smaller, focused business that saw three CEOs in two years and whose own survival was in doubt. By contrast, until the COVID-19 pandemic grounded the airlines in 2020, the airlines have since enjoyed sustained profitability.Footnote 12 Finally, we discuss the generalizability of the findings and trace implications of the analysis for allocative efficiency and for the efficiency of bankruptcy resolution, of financial intermediation, and of the conglomerate business model.
This article adds to studies that have chronicled the history of U.S. commercial aviation, from the inception of the first airline in 1913 to the end of the twentieth century.Footnote 13 The period from 1903 to 1938 was characterized by bold entrepreneurship; competition from railroads and ships; government airmail subsidies that spawned the first airlines in the 1920s; and World War II, which intensified the need for air transport.Footnote 14 The 1930–38 period saw the airline industry lobbying for more regulation, leading to a forty-year period of federal regulation, from 1938 to 1978.Footnote 15 Following the 1973 oil crisis, the 1978–2001 period witnessed deregulation, intense competition, and further saturation. Other themes studied include U.S. international aviation policy and the role of entrepreneurs, leaders, and managers who shaped the evolution of the airline industry and were, in turn, influenced by it.Footnote 16
The emergence of airline leasing in the 1990s was congruent with the historical evolution of GE and the new strategic focus that Welch introduced toward the latter part of the twentieth century. Indeed, much of GE's success in the 1990s and its problems since 2008 originate from its overreliance on large financial services businesses.Footnote 17 GE used to be known as an industrial giant. Bernard Carlson describes the nineteenth-century history of GE and how Elihu Thomson helped convert electrical lights, generators, and motors from mere curiosities in 1875 to commonplace products by 1900.Footnote 18 It was GE that set the precedent for industrial scientific laboratory research in the United States.Footnote 19 It entered the computer industry in the 1950s and also became one of the largest and most successful chemical companies.Footnote 20 However, under the chairmanship of Welch, GE diversified into finance, transforming GE into an even more profitable conglomerate, with Welch being hailed as America's best manager of the twentieth century.Footnote 21
GE's net income increased from $1.65 billion in 1981 to $12.7 billion in 2000, but a progressively smaller share of that income came from GE's traditional manufacturing businesses.Footnote 22 Between 1980 and 1998 the contribution of financial services to corporate earnings grew from 8 percent to about 40 percent.Footnote 23
The Financial Performance of the U.S. Airline Industry, and Exit from the Industry: 2000–2008
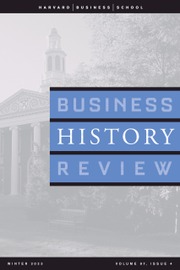
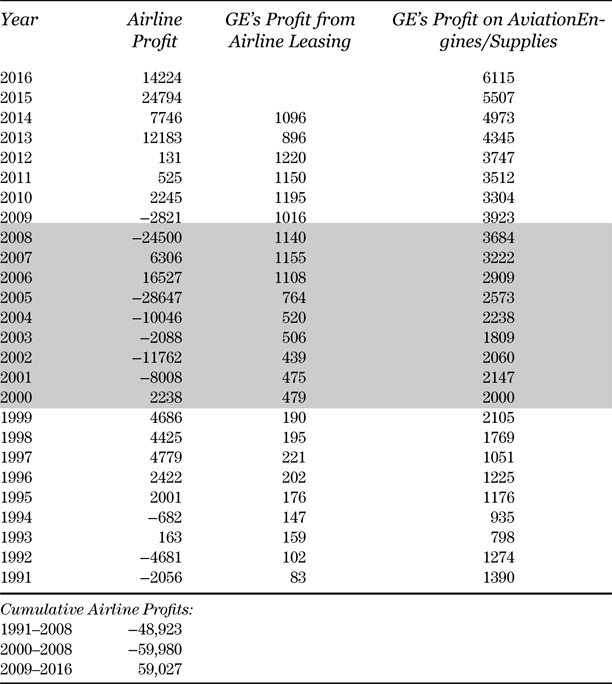
Table 1 and Figure 1 (Panel A) report two indicators of the financial health of the U.S. airline industry: aggregate net income and airline margin (profit/revenue). The highlighted area of the table, covering the period from 2000 to 2008, depicts a pattern of deficits which echoes that in studies of individual business failure, including Air Afrique and Dunlop.Footnote 24 Cumulative losses for 2000–2008 total nearly $60 billion.
Profits for Major US Passenger Airlines and for GE activities in the Aviation Industry (Current prices, $million).
Sources: Airlines for America (A4A), “Annual Financial Results: U.S. Passenger Airlines,” 13 May 2022, accessed 12 Sep. 2022, http://airlines.org/dataset/annual-results-u-s-passenger-airlines/; GE, “GE Annual Report,” accessed 12 Sep. 2022, https://www.ge.com/investor-relations/annual-report. Some of the data were hand-collected from annual reports and 10k filings. The segmental profit data for GE are on somewhat different bases in different years and in different segments. See Online Appendix S2 for details.
Airline margins and GE's Aviation margins (Panel A) and GECAS Profit/Leases (Panel B). (Sources: A4A, “Annual Financial Results: U.S. Passenger Airlines,” 13 May 2022, accessed 12 Sep. 2022, http://airlines.org/dataset/annual-results-u-s-passenger-airlines/; GE, “GE Annual Report,” accessed 12 Sep. 2022, https://www.ge.com/investor-relations/annual-report.)
Of the airline carriers included in these aggregates and analyzed in Table 2, none filed for Chapter 7 bankruptcy in the period 2000–2008 (leading to liquidation and exit).Footnote 25 Nine entered Chapter 11, which afforded court protection from holders of claims, averting exit: US Airways Group in 2002 and 2004; Delta, Northwest, Atlantic SE, and Comair in 2005; ATA in 2004 and 2008; Hawaiian Holdings in 2003; Allegiant in 2000; and United Airlines in 2002. Of these nine airlines, only five count as major airlines based on the U.S. Department of Trade's definition: ATA, Delta, Northwest, US Airways, and United Airlines.
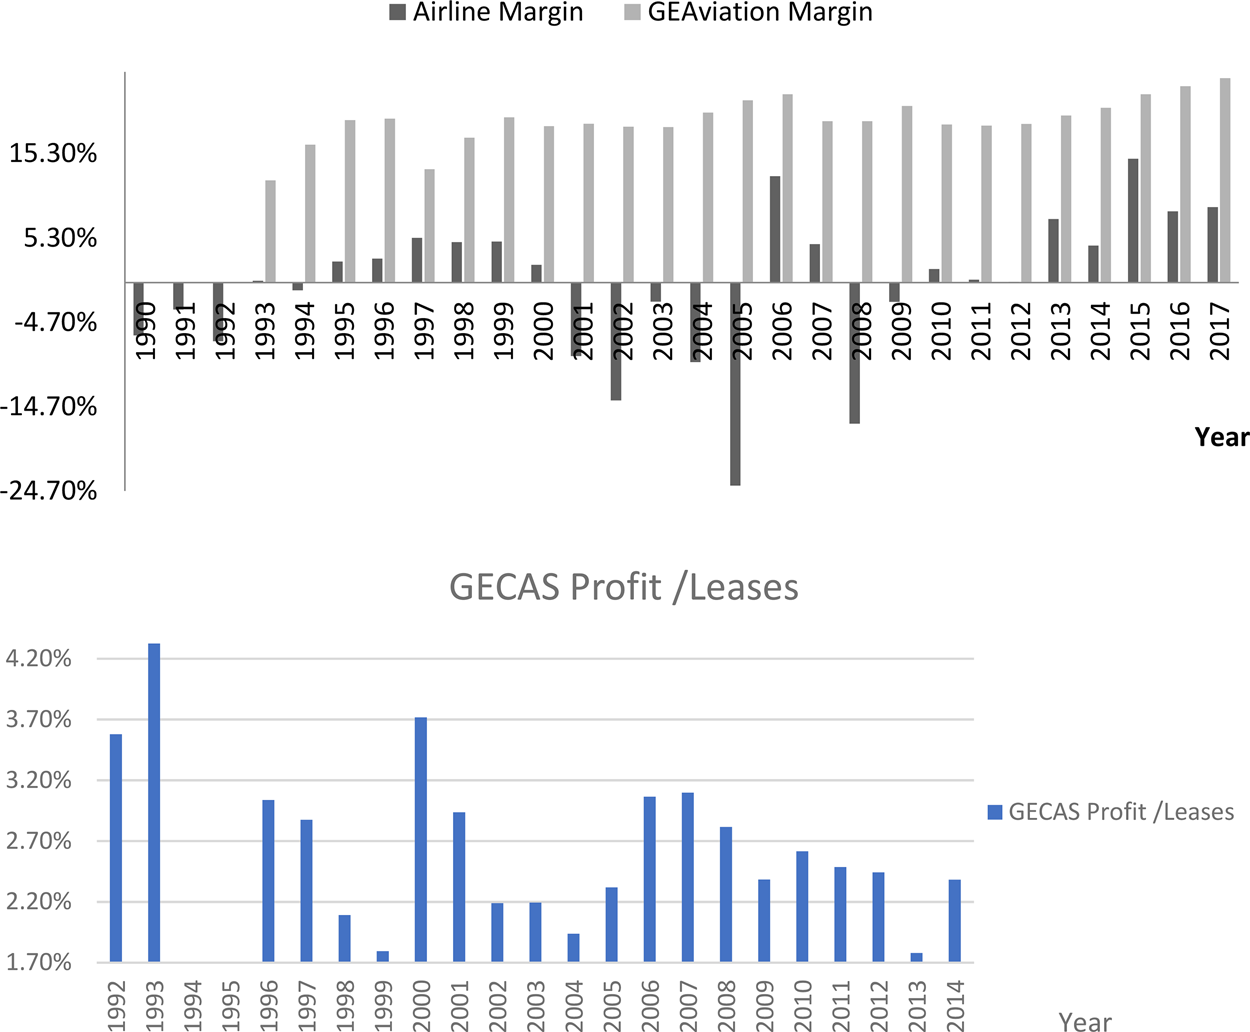
Z-scores for US airlines, 1990–2008
Source: The data are from Chung and Szenberg, “The Effects of Deregulation on the US Airline Industry” for 1990–1991, Gritta, Adrangi, Adams, and Tatyanina, “An Update on Airline Financial Condition and Insolvency Prospects” for 1997–2006, and Bloomberg for 2007–2008, and cover regional to major airlines. The Z-scores (rounded to one decimal place) were estimated at the end of each year. See Online appendix S3.
At first sight it is surprising that there were not widespread closures in this period, when cumulative losses were nearly $60 billion. Table 2 pursues this question. Using Altman Z-scores, we ask whether it would be expected that more of the airlines would have failed in these more recent years, if the relationship between performance and failure observed in earlier years had continued. Altman Z-scores have been shown to have significant power in predicting bankruptcy and are widely adopted by lenders and rating agencies to assess the survival prospects of current or prospective borrowers.Footnote 26 The Z-scores in Table 2 are drawn from a succession of studies by Chung-Cheng Chung and Michael Szenberg, Richard Gritta et al., and Bloomberg.Footnote 27
Chung and Szenberg's study sets a score of 1.81 as the critical level below which they classify airlines as likely failures. Gritta et al. estimate a score of 1.1 or less as indicating a high degree of financial distress and heightened immediate risk of failure, while “negative numbers indicate severe financial distress.”Footnote 28 On this basis, in the six years leading up to the financial crisis, the median for Gritta et al.'s sample was consistently below 1: hardly any of the airlines classified as majors under the DOT classification (> $1 billion revenues) regularly achieved Z-scores above the critical bankruptcy risk level of 1.1. Most actually reported some negative Z-scores (indicating severe financial distress). The poor financial performance of the airline sector in aggregate was, therefore, reflected in the financial statements of the great majority of individual members of the sector. Composite measures of the financial health of these individual airlines suggest that in earlier years their performance and financial position might have resulted in failure, yet none of the majors failed between 2000 and 2008. Airlines were surviving with negative retained income and worse financial metrics than would previously have spelled bankruptcy; the evidence is consistent with there having been a significant change in the financial markets on which they relied for funding.
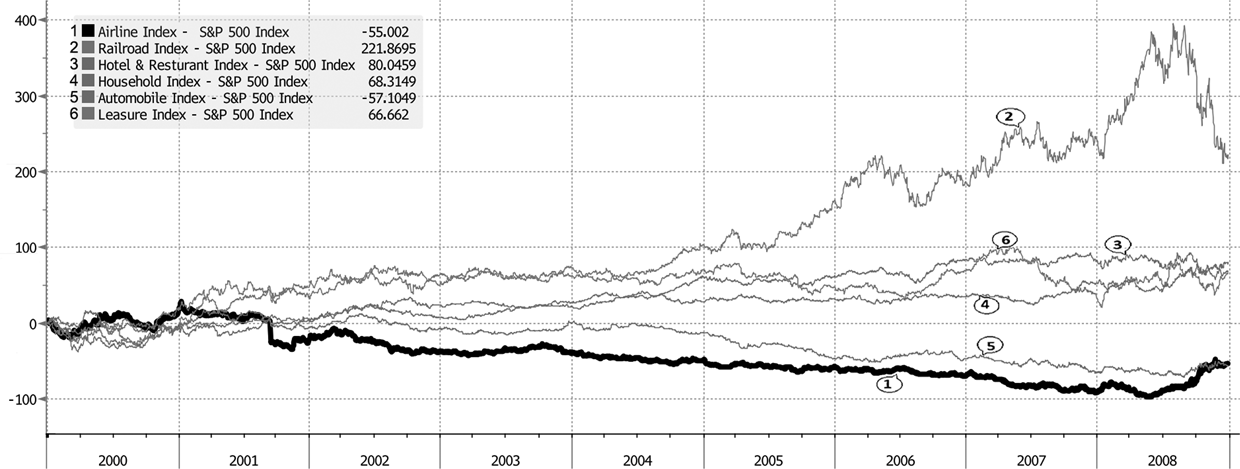
The evidence in Tables 1 and 2 might conceivably be consistent with efficient economic natural selection if the adverse finances of the airlines were temporary fluctuations that were expected to soon reverse. Then it might be in the debtors’ long-term interest to stay in business, if the losses would be recouped when normal conditions returned. Such considerations are central to some business models in highly cyclical industries. At first sight this possibility looks remote, since the losses accumulated in this period were so great. Moreover, the industry's chronic past failures to make profit would not have fostered expectations that the losses in this adverse episode would readily be recouped. Nevertheless, it might have been that the years following the millennium suffered unusually damaging levels for the short-run influences on profitability and that, given past relationships (up to 2000) between profits and macroeconomic drivers of profit, reported profits were as expected for the economic conditions of the 2000-to-2008 period. In that case, profits would have been “normal” given the economic circumstances; no other explanation might be needed. And continuing in business, though unprofitable in the short term, might still have been in the interests of airlines’ shareholders. We investigated the possibility that the exceptionally poor airline financial performance in 2000–2008 was the result simply of transitory and predictable adverse movements that might be expected to reverse. The details of this exercise are provided in the Online Appendix S4. We used standard models of airline profits with historical data, including key drivers of airline profitability, such as GDP and oil prices. We then forecasted profits for our period using the actual values of exogenous variables. The forecasted profits, using an autoregressive distributed lag model, mostly exceeded realized profits by a large margin, suggesting that the period from 2000 to 2008 saw a much weaker financial performance for the industry than would have been expected based on the previous relationship between airline profitability and its drivers. Moreover, over the period 2000–2008 the Airline Index underperformed both the S&P 500 and five other relevant sector indices (Figure 2).
Market-adjusted returns for the Airline Index vis-a-vis five other sectors. (Source: Bloomberg.com.)
The Role of GE in Supporting Distressed Airlines
GE interventions. We earlier posed the question: How did airlines survive when their financial health would in earlier years have spelled death? In practice, there are numerous examples of GE/GECAS deploying its power as a principal creditor to rescue distressed airline customers.Footnote 29 The interventions would commonly reinforce GE's market power in the process.
For example, a European Commission (EC) decision quotes Jack Welch, then CEO of GE: “Continental Airlines was struggling in bankruptcy in 1993. Loans from GE Capital helped put Continental back in the air. Next came a big order from Continental for new planes—most with GE engines.” The EC decision continues: “when Continental had a choice of engines available, the airline chose GE engines every time.”Footnote 30 The Economist gives many further examples of GE's interventions to help airlines stave off liquidation: emergency loans to United Airlines and Delta; deferral of payments and taking back planes from Independence Air and US Airways; and 225 aircraft placed with three other “ailing carriers.”Footnote 31
Still more explicit is an extract of a motion filed by US Airways in a bankruptcy court of Eastern Virginia requesting permission to enter into a global settlement with GE:
GECC (General Electric Capital Corporation) is the single largest aircraft creditor of the debtors. Together with Engine Services and other affiliates, GECC directly financed or leased 150 Debtors’ aircraft prior to the petition date. In addition, GE Engine Services is a critical vendor for the Debtors, maintaining the engines for virtually all of the Debtors’ aircraft. GECC is also one of the few financial institutions currently having the ability and the willingness to provide substantial funding to lease or acquire regional jets, which continue to be a critical part of the Debtors’ business plan upon emergence.
In view of these factors, the Debtors believe that it is in the best interest of their estates and all parties to enter into the Global Settlement to resolve all issues with GECC and its affiliates, and acknowledge the critical role that GECC will play in the Debtors’ recovery plan. The resolution reached with GECC reflects its unique relationship with the Debtors and its willingness to provide critical regional jet leases as the Debtors restructure their operations, both during the pendency of these cases and after emergence from bankruptcy.Footnote 32
GE could therefore avoid the inefficiencies associated with Chapter 11 when creditors were widely dispersed.
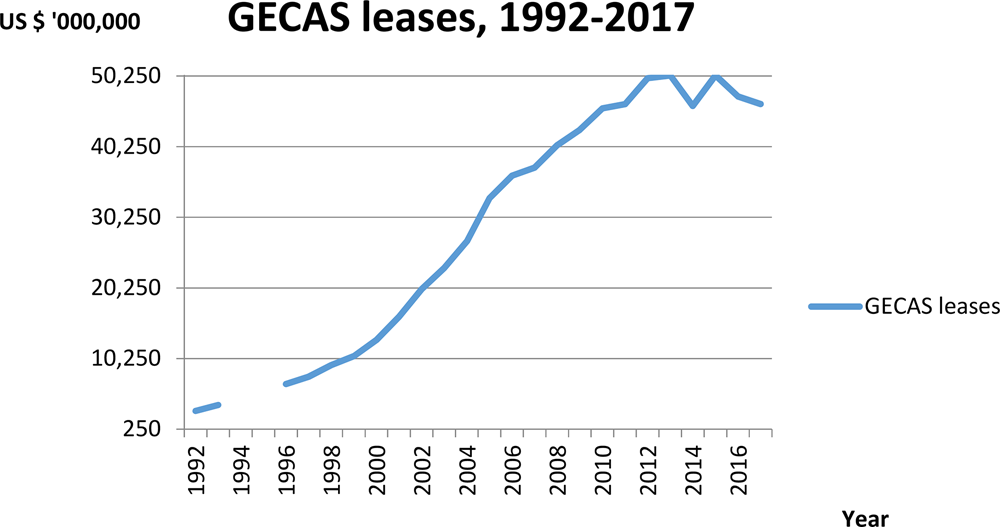
The scale of GE's activity in financing the airline industry. The aircraft leasing industry scarcely existed until the mid-1980s but then grew rapidly, until in 1997 about 46 percent of the entire world airline fleet was leased.Footnote 33 In the United States, GECAS became the dominant lessor in terms of the number of aircraft owned. Its fleet increased from 500 in 1993 to 850 in 2001 and 1800 by 2009.Footnote 34 Figure 3 charts the value (at cost) of the leased fleet, which rose from $3 billion in 1992 to $40 billion in 2008. Nearly all aircraft owned by GECAS are powered by engines from GE Aviation, another subsidiary of GE. In addition to its own aircraft fleet, GECAS managed approximately 300 aircraft for others and had more than 230 airline customers.
GECAS Leases, 1992–2017. (Source: GE, “GE Annual Report,” accessed 12 Sep. 2022, https://www.ge.com/investor-relations/annual-report.)
By 2005, GE had over $33 billion in loans and leases to airlines.Footnote 35 In addition to being the leading lessor in the U.S. aircraft financing market, GE also held a dominant position in the market for large aircraft engines with a market share of approximately 65 percent of sales of total aircraft engines.Footnote 36 Götz Drauz reports that GECAS was the largest purchaser of new aircraft, ahead of any individual airline carrier or other leasing company.Footnote 37 It also had the largest single fleet of aircraft in service, as well as the largest share of aircraft on order and options.
The origins of GE's dominance. GECAS enjoyed a benign institutional environment in which to build this position: tax provisions, financial management conventions, accounting rules, and lender protection arrangements.
Airlines wishing to take advantage of accelerated depreciation for tax purposes (which can reduce the lifetime post-tax cost of investments) have faced two obstacles. The first was the Alternative Minimum Tax, which limited the benefits of accelerated depreciation for capital-intensive industries. The second is that airlines often had no taxable profits with which to benefit from tax relief. This has created opportunities for profitable industry outsiders, such as financial institutions specialized in leasing, to take advantage of these tax benefits. For example, many of the GECAS leases to American carriers were leveraged leases, which allowed GE to defer its own tax bills by writing off the cost of the plane against tax over seven years. Taken together with the tax deductibility of interest on the money borrowed by GE to finance the plane, the result is a significant reduction of the lessor's tax payments in the early years of the lease.Footnote 38
In addition, Drake Bennett reports that GE borrowed in the United States to finance businesses in low-tax countries and offset the interest against GE's onshore profits, avoiding higher U.S. tax rates.Footnote 39 GE's annual report for 2011 spells out this strategy: “Our consolidated income tax rate is lower than the US statutory rate primarily because of benefits from lower-rated global operations, including the use of global funding structures … non US income is subject to local country tax rates that are significantly below the 35% US statutory rate.”Footnote 40
In principle it might be expected that, taxation aside, leasing would bring no advantages, each one dollar of leasing just replacing one dollar of debt capacity.Footnote 41 However, in practice, there were further benefits. First, operational leases have been the only source of finance that offered 100 percent funding, in contrast with conventional debt, where capital markets in general expected 15 percent to 25 percent equity participation in debt contracts. In these circumstances the “sale and lease back” procedure became popular, because it economized on cash compared with a conventional debt contract.Footnote 42 Business Today explains how these benefits might be further augmented: “Airlines sell the aircraft to a leasing company, such as … GECAS, at a profit of $1 to $5 million and book this as ‘other income’ on their books. The leasing company then leases the plane back on a long-term lease for 5–10 years. The airline, thus, transfers capital expenditure into operational expenditure.”Footnote 43 The short-term gains to the airline's accounts might therefore include earlier income recognition and cash flow brought forward, as well as the appearance of more favorable leverage. In practice, operating lease obligations have typically been off–balance sheet and may circumvent loan covenants.Footnote 44
Efraim Benmelech and Nittai Bergman explore the benefits of creditor protection and conclude that higher levels of protection enhance firms’ ability to make large and technologically advanced investments, promoting productivity.Footnote 45 In relation to lender protection, aircraft lessors have enjoyed a privileged position. Section 1110 of Chapter 11 allows lessors to repossess aircraft within sixty days of the debtor's filing of its Chapter 11 petition: “§1110 not only strips the court of any power to prevent the repossession of aircraft equipment, but also facilitates the financier's repossession of that equipment by eliminating the requirement that the financier move to lift the automatic stay and subordinating the debtor's right to use, sell, or lease the equipment to the financier's right to possession.”Footnote 46 This special provision to give priority among creditors to aircraft lessors reduces lenders’ risk and further reinforces the incentives to finance aircraft through leasing.Footnote 47
The competitive advantage enjoyed by GE in securing finance. GE's dominant position among aircraft lessors has been attributed partly to the conglomerate's access to capital (before the financial crisis) on unusually favorable terms. Geoffrey Colvin and Katie Benner reported estimates that GE's cost of capital was lower than that of leading banks including Morgan Stanley and Citigroup, lower even than Berkshire Hathaway.Footnote 48 Its triple A credit rating (enjoyed by only six corporations altogether) likely was at least partly to have been sustained by two characteristics: its size and its linking of complementary business segments. Its market value (around $485 billion in June 2001) was about a hundred times larger than that of its main (undiversified) rival engine manufacturer in Europe (Rolls Royce).Footnote 49 Then, as a diversified business, it gained from the combination of the tangible assets and reliable earnings of its industrial divisions with the high margins of its finance division, GE Capital. In addition, as part of the GE conglomerate, GE Capital was subject to less scrutiny by financial regulators than other large financial institutions.Footnote 50
The market power accumulated by GE. From 1996, GECAS operated a “GE only” tying policy when negotiating leases: finance was conditional on the client buying GE equipment. As a consequence, the EC reported in 2001, 99 percent of the large commercial aircraft ordered by GECAS were GE powered; GE had no suitable engines for the rest. The EC decision concluded that “through GECAS's bias in favour of GE engines and its influence over airlines, GE has been able to increase GE's market share of engines.”Footnote 51 The benefits to GE revenue persist beyond the initial engine purchase since the costs of maintenance and spare parts over the lifetime of an engine average around 200 percent of its initial cost.Footnote 52
Thanks to its dominance of lease finance for aircraft, GE, via GECAS, owned or managed the largest fleet of aircraft in the United States and was the leading purchaser of aircraft for lease to its airline customers. This has meant GECAS could secure exclusivity or priority when offering a manufacturer a greater launch order or more substantial boost order for its aircraft. And as the economics of airplane manufacture are so sensitive to volume (because of the high level of fixed costs), a GECAS order could significantly increase the profits from an airframe program - and GE could insist that the aircraft were GE powered.Footnote 53 The European Commission maintained also that GE's favored position in the capital markets relative to competitors enabled it to deploy funding to airframe manufacturers in the form of platform program development assistance. In return, GE obtained engine exclusivity on those airframes that it financially assisted. This mechanism would therefore enhance market share and profit margins on engine sales.
GE's ability to bring about more efficient restructuring of the industry, relative to costly bankruptcy. While the industrial organization literature identifies losses in allocative efficiency arising from such lessor concentration, the governance and legal literatures suggest areas in which this concentration of power linked to leasing may reduce agency and bankruptcy costs. One strand of the governance literature argues in favor of increasing firms’ reliance on debt finance (such as leasing) to reduce agency costs: underperforming manager-agents are then at risk of being more quickly forced into insolvency and bankruptcy, and out of their jobs, if they generate insufficient profit to meet interest/lease payments.Footnote 54
But analysis of actual bankruptcy procedures suggests that in the absence of creditor concentration, the resulting process risks premature foreclosure and liquidation. Individual dispersed creditors, fearing preemptive action by other creditors, might face a prisoner's dilemma and, in a creditors’ race, opt for a Pareto-inferior uncoordinated response.Footnote 55 Premature liquidation may then depress asset values and hence shareholder-principals’ equity.Footnote 56 The Chapter 11 code aimed to give debtors temporary protection: Douglas Baird, Arturo Bris, and Ning Zhu trace its origins to efforts to save financially distressed railroads, where individual creditors could have liquidated particular sections of the track, thereby wrecking the system.Footnote 57
However, where creditors are dispersed and inexperienced, evidence suggests that the Chapter 11 procedure can delay inevitable liquidation, in the meantime causing assets unnecessarily to erode.Footnote 58 Eastern Airlines, one of the three biggest U.S. airlines in the mid-1980s, filed for Chapter 11 protection in 1989. The court neglected the dispersed creditors’ interests and extended the management's exclusive right to file a reorganization plan; a resolution was delayed for twenty months, until the business finally closed in 1991 under Chapter 7. In the end, it is estimated that $1.3 billion of stakeholder funds were consumed by losses under Chapter 11 protection.Footnote 59 Unsecured creditors received just 11.2 percent of their claims, equity holders nothing.
Such outcomes arising from dispersed ownership are made more likely by “free-rider” problems in the Chapter 11 bankruptcy process: an individual creditor entitled to only a minor proportion of the total claim may not invest in costly search, monitoring, legal, or bargaining activities if most of the benefit accrues to passive fellow creditors.Footnote 60
In the specific context of the airline industry, the concentration of creditor power in the hands of a dominant lessor can bring particular efficiencies when a debtor airline is financially distressed. Benmelech and Bergman emphasize the benefits of redeployability of collateral such as aircraft; they find for the airline industry that debt that is secured by more redeployable capital is associated with lower credit spreads, higher credit ratings, and higher loan-to-value ratios.Footnote 61 Their global dominance of the primary and secondary markets for aircraft enabled GE to take away aircraft from troubled carriers in the United States and redeploy them with more profitable carriers elsewhere.Footnote 62 This is particularly important in the airline industry because it is especially vulnerable to economy-wide or industry-wide shocks, leading both airline profits and aircraft values to decline.Footnote 63 The prices of assets in liquidation might fall below value in best use because some or all of the industry buyers also have trouble raising funds. Thus, as Andrei Shleifer and Robert Vishny conclude, “the institution of airline leasing seems to be designed partly to avoid fire sales of assets: airlines can stop their leasing contracts when they lose money rather than dump airplanes on the market which has no debt capacity.”Footnote 64 Leasing allows carriers to transfer some of the aircraft ownership risk to specialist operating lessors who might be better suited to assuming this risk through their deep knowledge of secondary markets and their economies of scale.Footnote 65 The analysis by Benmelech and Bergman implies that, in the absence of such intermediation, bankrupt airlines are likely to inflict negative externalities on non-bankrupt members of the industry, reducing the collateral value of their aircraft and thereby raising the cost of debt finance. GE's activities might therefore have resulted in industry-wide benefits not confined to the bankrupt airline.Footnote 66
Consequences of GE's Dominance in Successive Links of the Air Transport Supply Chain
The shaded area of Table 1 compares for the years from the millennium to the financial crash the profits earned at two stages in the chain of supply of airline transport: the airlines themselves and upstream suppliers— the segments of GE supplying, respectively, finance, chiefly through leasing (GECAS), and engines and associated services (Aviation).Footnote 67 The respective margins are graphed in Figure 1. There are definitional and coverage differences between the GE segments and the years, which means the data do not support very precise comparisons.Footnote 68 Nevertheless, certain strong patterns emerge that are highly unlikely to be the result just of definitional differences. Profit levels of the two GE divisions (or the segments to which they belong) and margins for Aviation are strongly positive throughout and show a relatively stable path with sustained growth in the years leading up to the financial crisis of 2007–2008. The aggregate net income of the airlines (and their margins), on the other hand, oscillate wildly; in most of those years income is negative, in several years massively so, and it cumulates to a substantial loss over the period from 2000 to 2008.
The juxtaposition of this remarkably stable growth of GE's profit from air industry operations alongside the volatility and the cumulative losses of the airlines in aggregate suggests a partial answer to the question, “Why can't we make money in aviation?” Some parts of the supply chain were indeed making money from air travel. GE's businesses supplying airlines enjoyed substantial profit while many of its customers suffered financial distress.
Figure 4 provides evidence on the experience of the final consumer in this supply chain—the fares paid by the airline passengers and the choice of flights available. The fares are the average “all in” figures, in 2017 dollars. The choice of flights is represented by the number of departures available to them. Between 2000 and the crash, the average fare fell sharply. Meanwhile, consumer choice—reflected in the number of departures—expanded significantly. These patterns are consistent with vigorous competition among the distressed airlines, whose survival while making losses was underpinned by their profitable supplier, GE. We return to the question of market structure at different points in the supply chain for air transport, and implications for allocative efficiency, after reviewing the major shifts in the market power of airlines as well as of GE after 2008.
Passenger enplanements, flight departures, and passenger fares. (Source: A4A, “Data & Statistics,” accessed 12 Sep. 2022, http://airlines.org.)

GE and the Airline Industry after 2008
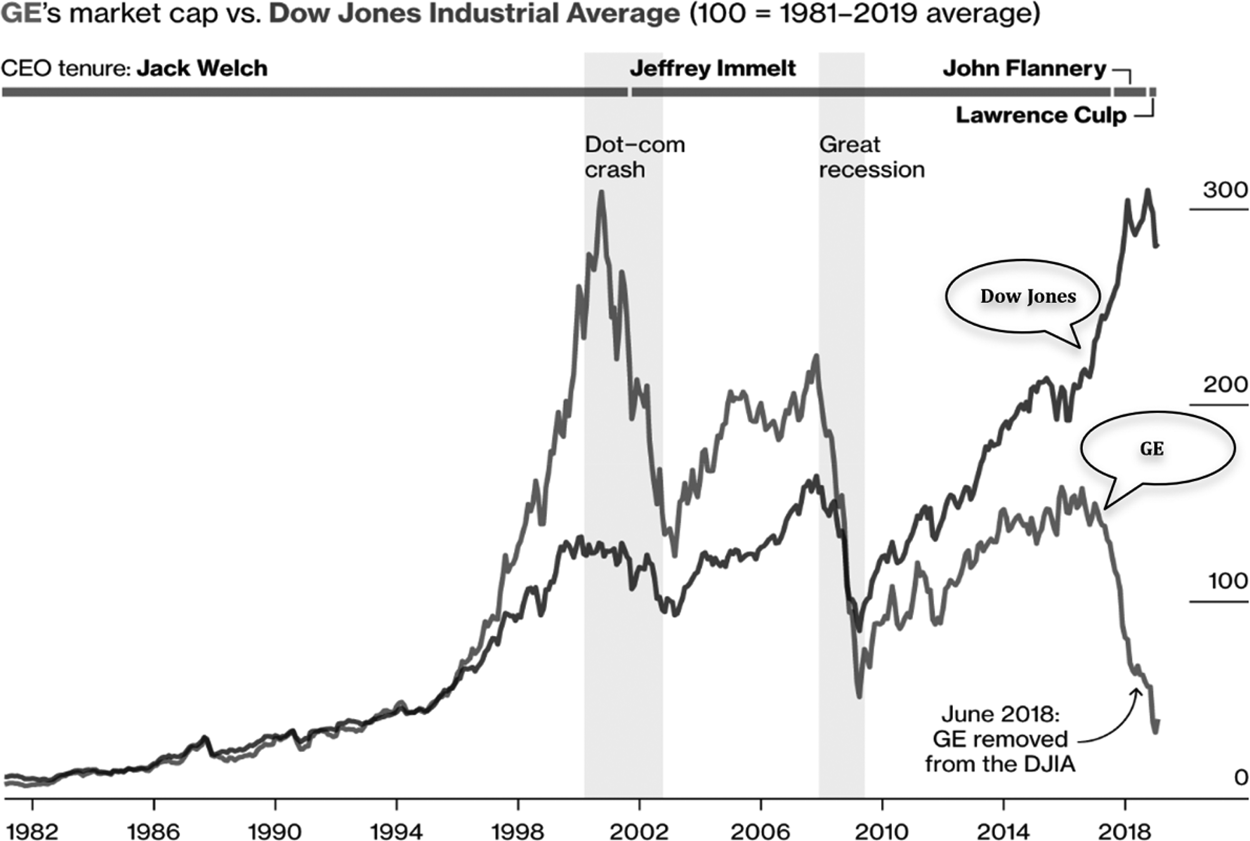
GE. The “Great Financial Crisis” (GFC) culminating in October 2008 undermined a central pillar of GE's business model vis-à-vis the airlines: its privileged access to finance on the most favorable terms. Like the landmark casualties of the GFC—Lehman Brothers and Northern Rock—GE relied heavily on short-term debt to fund its activities. In October 2008 the commercial paper market froze, resulting in cash flow insolvency for GE Capital.Footnote 69 Its cost of capital rose sharply. The price of credit default swaps—lenders’ insurance—on its bonds had risen to levels appropriate for junk bond status rather than triple A.Footnote 70 And the price of GE's stock plummeted; to avert collapse, it resorted to an emergency stock sale: $15 billion of common stock at about $22, and $3 billion to Warren Buffett's Berkshire Hathaway (by comparison, in the previous year GE had been buying its own stock at prices exceeding $30). Bennett explains that GE only avoided failure because of $139 billion in loan guarantees from the federal government.Footnote 71 This was a role reversal for GE, from rescuer of distressed companies to distressed supplicant for emergency funding. The share price performance of GE speaks for itself (Figure 5).
GE's market capitalization vs. Dow Jones Industrial Average.
Note: Data as of Jan. 23, 2019. (Source: Bloomberg data and reporting.)
As explained above, under Welch, GE Capital had developed a portfolio of financial businesses apart from aircraft leasing and consequently benefited from a period when the financial sector grew faster than the overall U.S. economy. Welch's successor as CEO, Jeffrey Immelt, continued with this expansion into finance, adding credit card companies, subprime lenders, and commercial real estate.Footnote 72 Earnings from capital finance rose from 28 percent of GE's total of approximately $6 billion in 1993 to 55 percent of its total earnings of about $22 billion in 2007.Footnote 73
But in the wake of the GFC, Immelt disposed of much of GE Capital and tried to shed the Wall Street perception that GE was “more akin to a major bank than a major manufacturer.”Footnote 74 However, when GE sold off most of its financial businesses it retained a stake in GECAS, the airline leasing business, but not in the other main leasing activities unconnected to their manufacturing.Footnote 75 And it is clear from Table 1 that GECAS continued to be profitable after 2008, although the growth rates in the lease portfolio, or of profits, seen over the period 2000–2008 were no longer evident in 2009–2017 (separate profits data have not been published for the latest years).
The loss of competitive advantage in finance inevitably weakened GE's relative position in the leasing market, the major source of funding for aircraft purchase, and, as Figure 3 shows, the GECAS lease portfolio did not continue to grow from around 2011. Other things equal, this will have moderated its monopsonistic power vis-à-vis aircraft manufacturers, and it will have diminished the force of the “buy GE” policy. Nevertheless, GE still enjoyed the benefits of entry barriers as a result of its intellectual property in engine design and manufacture, as well as a long-lasting protected market for spares for the engines it had already sold. GE's other disparate financial businesses can be accorded a major role not only in the conglomerate's rapid profits growth around the millennium but also with its profits setback after the crash (GE Capital actually posted a large loss in 2017, connected to its insurance activities).Footnote 76 But GECAS continued to be profitable, and it was much more closely aligned to GE's renewed focus on core industrial activities. GECAS enjoyed a symbiotic relationship with a core manufacturing component of GE: Aviation has been GE's most profitable division recently— in 2017 it contributed $6.6 billion of GE's $14.7 billion total profit from its industrial segments.
The airline industry. GE's time of maximum financial weakness in 2008 coincided with acute financial difficulties for much of the airline industry. The losses of two airlines—Delta (which in 2005 had staved off liquidation thanks to a rescue package from GE) and Northwest—summed to $10.5 billion in the first quarter of 2008.Footnote 77 Their response represents a return to the more traditional pattern preceding GE's dominance: a merger, to form the world's largest airline, with 20 percent of the domestic market.Footnote 78
Then, in 2010, following combined losses in the preceding two years of some $6 billion, United merged with Continental, giving the merged entity 21 percent of the domestic market.Footnote 79 Part of the rationale was to cut out spare capacity, eliminating flights where the two airlines had been competing, and, with fewer seats, to secure higher fares. The New York Times commented that “in the last decade [since 2007] fares have declined … even with the steep cuts made in the last two years, airlines are still losing money, with too many seats chasing too few passengers.”Footnote 80
In 2013, American Airlines came out of bankruptcy protection and merged with US Airways, which had itself accumulated losses of some $2.7 billion from 2001 to 2008.Footnote 81 A fourth significant merger in the industry, between Southwest and Airtran in 2010, was not associated with financial distress. Southwest had long been an outlier in the industry with its disruptive low-cost model that had led to positive profits for forty consecutive years.Footnote 82
The four mergers together resulted in an oligopoly within the domestic U.S. industry controlling more than 80 percent of domestic capacity, and these leaders enjoying monopoly positions in many local hubs.Footnote 83
So, after the period of widespread dependency on GE ended in the crash of 2008, the airline industry reverted to a more familiar response to financial pressures: consolidation. As well as reallocating control between management teams, merger enabled firms to eliminate excess capacity without the costs of liquidations; and eliminating competitors made it easier to secure the higher margins shown in Figure 1. These higher margins were associated with rises in fares and reductions in capacity: departures were reduced even as passenger numbers (“enplanements”) increased (see Figure 4).
Concluding Comments
Generalizability. Is the case we have discussed idiosyncratic? Could it occur in any other industry or time? We have identified several characteristics of the case that contribute to the “perverse” result of survival without profits.
First, the typical contract involved tying more than one product: an aircraft with a GE engine, finance in the form of a GE lease, and after-sales spare parts from GE. This is not a unique arrangement. In another business-to-business sector, for example, Xerox supplies its own machines, service, and spares for years after the purchase, plus lease finance, all tied into one contract.Footnote 84
Second, GE enjoyed an oligopolistic position in the aircraft engine market, with high entry barriers, and monopsonistic power in the finance market, where it enjoyed a rare AAA rating. An analogous example of multiple interlinked sources of market power is offered by Facebook. Its first-mover network advantage gave it monopsony power when “buying” information from users (i.e., users trading their information in exchange for access to the platform). Its monopoly of that information gave it market dominance when (in effect) selling the information to advertisers. Its economic rents from that monopoly then enabled it to dominate its sector of the market for corporate control, paying inflated prices to buy firms that challenged its dominance (e.g., Instagram and WhatsApp), as well as funding lobbying to protect its business model from regulation that might threaten profits.Footnote 85
Third, GE's trading partner, the airline industry, was very competitive and contestable, with low entry barriers including relatively low minimum efficient scale. The customers held little countervailing power and endured very weak profitability. An analogy is offered by businesses like Uber, which contracts with huge numbers of individual drivers.
Linked to the second and third features is an imbalance of scale. The capital goods supplied by GE (aircraft with GE engines) represent a huge component of its customer's balance sheet, and the corresponding lease a huge component of its funding. Losing the asset and associated finance can therefore be a matter of life or death for the business. (In the case of aircraft, this was compounded by unusual legal arrangements giving the lessor overriding priority in case of bankruptcy.) A counterpart of this fourth feature is perhaps offered by the real estate industry - a landlord with many properties leasing from its broad portfolio a large store to a lessee for whom this is the single site on which it depends.
A fifth feature beneficial to GE was the fungibility of the product. In contrast to capital assets such as a power plant or an oil well, the leased aircraft could be repossessed and redeployed rapidly to another customer anywhere in the world. There are parallels in the supply of standardized business machines by firms such as Xerox (see above).
A sixth feature favorable to the GE model was having some joint-stock corporations as customers, run by salaried managers whose interests did not necessarily align with those of their owners. In some circumstances, executives benefited from a loss-making airline continuing to trade when closure would have been in the owners’ interests. Such examples of conflicted executives are not limited to the airline industry.
Our conclusion, therefore, is that no individual component of the GE model was unique, but that the conjunction of so many of the components is likely to be very rare. Nevertheless, it is possible to imagine a subset of the components yielding a similar pattern of benefits to the supplier along with wealth destruction for the customer's shareholders, even if not on the scale we have documented for GE.
Efficiency. In relation to allocative efficiency, GE played a major role at two stages in the supply chain for air travel: the upstream supply of aircraft engines and aircraft finance to airlines, and the downstream supply of transport to passengers. The paradigm traditionally favored by regulators for allocative efficiency is a competitive market where multiple suppliers cannot individually influence price. In the 2000–2008 episode that we analyze, GE tied financial support and lease contracts to orders for GE engines, strengthening its monopolistic power in the aircraft engine market; this weakened competition, with adverse price and choice consequences for airlines. However, at the other end of the supply chain for air travel, GE's financial support kept in business airlines that would probably otherwise have failed, and this preserved a competitive structure in the market for air travel. Fares declined and choice of flights expanded. Passengers gained, while most airlines made losses.
Whereas in the traditional industrial organization model atomized markets with many agents are associated with allocative efficiency, in bankruptcy resolution the literatures in law and economics emphasize the inefficiencies that can arise when creditors are many and uncoordinated (and inexperienced in bankruptcy). In a debtor-oriented regime such as that of the United States, the Eastern Airlines case illustrates the way that Chapter 11 can work against the interests of dispersed creditors (and shareholders). In a creditor-oriented regime such as the United Kingdom's, a prisoner's dilemma confronting uncoordinated creditors can result in unnecessary costly liquidation of a viable business. By contrast, the concentration of power in the hands of a single experienced and wealthy creditor, GE, could avoid premature or unnecessary liquidation and permit efficient redeployment and reorganization. In our period, the benefits of this seem to have accrued to GE, not to holders of equity in airlines.
In this period up to the financial crash, no U.S. business enjoyed a lower cost of capital than GE. But most airlines, with their weak and volatile profits record, were much less attractive to financial markets. This asymmetry allowed GE to act as an efficient financial intermediary. The gains appear mostly to have accrued to GE. Up to 2008, GE benefited financially from its diversification into the financial sector, which was earning higher returns than its traditional manufacturing activities. After the crash, the situation reversed, and GE has sold most of its financial businesses—the exception being GECAS, which operates symbiotically with GE's manufacturing activities.Footnote 86
The sequel. The balance of power between GE and U.S. airlines changed significantly in the decade following the 2008 crash. GE's financial strength has been vastly diminished, limiting its roles in financial intermediation and managing insolvency. And these roles have become less important for airlines: they have merged into an oligopoly capable of cutting capacity and raising fares for passengers, as well as enjoying greater countervailing power in relation to their suppliers of engines and finance. Between the financial crash and the COVID-19 crisis, airline profits recovered. In the decade after the crash, even Warren Buffett invested $10 billion in airlines.Footnote 87
Supplementary material
The supplementary material for this article can be found at https://doi.org/10.1017/S0007680521000465


 Open access