





Introduction
Democratic accountability is a core function of democratic systems. Citizens are expected to regularly check the government’s performance, prevent rent extraction, and ensure that elected officials represent the will of the people (Fearon Reference Fearon2011; Svolik Reference Svolik2013). To do so, voters need to collect information about the government’s performance, compare the observations with prior expectations, evaluate responsibility, and ultimately decide whether to reward or punish incumbents. This process, however, is not straightforward. Accurate responsibility attribution requires a considerable degree of political sophistication (Gomez and Wilson Reference Gomez and Wilson2001), a sufficiently long time horizon (Healy and Malhotra Reference Healy and Malhotra2009), emotional stability (Malhotra and Kuo Reference Malhotra and Kuo2009), and, of course, the ability to recall past performance.
The abovementioned accountability process becomes more complex in the contemporary globalized era. Nowadays, the national economy is increasingly tied to the stability of global supply chains (Hayes, Imai and Shelton Reference Hayes, Imai and Shelton2015) and decisions made by international organizations (Alcañiz and Hellwig Reference Alcañiz and Hellwig2011). The global economic disruptions triggered by the Covid-19 pandemic since early 2020 served as one of the most salient examples. All politics is local, but the causes of economic hardship often is not. When the national economy is in trouble, globalization creates political opportunities for incumbents to attribute responsibility to external actors rather than to domestic policy choices. This blame-shifting strategy has been documented in both democratic (Bellucci Reference Bellucci2014; Sommer Reference Sommer2020) and undemocratic regimes (Rozenas and Stukal Reference Rozenas and Stukal2019). Regardless of regime type, rulers facing economic downturns have strong incentives to identify external scapegoats to deflect domestic accountability.
Literature on blame attribution and elite cues has found strong evidence of motivated reasoning (Taber and Lodge Reference Taber and Lodge2006) at the domestic level, especially through studying cases such as Hurricane Katrina. Voters tend to attribute poor governance or policy failures in ways that align with their partisanship (Arceneaux Reference Arceneaux2008; Malhotra Reference Malhotra2008; Malhotra and Kuo Reference Malhotra and Kuo2009; Tilley and Hobolt Reference Tilley and Hobolt2011). This tendency is further shaped by political sophistication and political knowledge, which condition how citizens process responsibility and evaluate performance (Gomez and Wilson Reference Gomez and Wilson2008).
When incumbents attempt to shift blame to domestic political opponents, co-partisan voters often follow elite cues and update their evaluations accordingly (Healy, Kuo and Malhotra Reference Healy, Kuo and Malhotra2014). Opposition partisans, by contrast, may backfire and blame the ruling party even more (e.g., Nyhan and Reifler Reference Nyhan and Reifler2010; Porumbescu, Moynihan, Anastasopoulos et al. Reference Porumbescu, Moynihan, Anastasopoulos and Olsen2022; Schlipphak, Meiners, Treib et al. Reference Schlipphak, Meiners, Treib and Schäfer2022). At the domestic level, such blame attribution constitutes a rational strategy for vote-maximizing parties operating within the electoral system.
An important unresolved question, however, is whether blame-shifting strategies extend beyond domestic political competition to external actors. Existing literature offers mixed and largely indirect evidence regarding incumbents’ ability to redirect blame toward external actors. For example, Hobolt, Tilley and Wittrock (Reference Hobolt, Tilley and Wittrock2013) conducted a survey experiment and showed that the information provided by the European Union officials failed to alter the blame attribution among British voters. In Latin America, Alcañiz and Hellwig (Reference Alcañiz and Hellwig2011) show that whether voters blame the international organization depends heavily on the relationship and history between their own country and the international organization, while the partisan effect alone is insignificant (see their Table 3) or contingent (see their Table 4). In the US context, priming respondents to think more about the international economy does not change their blame attribution on average (Hellwig, Ringsmuth and Freeman Reference Hellwig, Ringsmuth and Freeman2008). Meanwhile, political elites nowadays may have a higher incentive to exercise external blame-shifting because of the increasing level of globalization.
Most importantly, existing literature does not examine directly whether elite cues can successfully transfer the blame away from domestic incumbents to external actors (foreign elites, international organizations, or the global economy). As a result, it remains unclear whether blame-shifting across borders represents a genuine redistribution of responsibility or merely a domestic partisan response.
Beyond attribution itself, external blame narratives may also carry broader implications for democratic legitimacy. When incumbents repeatedly attribute policy failures to actors beyond national borders, they implicitly signal limits to the capacity of democratic institutions to address pressing social and economic problems. Such narratives may therefore weaken citizens’ beliefs in democracy as an effective system of governance. Yet existing research has paid little attention to the downstream consequences of blame-shifting for democratic beliefs, particularly in the context of globalization.
This article aims to address these two questions together through the theory of asymmetric blame-shifting and two survey experiments. Specifically, this article argues that elite blame-shifting cues operate asymmetrically: they influence citizens’ evaluations of domestic political actors but do not meaningfully alter blame attribution toward external actors. In this sense, blame-shifting is not a true ‘shift’ of responsibility. Meanwhile, since it is not a transfer of responsibility, people may feel powerless and dissatisfied with this asymmetrical attribution of blame, ultimately reducing their belief in democracy. Section Asymmetric blame-shifting, negative partisanship, and democratic beliefs will further elaborate the psychological mechanisms and rationales behind these two research questions; Section Context: Biden, inflation, and external blame in 2022 will provide the detail of the political context used in the two survey experiments; Sections Study 1: examining asymmetric blame attribution (H1, H2, H3, and H4) and Study 2: the negative impact of asymmetric blame attribution (H1, H2, H3, H4, and H5) will provide the empirical analysis for Study 1 and Study 2, respectively; and Section Conclusion will discuss the results and implications.
Asymmetric blame-shifting, negative partisanship, and democratic beliefs
Political responsibility attribution is neither automatic nor costless. Information processing is cognitively demanding and largely goal oriented. Citizens are motivated to acquire and evaluate political information when it bears consequences for political participation, particularly when attribution enables them to reward or punish political actors (Lupia Reference Lupia2016). Elite cues can reduce these cognitive costs by offering shortcuts for responsibility assignment (Lupia Reference Lupia1994).
However, such cues are most effective when the attributed actors are subject to democratic control because it serves the function of goal-orientation. Voters can sanction domestic incumbents through elections; they lack direct means to influence external actors such as foreign governments or international organizations. As a result, elite attempts to shift blame from domestic incumbents to external factors alter the informational environment without providing voters any actionable implications. Consequently, voters may update their evaluations of domestic political actors while leaving their blame attribution toward external actors largely unchanged. It is what we call asymmetric blame-shifting.
This asymmetrical feature would be further enforced by the increasing negative partisanship in recent decades. Negative partisanship motivates citizens to interpret political information defensively and to resist elite explanations that would absolve disliked incumbents. As a result, opposition partisans are inclined to reject incumbent justifications and may even intensify blame toward governing elites when confronted with blame-shifting narratives (Iyengar, Lelkes, Levendusky et al. Reference Iyengar, Lelkes, Levendusky, Malhotra and Westwood2019). Even when incumbents attempt to externalize blame, opposition partisans are more likely to respond by increasing blame toward domestic political leaders rather than redirecting responsibility to external actors. This dynamic reinforces an asymmetric pattern of blame attribution in which partisan polarization intensifies at the domestic level while evaluations of external actors remain comparatively stable.
Besides, attributions toward external actors are often shaped by longstanding historical experiences and issue-specific schemas rather than by short-term elite rhetoric. Prior research shows that attitudes toward international organizations and foreign governments depend on historical relationships and issue domains (Alcañiz and Hellwig Reference Alcañiz and Hellwig2011; Heinkelmann-Wild and Zangl Reference Heinkelmann-Wild and Zangl2020). These beliefs are relatively stable and less responsive to momentary elite cues, further reinforcing the asymmetry between domestic and external blame attribution.
A recent panel study during the Covid-19 pandemic reflects such an asymmetric tendency. Graham and Singh (Reference Graham and Singh2022) implemented six panel surveys in the United States right after the outbreak of Covid-19 in early 2020. In their Figure 2, the blame attribution toward Trump for the Covid-19 outbreak was quickly polarized along with the partisan lines between March and April 2020. During this period, Trump openly blamed China and the Chinese people with the term ‘Chinese virus.’Footnote 1 Given the increasingly polarized blame toward Trump within two months, both Democrats and Republicans did not change their level of blame statistically toward China, immigrants, luck, or nature during the same period; a certain amount of blame seems to appear or disappear at the domestic level but not the international or natural ones.
In the end, asymmetric blame attribution also carries important implications for democratic beliefs. If the abovementioned asymmetric blame attribution is true, given the context of globalization and motivated reasoning, this tendency seems to offer a blank check for any incumbent – all they need to do is to attribute anything to the external actor. In such a scenario, voters may respond to the incumbent’s blame-shifting excuse accordingly, but they may also realize that they cannot hold the external actor accountable. In short, democratic accountability – the foundation of liberal democracy – does not function well in the democracy voters live in. As a result, voters would lower their overall belief in democracy because it is not able to solve the problems people were facing.
Since the globalization of capital and the labor force, Lasch (Reference Lasch1996) has argued that economic and technical elites, such as financial managers and computer engineers, may exploit the global system and always migrate across the borders; any government can hardly enforce taxing or even laws on them, and they also express low interest in any domestic affairs. Governments are incapable of dealing with the economic consequences of capital globalization, such as offshoring, unemployment, and tax evasion. Consequently, domestic workers have thought that their voice was not heard, and they were not represented by the established parties who only cared about symbolic issues (Hochschild Reference Hochschild2018). As a result, they turned to support populist politicians who oppose globalization and try to overturn the established democratic system (Fukuyama Reference Fukuyama2018; Norris and Inglehart Reference Norris and Inglehart2019).
The elite’s blame attribution toward external actors, theorized in this article, may add one more mechanism within the negative effect of globalization on democracies. In the aforementioned examples, democratic governments play a passive role in globalization – they lack the authority and capacity to regulate the flow of capital and labor. In the case of the elite’s blame attribution in this article, however, political elites are motivated to accuse the external actor so as to shift away from their own responsibility. Even though their co-partisans may accept the excuse, this excuse also implies that their government lacks the capacity to change the outcome, even though their incumbent had been elected and exercised its power. In other words, the elite’s blame attribution toward external actors may make people believe that their current regime is useless and, thus, lowers their trust toward the existing democratic regime.
When incumbents repeatedly attribute policy failures to external actors, they implicitly acknowledge the limits of democratic governance in addressing economic and social challenges. Even when voters accept such explanations, they may simultaneously recognize that external actors cannot be held accountable through democratic means. This recognition undermines the perceived efficacy of democratic institutions. If elected governments lack both responsibility and capacity, democracy itself may appear incapable of delivering meaningful solutions. In this sense, elite blame-shifting does not merely reshape responsibility attribution; it may erode citizens’ trust in democracy as a system of governance.
Building on the theoretical arguments above, this article advances a set of hypotheses regarding asymmetric blame attribution and its consequences for democratic beliefs:
H1: Exposure to elite blame-shifting cues will lead supporters of the ruling party to attribute less blame to the ruling party.
H2: Exposure to elite blame-shifting cues will lead supporters of the opposition party to attribute more blame to the ruling party.
H3: Exposure to elite blame-shifting cues will not change supporters of the ruling party’s level of blame toward the external actor.
H4: Exposure to elite blame-shifting cues will not change supporters of the opposition party’s level of blame toward the external actor.
H5: Exposure to elite blame-shifting cues will reduce voters’ trust in democracy.
Context: Biden, inflation, and external blame in 2022
To examine the asymmetric blame-shifting hypotheses, this article draws on a real-world political context in which an incumbent leader explicitly attributed economic hardship to an external actor. During the 2022 US midterm elections, President Joe Biden repeatedly attributed rising gasoline prices and inflationary pressures to Russian President Vladimir Putin following Russia’s invasion of Ukraine in March 2022. As energy prices surged and inflation intensified, economic conditions quickly emerged as one of the most salient political issues confronting American voters. A representative poll shows that ‘…57%, including 63% of independents, said Biden’s policies have made the economy weaker…’ (Montanaro Reference Montanaro2022, italics in original). The political salience of inflation persisted well beyond the initial shock of the invasion. One year after the invasion, gas prices and inflation remain the most important issues among the US public in a YouGov poll.
Facing mounting electoral pressure, President Biden publicly linked domestic economic outcomes to external forces. In a March 2022 speech, he declared that he would ‘… do everything I can to minimize Putin’s price hike here at home,’ a framing that he continued to employ throughout the midterm campaign (Talev Reference Talev2022).
This Biden–Putin blame attribution provides a particularly suitable context for examining asymmetric blame-shifting for three reasons. First, inflation was highly salient during the 2022 midterm elections, intensifying incentives for the incumbent party to deflect responsibility while simultaneously motivating partisan voters to respond. Second, inflation represents a complex economic outcome that is only indirectly connected to the Russia–Ukraine conflict. Because inflation affects nearly all citizens and lacks a clear causal chain, voters are especially likely to rely on elite cues as cognitive shortcuts when assigning responsibility. Third, the episode unfolded within an intensely polarized partisan environment. Strong negative partisan motivations among both Democrats and Republicans heightened the likelihood that blame-shifting cues would trigger divergent partisan reactions.
To sum up, the Biden–Putin case constitutes a most-likely scenario for detecting the blame-shifting effect and for testing the asymmetric blame-shifting hypothesis. To evaluate the proposed five hypotheses, this article reports results from two pre-registered survey experiments conducted in November 2022 and August 2023. Study 1 focuses on the asymmetric dynamics of blame attribution toward domestic and external actors, while Study 2 replicates the core findings and further examines the downstream consequences of external blame narratives for democratic beliefs.
Study 1: Examining asymmetric blame attribution (H1, H2, H3, and H4)
Research design
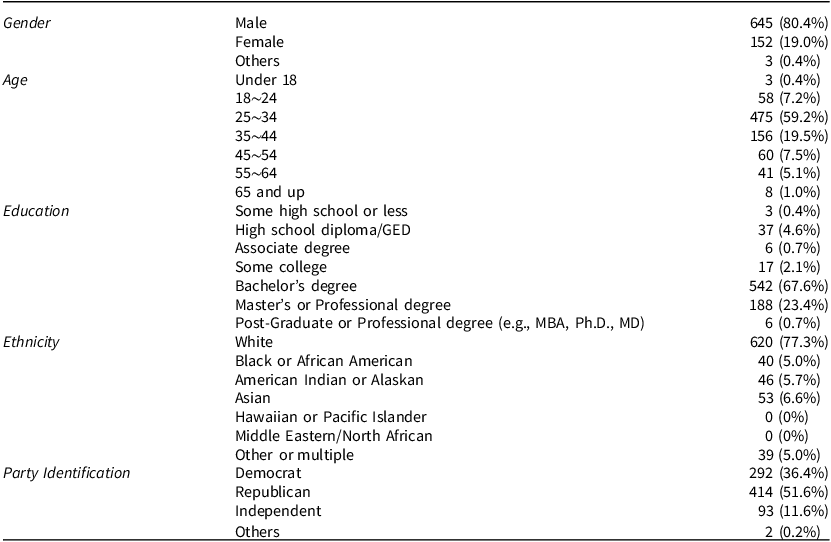
On November 27, 2022, 831 respondents were recruited through the Amazon MTurk web service (MTurk hereafter), and 802 completed the survey (96.5%). Respondents are over 18 years old, located in the US, and have a 90% or above Human Intelligence Task (HIT) approval rate. Respondents were invited to take a survey titled ‘A Brief Survey About News, Society, and Politics’ and were compensated with $1 after completion. The research design was approved by the author’s institution (#UNLV-2022-562) and was also pre-registered by Open Science Foundation (https://osf.io/pcwsg/) before the data collection. The sociodemographic background of the MTurk respondents can be found in Table 1.
Background of the MTurk respondents in Study 1 (n = 802)

Table 1. Long description
The table presents the background of 802 MTurk respondents in Study 1. It includes data on gender, age, education, ethnicity, and party identification. The table has 12 rows and 5 columns. The columns are labeled Gender, Age, Education, Ethnicity, and Party Identification. The gender distribution is 645 males (80.4%), 152 females (19.0%), and 3 others (0.4%). Age groups are under 18 (3 respondents, 0.4%), 18-24 (58 respondents, 7.2%), 25-34 (475 respondents, 59.2%), 35-44 (156 respondents, 19.5%), 45-54 (60 respondents, 7.5%), 55-64 (41 respondents, 5.1%), and 65 and up (8 respondents, 1.0%). Education levels include some high school or less (3 respondents, 0.4%), high school diploma/GED (37 respondents, 4.6%), associate degree (6 respondents, 0.7%), some college (17 respondents, 2.1%), bachelor’s degree (542 respondents, 67.6%), master’s or professional degree (188 respondents, 23.4%), and post-graduate or professional degree (6 respondents, 0.7%). Ethnicity is categorized as White (620 respondents, 77.3%), Black or African American (40 respondents, 5.0%), American Indian or Alaskan (46 respondents, 5.7%), Asian (53 respondents, 6.6%), Hawaiian or Pacific Islander (0 respondents, 0%), Middle Eastern/North African (0 respondents, 0%), and other or multiple (39 respondents, 5.0%). Party identification includes Democrat (292 respondents, 36.4%), Republican (414 respondents, 51.6%), Independent (93 respondents, 11.6%), and others (2 respondents, 0.2%).
Although MTurk samples are not nationally representative, a substantial body of research suggests that survey experiments conducted on MTurk produce treatment effects that are generally consistent in direction with those obtained from probability-based samples. Prior studies show that while MTurk respondents may differ from the general population in baseline attitudes, their psychological and political responses to experimental stimuli closely mirror those observed in representative surveys (Berinsky, Huber and Lenz Reference Berinsky, Huber and Lenz2012; Coppock Reference Coppock2019).
Because the primary objective of this study is to identify causal relationships rather than to estimate population parameters, internal validity is of greater importance than sample representativeness. Meanwhile, we admit that the skewed MTurk population may bias the estimation of the population treatment effect, which we will elaborate on in the final section.
In addition, both survey experiments reported in this article were conducted prior to the widespread public adoption of generative artificial intelligence tools such as ChatGPT. As a result, the likelihood that respondents relied on AI assistance to complete the survey is minimal, further reducing concerns about automated or non-human responses.
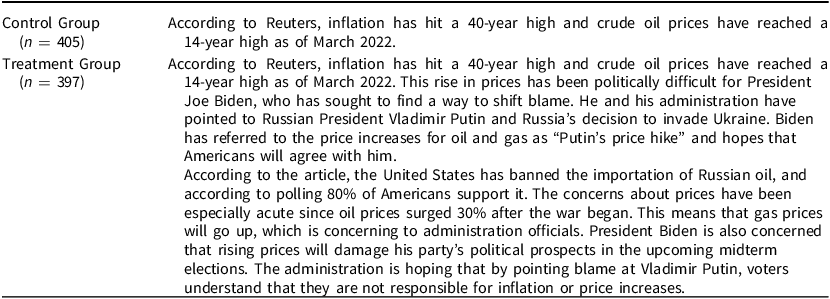
All 802 respondents were first asked questions about political interest and information consumption. Afterward, 405 (50.5%) respondents were assigned to the Control Group, and 397 (45.5%) were assigned to the Treatment Group. In the Control Group, it was mentioned to the respondents that inflation had hit a 40-year high (‘According to Reuters, inflation has hit a 40-year high and crude oil prices have reached a 14-year high as of March 2022.’). In the Treatment Group, respondents were not only told that inflation is high but also how the Biden administration accused Putin of causing this (‘…This rise in prices has been politically difficult for President Joe Biden, who has sought to find a way to shift blame. He and his administration have pointed to Russian President Vladimir Putin and Russia’s decision to invade Ukraine. Biden has referred to the price increases for oil and gas as ‘Putin’s price hike’ and hopes that Americans will agree with him….’ for the full text, see Appendix Table A1.). The wording is phrased from multiple news coverages to briefly explain Biden’s rationale for the blame-shifting.
After reading the message, all respondents were asked how much they blamed Biden and Putin for the inflation, respectively. Existing literature does not reach a consensus on how to measure blame attribution. Some articles ask the respondent to pick one target from a list of potential candidates (Gomez and Wilson Reference Gomez and Wilson2001; Rudolph Reference Rudolph2003), while others require respondents to estimate the level of responsibility on the graded responsibility scale, respectively (Alcañiz and Hellwig Reference Alcañiz and Hellwig2011; Healy, Kuo and Malhotra Reference Healy, Kuo and Malhotra2014). To directly test the asymmetric blame-shifting hypothesis, this study adopts the latter approach and measures blame attribution toward domestic (Biden) and external actors (Putin) separately. After reading the message, all respondents were asked, ‘Do you blame the US President Biden for the inflation?’ and ‘Do you blame the Russia President Putin for the inflation?’ (Agree strongly (+2), Agree (+1), Neither agree nor disagree (0), Disagree (−1) Disagree strongly (−2)).
In the Treatment Group, a manipulation check is used to verify whether MTurk respondents really read the message. Right after evaluating Putin and Biden, they were asked about a poll number in the message, and the question was put on the same page as the message. Among the 397 respondents in the Treatment Group, 272 (68.5%) passed the manipulation check. Those who answered incorrectly were removed from further analysis.Footnote 2
Following the experimental measures, respondents completed additional questions related to protest behavior and perceptions of inequality, which fall outside the scope of this article. At the conclusion of the survey, respondents reported their party identification and sociodemographic characteristics before being debriefed and compensated.
The randomization check is further used to examine whether the respondents in the Treatment Group (n = 272) and Control Group (n = 405) share a similar sociodemographic background. Fortunately, the Treatment and Control Groups have the indistinguishable distributions on the level of education (Two-group t-test, P = 0.29), gender (Two-group t-test, P = 0.68), age (Two-group t-test, P = 0.86), race (measured by the percentage of self-reported White respondents, Chi-squared test, P = 0.93), and partisanship (measured by Republican, Democrat, and Others, Chi-squared test, P = 0.27). Overall, the Treatment Group and Control Group share a similar sociodemographic as well as political background. In other words, dropping respondents who did not answer the manipulation check correctly (post-treatment) did not undermine the random assignment process. In addition, Independents and other party identifiers are further removed from the analysis (95, 11.8%) because they are irrelevant to the hypothesis testing.
Result of Study 1: H1 and H2
On average, Biden’s excuse failed to lower people’s blame on him for the inflation. The Two-group t-test shows no difference in the level of blame between the Control Group and Treatment Group (0.637 and 0.665 in the −2 to +2 scale, respectively. Two-group t-test P = 0.782).
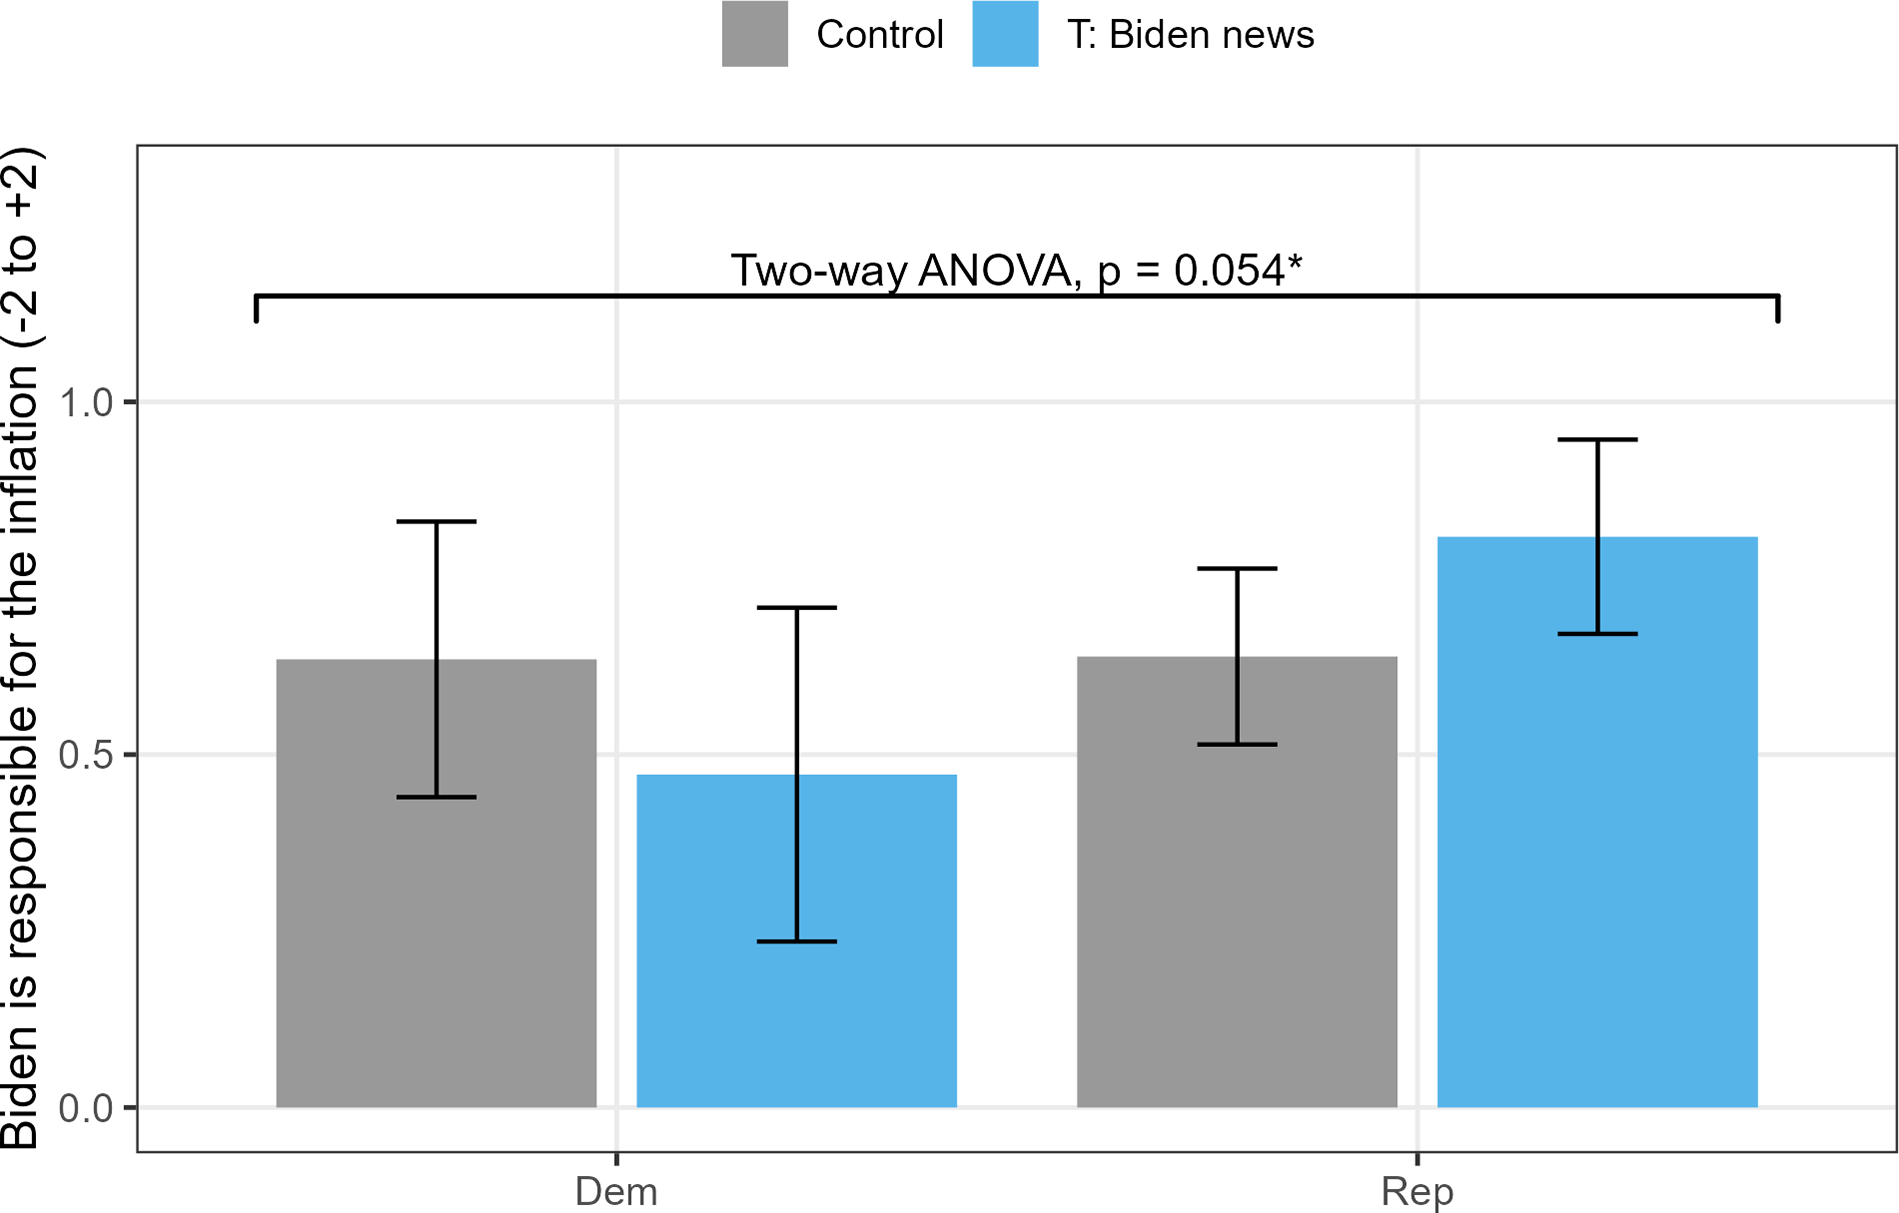
However, this seemingly null result is driven by two partisan effects canceling each other out. Figure 1 shows the distribution between the Treatment Group and Control Group by the partisanship of the respondents. When Democrat and Republican MTurkers were assigned to read Biden’s excuse, their blame attributions toward Biden were polarized: Democrats who read Biden’s excuse tended to lower their blame attribution toward Biden (from 0.64 to 0.47, Two-group t-test P = 0.29), while Republicans blamed Biden even more (from 0.64 to 0.81, Two-group t-test, P = 0.07). The two-way ANOVA test yields a significant effect in both the partisanship (P = 0.09) and the interaction between partisanship and the treatment (P = 0.054).
Elite cue and polarized blame-shifting on domestic politics, Study 1 (n = 802).

Figure 1. Long description
The bar graph compares responsibility attribution for inflation between two groups, Democrats and Republicans, under control and Biden news conditions. The x-axis represents political affiliation, with categories for Democrats and Republicans. The y-axis measures the level of responsibility attributed to Biden, ranging from negative 2 to positive 2. There are four bars in total, two for each political affiliation. The bars for Democrats show a higher level of responsibility under the control condition compared to the Biden news condition. Conversely, the bars for Republicans show a higher level of responsibility under the Biden news condition compared to the control condition. The graph includes error bars indicating the variability of the data. A two-way ANOVA test result with a p-value of 0.054 is annotated above the bars, suggesting a marginal statistical significance. The color scheme uses gray for the control condition and blue for the Biden news condition.
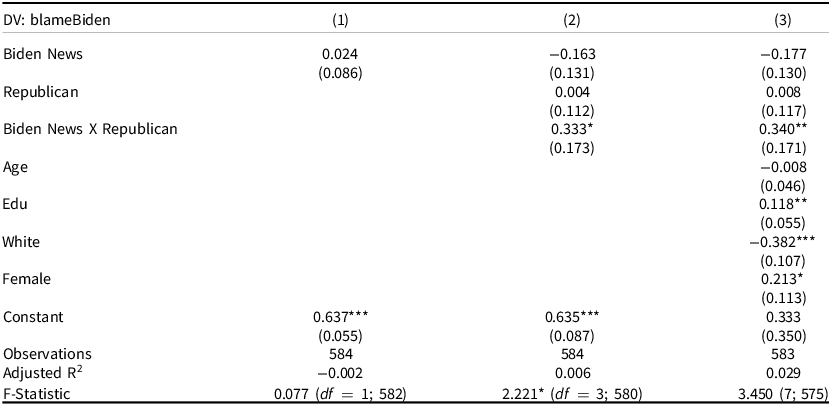
Regression analysis is further used to estimate the treatment effect across the partisans, as is shown in Table 2. In this table, Model 1 shows that treatment alone fails to change how people attribute the blame on average. Nevertheless, the interaction between partisanship and treatment shows a significant interaction effect in Model 2. The significantly positive interaction effect indicates that the treatment makes Republicans raise their blame attribution toward Biden. The effect size remains the same after other socio-demographic variables are controlled in Model 3.
Regression models of blame attribution on domestic politics
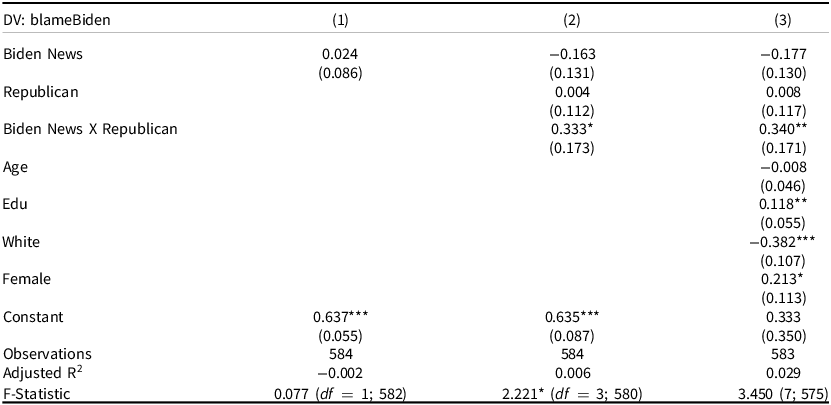
Table 2. Long description
The table presents regression models of blame attribution on domestic politics, focusing on the dependent variable blameBiden. It includes three models with various independent variables such as Biden News, Republican, Biden News X Republican, Age, Edu, White, and Female. Each model shows coefficients and standard errors for these variables. The table also includes observations, adjusted R-squared values, and F-statistics for each model. Notable trends include the significant positive coefficient for Biden News X Republican in models 2 and 3, and the significant negative coefficient for White in model 3.
Note: *P < 0.1, **P < 0.05, ***P < 0.001.
Figure 1 and Table 2 provide empirical support for H2 and some support for H1 . In a polarized society like the United States, the elite cue on blame-shifting works oppositely for co-partisans and opponents. The supporters of the ruling party lower their blame, while the supporters of the opposition party blame the ruling party even more. It is worth noticing that the attitude between Democrats and Republicans is similar in the Control Group but are polarized in the Treatment Group after they read Biden’s blame-shifting. The result also indicates that the treatment used in this experiment can successfully stimulate the partisan motivated reasoning among the MTurk respondents.
Results of Study 1: H3 and H4
If the effect of partisan motivated reasoning can be extended to the external actor, we should expect that Democrats in the Treatment Group will raise their blame on Putin, while Republicans in the Treatment Group will lower their blame on Putin. Interestingly, the empirical results suggests something different.
To begin with, Biden’s excuse did not shift the blame to Putin as well, on average. After reading Biden’s blame-shifting, the level of blame toward Putin tends to decrease insignificantly (0.78 to 0.69, Two-group t-test P = 0.18).
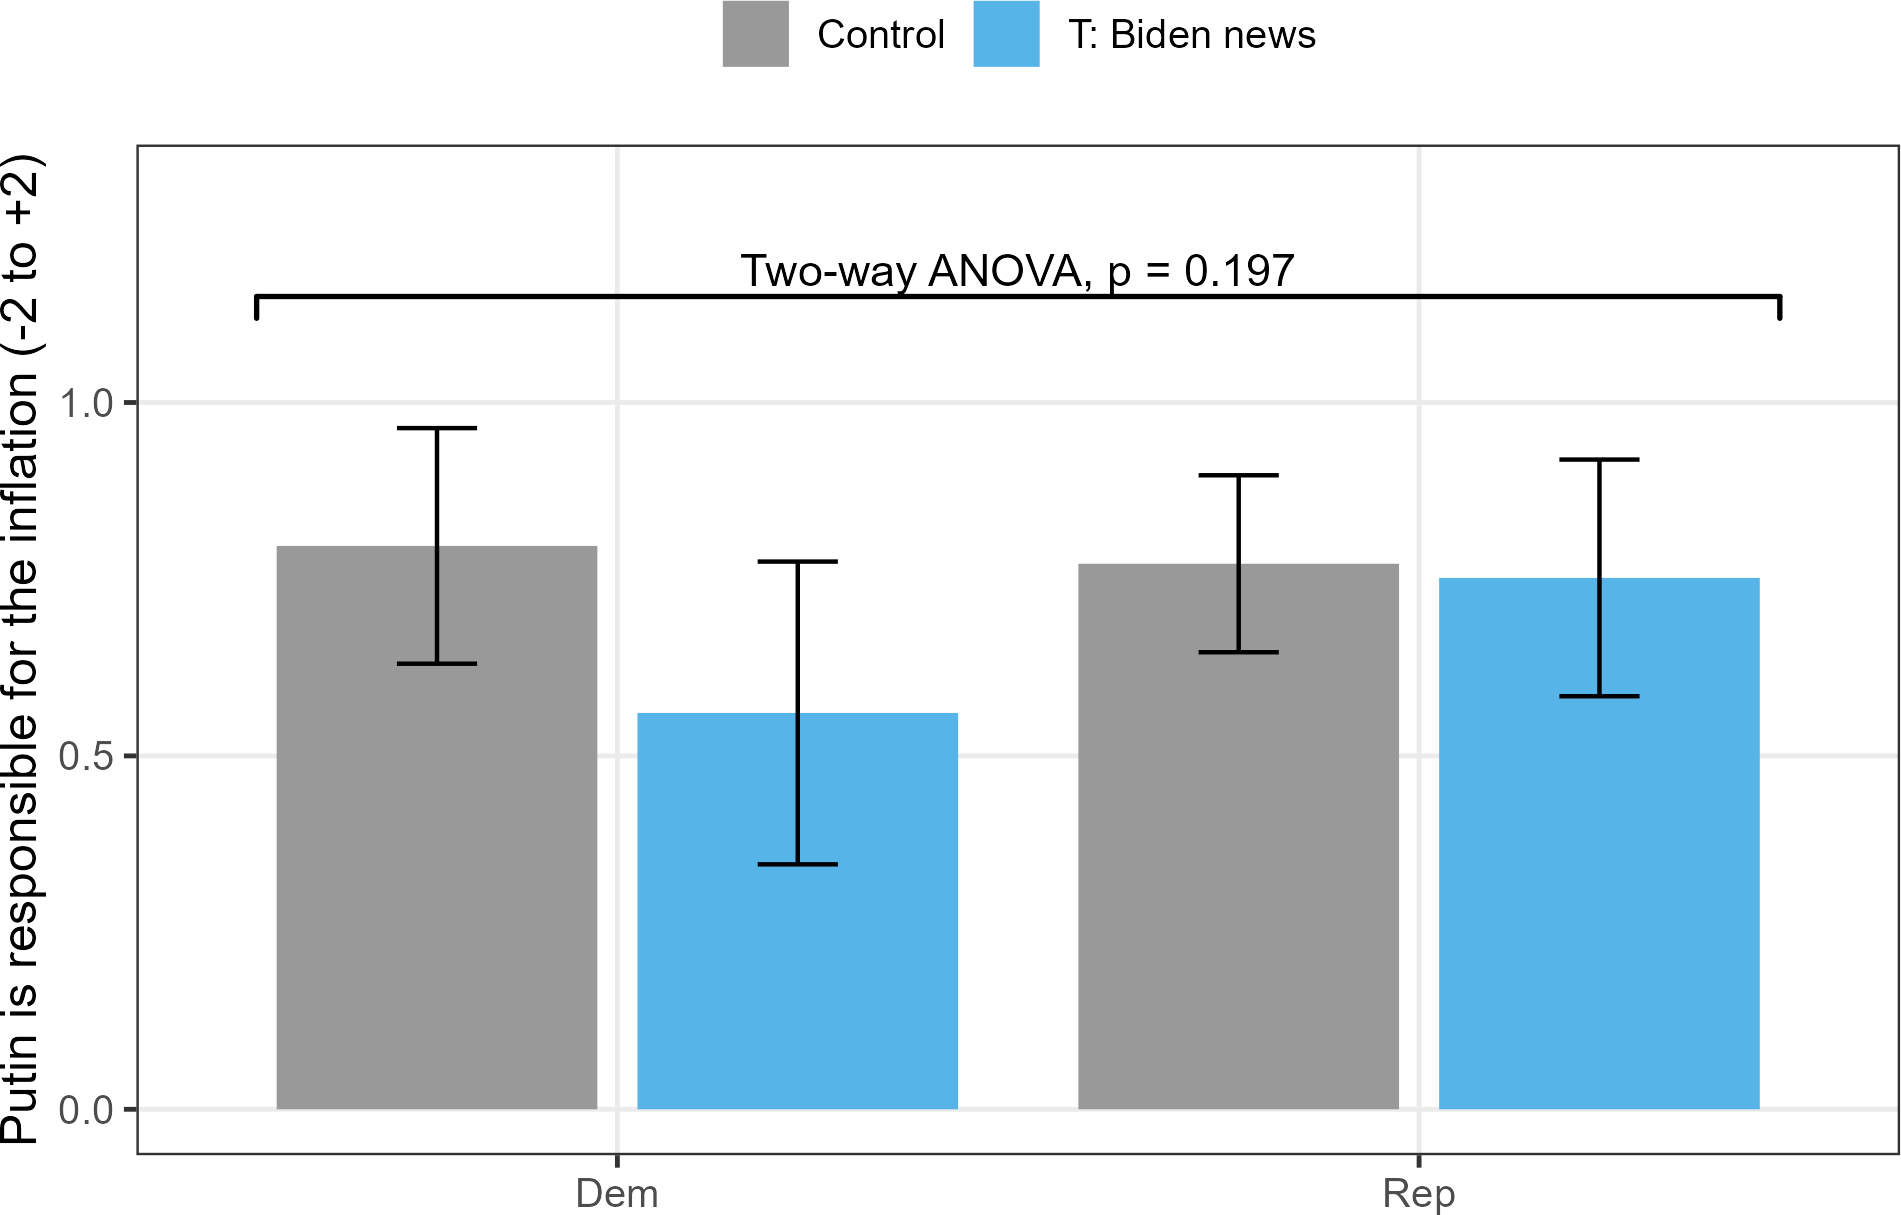
Figure 2 shows the change in blame attribution toward Putin by partisanship. Interestingly, after reading Biden’s claim that Putin is responsible for inflation, Democrats tend to have a lower blame attribution toward Putin (Two-group t-test, P = 0.09), while Republicans did not change their opinion toward Putin (Two-group t-test, P = 0.85). The ANOVA test yields no significant interactive effect (P = 0.197) or main effect (P = 0.427) between the treatment and partisanship on the level of Putin’s blame attribution.
Elite cue and polarized blame-shifting on the external factor, Study 1 (n = 802).

Figure 2. Long description
The bar graph compares the responsibility attribution for inflation between two groups, Democrats and Republicans, under control and treatment conditions. The x-axis represents political affiliation, divided into Democrats and Republicans, while the y-axis measures the level of agreement that Putin is responsible for inflation, ranging from negative 2 to positive 2. There are four bars in total, two for each political affiliation. Each affiliation has two bars: one for the control group in gray and one for the treatment group, which involves exposure to Biden news, in blue. The graph includes error bars indicating the variability of the data. The two-way ANOVA result at the top of the graph shows a p-value of 0.197, suggesting no significant interaction effect between the treatment and political affiliation. All values are approximated.
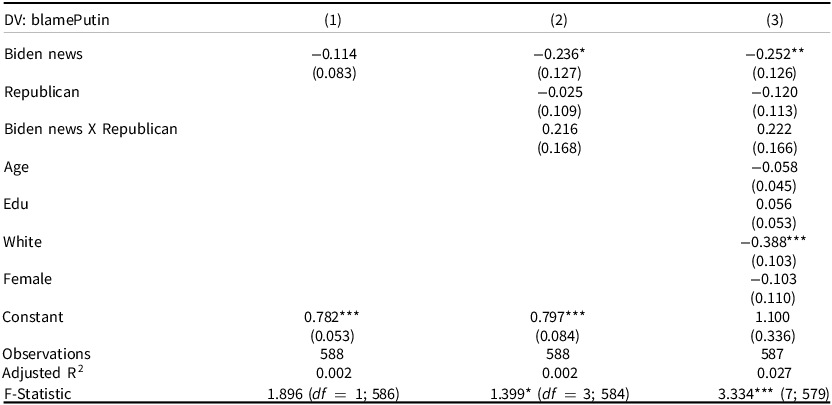
Table 3 shows the three ordinary least squares (OLS) regression models on blame-shifting and the level of blame on Putin. The treatment itself is insignificant in Model 1. After adding the interaction term between the treatment and partisanship in Model 2, the treatment effect is negative for Democrats – in other words, Democrats lowered their blame for Putin after Biden shifted the blame to Putin. Meanwhile, Republicans did not change their level of blame toward Putin after they had already read Biden’s excuse and raised their blame toward Biden. The result holds after covariates are controlled in Model 3. Overall, the result supports H4 but less on H3 .
Regression models of blame attribution on the external factor
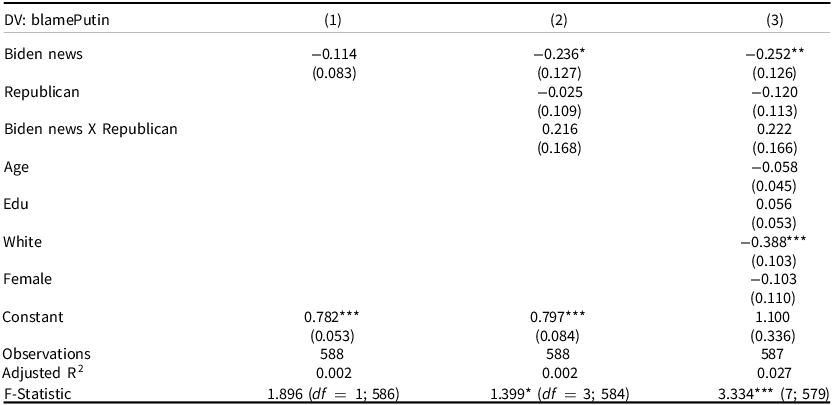
Table 3. Long description
The table presents regression models of blame attribution on external factors. It contains three columns labeled (1), (2), and (3), each with various rows of data. The rows include variables such as Biden news, Republican, Biden news X Republican, Age, Edu, White, Female, Constant, Observations, Adjusted R-squared, and F-Statistic. Each column shows different coefficients and standard errors for these variables. Notable trends include significant negative coefficients for Biden news in columns (2) and (3), and a significant negative coefficient for the White variable in column (3). The table provides insights into how different factors influence blame attribution.
Note: *P < 0.1, **P < 0.05, ***P < 0.001.
Discussion of Study 1
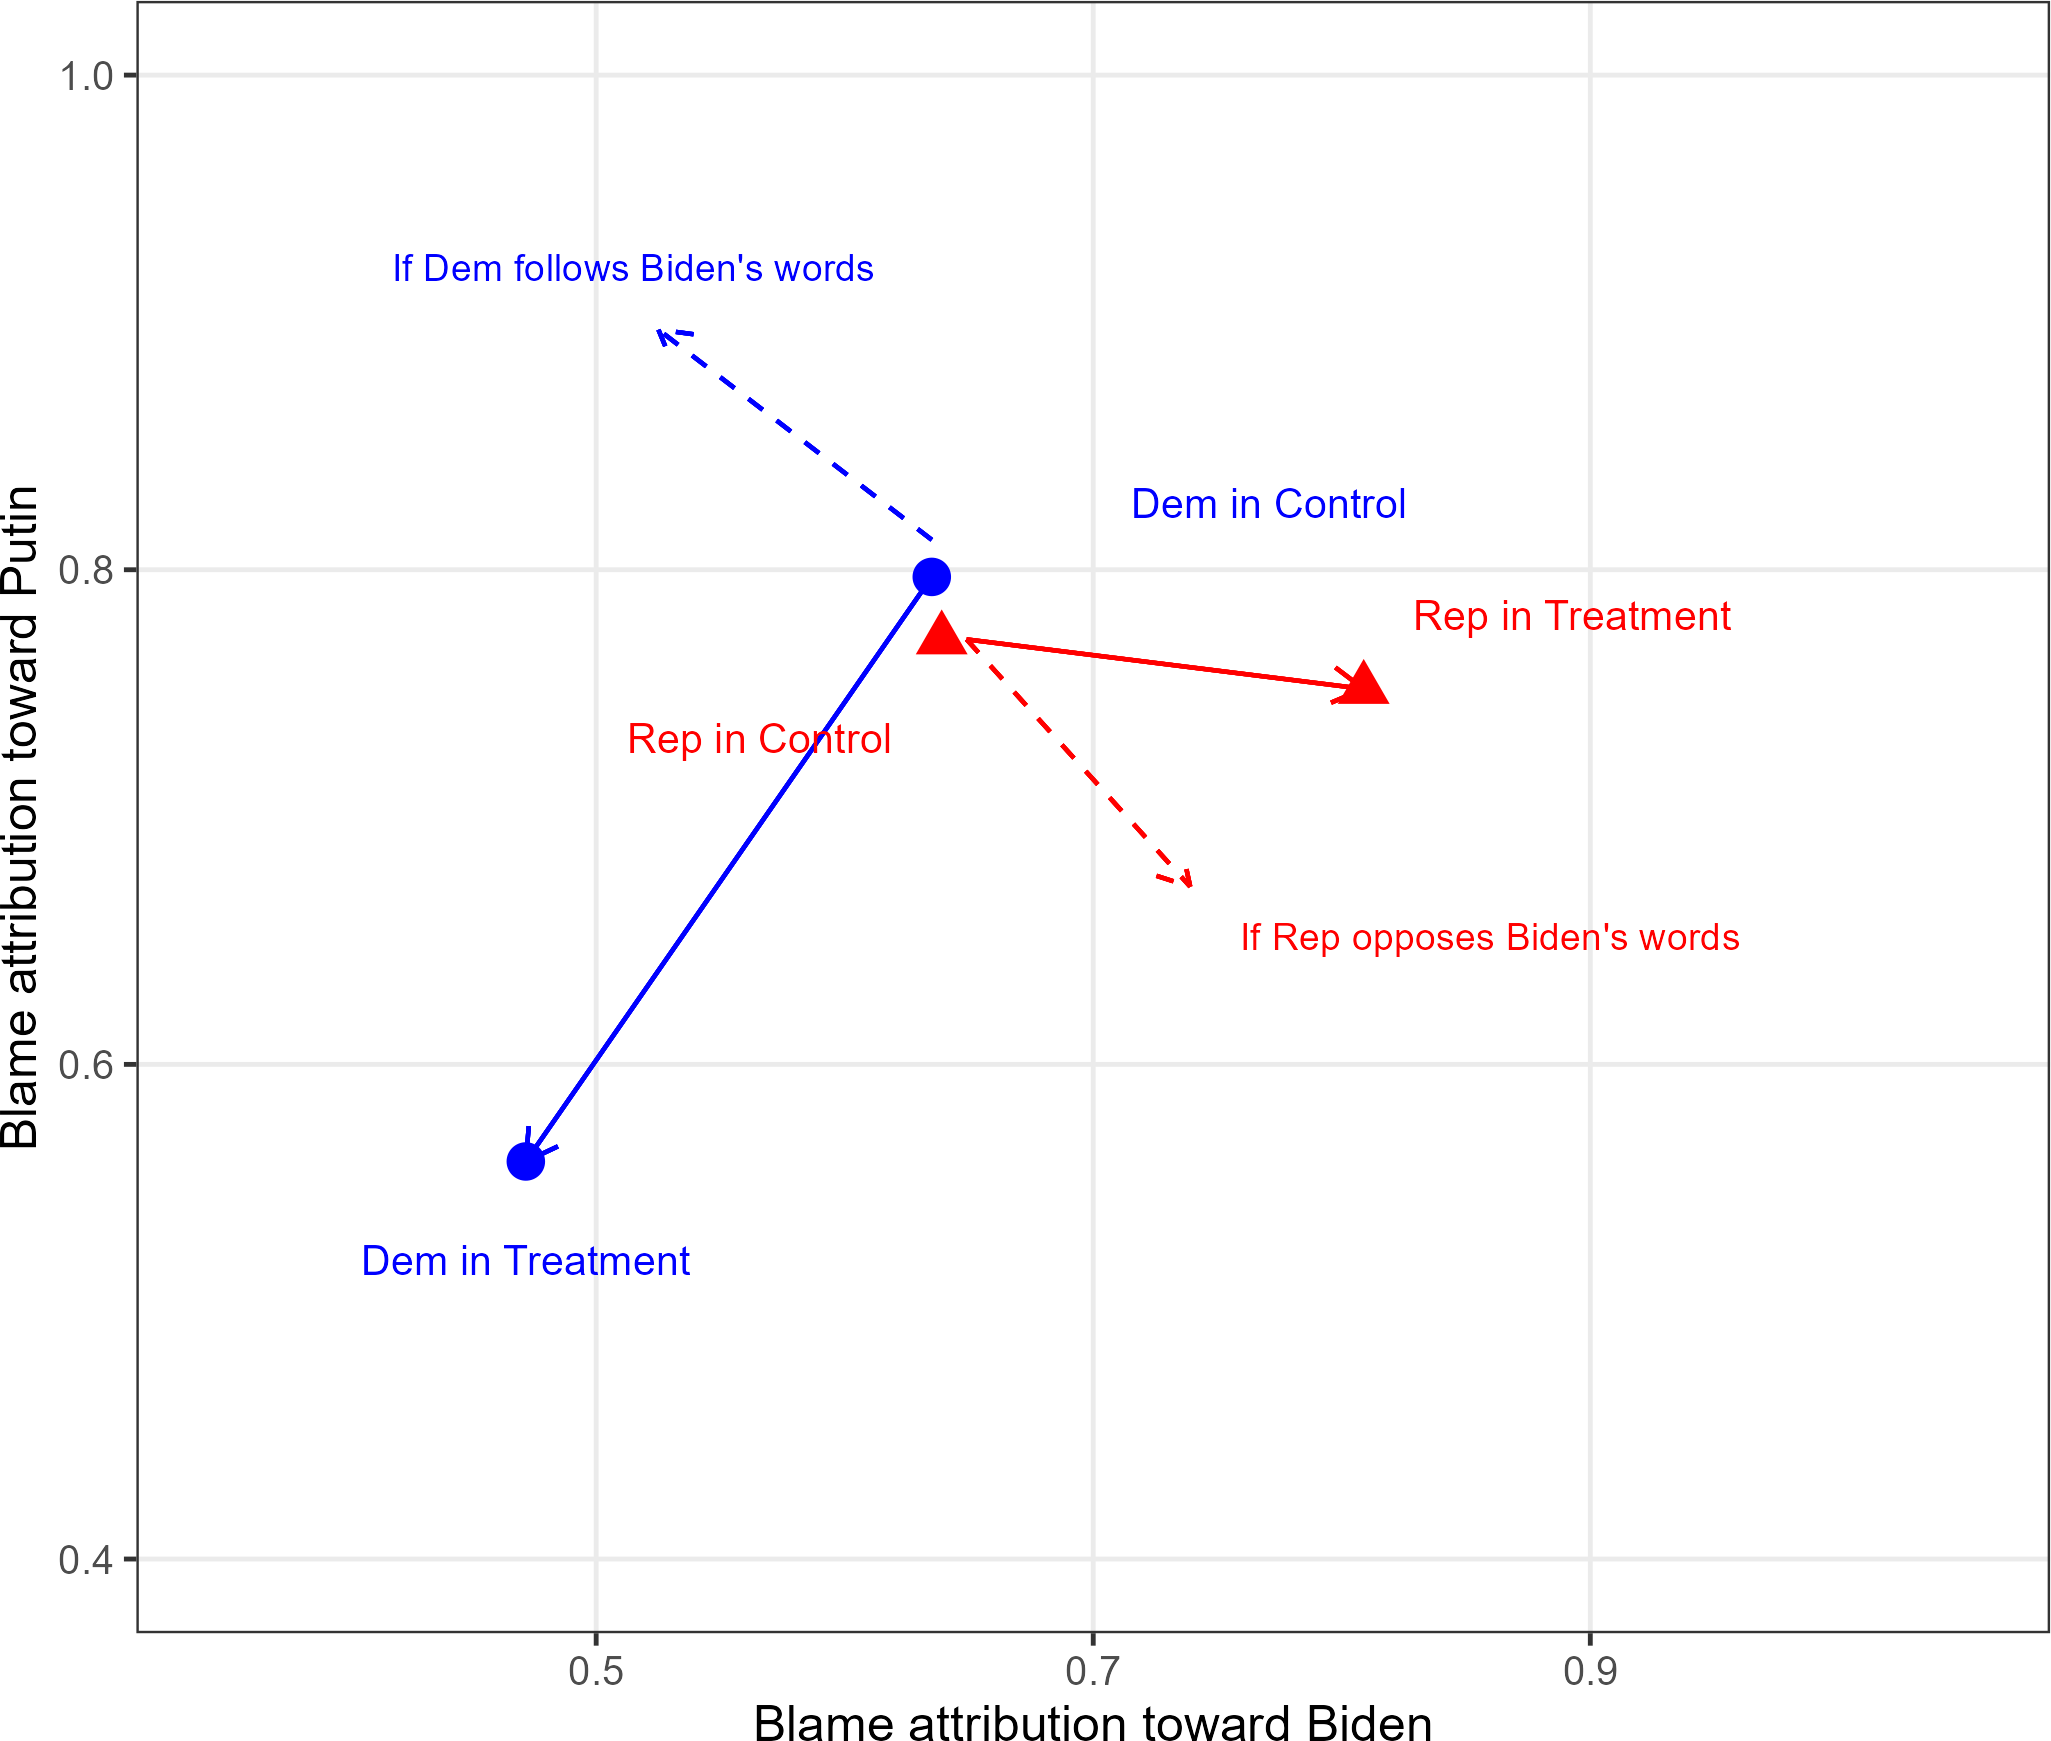
Figure 3 summarizes the mean blame attributions of Democrats and Republicans across experimental conditions by combining the results presented in Figures 1 and 2. In the Control Group, Democrats and Republicans exhibit broadly similar evaluations of both President Biden and President Putin. Exposure to the blame-shifting message, however, generates clear partisan polarization in responsibility attribution. Consistent with motivated reasoning and negative partisanship, Democrats reduce their blame toward President Biden, whereas Republicans increase their blame toward him after reading the incumbent’s externalizing explanation.
Asymmetric blame-shifting between domestic and external factors, Study 1 (n = 802).

Figure 3. Long description
A line graph illustrates blame attribution toward Biden and Putin by Democrats and Republicans. The x-axis represents blame attribution toward Biden, ranging from 0.4 to 0.9, while the y-axis represents blame attribution toward Putin, ranging from 0.4 to 1.0. The graph features two main data lines: one for Democrats (in blue) and one for Republicans (in red). The blue line starts at a point near 0.5 on the x-axis and 0.6 on the y-axis, labeled ‘Dem in Treatment.’ It moves upward to a point near 0.7 on the x-axis and 0.8 on the y-axis, labeled ‘Dem in Control.’ A dashed blue line extends from this point, indicating ‘If Dem follows Biden’s words,’ moving further upward. The red line starts at a point near 0.7 on the x-axis and 0.8 on the y-axis, labeled ‘Rep in Control.’ It moves to the right to a point near 0.9 on the x-axis and 0.7 on the y-axis, labeled ‘Rep in Treatment.’ A dashed red line extends from this point, indicating ‘If Rep opposes Biden’s words,’ moving downward. All values are approximated.
If blame-shifting operated symmetrically through motivated reasoning, one would expect partisan responses to follow a compensatory pattern (symmetric blame-shifting): Democrats would shift blame away from Biden and toward Putin, while Republicans would shift blame away from Putin and toward Biden. In graphical terms, such a pattern would be reflected along the diagonal dashed lines. The experimental evidence does not support this expectation. Instead, Republicans increase blame toward Biden without altering their evaluation of Putin, while Democrats reduce their blame toward Biden and exhibit a modest decline in blame toward Putin. In other words, the blame-shifting cue does not produce a genuine redistribution of responsibility across actors. Instead, it polarizes partisan evaluations of the domestic incumbent. These findings suggest that motivated reasoning operates primarily within the domain of domestic political competition and does not extend in a symmetric manner to external actors over whom voters lack political control – which is explained and summarized by the asymmetric blame-shifting theory in this article.
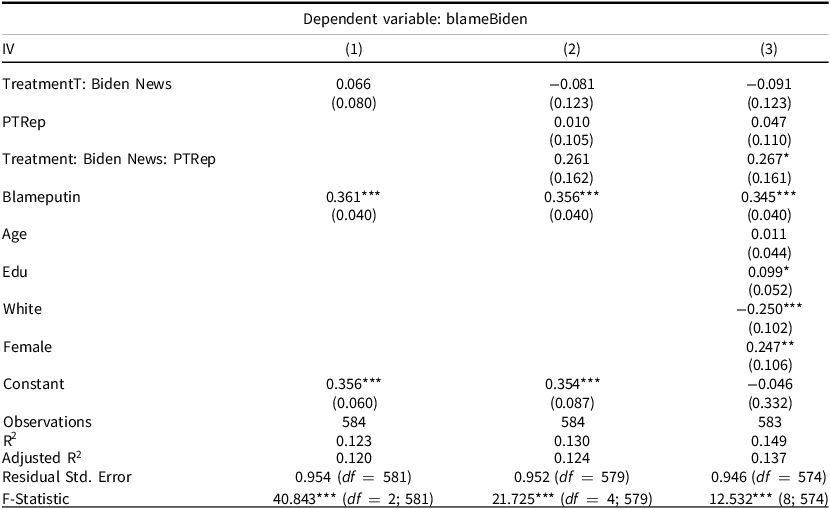
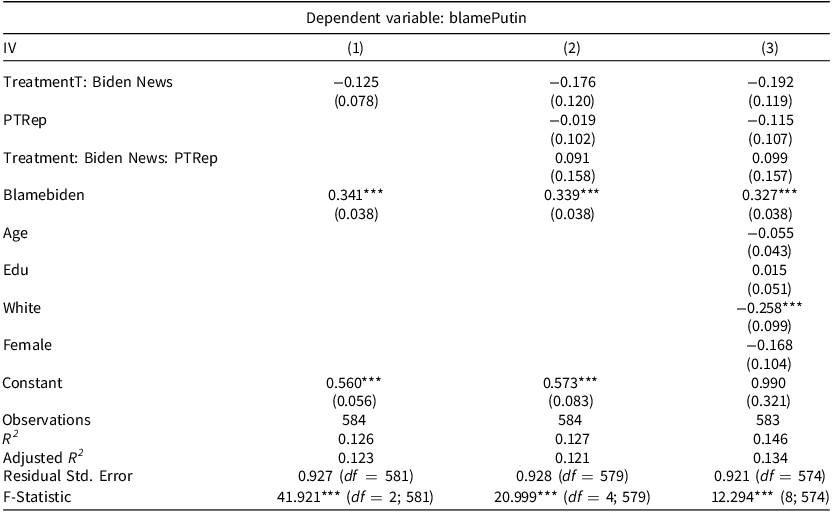
One remaining question is why Democratic respondents exhibit a reduction in blame toward Putin. One possible explanation is an anchoring effect arising from question order. Because respondents were asked to evaluate Biden prior to evaluating Putin, Democratic respondents’ assessments of Putin may have been partially anchored to their prior evaluation of Biden. To assess this possibility, Appendix Tables A2 and A3 introduce additional controls for cross-attribution. In Appendix Table A3, both the treatment effect and the interaction term predicting blame toward Putin become statistically insignificant after controlling for respondents’ evaluations of Biden. By contrast, in Appendix Table A2, the interaction term predicting blame toward Biden remains statistically significant after controlling for respondents’ evaluations of Putin. These results suggest that attitudes toward Putin may be conditionally anchored by prior evaluations of Biden, whereas the partisan polarization in blame toward Biden is robust to such controls.
Importantly, this anchoring mechanism cannot account for the absence of change in Republicans’ blame toward Putin. Moreover, even if anchoring plays a role among Democratic respondents, the results remain consistent with the asymmetric blame-shifting argument. Elite cues polarize partisan evaluations of domestic incumbents while leaving blame attributions toward external actors largely unchanged. To further mitigate potential order effects, future research may randomize the sequence of blame attribution items.
Study 2: The negative impact of asymmetric blame attribution (H1, H2, H3, H4, and H5)
Research design
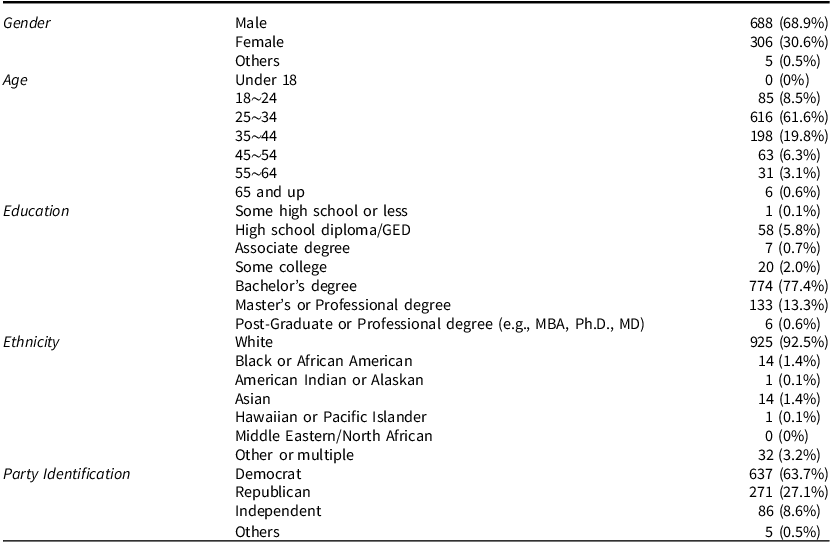
On August 29, 2023, 1045 respondents were recruited through the Amazon MTurk web service, and 999 completed the survey (95.6%). Respondents are over 18 years old, located in the US, and have a 95% or above HIT approval rate. Respondents were invited to take a survey titled ‘A Brief Survey About News, Society, and Politics’ and were compensated with $1 after completion. The research design was approved by the author’s institution (#UNLV-2023-338) and was also pre-registered by Open Science Foundation (https://osf.io/xda29) before the data collection. The sociodemographic background of the MTurk respondents can be found in Table 4.
Background of the MTurk respondents in Study 2 (n = 999)

Table 4. Long description
The table presents the background of Mechanical Turk respondents in Study 2, with a total of 999 participants. It includes categories such as gender, age, education, ethnicity, and party identification. The gender distribution shows 68.9 percent male, 30.6 percent female, and 0.5 percent others. Age groups are divided into under 18, 18 to 24, 25 to 34, 35 to 44, 45 to 54, 55 to 64, and 65 and up, with the majority being between 25 to 34 years old at 61.6 percent. Education levels range from some high school or less to post-graduate or professional degrees, with the majority having a bachelor’s degree at 77.4 percent. Ethnicity is predominantly white at 92.5 percent, with other ethnicities making up the remaining percentage. Party identification includes Democrat, Republican, Independent, and others, with Democrats being the largest group at 63.7 percent.
The questionnaire design in Study 2 is the same as Study 1 for replication, but Study 2 includes the items of democratic belief after the treatments. All 999 respondents were asked questions about political interest and information consumption. Afterward, 502 (50.2%) respondents were assigned to the Control Group, and 497 (49.7%) were assigned to the Treatment Group. The treatment is the same as Study 1 (see Appendix Table A1). After reading the message, all respondents were asked how much they blamed Biden and Putin for the inflation with the same five-point scale, respectively. The randomization check shows that the distributions of race, age, level of education, and partisanship are not indistinguishable between the Control and Treatment Groups (P > 0.05).
Following the questions on blame attribution, all respondents were then asked two questions on democratic belief. The first question is ‘Do you agree or disagree with the following statement: Democracy may have its problems, but it is still the best form of government’ (Agree strongly (+2), Agree (+1), Neither agree nor disagree (0), Disagree (−1), Disagree strongly (−2)). The second question is ‘Which of the following statements comes closer to your own view? Democracy is capable of solving the problems of our society (+1) Democracy cannot solve our society’s problems (0).’ These two questions are used to measure democratic trust in the Global Barometer and Asian Barometer (Lu and Chu Reference Lu and Chu2021).
After completing the experimental measures, respondents were then asked a series of questions related to minority and vote choice, which is beyond the scope of this article. At the end of the survey, respondents were asked about their party identification and sociodemographic background, and then they were debriefed and compensated.
Result of Study 2: Replicating Study 1
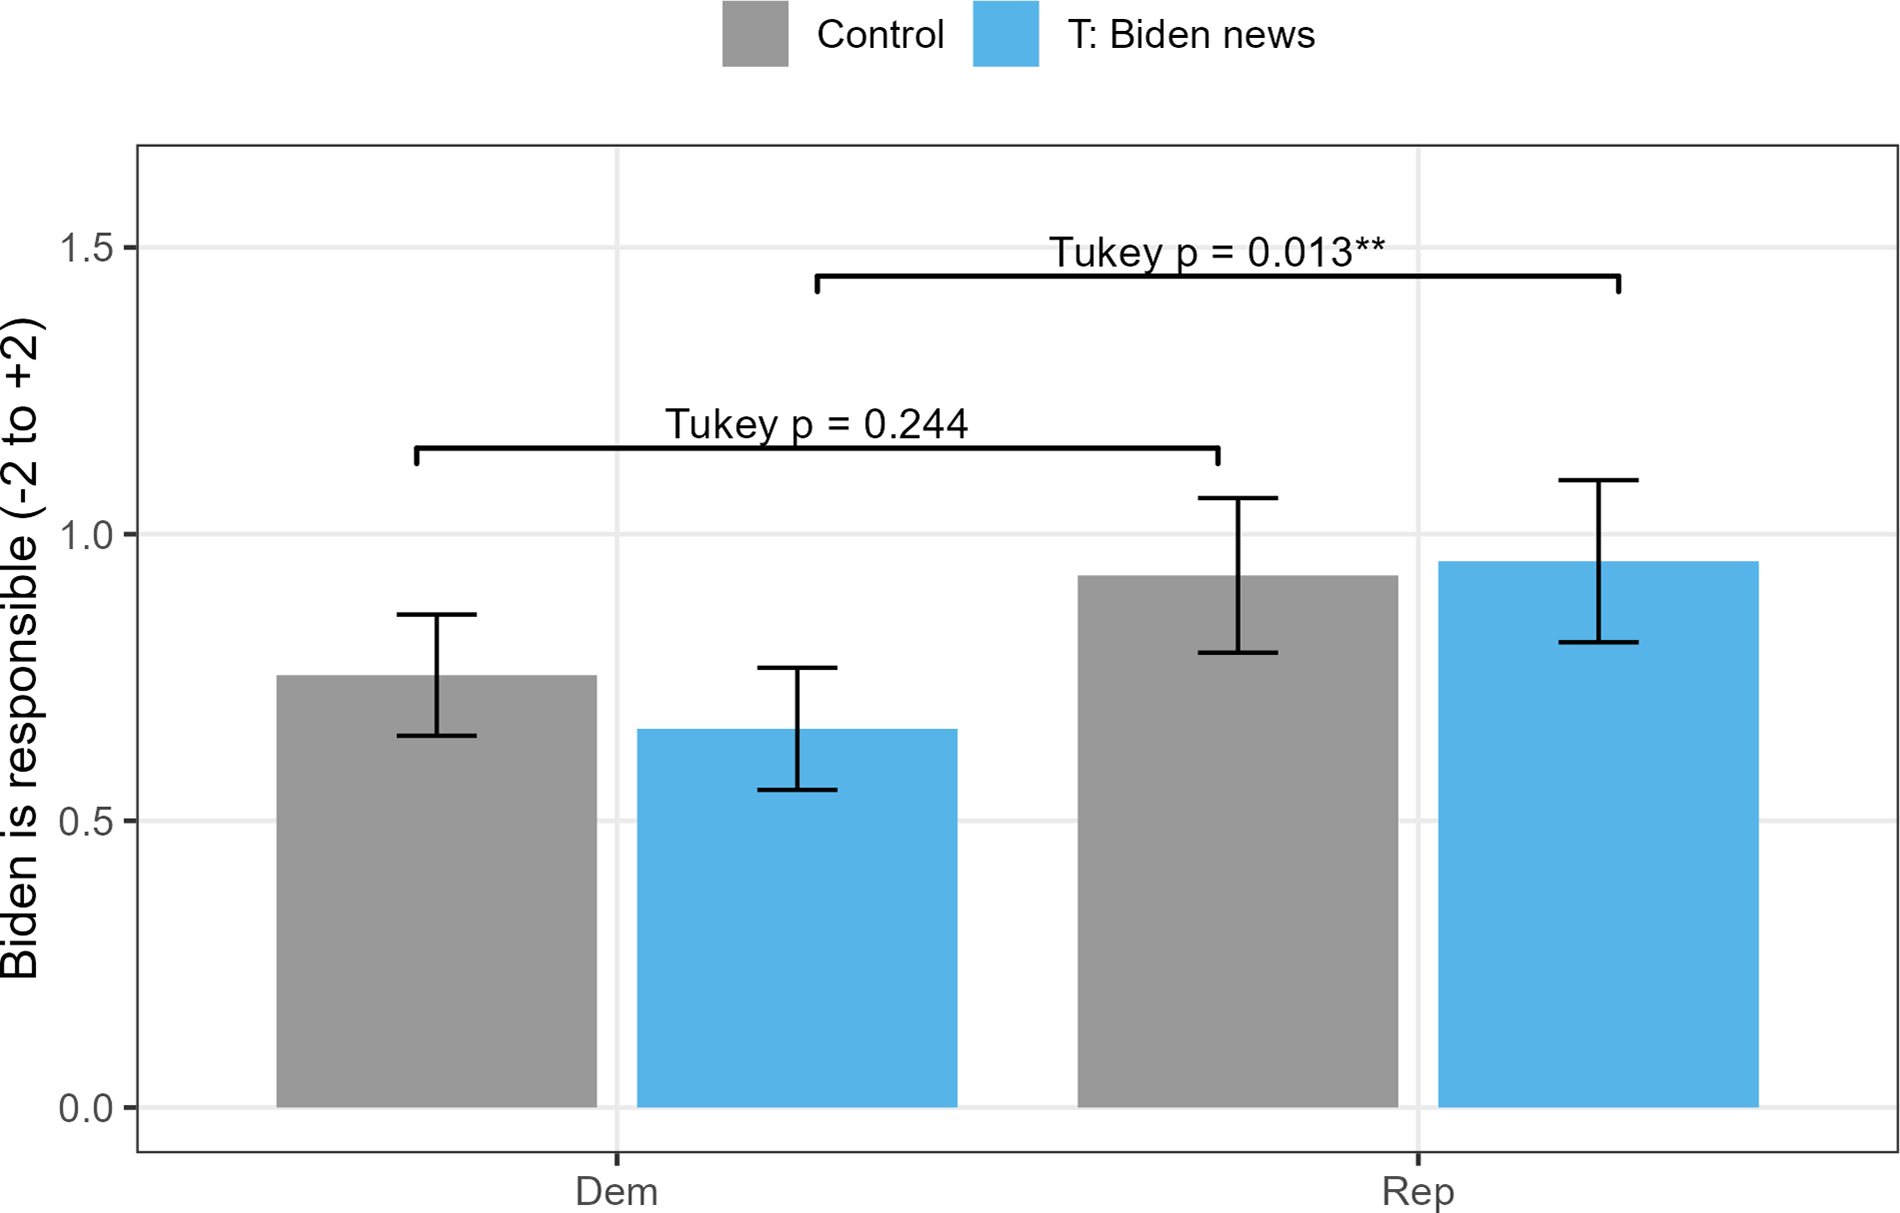
Similar to Study 1, Biden’s blame-shifting to Putin successfully polarized the attitudes between Democrats and Republicans on how much they blamed Biden. There is no statistical difference between Democrats and Republicans on their level of blame toward Biden in the Control Group (Tukey HSD P = 0.243). However, supporters of the two major parties polarized in the Treatment Group (Tukey HSD P = 0.013); after hearing Biden’s blame-shifting, Democrats blamed Biden less and Republicans blamed Biden even more. The polarization is illustrated in Appendix Figure A1.
Meanwhile, people’s attitude toward Putin remains unchanged after they received Biden’s excuse. Two-way ANOVA and Tukey tests all revealed insignificant results (all p > 0.30). In other words, Study 2 successfully replicates the main findings of Study 1 and renders empirical support again to H1, H2, H3, and H4 . Since Study 2 was implemented nine months after Study 1, the replication indicates that we have more confidence in the psychological mechanism of asymmetric blame-shifting.
Results of Study 2: Limited evidence on democratic trust erosion
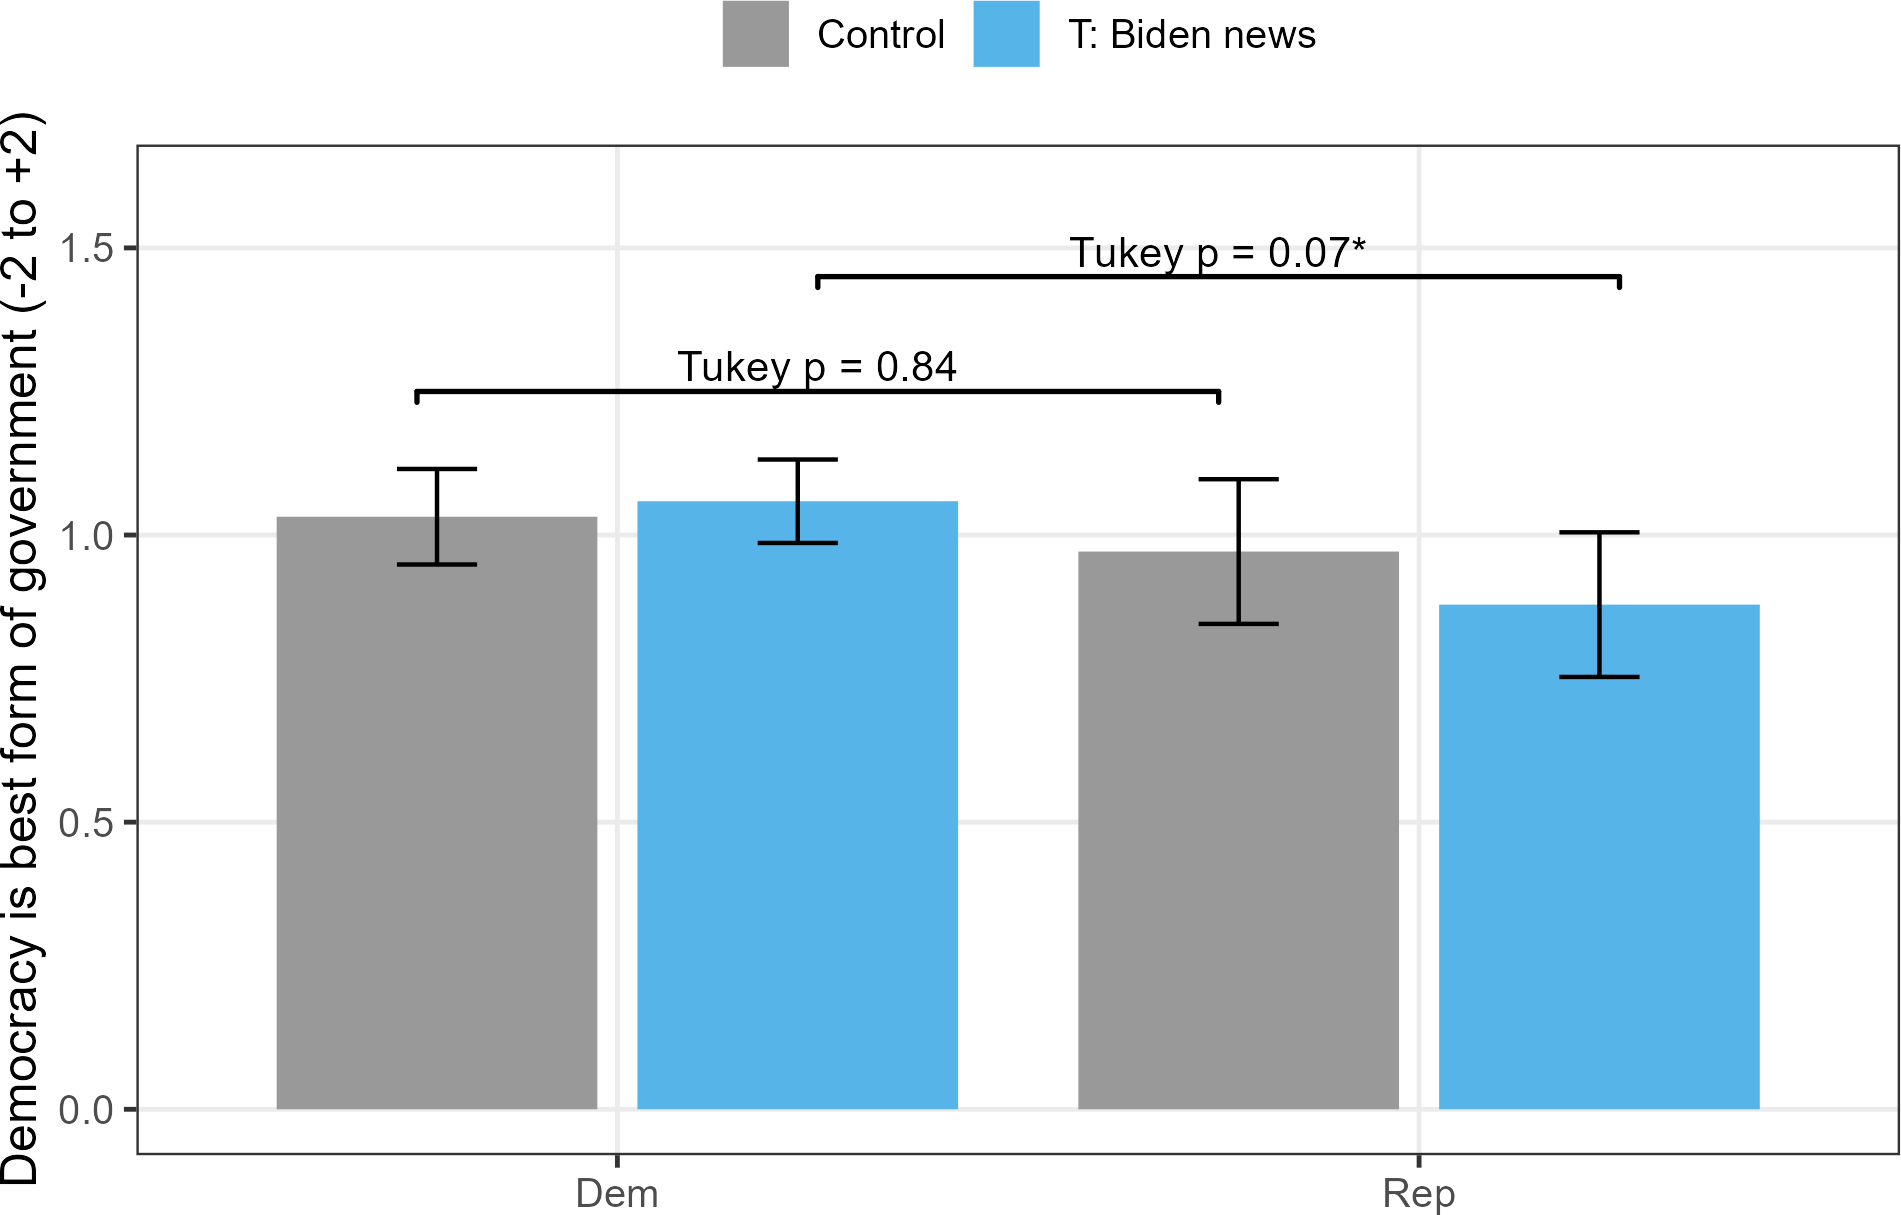
Following the blame attribution measures, respondents reported their beliefs about democracy. Figure 4 presents the effects of the blame-shifting treatment on democratic belief as measured by the five-point scale ranging from –2 to +2. Overall, exposure to President Biden’s external blame narrative does not produce a uniform decline in democratic belief across the full sample (t-test, P = 0.89). Instead, the results reveal a conditional partisan pattern.
Blame-shifting and polarized democratic belief, Study 2 (n = 999).

Figure 4. Long description
The bar graph compares democratic belief between control and Biden news groups for Democrats and Republicans. The x-axis represents political affiliation, divided into Democrats and Republicans, while the y-axis measures the belief that democracy is the best form of government, ranging from negative 2 to positive 2. There are four bars in total, two for each political affiliation, with vertical orientation. The control group is represented by gray bars, and the Biden news group by blue bars. For Democrats, both control and Biden news groups show similar levels of belief in democracy, around 1.0. For Republicans, the control group shows a slightly higher belief in democracy compared to the Biden news group. The graph includes error bars indicating variability. The Tukey p-values indicate statistical significance, with a value of 0.84 for Democrats and 0.07 for Republicans. All values are approximated.
In the Control Group, Democrats and Republicans exhibit comparable levels of democratic belief (Tukey HSD, P = 0.84). After exposure to the blame-shifting message, however, Republican respondents report lower levels of trust in the democratic system, resulting in a partisan divergence in democratic belief (Tukey HSD, P = 0.07). Although the effect does not reach conventional levels of statistical significance, the pattern is consistent with H5 and suggests that elite blame-shifting cues may weaken democratic trust among opposition partisans. To sum up, these findings provide limited but suggestive evidence that the downstream consequences of asymmetric blame attribution are heterogeneous and concentrated primarily among supporters of the opposition party.
The same pattern of partisan polarization does not emerge when democratic belief is measured using the second, binary indicator. This measure reveals no overall treatment effect on democratic belief (t-test, P = 0.642) and does not produce a clear partisan divergence. In the Control Group, Democrats and Republicans report similarly high levels of pro-democracy attitudes (Tukey HSD, P = 0.75). In the Treatment Group, Democrats express slightly higher democratic belief than Republicans, but this difference is not statistically significant (93% among Democrats and 86% among Republicans; Tukey HSD, P = 0.75).
One plausible explanation for this null finding is the ceiling effect. Across both partisan groups, support for democracy remains extremely high. As a result, the binary measure lacks sufficient variation to capture modest treatment-induced changes in democratic belief. Even if blame-shifting cues exert some influence, their effects may be too small to be detected by a dichotomous indicator when baseline support for democracy is near universal.
In summary, the results of Study 2 provide limited evidence of a negative impact of blame-shifting on democratic belief (H5). Where such effects appear, they are concentrated primarily among supporters of the opposition party. At the same time, the findings do not allow for a definitive distinction between a genuine decline in democratic belief and a spillover effect driven by intensified blame toward the incumbent. This ambiguity underscores the need for caution in interpreting downstream effects and motivates a broader discussion of how elite blame-shifting may interact with partisan evaluations and democratic attitudes.
Conclusion
Does an elite cue on blame-shifting toward external actors work? By incorporating the theories of democratic accountability, motivated reasoning, and negative partisanship, this article advances the asymmetric blame-shifting argument. The hypotheses are supported by two pre-registered survey experiments (Study 1 and Study 2) on Amazon MTurk, exploiting a real-life case of Biden accusing Putin of the increasing oil prices. The findings consistently show that elite blame-shifting cues polarize partisan evaluations of the domestic incumbent without producing a corresponding redistribution of blame toward external actors. Democrats reduce their blame toward the incumbent, while Republicans intensify it; in contrast, attitudes toward the external actor remain largely unchanged.
Beyond responsibility attribution, the findings suggest that asymmetric blame-shifting may carry broader consequences for democratic legitimacy in the era of globalization. Study 2 provides limited but suggestive evidence that exposure to external blame narratives can weaken democratic belief among opposition partisans. When incumbents attribute salient policy failures to forces beyond national borders, they implicitly acknowledge the limits of democratic control in addressing pressing economic challenges. Even if such narratives succeed in consolidating in-party support, they may simultaneously undermine confidence in democracy among out-party voters, who interpret externalization as a signal of institutional incapacity. In this sense, asymmetric blame-shifting represents a politically myopic strategy: effective for short-term partisan mobilization, yet potentially corrosive to democratic trust.
Our findings suggest that the incumbent may be motivated to exercise the asymmetric blame-shifting for concentrating their support from the in-party members at the expense of a lower support from out-party members. This strategy could be useful during the primary election, but how long the effect may last needs further investigation in the future. In this article, there was a nine-month gap between Study 1 and the replication in Study 2, and we found a similar polarization effect. Nevertheless, this article did not examine the treatment effect on the non-partisans, given the insufficient number of cases in both Study 1 and Study 2. The motivated reasoning and goal-oriented knowledge theory in this article fail to form a testable hypothesis, and the number of non-partisan respondents is not enough in this article to examine the tendency.
Our findings also imply that voters may form their understanding and blame attribution on external actors beyond domestic partisanship. Instead, their understanding may come from the historical dynamic between their country as a whole and the external factor. In both Study 1 and Study 2, neither Biden’s cue nor the partisanship significantly explained US voters’ attitudes toward Putin. It could be possible that how much US voters blame Putin has been decided by US voters’ general knowledge of the past interaction between the US and Russia as a whole. This hypothesis is in line with the literature. For example, Kosmidis’ survey experiment in Greece (Reference Kosmidis2018) shows that the manipulation of how much the government controlled the economic policy did not change the pattern of economic voting. Meanwhile, Alcañiz and Hellwig (Reference Alcañiz and Hellwig2011) show that how much Latin American voters blame international organizations for the poor economy is related to the previous interaction between their country and those organizations. In addition, Jensen and Rosas (Reference Jensen and Rosas2020) conducted experiments in the US and Canada and revealed that the perceived level of globalization did not change how voters blame the government for economic performance. Our findings in Figure 3 serve as direct evidence that voters indeed form the blame attribution toward domestic and external factors independently, and the level of the blame cannot be shifted between them.
These findings also contribute to broader debates about globalization and accountability. In a globalized economy, many economic outcomes are shaped by transnational forces that escape direct democratic control. Prior research has emphasized how globalization constrains governments’ capacity to deliver material outcomes; this article highlights an additional, elite driven mechanism. Political leaders may actively invoke globalization as a rhetorical resource to deflect responsibility, thereby reshaping domestic accountability dynamics. The results suggest that voters form blame attributions toward domestic and external actors through largely independent processes. Evaluations of external actors appear to be shaped less by partisan cues than by longstanding historical experiences and geopolitical schemas, consistent with prior findings in comparative contexts (e.g., Alcañiz and Hellwig Reference Alcañiz and Hellwig2011; Kosmidis Reference Kosmidis2018; Jensen and Rosas Reference Jensen and Rosas2020).
Several limitations warrant consideration and point to directions for future research. First, the empirical analysis focuses on the United States, a highly polarized two-party system. While the theoretical mechanisms identified in this article are not unique to the US context, the magnitude of the observed effects may differ in multiparty systems with weaker partisan identities (e.g., Bellucci Reference Bellucci2014). Future research should examine whether asymmetric blame-shifting operates similarly in less polarized democracies and in contexts where responsibility is more diffusely shared across parties.
Second, although MTurk samples with experimental designs are suited for identifying causal mechanisms, they are not representative of the broader population. MTurk respondents in both Study 1 and Study 2 have a higher level of education and are disproportionately male, characteristics that may heighten political engagement and responsiveness to elite cues. As a result, the treatment effects observed here may overestimate the magnitude of blame-shifting effects in the general population.
Third, this article may also underestimate the magnitude of blame-shifting effects because of the imperfect research design.Footnote 3 Specifically, both Study 1 and Study 2 use Biden’s blame-shifting as the main treatment, but they did not control how much Putin should be responsible for the inflation. Specifically, it could be possible that the external actor is really responsible for the outcome, so the domestic elite’s blame-shifting is not lying. In the case used in this article, the connection of inflation and the Ukraine crisis was salient and strong, which made it harder to create a baseline group which only mentioned the external actor but not blame-shifting. Therefore, the estimated effect in Study 1 and 2 may have been partially cancelled out by the true baseline of accountability of the external actor. Future work may focus on a better context and research design for gauging the effect size of asymmetric blame-shifting.
Finally, the present analysis focuses primarily on self-identified partisans. Due to sample size constraints, it is not possible to systematically examine the responses of non-partisans, a group that has been growing in size and political relevance in recent years (Klar and Krupnikov Reference Klar and Krupnikov2016; Wang, Carter, Benjelloun et al. Reference Wang, Carter, Benjelloun, Banerjee and Cervantes2026). Whether asymmetric blame-shifting affects non-partisans differently remains an important question for future research. In addition, the two survey experiments also failed to include the self-reported income into the questionnaire, which may underestimate the heterogeneous effect of inflation on different groups of people.
In conclusion, this article offers a novel perspective on elite blame-shifting in a globalized world. Rather than reallocating responsibility across borders, elite cues polarize domestic evaluations and may erode democratic trust among opposition supporters. These findings suggest that democratic backsliding need not arise solely from structural constraints imposed by globalization; it may also be fueled by strategic choices made by political elites themselves. In this sense, asymmetric blame-shifting constitutes not only a political strategy but also a potential pathway through which globalization-era politics contributes to the weakening of democratic legitimacy.
Data availability statement
The data and replication code that support the findings of this study are available from the author upon request.
Acknowledgements
We are deeply grateful to the three anonymous reviewers for their constructive comments, which greatly improved the quality and contribution of this article. We also thank the journal editors for their professional guidance and assistance throughout the review process. An earlier version of Study 1 was presented at the 2023 APSA Annual Meeting, and we are grateful to the discussant and participants for their valuable feedback on this research.
Funding statement
Both Study 1 and 2 were generously sponsored by the Department of Political Science, University of Nevada, Las Vegas.
Competing interests
The corresponding author states that there is no conflict of interest.
Appendix
Political polarization on attributing to Biden after Biden’s excuse, Study 2 (n = 999).

Figure A1. Long description
The bar graph compares the responsibility attributed to Biden between control and treatment groups for Democrats and Republicans. The x-axis represents political affiliation with categories Dem and Rep, while the y-axis measures the level of responsibility attributed to Biden on a scale from negative 2 to positive 2. There are four bars in total, two for each political affiliation, with the control group in gray and the treatment group in blue. For Democrats, the control group bar is slightly higher than the treatment group bar, with a Tukey p-value of 0.244 indicating no significant difference. For Republicans, the treatment group bar is higher than the control group bar, with a Tukey p-value of 0.013 indicating a significant difference. Error bars are present on each bar, representing the variability of the data. The graph highlights that Republicans attribute more responsibility to Biden after exposure to Biden-related news, while Democrats show no significant change. All values are approximated.
Messages for the Control Group and Treatment Group

Table A1. Long description
A table comparing messages for control and treatment groups regarding inflation and oil prices. The table has two rows and two columns. The first row represents the control group with 405 participants and states that inflation has hit a 40-year high and crude oil prices have reached a 14-year high as of March 2022. The second row represents the treatment group with 397 participants and includes additional information about the political difficulties faced by President Joe Biden, the blame shifted to Russian President Vladimir Putin, and the impact of rising prices on the upcoming midterm elections.
Regression models of blame attribution on domestic politics, controlling the external factor

Table A2. Long description
The table presents regression models of blame attribution on domestic politics, controlling the external factor. It includes three columns of independent variables (IV) with their respective coefficients across three models. The first row shows the treatment effect of Biden News with coefficients of 0.066, -0.081, and -0.091. The second row displays the effect of PTRep with coefficients of 0.010 and 0.047. The third row shows the interaction effect of Treatment: Biden News: PTRep with coefficients of 0.261 and 0.267. The fourth row presents the effect of Blameputin with coefficients of 0.361, 0.356, and 0.345. The fifth row shows the effect of Age with a coefficient of 0.011. The sixth row displays the effect of Edu with a coefficient of 0.099. The seventh row shows the effect of White with a coefficient of 0.250. The eighth row presents the effect of Female with a coefficient of 0.247. The ninth row shows the constant term with coefficients of 0.356, 0.354, and -0.046. The table also includes observations, R-squared values, adjusted R-squared values, residual standard errors, and F-statistics for each model.
Note: *P < 0.1, **P < 0.05, ***P < 0.001.
Regression models of blame attribution on external factors, controlling the domestic politics (Robustness Check: Anchoring Effects in Blame Attribution)
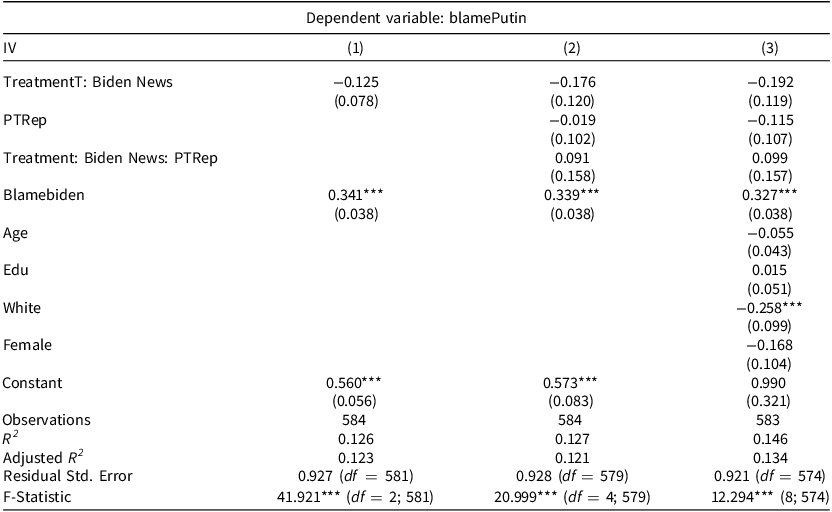
Table A3. Long description
The table presents regression models of blame attribution on external factors, controlling for domestic politics. It includes three columns of regression results with various independent variables. The first row shows the treatment effect of Biden News with coefficients of negative zero point one two five, negative zero point one seven six, and negative zero point one nine two. The second row displays the effect of PTRep with coefficients of zero point zero one nine and negative zero point one one five. The third row shows the interaction effect of Treatment: Biden News: PTRep with coefficients of zero point zero nine one and zero point zero nine nine. The fourth row presents the effect of Blamebiden with coefficients of zero point three four one, zero point three three nine, and zero point three two seven. The table also includes control variables such as Age, Edu, White, and Female, with their respective coefficients. The constant values are zero point five six zero, zero point five seven three, and zero point nine nine zero. The table provides observations, R-squared values, adjusted R-squared values, residual standard errors, and F-statistics for each model.
Note: *P < 0.1, **P < 0.05, ***P < 0.001.

 Open access

