


1. Introduction
Over 80% of the extremely poor live in rural areas and are predominantly smallholder farmers. Agricultural development can play an important role in alleviating extreme poverty as growth in the agricultural sector is most beneficial to the extreme poor compared to growth in other sectors (Christiaensen, Demery, and Kuhl, Reference Christiaensen, Demery and Kuhl2011; Ravallion and Chen, Reference Ravallion and Chen2007). However, when new technologies appear profitable to crop scientists and economists, small-scale farmers may not adopt them (Duflo, Kremer, and Robinson, Reference Duflo, Kremer and Robinson2008; Munshi, Reference Munshi and Munshi2008). One major constraint for small-scale farmers to adopt agricultural technologies is limited access to credit (Gine and Klonner, Reference Gine and Klonner2006; Zerfu and Larson, Reference Zerfu and Larson2010). Cash resources are generally insufficient to cover high-yielding variety (HYV) seeds and fertilizer purchased by small-scale farmers during the planting season (Awotide, Karimov, and Diagne, Reference Awotide, Karimov and Diagne2016).
This article examines the impact of the rapidly expanding mobile phone banking service dubbed “Mobile money” on the adoption of modern agricultural inputs such as chemical (inorganic) fertilizers and HYV seeds by smallholder farmers in rural Uganda. The article explores the impact of mobile money adoption on the welfare of smallholder households in rural Uganda by comparing households that have adopted mobile money to households that have not adopted mobile money. Mobile money is a financial service provided by mobile network operators. It enables its users to make peer-to-peer money transfers and pay bills using the mobile phone. The mobile network operators use retail points known as mobile money agents. These agents provide a range of mobile money services such as subscription, cash-in, and cash-out (cash transfer) services. In 2015, there were over 16,000 mobile money agents operating across Uganda (Uganda Communication Council, 2017). In this study, mobile money adopter households are households in which at least one adult member has subscribed to the mobile money service.
This study is motivated by two important remarks. Firstly, Uganda’s agriculture faces many challenges notably a sharp decline in soil fertility and limited access to irrigation and mechanization. Yet, the majority of Ugandan farmers do not use any chemical fertilizers or high-yielding seeds. Among other reasons, very limited access to credit to purchase input has been frequently mentioned (Sheahan and Barret, Reference Sheahan and Barret2017). In this context of very low adoption of modern inputs due to limited access to credit, we examine the impact of mobile money as an alternative mode of financing the purchase of modern inputs and the ultimate impact on welfare.
Secondly, there is a small but growing literature on the impact of mobile money adoption on firm performance, notably in small businesses in Sub-Saharan Africa (SSA). In their study covering 16 SSA countries, Islam and Muzi (Reference Islam and Muzi2021) find evidence that mobile money adoption increases access to credit and increases investments in female-headed small businesses. Other studies (Gosavi, Reference Gosavi2018; Ahmad, Green, and Jiang, Reference Ahmad, Green and Jiang2020) on firms have also documented increased access to credits and improvements in productivity induced by mobile money adoption. However, it remains unclear whether mobile money adoption can induce similar positive effects on investment in smallholder households. The extent to which mobile money can induce smallholder households to adopt chemical fertilizers and improved seeds in a context of very limited adoption remains an interesting empirical question.
Though it is well established that the financial inclusion of small scale farmers in developing countries induces significant productivity gains through greater input use and adoption of modern agricultural technologies (Deb and Suri, Reference Deb and Suri2013; Narayanan, Reference Narayanan2016), the banking sector in developing countries still lends a very small share of their loan portfolios to smallholder farmers. The introduction of mobile money and its rapid dissemination among rural households is expected to bridge the gap in financial inclusion and enhance access to financial resources needed for agricultural investment.
Though mobile money has the potential to significantly transform small-scale agriculture in Africa, empirical studies linking mobile money to small-scale agriculture are still nascent. Kenyan studies (Kirui, Okello, and Njiraini, Reference Kirui, Okello and Njiraini2013; Kikulwe, Fischer, and Qaim, Reference Kikulwe, Fischer. and Qaim2014) reveal that mobile money adoption among smallholder farmers in Kenya leads to greater input use and commercialization of produce thereby increasing market access and household income.
Unlike Kirui, Okello, and Njiraini (Reference Kirui, Okello and Njiraini2013) which uses cross-sectional data from 375 households in Kenya, our study makes use of a large panel data set of 781 households covering the period mobile money was introduced and adopted by a few households and a period of rapid expansion of mobile money adoption. Our data provides us with good variation in mobile money adoption which enables us to identify the impact of mobile money on welfare outcomes and agricultural input adoption. Also, our study adds value to a growing literature on how mobile money affects small businesses.
Recent studies have shown that mobile money adoption increases productivity and investment in small businesses (Gosavi, Reference Gosavi2018; Ahmad, Green, and Jiang, Reference Ahmad, Green and Jiang2020; Islam and Muzi, Reference Islam and Muzi2021). Our study extends this growing literature by examining the impact of mobile money adoption on short-term agricultural investments, i.e. fertilizer and improved seeds adoption.
The main findings indicate that mobile money adoption increases per capita farm income by 13%. Mobile money adoption is associated with an 11 percentage point increase in the likelihood of adopting chemical fertilizer on maize plots. It also increases the likelihood of HYV maize seeds adoption in maize plots by 8.2 percentage points. In the Ugandan context of very limited adoption of modern agricultural inputs, mobile money provides a viable avenue to promote agricultural intensification.
The rest of the paper is organized as follows. Section 2 discusses the data and descriptive evidence, followed by empirical strategy in Section 3. Estimation results are discussed in Section 4 and Section 5 concludes the study.
2. Data and Descriptive Statistics
2.1. Data
This study uses household and community-level data collected in 2003, 2005, 2009, 2012, and 2015 by Makerere University, Foundation for Advanced Studies on International Development (FASID), and the National Graduate Institute for Policy Studies (GRIPS). The data collection was done under the Research on Poverty, Environment, and Agricultural Technology (RePEAT) project. The baseline survey conducted in 2003 covered 64 districts from which 94 local communities (LC1) were selected. From each local community, a random sample of 10 households was drawn.Footnote 1 In this study, we use balanced panel data of 781 households obtained from the 2012 and 2015 rounds of the RePEAT project.
The household-level component of the RePEAT survey captures information on demography, agriculture, income, health, education, financial services, land tenure, and migration among others. The community survey covers information on community characteristics such as; distance to market and district towns, conditions of roads, and availability of public services such as schools, hospitals, and telephone networks.
2.2. Descriptive Statistics
Table 1 stratifies households on mobile money adoption status. Adopter households are households with at least one household member having a mobile money account. In 2012, nonadopter households seem better off compared to adopter households. However, in 2015, adopter households seem better off compared to nonadopter households. In both survey years, nonadopters report higher farm income and lower remittances compared to adopter households. Also, adopter households have more assets compared to nonadopter households.Footnote 2
Summary statistics (mean) by year and mobile money adoption status

Note: Computed by author from RePEAT 2012 and 2015. 1$ = 2557UGX & 1$ = 2857UGX in 2012 and 2015, respectively (Bank of Uganda).
*, **, and *** indicate statistical significance of the difference of means (T- test) at 10%, 5%, and 1% levels, respectively.
UGX stands for Ugandan Shillings. HYV stands for high-yielding variety.
In terms of agricultural input use, Table 1 reveals interesting differences between the two categories. Mobile money adopters are more likely to have adopted fertilizer in 2012. In 2015, nonadopters are more likely to have adopted fertilizer. In both survey years, mobile money adopters are more likely to have adopted HYV seeds.
All in all, Table 1 suggests that the households in our data are typical smallholder African households characterized by large family sizes, small land holding, and limited adoption of modern farming technologies such as chemical fertilizers. The fact that these households receive remittances suggests that rural–urban migration might be common in our sample.
3. Empirical Strategy
In this section, we are going to estimate (1) the determinants of mobile money adoption in rural Uganda; (2) the impact of mobile money adoption on per capita farm and nonfarm income, disaggregated components of farm income, notably crop income, livestock income, and farm wage income; and (3) in examining pathways, we estimate the impact of mobile money adoption on the decision to adopt chemical fertilizers and modern seeds.Footnote 3
Table 1 suggest that the adoption of mobile money is not random. Households that have adopted mobile money are potentially different from households that have not adopted mobile money. For example, households might adopt mobile money because they expect to receive remittances. In this case, remittances might induce mobile money adoption, thus leading to reverse causality. We resort to instrumental variable estimation to address the endogeneity of mobile money adoption.
We use the log of distance to the nearest mobile money agent as an instrument for mobile money adoption. The rationale for such an instrument is that the decision to adopt mobile money heavily depends on proximity to mobile money agents. We expect that households that are closer to a mobile money agent are more likely to adopt the service compared to distant households. We argue that agent placement does not have any direct impact on households’ decisions to adopt modern input such as HYV seeds and fertilizer.
Firstly, the requirements to be a licensed agent are neither cumbersome nor rigorously implemented by the different mobile phone network operators.Footnote 4 This laxity is driven by the quest for market share. Consequently, the number of agents has increased astronomically in virtually all communities without any indication of selective placement. Given that the licensing of agents is exclusively the preserve of mobile phone companies, political influence, lobbying as well as strategic planning for placement in specific locations which may be correlated with other agricultural policies are unlikely. Following Tabetando and Matsumoto (Reference Tabetando and Matsumoto2020), we argue that most mobile money agents are traditional small shop owners who have expanded their business by providing mobile money services, consequently, a good number of the agents had already chosen their locations before the inception of mobile money.Footnote 5 As a caveat, it is possible that the adoption of mobile money services by shop owners is not random. Not all shop owners are mobile money agents. Shop owners who decided to serve as mobile money agents by providing mobile money services might be different from shop owners who do not serve as mobile money agents.
3.1. Determinants of Mobile Money Adoption
Given the potential endogenous nature of mobile money adoption, we adopt an instrumental variable approach. In the first stage estimation, we use the distance to the nearest mobile money agent as an exogenous determinant of mobile money adoption. The predicted probability of adopting mobile money obtained from the first stage estimation is used in estimating the impact of mobile money on welfare and modern input adoption. The decision to adopt mobile money services depends on observed characteristics of the household and community in the form:
 $${\rm MM}_{ijdt}=1\left\{\beta X_{ijdt}+\tau D_{ijdt}+\delta C_{jdt}+\gamma _{dt}+\varepsilon _{ijdt}\gt 0\right\},$$
where ${\rm MM}_{ijdt}$
is a binary indicator of mobile money adoption which takes 1 if household i in community j of district d has adopted mobile money at time t and 0 otherwise; X
ijdt
is a vector of controls of household i in community j of district d at time t. It includes household size, household head’s age, gender, education, log of household assets holding and landholding. D
ijdt
is the log of distance to the nearest mobile money agent of household i in community j of district d at time t. It is our main variable of interest providing an exogenous variation in mobile money adoption; C
jdt
is a vector of community-level controls of community j in district d at time t. It includes population density, distance in km from the community to the nearest district town, and market. γ
dt
is expected to capture the influence of district-time-specific factors including unobservable factors.
${\rm MM}_{ijdt}$
is a binary indicator of mobile money adoption which takes 1 if household i in community j of district d has adopted mobile money at time t and 0 otherwise; X
ijdt
is a vector of controls of household i in community j of district d at time t. It includes household size, household head’s age, gender, education, log of household assets holding and landholding. D
ijdt
is the log of distance to the nearest mobile money agent of household i in community j of district d at time t. It is our main variable of interest providing an exogenous variation in mobile money adoption; C
jdt
is a vector of community-level controls of community j in district d at time t. It includes population density, distance in km from the community to the nearest district town, and market. γ
dt
is expected to capture the influence of district-time-specific factors including unobservable factors.
Equation (1) is estimated using a nonlinear estimator (Probit). We follow the literature in also estimating equation (1) using a linear probability model to rule out the effect of unobserved time-invariant household and village characteristics.Footnote 6
3.2. Mobile Money, Farm, and Nonfarm Income
The impact of mobile money adoption on components of household income is estimated in the second stage of the instrumental variable estimation. The predicted probabilities of adopting mobile money from the first stage estimation are used in the second stage estimation.
The impact of mobile money adoption on different components of household income is specified as follows:
 $$ Y_{ijdt}=\alpha +\lambda _{i}+{\delta _{\rm PM}}{\rm PM}_{ijdt}+{\delta _{X}}X_{ijdt}+{\delta _{C}}C_{jdt}+\gamma _{dt}+\omega _{ijdt},$$
where Y
ijdt
is per capita income, per capita farm, per capita nonfarm income, or per capita remittance of household i in community j of district d at time t; λ
i
is household fixed effects; $\alpha$
is the intercept.
$\alpha$
is the intercept. ${\rm PM}_{ijdt}$
is the predicted probability of mobile money adoption of household i in community j of district d at time t; The vector X
ijdt
holds household-level characteristics of household i in community j of district d at time t; C
jdt
is a vector of community-level controls of community j in district d at time t. Community-level controls entail; log of distance measured in km from the community to the nearest market and district town and community population density. Community-level covariates strengthen the conditional independence of mobile money adoption from the random error term (
${\rm PM}_{ijdt}$
is the predicted probability of mobile money adoption of household i in community j of district d at time t; The vector X
ijdt
holds household-level characteristics of household i in community j of district d at time t; C
jdt
is a vector of community-level controls of community j in district d at time t. Community-level controls entail; log of distance measured in km from the community to the nearest market and district town and community population density. Community-level covariates strengthen the conditional independence of mobile money adoption from the random error term ( $\omega _{ijdt}$
). γ
dt
is expected to capture the influence of district-time-specific factors including unobserved factors.
$\omega _{ijdt}$
). γ
dt
is expected to capture the influence of district-time-specific factors including unobserved factors. $\delta _{\rm PM}$
is the parameter of our interest capturing the impact of mobile money adoption on components of household income conditional on other covariates.
$\delta _{\rm PM}$
is the parameter of our interest capturing the impact of mobile money adoption on components of household income conditional on other covariates.
3.3. Mechanism
3.3.1. Mobile Money and Input Use
In examining the mechanisms through which mobile money adoption induces welfare, we estimate the impact of mobile money adoption on a household’s decision to adopt modern agricultural inputs such as chemical fertilizers and HYV seeds. As explained earlier, we instrument for mobile money adoption using the distance to mobile money agent. In the second stage estimation, we relate mobile money adoption (predicted from the first stage) at the household level to input use at the plot level as follows:
 $$I_{\textit{psijdt}}=\alpha +\lambda _{i}+{\psi _{\rm PM}}{\rm PM}_{ijdt}+{\psi _{X}}X_{ijdt}+{\psi _{P}}P_{p}+{\psi _{C}}C_{jdt}+\mu _{\textit{psijdt}}$$
where I is an indicator of fertilizer or HYV seeds adoption on plot p in season s of household i in community j of district d. ${\rm PM}_{ijdt}$
is the predicted probability of mobile money adoption of household i in community j of district d. X
ijdt
is a vector of household levels controls of household i in community j of district d. The vector P holds plot-specific attributes such as a binary indicator of inter-cropped plots, time in minutes from homestead to plot p, and an indicator of maize plots. C
jdt
is a vector of community-level controls of community j in district d. Community-level controls entail log of distance measured in km from the community to the nearest market and district town and community population density.
${\rm PM}_{ijdt}$
is the predicted probability of mobile money adoption of household i in community j of district d. X
ijdt
is a vector of household levels controls of household i in community j of district d. The vector P holds plot-specific attributes such as a binary indicator of inter-cropped plots, time in minutes from homestead to plot p, and an indicator of maize plots. C
jdt
is a vector of community-level controls of community j in district d. Community-level controls entail log of distance measured in km from the community to the nearest market and district town and community population density. $psi_{\rm PM}$
is our parameter of interest and is expected to enter the regression positively.
$psi_{\rm PM}$
is our parameter of interest and is expected to enter the regression positively. $\lambda _{i}$
is household fixed effects. μ
pijdt
is a random error term with standard properties, and
$\lambda _{i}$
is household fixed effects. μ
pijdt
is a random error term with standard properties, and $\alpha$
is the intercept.
$\alpha$
is the intercept.
4. Results
4.1. Determinants of Mobile Money Adoption
The estimation results of equation (1) are presented in Table 2 alongside some instrumental variable diagnostic tests. The Cragg–Donald F statistics from the first stage estimation is 56.33, suggesting that the instrument has a strong impact on a household’s decision to adopt mobile money. We test and report the LM underidentification test statistics. We reject the null hypothesis of underidentification. We also test for endogeneity and report the Durbin–Wu–Hausman test statistics (reported in Tables 3 and 4). Given that the test statistics range from 8.8 to 1.79 depending on the outcome variable of interest, we reject the null hypothesis that mobile money adoption is exogenous. This justifies the use of the instrumental variable approach.
Determinants of mobile money adoption (first-stage instrumental variable estimation)
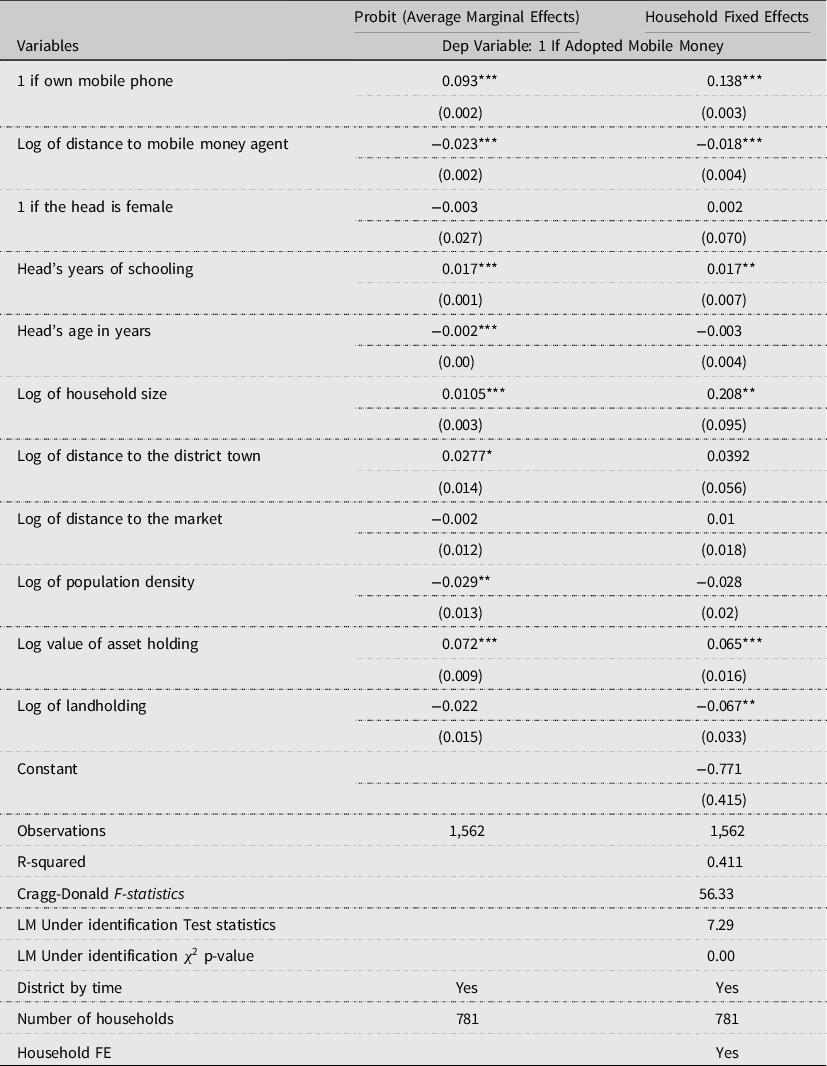
Community clustered standard errors in parenthesis.
Sample consists of panel households interviewed in 2012 and 2015.
Additional controls include: Number of men, women, and children and an indicator of improved cattle ownership.
*, **, and *** indicate statistical significance at 10%, 5%, and 1% levels, respectively.
Mobile money, farm, and nonfarm income (main estimation)
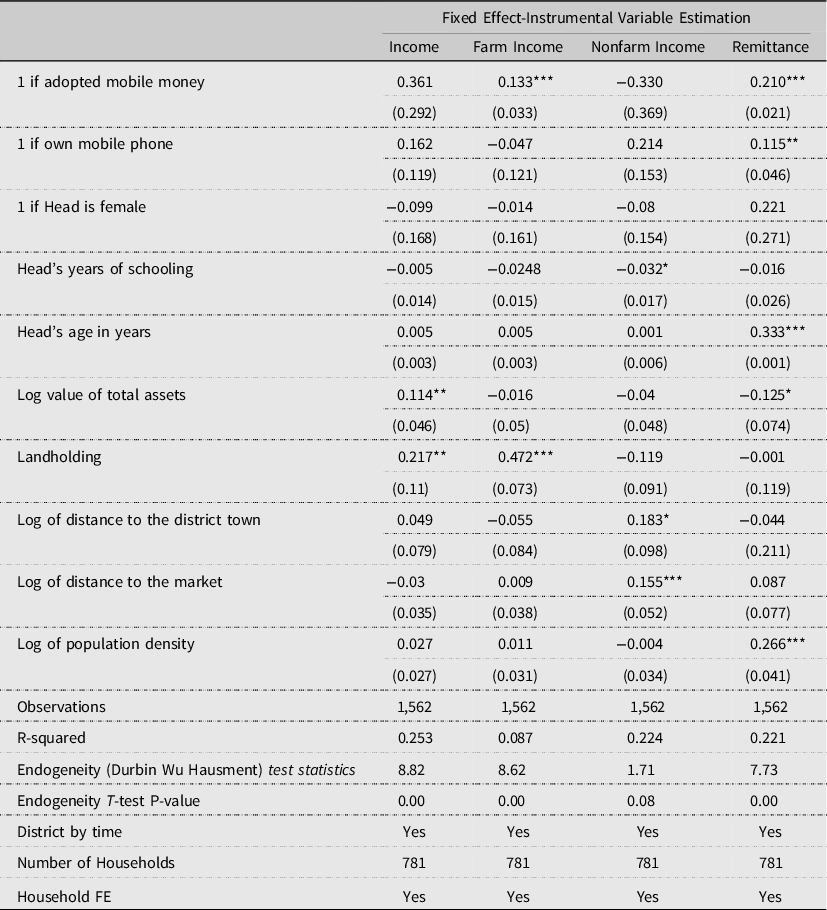
First stage results are reported in Table 2. Log of distance to the nearest mobile money agent is used as an instrument for mobile money adoption.
Additional controls include: Number of Men, Women, and Children and indicators of improved cattle ownership.
Robust standard errors are reported in parenthesis.
*, **, and *** indicate statistical significance at 10%, 5%, and 1% levels, respectively.
Impact of Mobile Money on Chemical fertilizer and Improved Seeds adoption

First stage results are reported in Table 2. Log of distance to the nearest mobile money agent is used as an instrument for mobile money adoption.
Estimation sample comprises a pooled sample of maize and beans plots reported in RePEAT 2012 & 2015.
Additional controls include: Household size, Altitude and soil quality(nitrogen content).
The third column is estimated using a restricted sample of plots on which at least HYV and/or fertilizer is applied.
*, **, and *** indicate statistical significance at 10%, 5%, and 1% levels, respectively.
HYV stands for high-yielding variety.
Robust standard errors are in parenthesis.
The estimation results of equation (1) are qualitatively similar across columns. The key determinants of mobile money adoption are mobile phone ownership, distance to mobile money agent, and household characteristics such as household size, head’s years of schooling, and head’s age. Using previous waves of this same data set, Munyegera and Matsumoto (Reference Munyegera and Matsumoto2016) report that mobile phone ownership increases the likelihood of adopting mobile money by 11 percentage points. Column 2 in Table 2 suggests that mobile phone ownership increases the likelihood of mobile money adoption by 13.8 percentage points. In Tanzania, Riley (Reference Riley2018) reports that mobile phone ownership increases the likelihood of adopting mobile money by 17.5 percentage points. Distance in km to the nearest mobile money agent is another significant determinant of mobile money adoption. A 1-km increase in the distance to a mobile money agent reduces the probability of mobile money adoption by at least 1.8 percentage points. Munyegera and Matsumoto (Reference Munyegera and Matsumoto2016) report at least a 4.4 percentage points decrease in the likelihood of adopting mobile money if the distance to the agent increases by 1 km. Riley (Reference Riley2018) finds that the presence of a mobile money agent in a village in Tanzania increases the likelihood of mobile money adoption by 25 percentage points. On a whole, accessibility to mobile money agents remains an important determinant of household adoption of mobile money. Other important determinants of mobile money adoption are asset holding, age and years of schooling of household head, distance in km to the nearest district town, and population density.
4.2. Mobile Money, Farm, and Nonfarm Income: Instrumental Variable Results
Instrumental variable results are presented in Table 3. We use the log of distance to the nearest mobile money agent measured in kilometers at the community level as an instrument for mobile money adoption. In the first stage regression, we regress a binary indicator of mobile money adoption on the log of distance to the nearest mobile money agent and a vector of household and community level controls [equation (1)].
The dependent variables for columns 1–4 of Table 3 are per capita income, per capita farm income, per capita nonfarm income, and per capita remittances respectively. All outcome variables are in logarithmic form. Mobile money adoption on average increases farm income by at least 13% as shown in column 2. In the context of Kenya, Kikulwe, Fischer, and Qaim (Reference Kikulwe, Fischer. and Qaim2014) report a 40% increase in farm income induced by the adoption of mobile money. Yao and Shanoyan (Reference Yao and Shanoyan2018) show that the increase in farm income for farmers who have adopted mobile money is driven by increased participation in high earn markets. They report that mobile money adoption induces farmers in Ivory Coast and Tanzania to sell more of their products in urban markets compared to farm gate markets. The costs of these long-distance sales transactions are greatly reduced by payments through mobile phones.
We do not find any significant impact of mobile money on nonfarm income. This is unexpected given that some recent studies in SSA (Gosavi, Reference Gosavi2018; Ahmad, Green, and Jiang, Reference Ahmad, Green and Jiang2020; Islam and Muzi, Reference Islam and Muzi2021) have shown that mobile money adoption induces productivity and income gains in small businesses. One reason might be that the households in our sample are facing barriers to accessing productive off-farm opportunities. We find a significant impact on remittances in the last column.
We do not find any significant impact of mobile money adoption on total income (column 1). This is unexpected and we do not have any convincing explanation. Tentatively, it may suggest that mobile money adoption has a substitution effect on income portfolio. That is, mobile money might induce decreases(increases) in some sources of household income thereby having a zero net effect on total income. Also, it might suggest some weaknesses in the instrumental variable approach.
On a whole, the results presented in Table 3 suggest that mobile money adoption enhances farm income (Kikulwe, Fischer, and Qaim, Reference Kikulwe, Fischer. and Qaim2014). We posit that increases in remittance receipts through mobile money may be partly used to finance short-term investment in agriculture.Footnote 7 As is the case with all instrumental variable estimations, our estimates are Local Average Treatment Effects (LATE). These estimates cannot be generalized. They are only valid for the complier subsample, i.e. households that adopted mobile money because of proximity to mobile money agents.
4.3. Mechanism
4.3.1. Mobile Money and Input use
The result from estimating equation (3) is presented in Table 4. The results suggest that mobile money adoption increases the likelihood of fertilizer and HYV seed adoption in maize plots by 11 and 8.2 percentage points, respectively. Most importantly it increases the likelihood of the joint adoption of fertilizer and HYV seeds by 4.4 percentage points conditional on the adoption of at least one of these modern inputs. Similar results have been reported in other studies. Kikulwe, Fischer, and Qaim (Reference Kikulwe, Fischer. and Qaim2014) find that Kenyan farmers who have adopted mobile money spend 30 USD and 15 USD more on chemical fertilizer and pesticides, respectively. In their study on smallholder rice farmers in Ghana, Rahaman and Abdulai (Reference Rahaman and Abdulai2022) show that adopters of mobile money applied 18% and 13% more fertilizers and herbicides, respectively, than nonadopters.
Closely related to mobile money, mobile phones also have a significant effect on modern input adoption albeit smaller than the effect of mobile money. The positive impact of mobile phones on smallholder agriculture has been well documented even before the advent of mobile money (Muto and Yamano, Reference Muto and Yamano2009; Ogutu, Okello, and Otieno Reference Ogutu, Okello and Otieno2014; Krell et al., Reference Krell, Giroux, Guido, Hannah, Lopus, Caylor and Evans2021). Mobile phone enhances access to information such as weather and price information and reduces transaction costs among others.
4.4. Mobile Money, Farm, and Nonfarm Income (Robustness Check)
For robustness purposes, we estimate and briefly discuss a basic variant of equation (2) estimated using only household fixed effects. These results are presented in Table 5. All outcome variables are in logarithmic form.Footnote 8 Mobile money adoption on average increases per capita income by at least 20%. We do not find any significant impact of mobile money on nonfarm income. As expected, the impact of mobile money adoption on remittances is significant.
Mobile money, farm, and nonfarm income (robustness check)
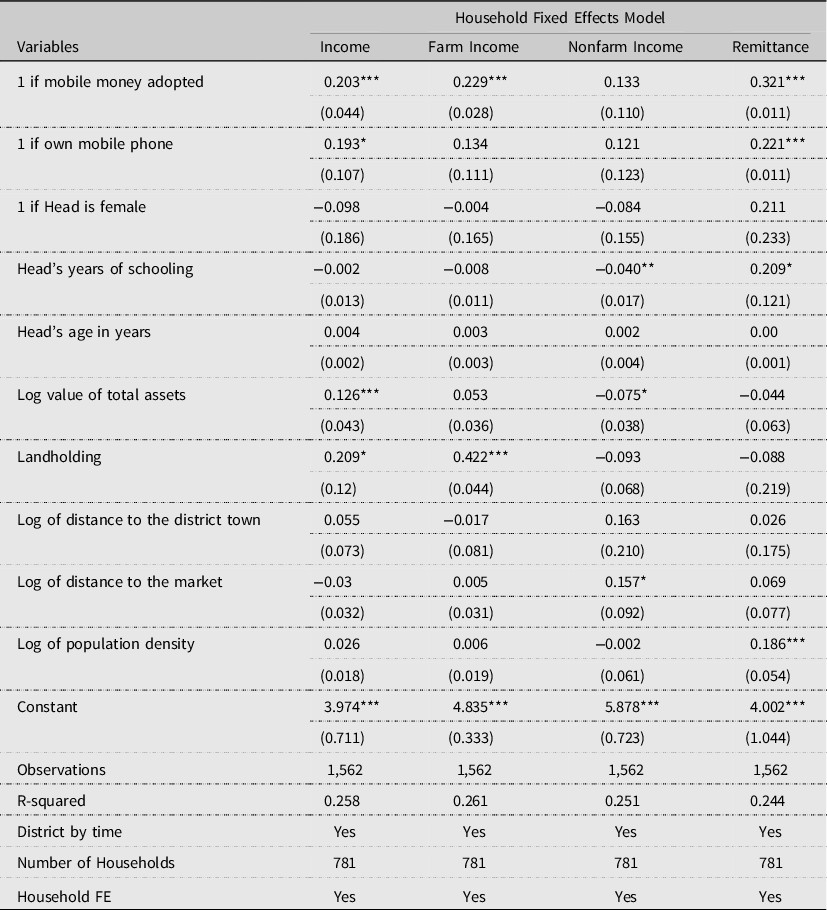
Community clustered standard errors in parenthesis.
Additional controls include: Number of men, women, and children and an indicator of improved cattle ownership.
Sample consists of panel households interviewed in 2012 and 2015.
Outcome variables are in logarithmic form.
*, **, and *** indicate statistical significance at 10%, 5%, and 1% levels, respectively.
On a whole, the evidence presented in Tables 3 and 5 supports our claim that mobile money adoption induces larger farm income. Previous studies (Jack and Suri, Reference Jack and Suri2014; Munyegera and Matsumoto, Reference Munyegera and Matsumoto2016) have linked mobile money adoption to greater per capita consumption via remittance receipt. Munyegera and Matsumoto (Reference Munyegera and Matsumoto2016) find that households that have adopted mobile money receive twice as much remittances as households that have not adopted mobile money. In terms of the likelihood of receiving remittances, Riley (Reference Riley2018) reports a 15.4 percentage point increase associated with mobile money adoption in Tanzania. Though we do not provide direct evidence, Table 4 suggests that remittance receipt via mobile money may not only be used to smooth consumption but may also be used to finance short-term agricultural investment.Footnote 9
5. Summary and Concluding Remarks
Recent studies have shown that mobile money adoption induces productivity and investment in small businesses in Sub-Saharan Africa (Gosavi, Reference Gosavi2018; Ahmad, Green, and Jiang Reference Ahmad, Green and Jiang2020; Islam and Muzi, Reference Islam and Muzi2021). In this article, we have examined the impact of mobile money adoption on short-term agricultural investment notably the adoption of improved seeds and chemical fertilizers. The main results of our analyses show that households that have adopted mobile money are more likely to adopt chemical fertilizers and improved seeds thereby inducing farm income.
These results imply that digital financial services such as mobile money can be effective in enhancing agricultural technology adoption and productivity. Unlike traditional financial services such as bank accounts, subscription to digital financial services such as mobile money is easier, faster, and cheaper. Mobile money provides an opportunity to enhance financial inclusion in rural Africa. In aggregate terms, mobile money induces significant economy-wide income gains. For example, a recent study in Kenya shows that the introduction of mobile money technology in 2007 can explain 10% of the per-capita income growth between 2007 and 2013 thus pointing to quantitatively significant macroeconomic effects of mobile money technology (Beck et al., Reference Beck, Pamuk, Ramrattan and Uras2018).
Fully harnessing the benefit of mobile money will require improvements in telephone network coverage. The effectiveness of mobile money depends on the availability and quality of the telephone network. In many parts of rural Uganda, the telephone network remains patchy. Also, further expansion of mobile money service points(agents) will enhance adoption in remote areas.
For further research, a disaggregated analysis of the distribution of the benefits of mobile money across income quintiles and gender would help identify the winners and losers of mobile money.
Author Contributions
Conceptualization: R.T., D.C.R.F., and T.M.; Methodology: R.T. and T.M.; Formal analysis: R.T. and D.C.R.F.; Data curation: R.T. and T.M.; Writing—original draft: R.T; Writing—review and editing: T.M. and D.C.R.F.; Supervision: T.M.; Funding acquisition: T.M.
Financial Support
Japan Society for the Promotion of Science, Grant/Award Number: JSPS KAKENHI Grant Number 18H00838 and JSPS KAKENHI Grant Number 25101002.
Appendix A
Mobile money and disaggregated farm income

Community clustered standard errors in parenthesis.
Additional controls include: number of men, women, and children and an indicator of improved cattle ownership.
Sample consists of panel households interviewed in 2012 and 2015.
*, **, and *** indicate statistical significance at 10%, 5%, and 1% level, respectively.
Impact of mobile money on chemical fertilizer, hired labor, and improved seeds adoption

Community clustered standard errors in parenthesis.
Additional controls include: Number of men, women, and children and an indicator of improved cattle ownership.
Sample consists of panel households interviewed in 2012 and 2015.
*, **, and *** indicate statistical significance at 10%, 5%, and 1% levels, respectively.
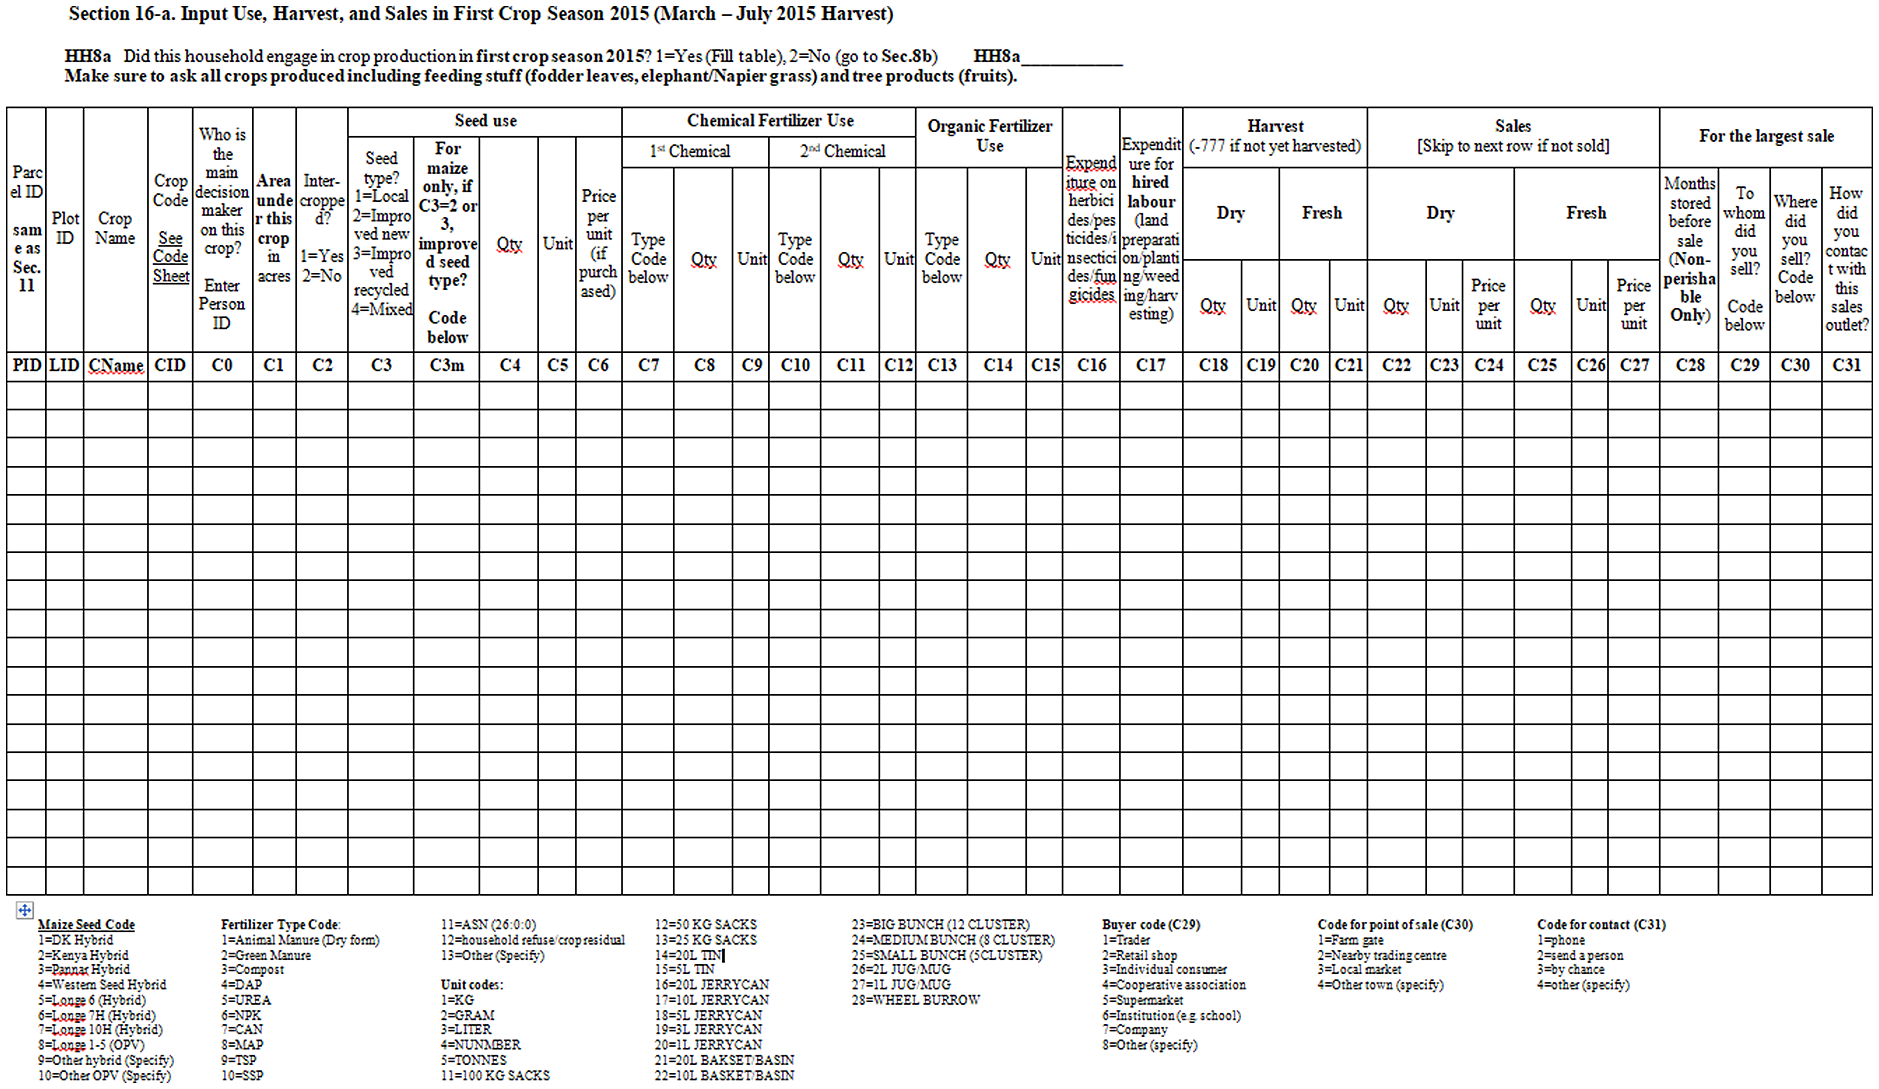
Sample of Questionnaire


 Open access