


1. Background
Health is deeply social—shaped recursively by the structure and dynamics of our social connections. Voluntary associations—spaces where people choose to connect—offer a unique lens through which to examine how social networks shape health outcomes. Our networks not only channel communicable diseases, but are also crucial determinants of non-communicable health outcomes, such as cognitive decline (Kuiper et al., Reference Kuiper, Zuidersma, Zuidema, Burgerhof, Stolk, Oude Voshaar and Smidt2016), dementia (Kuiper et al., Reference Kuiper, Zuidersma, Voshaar, Zuidema, van den Heuvel, Stolk and Smidt2015), depression (Reiner et al., Reference Reiner, De Gioannis and Steinhoff2025), and premature mortality (Holt-Lunstad et al., Reference Holt-Lunstad, Smith, Layton and Brayne2010). Conversely, health declines can lead to social network contraction, with individuals in poor health often withdrawing from social ties, forming smaller, more localized networks, and occupying less central social positions than their healthier peers (Copeland et al., Reference Copeland, Kamis and West2023; Haas et al., Reference Haas, Schaefer and Kornienko2010).
Historically, much of the empirical work examining network dynamics and health has been conducted in constrained settings such as schools, workplaces, and other institutional contexts (Chancellor et al., Reference Chancellor, Layous, Margolis and Lyubomirsky2017; Copeland et al., Reference Copeland, Kamis and West2023; Haas et al., Reference Haas, Schaefer and Kornienko2010). In these environments, social ties are often formed under implicit assumptions of compulsion and sorting—students are assigned to classes, employees to teams, and retirement residents to floors—so that entry, exit, and interaction rhythms are externally governed. In these settings, individuals are confined to a limited pool and tend to form homophilous ties with others who share similar characteristics (McPherson et al., Reference McPherson, Smith-Lovin and Cook2001). Research has provided evidence for health-based homophily in schools (Crosnoe et al., Reference Crosnoe, Frank and Mueller2008; Schaefer et al., Reference Schaefer, Kornienko and Fox2011; Van Zalk et al., Reference Van Zalk, Kerr, Branje, Stattin and Meeus2010a), workplaces (Chancellor et al., Reference Chancellor, Layous, Margolis and Lyubomirsky2017), retirement residents (Schafer, Reference Schafer2016) and low-income senior housing (Flatt et al., Reference Flatt, Agimi and Albert2012). Particularly in older adulthood, health often becomes a salient factor in shaping social networks, as individuals and their environments face increasing health challenges (Wrzus et al., Reference Wrzus, Hänel, Wagner and Neyer2013). Such mechanisms of homophilous sorting and network formation are shaped by the inherent constraints of these environments. However, these scope conditions—critical to understanding how social networks and health interact—remain underspecified in the literature.
This study asks whether the results identified in these sorts of settings hold generally in the fully voluntary contexts we study here, which have rarely been studied. While research on social networks in voluntary settings is scarce, studies on religious affiliations provides some guidance (Nam et al., Reference Nam, Jung, Whittemore, Latkin, Kershaw, Redeker and Vlahov2019, Reference Nam, Jung, Vlahov, Latkin, Kershaw, Whittemore and De Benedictis2023); though these tend to be semi-constrained by factors such as denomination and region. Fully voluntary contexts differ fundamentally from institutional contexts. They operate under continuous self-selection, as members choose whether to join and stay based on individual costs, benefits, and personal needs (Rawlings et al., Reference Rawlings, Smith, Moody and McFarland2023). Older adults in particular may actively use clubs as an agency strategy to maintain a social network and alleviate loneliness (Donnelly & Hinterlong, Reference Donnelly and Hinterlong2010; Jongenelis et al., Reference Jongenelis, Jackson, Newton and Pettigrew2022; Steinhoff et al., Reference Steinhoff, Ellwardt and Wermeyer2024). Because the very act of membership is voluntary, the feedback loop between health and social networks may play out differently than in institutional settings—both in the direction and magnitude of peer influence, and in how individuals may cope with declining health through selective compensation. This study aims to investigate these dynamics, addressing the research question: How does health shape social networks in fully voluntary settings, and vise versa?
To address this research question, we use whole network data from two clubs in North-Rhine Westphalia, Germany, and apply Stochastic Actor-Oriented Models (SAOM). This approach allows us to examine the dynamic nature of networks in relation to health while properly accounting for these higher-order structural factors. Specifically, we distinguish between selection (how health predicts tie formation) and influence (how network members affect subsequent health), as well as self-rated, mental and physical health as network processes may differ by health condition. The findings reveal a divergence from patterns observed in more constrained settings. We found no evidence of peer influence on health across all health measures. Furthermore, results suggest some homophilous sorting of social relations along the lines of self-rated health. Additionally, we find evidence for social avoidance only among those in poor physical health. We observe reversed effects—instead of withdrawing, individuals in poorer health are sometimes more central within the social network based on outdegree, possibly leveraging these connections as a form of social compensation. This challenges existing assumptions and highlights the need to reconsider the underlying mechanisms linking health and social networks in fully voluntary contexts.
2. Theory
Close relationship networks consistently show patterns of segregation along various social categories, including gender, age, and educational background (McPherson et al., Reference McPherson, Smith-Lovin and Cook2001). According to Wimmer and Lewis (Reference Wimmer and Lewis2010), such segregation arises from a combination of factors: the availability of potential connections (opportunity structures), dynamics within the network itself, and individuals’ tendencies to favor relationships with those who share similar social characteristics—a phenomenon known as homophily. Homophily has been found to occur among those with similar occupational statuses, gender, race and ethnic group, and beliefs and values (McPherson et al., Reference McPherson, Smith-Lovin and Cook2001). Homophilous ties are more likely to be activated for support because similarity facilitates communication, increases predictability, promotes trust and reciprocity, and reduces conflict (McPherson et al., Reference McPherson, Smith-Lovin and Cook2001; Suitor & Keeton, Reference Suitor and Keeton1997). Health was also found to be an important determinant along which social networks are structured. Research has provided evidence for health-based homophily in schools (Crosnoe et al., Reference Crosnoe, Frank and Mueller2008; Schaefer et al., Reference Schaefer, Kornienko and Fox2011), workplaces (Chancellor et al., Reference Chancellor, Layous, Margolis and Lyubomirsky2017), retirement residents (Schafer, Reference Schafer2016) and low-income senior housing (Flatt et al., Reference Flatt, Agimi and Albert2012).
There are two general mechanisms that help to explain why health-based homophily is commonly observed within networks: selection and influence (McPherson et al., Reference McPherson, Smith-Lovin and Cook2001). Selection refers to the tendency of individuals to form social ties based on personal preferences, shared characteristics, or contextual factors. In contrast, influence highlights how individuals affect each other’s behaviors, attitudes, and health outcomes through ongoing social interactions. These mechanisms—selection and influence—are not mutually exclusive; together, they shape the structure and dynamics of social networks and their impact on health. While the relative importance of each mechanism may vary across contexts, much of the existing research has focused on constrained environments, such as schools or workplaces, where opportunities for tie formation are often limited by structural or institutional factors. Less is known about how these processes operate in more voluntary and self-directed environments, where individuals exercise greater agency in choosing their social connections.
2.1. Network selection and health
Selection processes have been particularly emphasized in the study of health-based homophily (Crosnoe et al., Reference Crosnoe, Frank and Mueller2008). Scholars have observed that individuals with similar health statuses often form close ties, especially in contexts where health challenges are salient. Depressed adolescents are often avoided by peers, leaving them with few friendship options beyond others experiencing similar mental health challenges (Hogue & Steinberg, Reference Hogue and Steinberg1995; Schaefer et al., Reference Schaefer, Kornienko and Fox2011). Comparable patterns have been observed among adolescents with obesity (Crosnoe et al., Reference Crosnoe, Frank and Mueller2008). Among older adults, health-based homophily also emerges, as retirement residents were found to interact more frequently with peers who share similar health statuses (Schafer, Reference Schafer2016). Particularly in older adults, health status may become a more salient factor in determination of who is friends with whom, as individuals and their environments face increasing health challenges (Wrzus et al., Reference Wrzus, Hänel, Wagner and Neyer2013).
Evidence for health-based homophily has mostly been tested in constrained settings, like schools (Crosnoe et al., Reference Crosnoe, Frank and Mueller2008; Schaefer et al., Reference Schaefer, Kornienko and Fox2011), workplaces (Chancellor et al., Reference Chancellor, Layous, Margolis and Lyubomirsky2017), retirement residents (Schafer, Reference Schafer2016) and low-income senior housing (Flatt et al., Reference Flatt, Agimi and Albert2012). A key assumption underlying these settings is that individuals form social ties within a fixed pool of potential connections. This fixed pool often exhibits pre-existing demographic or socio-economic similarities due to systemic factors such as institutional policies or societal segregation (McPherson et al., Reference McPherson, Smith-Lovin and Cook2001). Consequently, individuals are more likely to encounter others who share similar characteristics.
Additionally, external factors—such as institutional hierarchies in workplaces or assigned classrooms in schools—further segment individuals into specific subgroups, narrowing their choices for potential connections (McPherson et al., Reference McPherson, Smith-Lovin and Cook2001; Moody, Reference Moody2001). Even in voluntary settings, these constraints persist, as the options available are inherently limited. This constrained structure increases the likelihood of homophilous ties forming. Building on this theoretical foundation, we extend these expectations to health-based homophily. We posit that even in less constrained or fully voluntary settings, the general patterns of homophilous selection should hold. Based on this reasoning, we propose the following hypothesis:
Hypothesis 1 (Selection): Health similarity predicts the presence of close ties.
In general, networks reflect competing preferences to associate with individuals that are perceived as highly desirable (e.g., Martin, Reference Martin2009). Individuals tend to form social ties with those perceived as successful, attractive, or in good health—traits commonly associated with higher social status within a group (Centola & Van De Rijt, Reference Centola and Van De Rijt2015). Conversely, poor health is a stigmatized condition (Link & Phelan, Reference Link and Phelan2001). Particularly when it is both visible and stigmatized, poor health has been shown to shape adolescents’ friendship formations (Ali et al., Reference Ali, Amialchuk and Rizzo2011; Crosnoe et al., Reference Crosnoe, Frank and Mueller2008). Similarly, research indicates that older adults experiencing depression tend to have smaller social networks (for a review, see Reiner & Steinhoff, Reference Reiner and Steinhoff2024). Several mechanisms may underlie the social avoidance of individuals in poor health.
First, individuals in poor health may be viewed as less appealing companions due to their limited ability to engage consistently in shared group activities (Galenkamp & Deeg, Reference Galenkamp and Deeg2016). Second, the social stigma attached to certain health conditions may lead others to avoid association with them, potentially out of concern for their own social reputation (Crosnoe et al., Reference Crosnoe, Frank and Mueller2008; Haas et al., Reference Haas, Schaefer and Kornienko2010). As a result, individuals in poor health may receive fewer close tie nominations from others, indicating a process of social avoidance.
Hypothesis 2 (Social avoidance): People in poor health will be less likely to receive close tie nominations.
In particular, we expect that those with more visible health issues will be avoided more than those with less visible health issues, which suggests a stronger effect of physical health.
Conversely, individuals experiencing poor health may engage in behaviors like concealing their condition or withdrawing from social situations, which can inadvertently contribute to their social isolation (Link, Reference Link1987; Link et al., Reference Link, Cullen, Struening, Shrout and Dohrenwend1989). Anticipating stigma or negative social interactions, they may withdraw themselves from social relationships as a protective strategy (Link & Phelan, Reference Link and Phelan2001). This is expected to hold particularly for stigmatized conditions, mostly associated with mental health. According to the Cognitive Theory of Depression (Beck, Reference Beck1967, Reference Beck1979), distorted thought patterns can cause individuals to overlook or dismiss positive social experiences. This bias may strain relationships and contribute to social withdrawal. Similarly, diminished positive reinforcement from social interactions can intensify the withdrawal and depressive symptoms in a downward cycle (Lewinsohn, Reference Lewinsohn, Friedman and Katz1974). As a result, we expect individuals in poor health to send fewer close tie nominations to others, particularly those with poor mental health, indicating a process of withdrawal:
Hypothesis 3 (Withdrawal): People in poor health will be less likely to nominate others as close ties.
2.2. Network influence and health
The other mechanism underlying health-based homophily is network influence, as proposed by Social Contagion Theory (Christakis & Fowler, Reference Christakis and Fowler2013). It suggests that individuals are influenced by their social contacts, who are themselves shaped by their own networks. This social contagion has been shown for multiple non-communicable health outcomes, including obesity, loneliness, depression, and happiness in the general population (Cacioppo et al., Reference Cacioppo, Fowler and Christakis2009; Christakis & Fowler, Reference Christakis and Fowler2007; Fowler & Christakis, Reference Fowler and Christakis2008; Rosenquist et al., Reference Rosenquist, Fowler and Christakis2011).
In physical health, peer effects are mostly attributed to the gradual adoption of health behaviors (Christakis & Fowler, Reference Christakis and Fowler2007). These effects are thus expected to happen over a longer time period. Christakis and Fowler (Reference Christakis and Fowler2007) found obesity to spread through networks over the time period of 32 years. Peer influence effects of health behaviors, such as smoking (Mercken et al., Reference Mercken, Steglich, Sinclair, Holliday and Moore2012; Schaefer et al., Reference Schaefer, adams and Haas2013), eating (De La Haye et al., Reference De La Haye, Robins, Mohr and Wilson2013; Hutchinson & Rapee, Reference Hutchinson and Rapee2007) or exercising (De La Haye et al., Reference De La Haye, Robins, Mohr and Wilson2011) has been empirically widely confirmed in school settings. Beyond adolescence, evidence is scarce and largely based on selective samples from social media platforms, often involving highly motivated, health-conscious individuals (Aral & Nicolaides, Reference Aral and Nicolaides2017; Franken et al., Reference Franken, Bekhuis and Tolsma2023), potentially exaggerating peer influence effects.
For mental health, emotional contagion is the dominant mechanism (Hatfield et al., Reference Hatfield, Cacioppo and Rapson1993), spreading both positive and negative emotional states through automatic mimicry or conscious processes like co-rumination (Block & Burnett Heyes, Reference Block and Burnett Heyes2022; Hill et al., Reference Hill, Rand, Nowak and Christakis2010; Lakey & Tanner, Reference Lakey and Tanner2013; Van Zalk et al., Reference Van Zalk, Kerr, Branje, Stattin and Meeus2010b). Emotional contagion has been described to occur over a short timescale (Hill et al., Reference Hill, Rand, Nowak and Christakis2010), while clinically relevant depressive states can also spread between contact over longer timescales (Joiner & Katz, Reference Joiner and Katz1999; Kensbock et al., Reference Kensbock, Alkærsig and Lomberg2022; Ueno, Reference Ueno2005).
Generally, health is expected to spread through the network. This phenomenon reflects health-based homophily as a result of social influence, net of selection. Therefore, we hypothesize:
Hypothesis 4 (Influence): Changes in adults’ health are predicted by the average health of their close ties.
2.3. Study context
Much of the existing research on the relationship between social networks and health dynamics has been examined in constrained settings, where imposed structures shape interactions and may obscure underlying network formation and health dynamics. However, social life also occurs in fully voluntary settings, where individuals have greater agency in choosing their social ties. This distinction is particularly relevant for older adults, who often face shrinking social networks due to retirement, health decline, and other life course transitions (Wrzus et al., Reference Wrzus, Hänel, Wagner and Neyer2013). To counteract social isolation, older adults frequently turn to formal social participation, especially volunteering, as a key strategy to maintain and expand their networks and alleviate loneliness (Donnelly & Hinterlong, Reference Donnelly and Hinterlong2010; Jongenelis et al., Reference Jongenelis, Jackson, Newton and Pettigrew2022). Volunteering—defined as non-mandatory, unpaid work for an organization or community (Donnelly & Hinterlong, Reference Donnelly and Hinterlong2010)—has been widely recognized for its contributions to healthy aging. It is associated with numerous positive health outcomes, including improved self-rated health, greater life satisfaction, reduced mortality, lower levels of depressive symptoms, and decreased functional dependence (Greenfield & Marks, Reference Greenfield and Marks2004; Webster et al., Reference Webster, Ajrouch and Antonucci2021).
This study focuses on carnival clubs in a region in Germany that organize annual cultural festivities around the Carnival season. Carnival is a lively and traditional festival filled with parades, music, costumes, and parties, celebrating the lead-up to Lent in the Christian calendar. Deeply rooted in the region’s history and culture, it emphasizes the local dialect, customs, and a strong sense of community. Carnival clubs extend their activities beyond the carnival period, engaging members in year-round social interactions and meetings, such as organizing a summer festival, at least monthly informal gatherings and charity events. In qualitative interviews of members of carnival clubs published elsewhere (Steinhoff et al., Reference Steinhoff, Ellwardt and Wermeyer2024), the primary reason for joining carnival clubs was not carnival itself but rather the sense of community it provided. In this regard, carnival clubs facilitate the formation of a social network with minimal effort, as maintaining contacts is not contingent on continuous engagement. Additionally, members in retirement used these carnival clubs as a proactive approach to attain a sense of purpose and to compensate for the role and status loss associated with retirement. Engagement in these clubs enhanced the perception of being useful and necessary, which are crucial contributors to well-being (Steinhoff et al., Reference Steinhoff, Ellwardt and Wermeyer2024).
This makes them an ideal case for studying the interplay between social networks and health in voluntary settings, particularly for middle-aged and older adults. First, these associations provide a voluntary leisure setting in which informal socializing takes place in a heterogeneous group, outside the contexts of family, neighborhood, and work organizations (cf. Granovetter, Reference Granovetter1973). Second, they often include a disproportionate share of adults in the second half of life. Third, because membership is formally defined, they offer a clearly demarcated network boundary, a crucial requirement for employing social network analysis to distinguish social selection and influence effects. Moreover, these associations persisted through social distancing measures during the Covid-19 pandemic and are accessible to everyone without members having to fulfill requirements.Footnote 1 Unlike other voluntary settings such as sports clubs or retirement homes, these clubs are less selective regarding members’ health. Membership is open to all, with no health requirements for participation. Additionally, health profiles within the clubs align closely with the general German population (Robert Koch-Institut, 2018), suggesting they do not disproportionately attract healthier individuals. This inclusivity provides a unique opportunity to examine health-network interactions without a large bias of initial health-based selection.
The two carnival clubs studied differ in key ways that underscore the variability in voluntary social settings and offer insight into how these differences may shape social networks and health outcomes. The first club, an all-male organization, is characterized by stability, with an average membership duration of 19 years at baseline. Its long-standing structure and traditions reflect a cohesive, enduring social environment. In contrast, the second club, which is mixed gender, presents a more dynamic context. With an average membership duration of six years, this club experienced significant turnover in its steering committee prior to data collection, leading to a shift in its mission and a subsequent change in membership composition. These contrasting contexts provide a valuable opportunity to explore how differences in organizational structures influence the dynamics of social networks and health.
3. Methods
3.1. Data
We used sociometric survey data collected from two clubs described above. The three-wave data was collected between November 2022/January 2023 and November 2023/February 2024, with a six-month time interval, with a total of 102 participants (Nclub1 = 56, Nclub2 = 46). The mean response rate of the first club is 87% (range: 85%–89%) and for the second club 79% (range: 75%–83%). One of the two clubs consisted exclusively of men. Within the second club, 44% of the members were male. The baseline mean age is 54 years (total age range = 21–86 years), and 96% of the respondents were born in the territory of present-day Germany. 69% of the respondents were employed. The minority lived on their own (20%), while the majority lived with their (marital) partner, children, parents (or in-laws), and/or another nonrelated person.
Research staff initially leveraged professional contacts and further used snowball sampling to gain access to further clubs. To ensure that all individuals in the sample had a realistic opportunity to interact with one another, only active members were included. Following a briefing with each club’s management, individuals who were permanently inactive, residing in institutions, living at a significant distance (including abroad), or unable to participate due to serious health conditions were excluded. This resulted in a target sample of 102 members, with individual club samples ranging from 46 to 56 members. Importantly, there was no overlap in membership between the two clubs, resulting in two fully distinct social networks.
Following initial contact and announcement by each club’s manager, participants were invited to complete a web-based questionnaire. The use of a digital format was practical, as the participating organizations had largely transitioned to online communication during the Covid-19 pandemic, and most respondents were comfortable using digital devices such as computers or smartphones. For those requiring additional support, we offered the option of in-home assistance, which applied to one participant. On average, participants spent 25.8 minutes completing the survey.
Achieving high response rates is essential for conducting social network analyses that rely on complete network data. To encourage participation, we implemented an incentive structure in which monetary donations were offered to each club, contingent on the level of participation. Specifically, clubs could receive up to 500€, with the exact amount scaled to their response rate (e.g., an 80% response rate yielded 400€). Additionally, we offered clubs the opportunity to include tailored questions at the end of the survey, allowing them to collect anonymous feedback on topics relevant to their interests.
Ethical approval for the study was granted by the ethics committee of the University of Cologne (reference: 220036LE) prior to data collection. Informed consent was obtained from all participants, and we adhered to strict data protection guidelines.
3.2. Measures
3.2.1. Network variable: close relationships
The network data collection used a roster design such that respondents could select individual members from a list of all members. To minimize respondent burden and the time required to fill in the survey, respondents were initially asked to identify individuals with whom they had ever had contact with. Only those selected in this initial step were included in the following rosters. Close relationships were operationalized as positive relationship quality. Respondents had to indicate all other club members to which the following applies: “There are people we know who give you great joy or great happiness. Which people within the club name are these for you?“ (Engstler et al., Reference Engstler, Stuth, Lozano Alcántara, Luitjens, Klaus, Schwichtenberg-Hilmert and Körber2022, own translation). This approach focuses on the emotional intensity of ties, a core component of tie strength (Marsden & Campbell, Reference Marsden and Campbell1984). While this measure captures only one dimension of closeness, we opted for a parsimonious and theoretically grounded operationalization due to conceptual focus and model constraints. Importantly, we did not include contact frequency, as it may be confounded by mandated interactions for example, between members in the steering committee, making it a less valid indicator of closeness in this context. This results a directed network with sent and received nominations.
3.2.2. Individual variables
Poor physical health was assessed using a single item that asked respondents whether, in the past six months, they had experienced limitations in activities they typically engage in due to health issues. We categorized individuals as having poor physical health if they reported either mild or severe activity restrictions, with those reporting no limitations serving as the reference group.
Poor mental health was evaluated using the Negative Affect Subscale of the Positive and Negative Affect Schedule (Crawford & Henry, Reference Crawford and Henry2004). For each emotion, respondents had to indicate whether they never, rather rarely, sometimes, often or very often felt sad, depressed, disappointed and exhausted. We constructed a rounded mean index and built a categorical measure with values of one and two indicating good mental health, value of three indicating moderate mental health and values of four and five indicating poor mental health.
Self-rated health was captured by respondents’ self-assessment of their health. We collapsed very bad and bad health into one poor health category, as the group of respondents with generally poor self-rated health is too sparse. This results in a categorical variable: very good self-rated health, good self-rated health, moderate self-rated health and poor self-rated health.
Age was categorized into three groups: less than 45 years, 45–64 years, and 65 years and older. Gender was treated as a binary measure, with males serving as the reference category. Education was constructed based on the CASMIN classification (Federal Institute for Vocational Education and Training, 2024), resulting in three educational levels: low, middle, and high education. Further, we assessed the employment status of the individual by asking whether they are currently engaged in paid work of at least 19 hours per week.
3.3. Method
3.3.1. Stochastic actor-oriented models
We use Stochastic Actor-Oriented Models (SAOMs), as implemented in RSiena (Ripley et al., Reference Ripley, Snijders, Boda, Vörös and Preciado2024), for directed networks to account for higher-order structural factors within the network and to more precisely capture complex network dynamics over time. In SAOMs, changes in networks and individual attributes are viewed from an actor-oriented perspective. Time intervals between observations are divided into micro-steps, reflecting the assumption that both networks and attributes evolve continuously over time. During each micro-step, actors can modify their social ties or adjust personal attributes. These decisions depend on the current state of the network and the attributes of others in the network (Ripley et al., Reference Ripley, Snijders, Boda, Vörös and Preciado2024; Snijders et al., Reference Snijders, Van De Bunt and Steglich2010; Steglich et al., Reference Steglich, Snijders and Pearson2010).
While some network dynamics, such as close ties and their feedback effects on health, can be analyzed longitudinally using methods like cross-lagged panel analysis (e.g., Kenny, Reference Kenny, Kenett, Longford, Piegorsch and Ruggeri2014), RSiena offers a key advantage. It allows for the modeling of multiple structural network parameters, essential for understanding social relationship dynamics. They are particularly suitable for modeling network evolution as they allow for the simultaneous examination of multiple relational processes, such as influence, selection, avoidance, and withdrawal, based on individual health characteristics. Additionally, SAOMs enable the integration of network dependencies—such as triadic closure and homophily effects—thereby providing a comprehensive framework to assess how both health status and network structure jointly contribute to tie formation and dissolution.
We specified our convergence algorithm as such, as that the first two phases are estimated by Maximum Likelihood and the third phase by Methods of Moments estimationFootnote 2 . The first is used to yield more precise estimates compensating for the relatively small sample size. The latter was used to be able to assess goodness of fit (GOF).
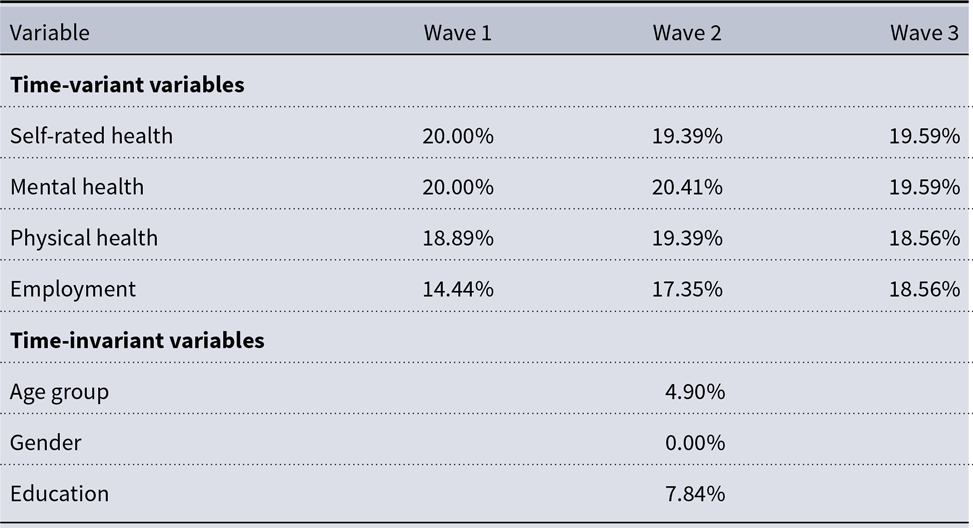
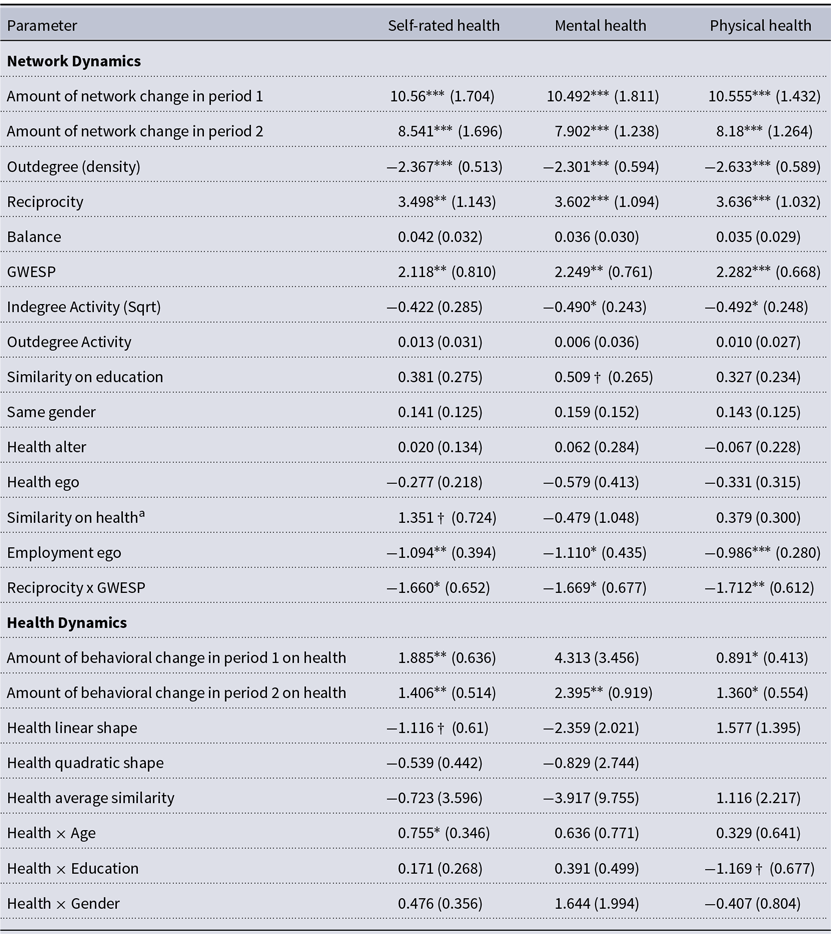
To account for network size changes over time, we used the method of joiners and leavers proposed by Huisman and Snijders (Reference Huisman and Snijders2003). We applied multiple imputation techniques using chained equations to account for missing behavioral data (van Buuren & Groothuis-Oudshoorn, Reference van Buuren and Groothuis-Oudshoorn2011). The proportion of missing data ranges across variables and waves can be found in Table A1. The SAOM results presented here are based on a single imputed dataset. Because results from multiple imputations differed primarily in decimals, we report them as sensitivity analyses. In total, 20 imputed datasets were used. Non-converged models were re-estimated with extended computation time and alternative seed settings. Following Ripley et al. (Reference Ripley, Snijders, Boda, Vörös and Preciado2024), we retained only models with a convergence ratio below 0.25. We also excluded outlier models in which any standard error exceeded ten times the median standard error for a parameter. Estimates were then pooled according to Rubin’s rule (Reference Rubin1987), as recommended by Krause et al. (Reference Krause, Huisman and Snijders2018). Table A2 reports the pooled results along with the number of converged and excluded models. Overall, results from multiple imputations closely resembled those from single imputation, differing primarily in decimals. For behavior dynamics, standard errors were somewhat larger with more variation, suggesting greater uncertainty which warrants cautious interpretation.
3.3.2. Model specifications
To detect social network change and health dynamics, we need to distinguish between selection and influence mechanisms. SAOMs allow us to account for these confounding processes by explicitly modeling the co-evolution of having a close relationship and health. To do so, we specified two equations with different dependent variables guiding actors’ decisions: actors’ selection function modeling their close tie dynamics and actors’ influence function modeling their health dynamics. Estimating both functions simultaneously, we end up with estimates of evaluations of healthy dynamics net of confounding via social influence.
To model network dynamics, we include the structural effects addressing the general relational mechanisms known to affect the emergence of positive ties among people: outdegree, reciprocity, triadic closure—captured by the geometrically weighted edgewise shared partners (GWESP) term, an interaction term between reciprocity and GWESP, indegree activity (sqrt), outdegree activity and balance. In addition, we include similar educational level. This effect accounts for homophilous tendencies with respect to education. Further, we included the employment ego effect to approximate the time available that can be spent in a club due to being employed. Finally, to specifically account for relational mechanisms tied to older adults’ health, the phenomenon of main interest, we include the effects health alter, health ego and similar/same health. We model the health homophily parameter with the evaluation function, which captures the presence of ties regardless of whether they were newly created or maintained.
To model health dynamics, we include as basic controls the linear shape and quadratic shape effects, in line with previous research (Ripley et al., Reference Ripley, Snijders, Boda, Vörös and Preciado2024). The latter is excluded for physical health due to its binary nature. Further, we include the average similarity effect to account for social influence of health. In addition, we include age, education and gender effects to avoid spurious peer influence effects.
4. Results
4.1. Descriptive analysis
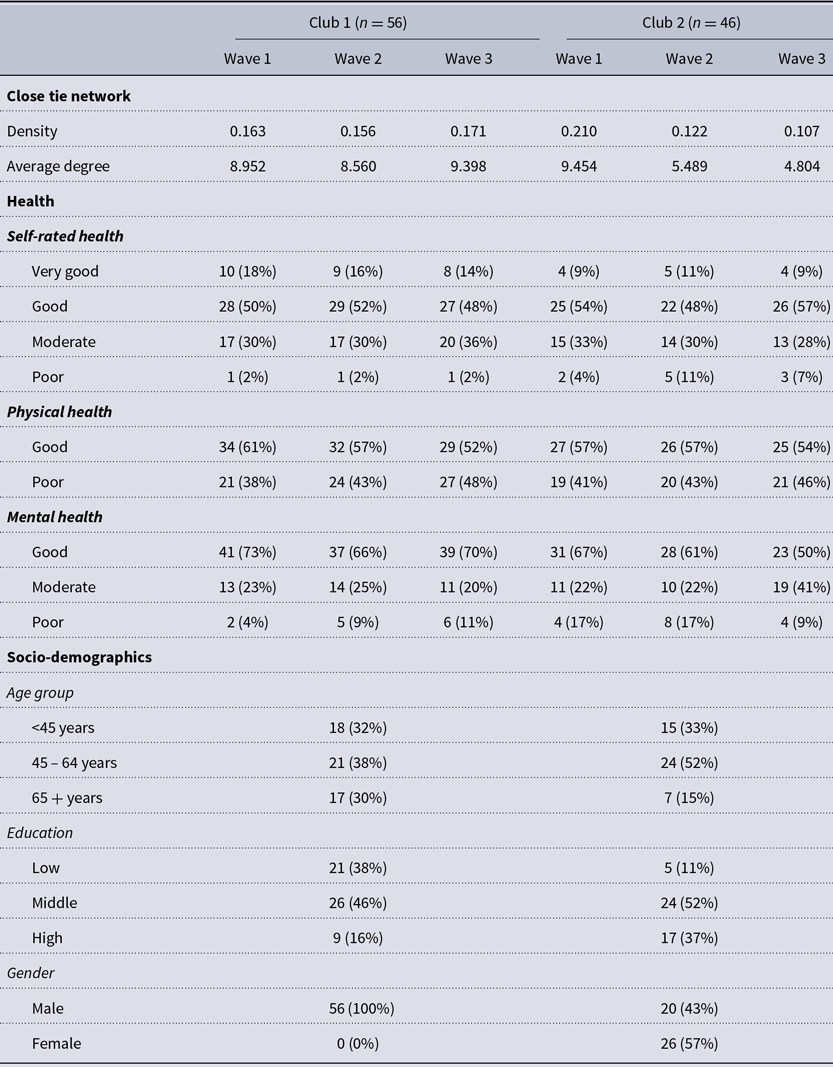
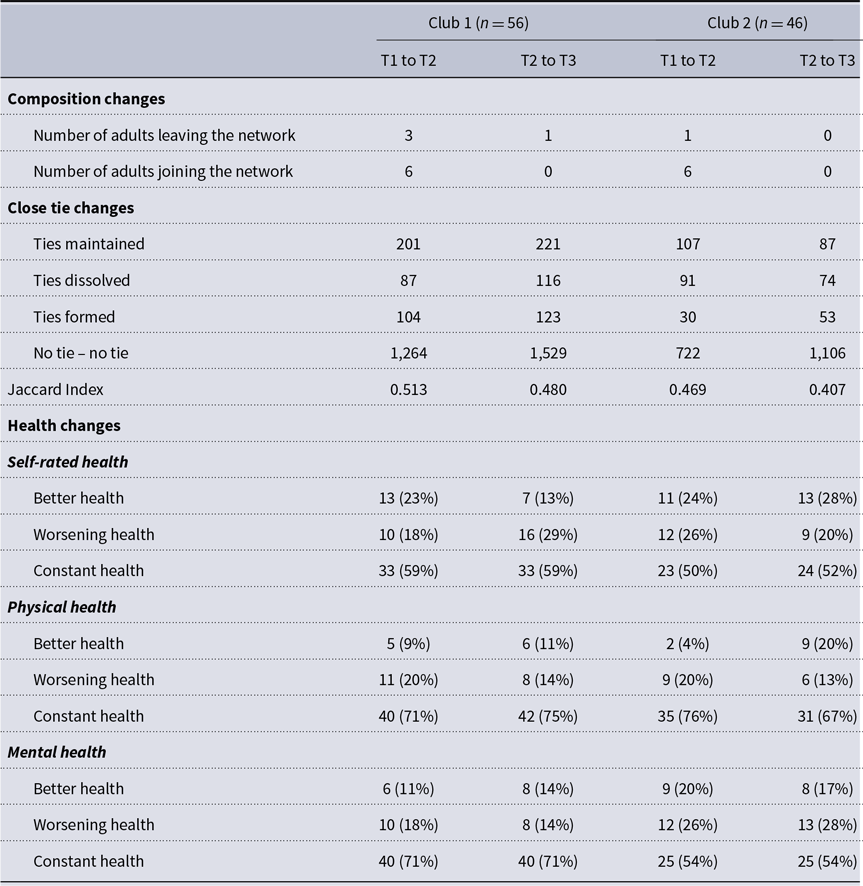
Descriptive statistics are presented in Table 1. Across both clubs, self-rated health remained relatively stable over time, with the majority of participants consistently rating their health as good. Physical health showed a slight, gradual decline, reflected in decreasing percentages of participants without physical limitations in later waves. Most participants in both networks reported good mental health, although this number decreased over time, particularly in the second club. Regarding individual health changes over time (see Appendix, Table A3), most participants’ (50%–76%), health remained stable across self-rated, physical, and mental health dimensions. Nevertheless, a notable share experienced changes: improvements were reported by 4%–28% depending on the health dimension and time interval, while 13%–29% reported declines. These dynamics were more pronounced in mental health, particularly in the second club, where worsening mental health increased in the later period.
Descriptive overview of variables

The two clubs differ within their demographic profile. While the first one consists only of men, the second one has a balanced gender mix. Also, the first club seems to be quite equal in terms of educational background and age group, while the second one is comprised of more middle and highly educated people as well as adults of the second age category (45 to 64 years).
A descriptive overview over network density and average degree can be found in Table 1. On average, members of clubs nominated 9 peers in club 1, with the average degree remaining largely stable over the waves. In club 2, the average degree has halved from 9.454 in the first wave to 4.804 in the third wave. This decline is likely linked to the club’s dynamic context, particularly the substantial turnover in its steering committee prior to data collection, as detailed in the study context section.
These discrepancies are reflected by the network dynamics (see Appendix, Table A3). The first club’s network remained stable, with similar percentages of ties maintained, formed, and dissolved. In contrast, the second club had fewer ties maintained or dissolved, while a similar number of new ties formed in period 2 compared to period 1. The Jaccard index, ranging from 0.480 to 0.513 in the first club and 0.407 to 0.469 in the second, indicates greater network change in the latter.
Visualization of networks of close ties over time, node colors indicating self-rated health, size by degree. Layout held constant across waves within clubs to facilitate comparison.

Visual examination of the network reveals no clear clustering related to health (see Figure 1). Further, we do not find evidence for clustering or dispersion for the health measures across both clubs when examining Moran’s I, as all values are close to zero (see Table A4). These results hardly indicate that there is evidence of health-related homophily.
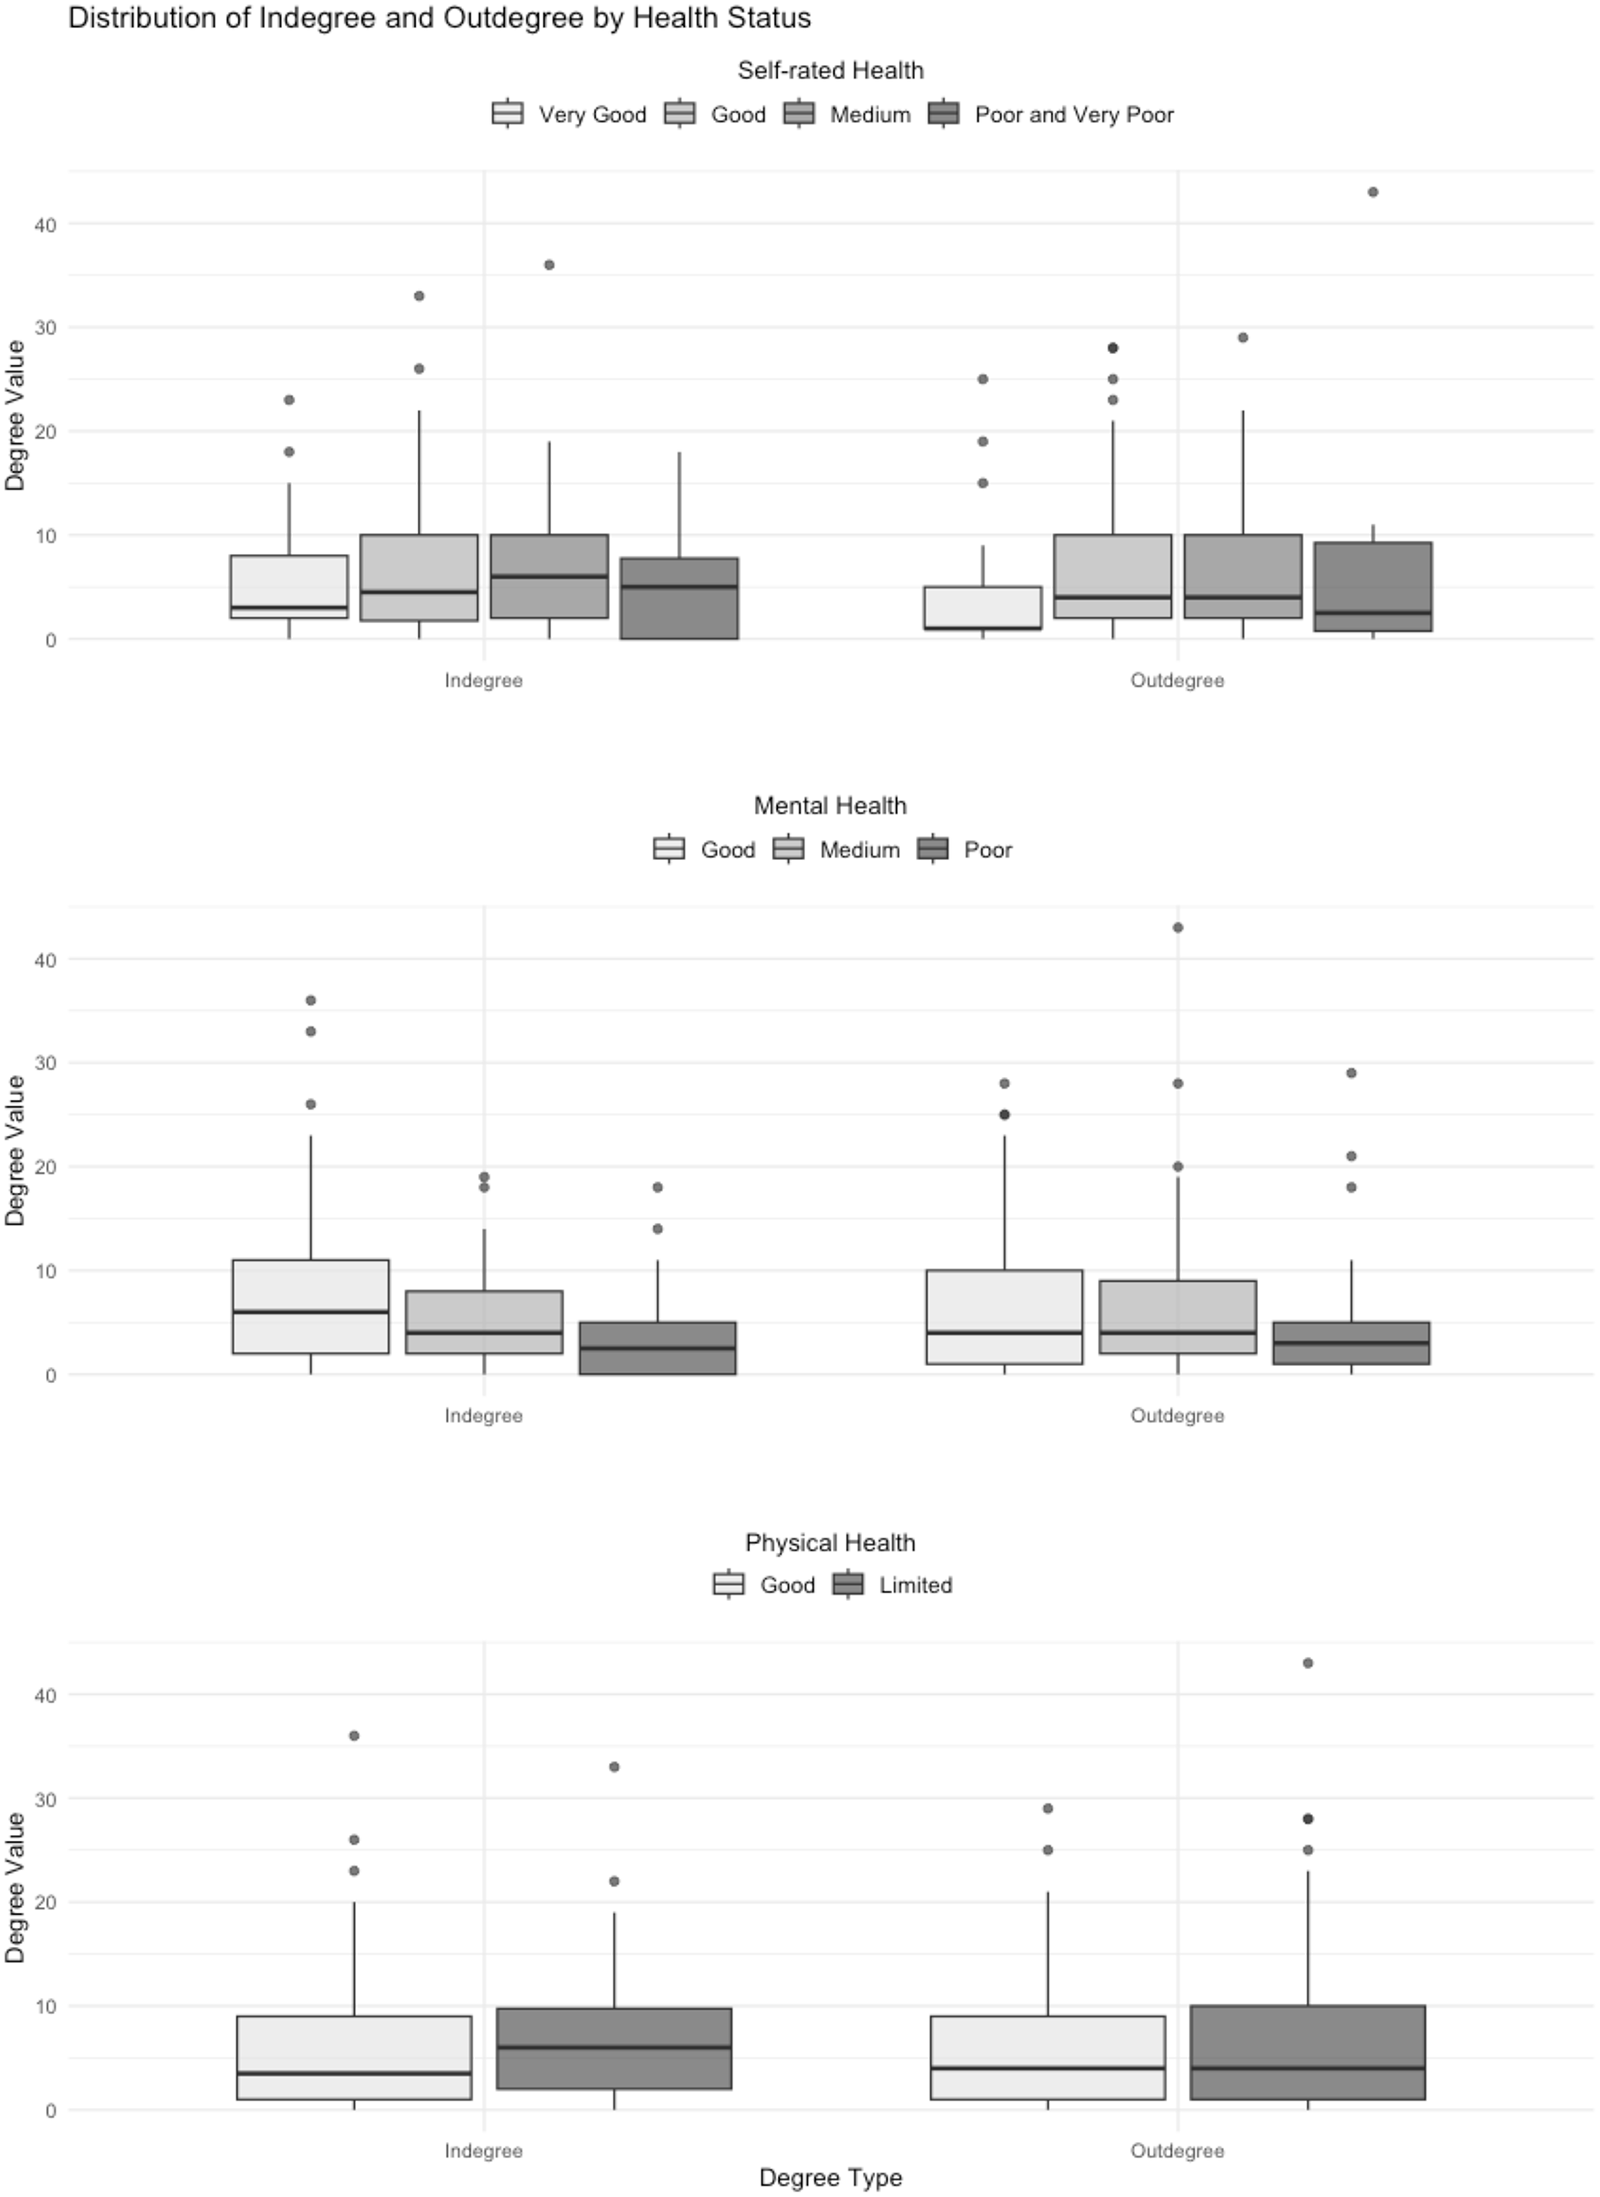
When examining the degree distribution by health status (see Appendix, Figure A1), indegree and outdegree distributions are largely similar across self-rated health categories. However, individuals with poor mental health tend to have slightly lower degree values than those with moderate or good mental health, while the spread of values is wider for those with good mental health, particularly in the indegree distribution. Additionally, while outdegree distribution remains consistent across physical health statuses, individuals with poor physical health exhibit slightly higher indegree values.
4.2. Stochastic actor-oriented models
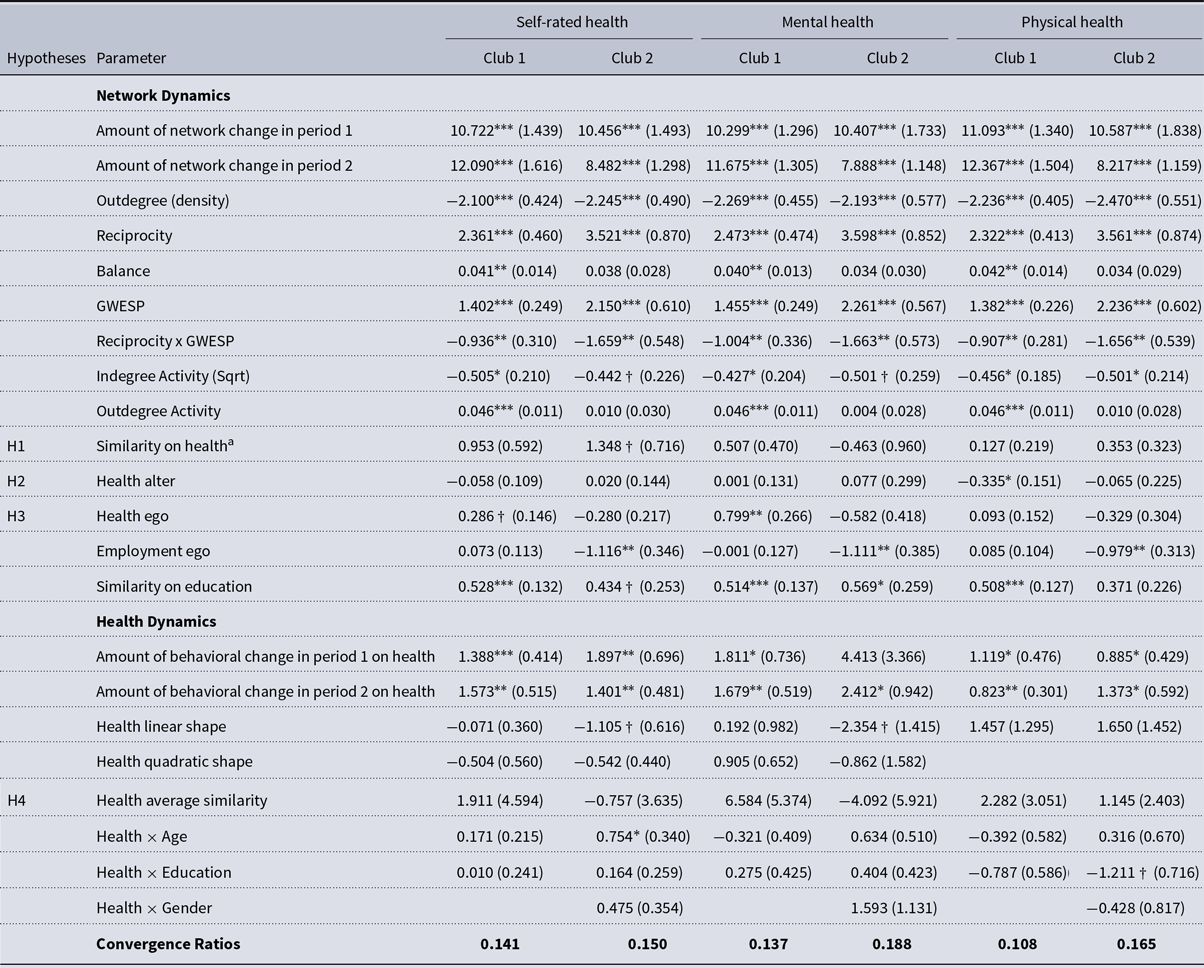
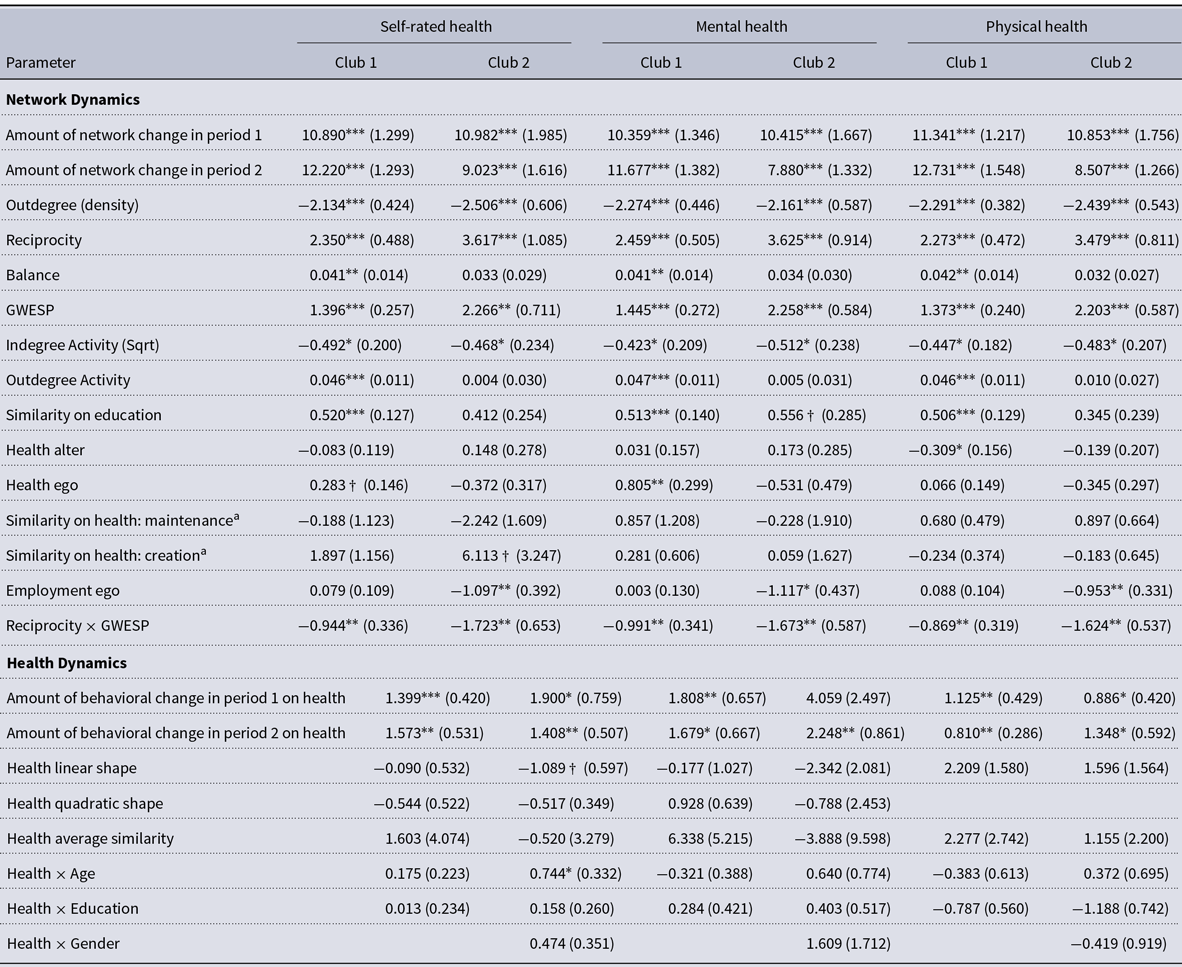
We performed SAOM to examine health and network dynamics in voluntary clubs across the three waves (see Table 2). Convergence ratios across all models were good ( <0.2; Ripley et al., Reference Ripley, Snijders, Boda, Vörös and Preciado2024).
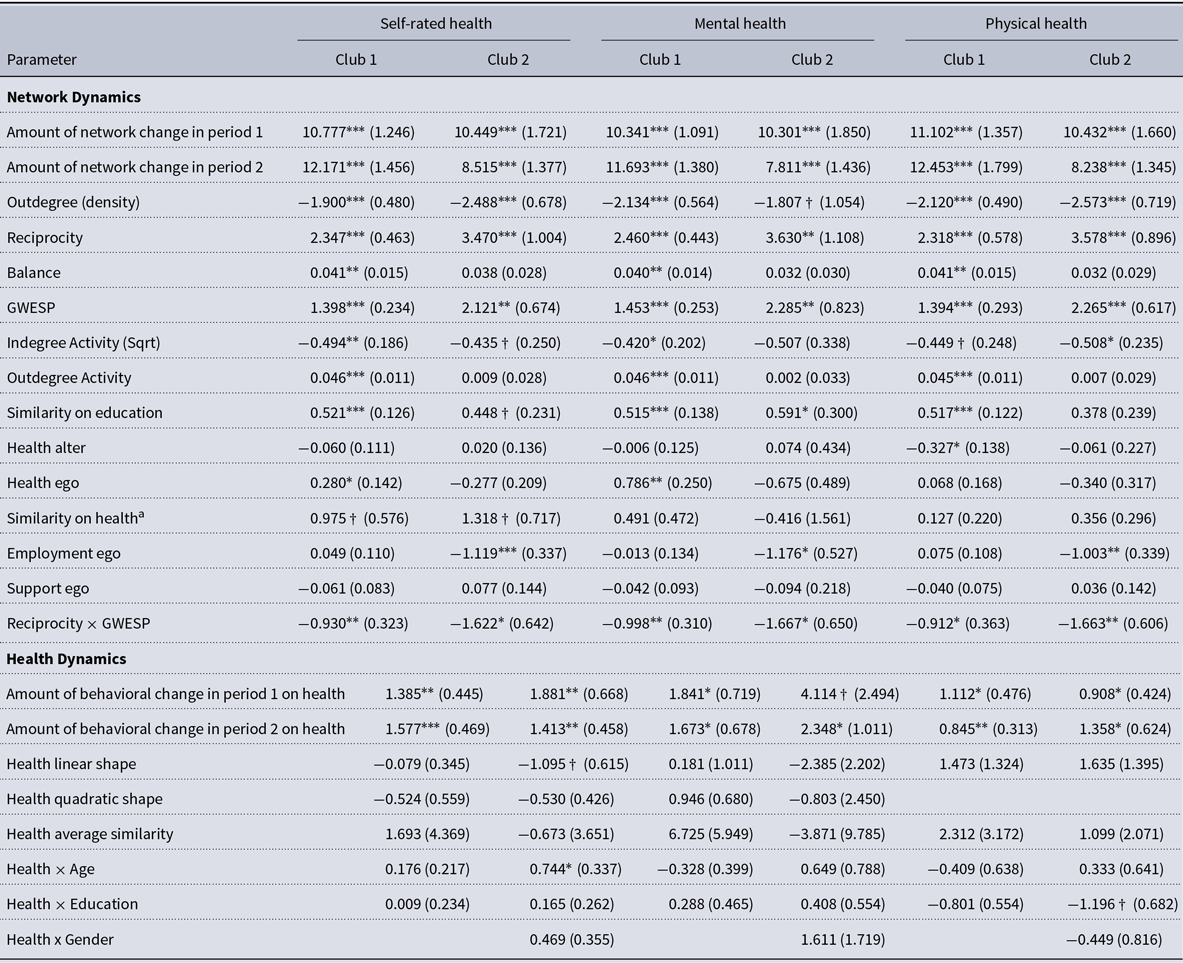
The negative degree density parameter across all models (b = −2.100 to −2.470, SE = 0.405 to 0.577) is reflective of the low density of close tie networks in both clubs. The positive and significant GWESP parameter (b = 1.382 to 2.261, SE = 0.226 to 0.610) confirms that the captured structures show strong tendencies for triadic closure. Similarly, we find evidence for reciprocity within close tie networks (b = 2.322 to 3.598, SE = 0.413 to 0.874), highlighting a preference for mutual ties.
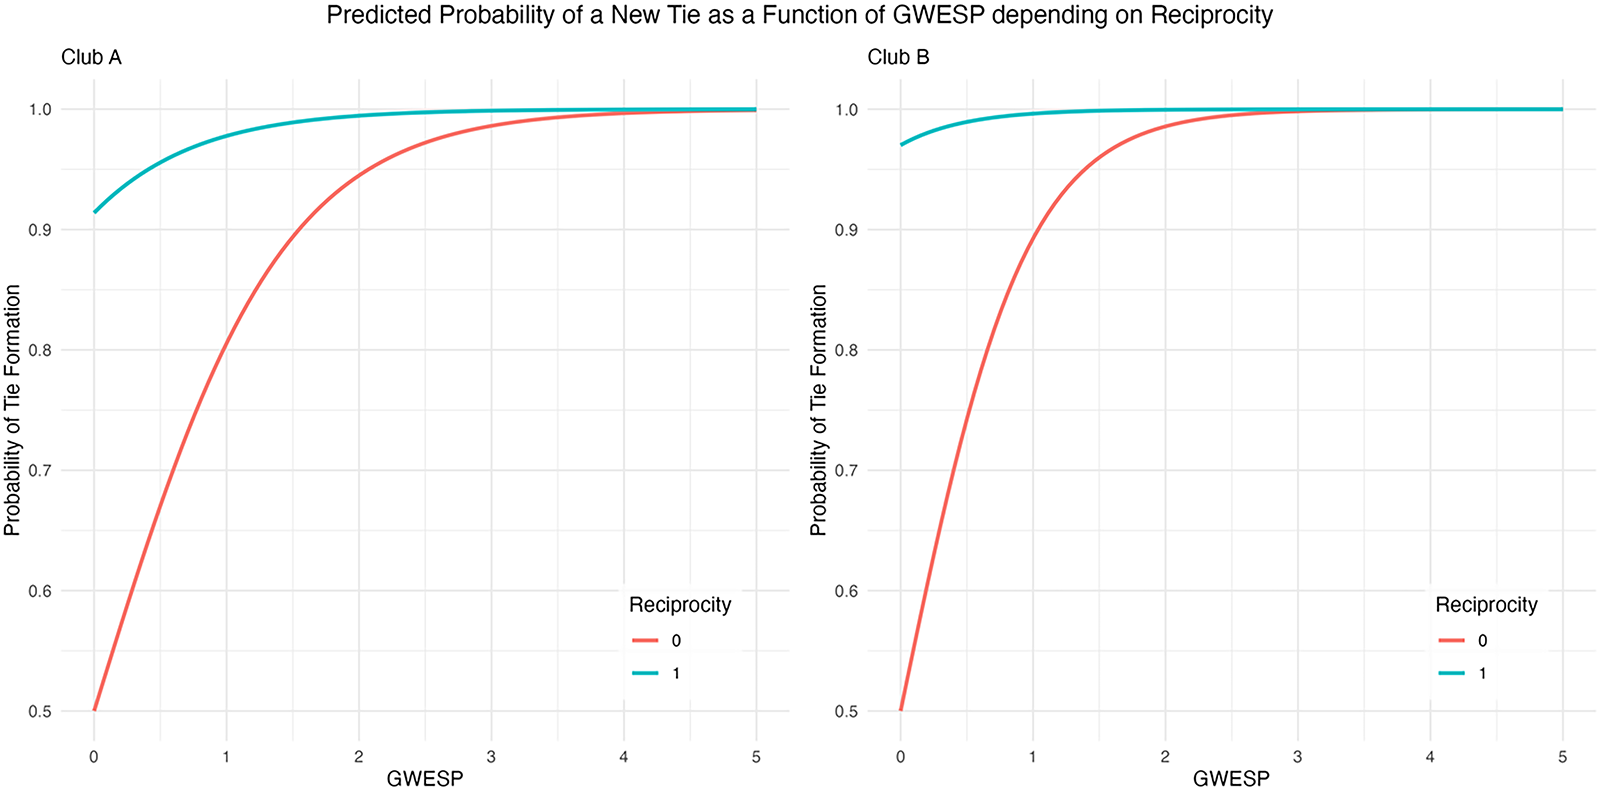
The interaction between reciprocity and GWESP is significant and negative across all models (b = −0.907 to −1.659, SE = 0.281 to 0.573). Figure A2 illustrates the probability of forming a new tie as a function of triadic closure, differentiating between cases where the existing tie in the triad is reciprocal or non-reciprocal. In both clubs, the results suggest reciprocal ties to significantly influence triadic closure, meaning that mutual connections make it more likely that a new tie forms. This suggests that reciprocity and transitivity complement each other, which is consistent with earlier work suggesting that peer groups form initially reciprocal ties and then closing triads among common friends (Hallinan, Reference Hallinan1974, Reference Hallinan1978). Network balance is observed in the first club (b = 0.040 to 0.042, SE = 0.013 to 0.014), indicating an additional layer of structural cohesion.
Regarding individual activity, the square root of the indegree activity term is significantly negative in both clubs (b = −0.427 to −0.505, SE = 0.185 to 0.259), meaning that popular individuals (those with many incoming ties) are less likely to nominate new close ties, reinforcing stability in social positions. This effect is stronger for highly popular individuals. However, the outdegree activity effect is significant and positive only in the first club (b = 0.046, SE = 0.011), indicating that socially active individuals in the first club continue expanding their close ties, while this pattern is absent in the second club.
Regarding dyadic structures, educational homophily is predominantly evident in the first club (b = 0.508 to 0.528, SE = 0.127 to 0.137). Additionally, in the second club, employment status predicts nomination behavior, with employed individuals being less likely to nominate others as close ties compared to those not working (b = −0.979 to −1.116, SE = 0.313 to 0.385).
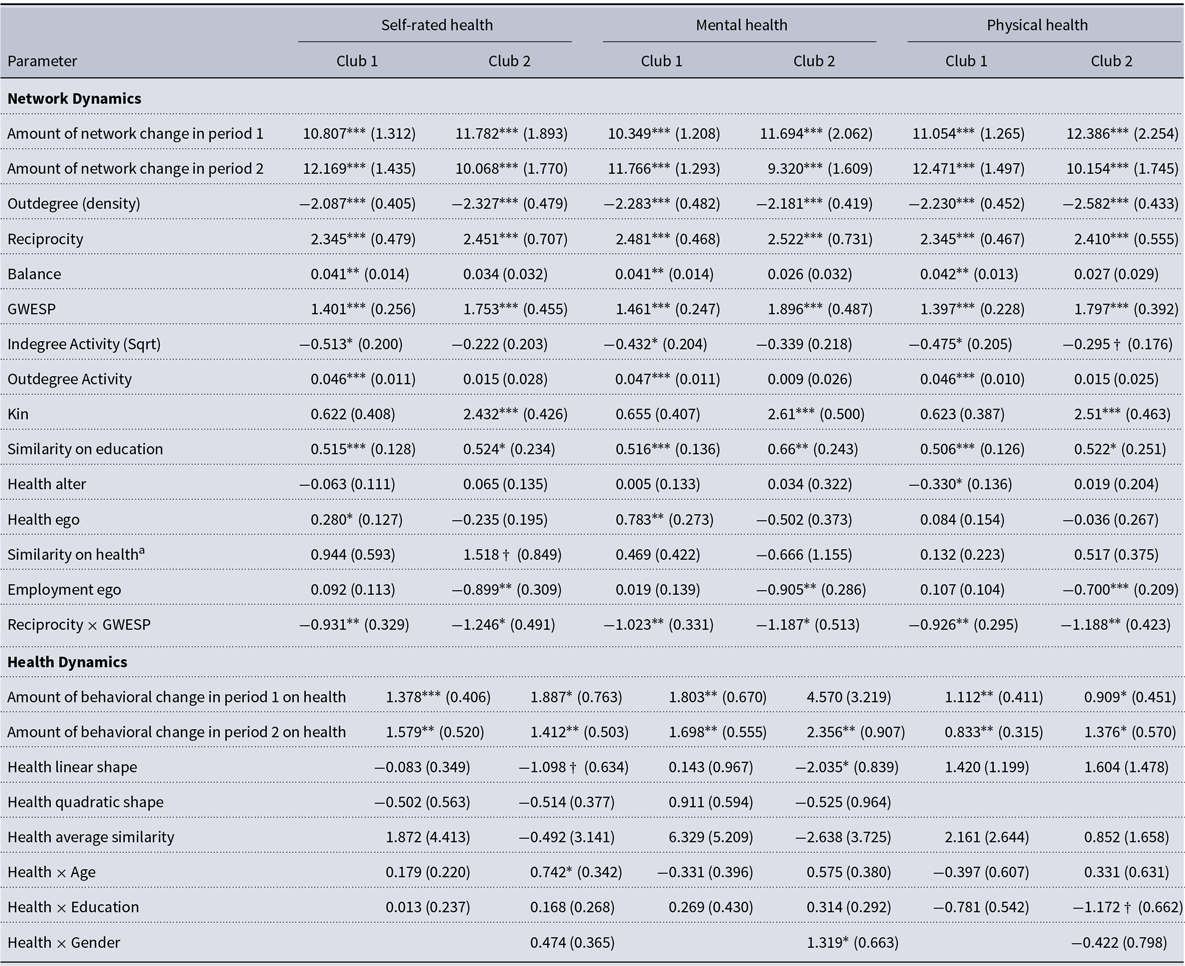
SAOM results, model specifications to test for kin effects

†p < 0.1 * p < 0.05 ** p < 0.01 *** p < 0.001
Standard errors in parentheses.
All t-ratios are below 0.1.
aFor the binary variable physical health, we used the sameX term instead of the simX term.
4.2.1. Network selection and health
Regarding the selection hypothesis, we find significant evidence for self-rated health homophily, meaning that individuals with similar self-reported health are more likely to form ties (b = 1.348, SE = 0.716). The significant selection effect does hold across different model specifications but is only apparent in the second club. Notably, self-rated health similarity appears to be particularly influential in forming new friendships (see Table A5), likely driving the observed health homophily effect.
Regarding the social avoidance hypothesis, we find that in the first club, individuals in poor physical health receive significantly fewer nominations (b = −0.335, SE = 0.151). This effect remains stable in size and significance across different model specifications. However, we find no evidence of social avoidance based on poor health in the second club or across other health measures.
Interestingly, in the first club, individuals with poorer self-rated (b = 0.286, SE = 0.146) and mental health (b = 0.799, SE = 0.266) are more likely to nominate others as close ties (see Table 2). This contradicts expectations that poorer health would lead to social withdrawal. Notably, this effect remains stable across different model specifications.
4.2.2. Network influence and health
We do not find significant evidence for health influence effects in either club. Peers do not appear to influence individuals’ health over time.
Regarding socio-demographic characteristics, we find no strong effects on health. Gender is not predictive across models, and the effect of education is suggestive but inconsistent across specifications. Age significantly influences self-rated health (b = 0.754, SE = 0.340) but only in the second club. However, this effect is not significant when using multiple imputed datasets (see Table A2), suggesting the uncertainty of this parameter.
4.2.3. Additional analyses
We conducted additional analyses to assess the stability of the observed effects. Specifically, we examined age homophily, but the results indicate that it is not significant (see Table A6). This suggests that individuals are no more likely to form close ties with others of the same age, implying that age does not play a significant role in the segregation of these clubs.
Similarly, we found no significant evidence of gender homophily in the second club (see Table A7). Further, we accounted for the kinship or marriage ties within the clubs. While these ties were predictive of tie nominations in the second club, they were not significant in the first (see Table A8). This discrepancy may be due to marriage within the club being a stronger predictor of network dynamics than kinship ties, whereby marriage ties are only prevalent in the second club.
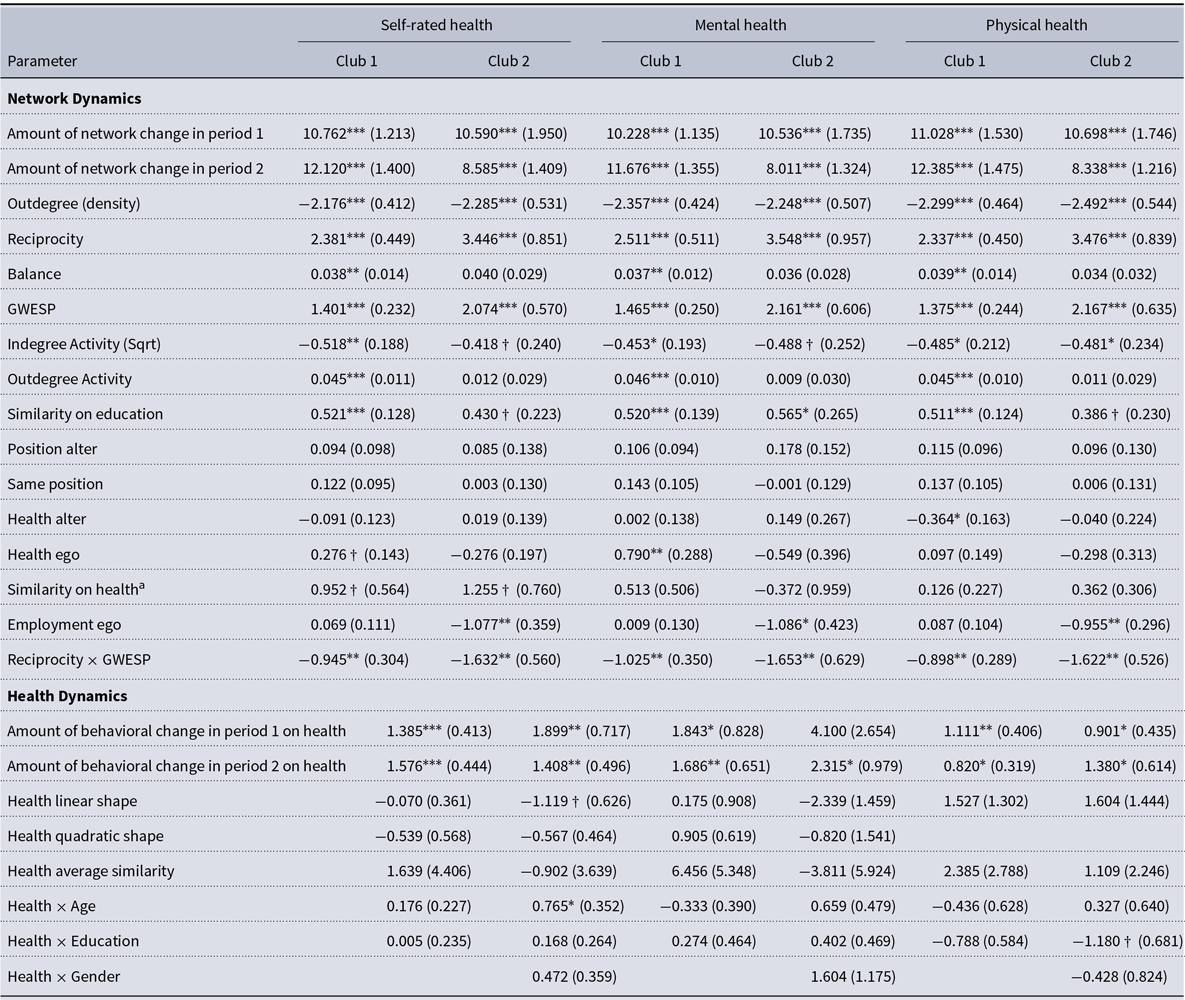
Additionally, we tested whether steering committee membership influenced close tie nominations or increased mutual nominations among committee members. Both effects were insignificant (see Table A9), suggesting that leadership roles do not strongly influence network dynamics.
Further, we tested whether general perceived support (see Table A10) or higher frequency of participation in the club (see Table A11) influenced the likelihood of nominating others as close ties. However, neither perceived support nor participation frequency was predictive of nomination behavior in close-tie networks.
Finally, we investigated whether peer influence effects were particularly pronounced for central individuals in the network (see Table A12). This effect was not significant, confirming that an individual’s health is not influenced by the health of those who nominate them as close ties. Additionally, central individuals in the club are no more susceptible to health influence effects than those in more peripheral network positions.
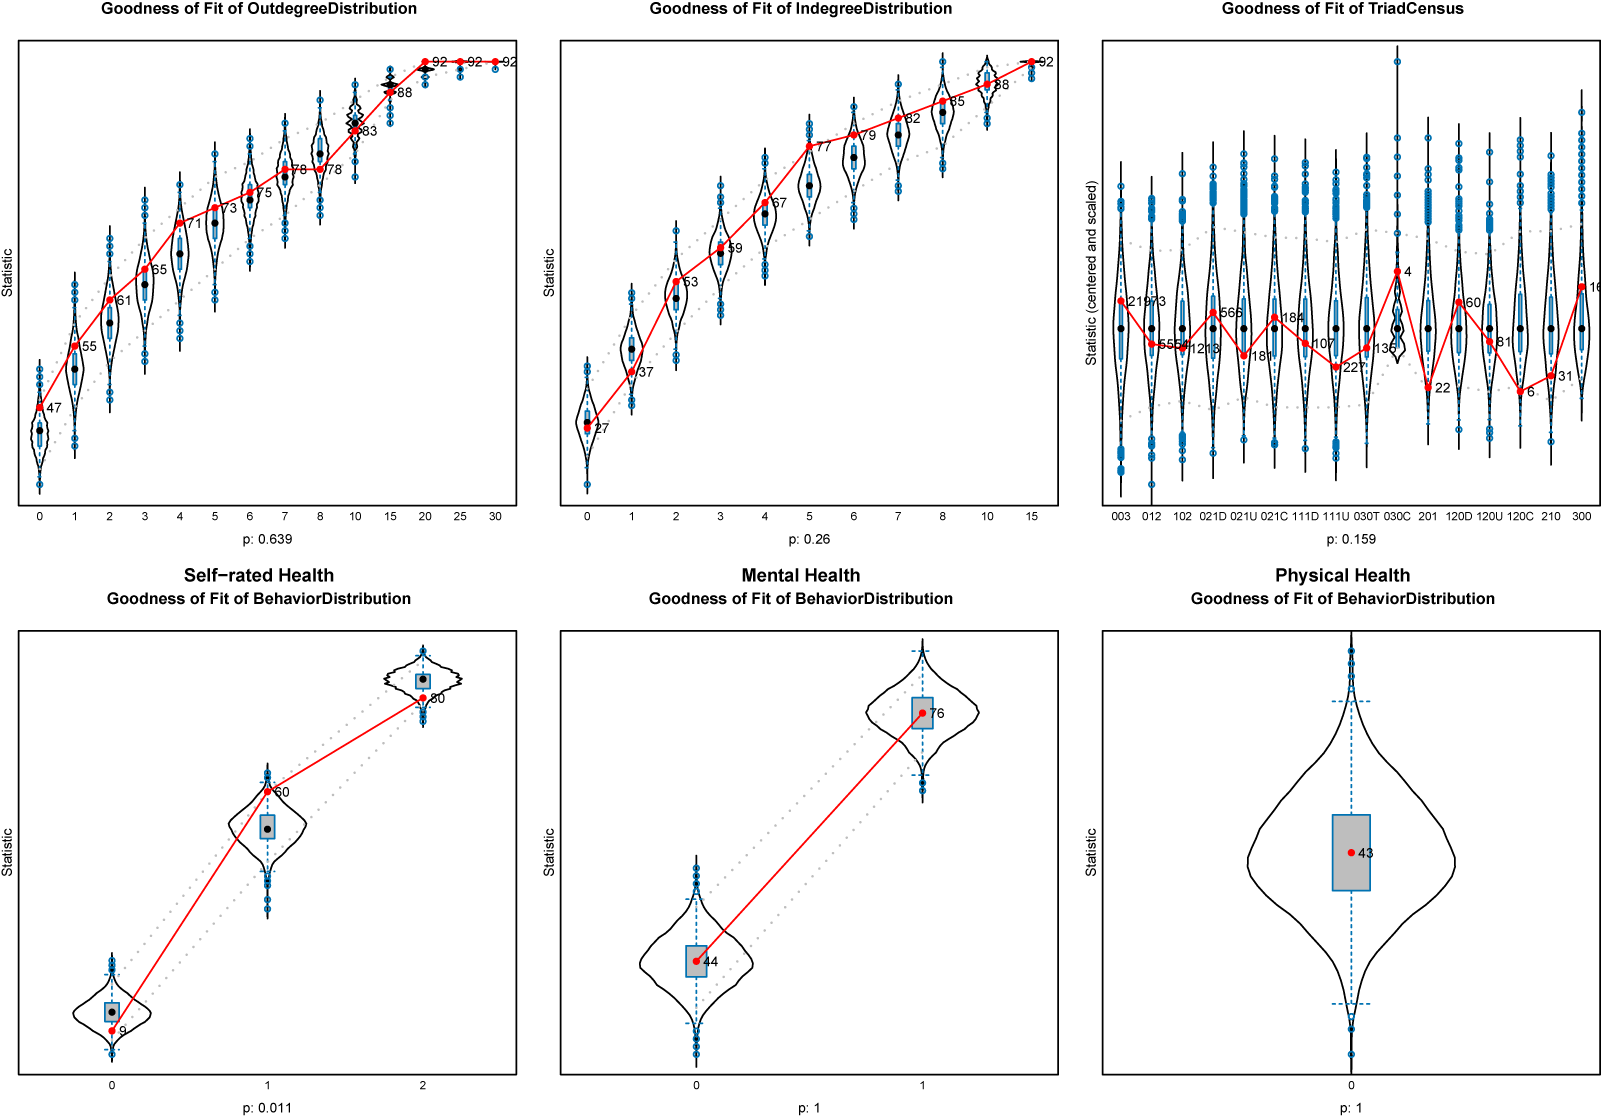
4.2.4. Goodness of fit
To assess the GOF, the networks simulated by the SAOM were compared to the observed data using three auxiliary network statistics: outdegree, indegree, and triad census distribution (see Lospinoso & Snijders, Reference Lospinoso and Snijders2019). Additionally, the model was evaluated for its ability to capture the distribution of self-rated, mental, and physical health values over time. Model convergence was largely confirmed, with t-ratios for deviations from target statistics below 0.1 and an overall maximum convergence ratio below 0.2. Overall, the current model specification demonstrated good GOF. In the Appendix, Figure A3 visualizes the GOF for the first club, Figure A4 does the same respectively for the second club.
5. Discussion
This study investigated how health and social network dynamics unfold in fully voluntary settings, which remain underexplored compared to the widely studied constrained contexts like schools or workplaces, and other institutional contexts (Chancellor et al., Reference Chancellor, Layous, Margolis and Lyubomirsky2017; Crosnoe et al., Reference Crosnoe, Frank and Mueller2008; Flatt et al., Reference Flatt, Agimi and Albert2012; Schaefer et al., Reference Schaefer, Kornienko and Fox2011; Schafer, Reference Schafer2016; Van Zalk et al., Reference Van Zalk, Kerr, Branje, Stattin and Meeus2010a). Unlike constrained environments shaped by compulsion and sorting (McPherson et al., Reference McPherson, Smith-Lovin and Cook2001), voluntary clubs involve self-selection and long-term commitment (Rawlings et al., Reference Rawlings, Smith, Moody and McFarland2023), often lasting several years or even decades, which makes them particularly meaningful for participants and offers a unique lens into how social ties and health interact outside imposed institutional structures. Using whole network data on two clubs and employing SAOM allow us to examine the dynamic nature of networks in relation to health, distinguishing between selection and influence effects.
This study aimed to investigate network and health dynamics in fully voluntary settings. Previous research has mainly examined these dynamics in constrained settings, such as schools, workplaces, and other institutional contexts (Chancellor et al., Reference Chancellor, Layous, Margolis and Lyubomirsky2017; Crosnoe et al., Reference Crosnoe, Frank and Mueller2008; Flatt et al., Reference Flatt, Agimi and Albert2012; Schaefer et al., Reference Schaefer, Kornienko and Fox2011; Schafer, Reference Schafer2016; Van Zalk et al., Reference Van Zalk, Kerr, Branje, Stattin and Meeus2010a). These are often formed under implicit assumptions of compulsion and sorting, where individuals are confined to a limited pool and tend to form homophilous ties with others who share similar characteristics (McPherson et al., Reference McPherson, Smith-Lovin and Cook2001). However, it remained unclear whether these dynamics also hold in fully voluntary settings, in which members often self-select into groups (Rawlings et al., Reference Rawlings, Smith, Moody and McFarland2023). Voluntary clubs are a prime example of such settings. Particularly, the long-term nature of club memberships, often lasting several years or even decades, makes these networks particularly meaningful for participants, offering a unique lens into how social ties and health interact outside imposed institutional structures. Using whole network data on two clubs and employing SAOM allow us to examine the dynamic nature of networks in relation to health, distinguishing between selection and influence effects.
Our study diverges from patterns observed in more commonly studied settings. Our tie formation models are consistent with prior work suggesting the importance of social closure and homophily, however, just not in terms of health. Contrary to other studies (Van Zalk et al., Reference Van Zalk, Kerr, Branje, Stattin and Meeus2010a), we do not find evidence for peer influence on health across all health measures. Furthermore, results suggest some sorting of social relations along the lines of self-rated health. Additionally, we find evidence for social avoidance only among those in poor physical health. We observe reversed effects—individuals in poorer health are sometimes more active in forming close ties, possibly leveraging these connections as a form of social compensation. This challenges existing assumptions and highlights the need to reconsider the underlying mechanisms linking health and social networks in fully voluntary contexts.
5.1. Theoretical implications
We initially anticipated finding evidence of health-based homophily, a phenomenon that may be driven by mechanisms of selection or influence (McPherson et al., Reference McPherson, Smith-Lovin and Cook2001). Specifically, we expected to observe a health selection effect, wherein individuals with similar health statuses were more likely to form close social ties. We observed a degree of sorting in social relationships based on self-rated health in one of the two clubs. Within this club, a similar health status is most probable attributable to the formation of new ties, rather than the maintenance of already existing ties. Since we only found this evidence in one club and not across all health measures, our overall findings only suggestively support the general expectation of health-based homophily as established by previous research (e.g., Crosnoe et al., Reference Crosnoe, Frank and Mueller2008; Schafer, Reference Schafer2016). In particular, the effect of health-based selection homophily appears to be weaker in fully voluntary social settings compared to more constrained environments.
Notably, in line with theoretical expectations and earlier studies, we found evidence that individuals with poor physical health are avoided by peers. However, we only find this evidence in one club and only regarding physical health. However, this is in line with previous research which found that particularly stigmatized and visible medical conditions influence friendship choices (Ali et al., Reference Ali, Amialchuk and Rizzo2011; Crosnoe et al., Reference Crosnoe, Frank and Mueller2008).
Furthermore, we did not observe patterns of social withdrawal among individuals with poor health. On the contrary, our findings revealed that individuals with poorer self-rated health and particularly mental health were more likely to actively nominate others as close ties. This suggests that rather than withdrawing, these individuals may leverage social connections as a form of social compensation or support.
The absence of withdrawal in voluntary settings is an encouraging finding. It indicates that such environments allow individuals to participate without fear of being marginalized due to their health status. In fact, the active engagement of individuals in poorer health may reflect their recognition of the value of social ties in mitigating the challenges associated with their condition. Social networks have been shown to buffer stress and contribute to resilience, particularly for individuals dealing with health-related difficulties (Cohen, Reference Cohen2004; Thoits, Reference Thoits2011). These findings underscore the importance of fostering inclusive social spaces where people, regardless of health status, can build and maintain meaningful relationships. They also highlight the potential of voluntary settings to serve as vital sources of social support and resilience, particularly for those facing health-related challenges.
Notably, some effects were observed in one club but not the other, which may be explained by contextual or health differences. The first club was all-male and highly stable, with long average tenure, while the second club was mixed-gender, less cohesive, and experienced leadership turnover prior to data collection. These organizational differences may have weakened social cohesion in the latter, as reflected by the slightly declining Jaccard index over time. Furthermore, health distributions and changes also differed: While respondents in the first club showed lower levels of physical health than members of the second club, the latter showed comparatively lower levels of mental health, which further worsened to a greater extent over time. Additionally, gender composition may also play a role, as women, who were present only in the second club, tend to report poorer self-rated and mental health on average.
Contrary to our assumptions, we did not find evidence for health influence. Previous research has found evidence for the social contagion of health over longer time periods. Physical health, such as obesity, was found to spread through the network over 32 years (Christakis & Fowler, Reference Christakis and Fowler2007), and mental health over five to 20 years (Cacioppo et al., Reference Cacioppo, Fowler and Christakis2009; Fowler & Christakis, Reference Fowler and Christakis2008; Hill et al., Reference Hill, Rand, Nowak and Christakis2010; Kensbock et al., Reference Kensbock, Alkærsig and Lomberg2022; Rosenquist et al., Reference Rosenquist, Fowler and Christakis2011). We might not have detected significant influence effects because contagion effects do not happen over such short period of 1.5 years. Also, social contacts in voluntary associations may of course also not be as important and thus, influential for health as family or close friends.
Theoretical postulations and previous research on health homophily have primarily been tested in constrained settings. Our study, however, reveals a significant divergence from these patterns. We propose that the theoretical framework of health homophily in social networks is most applicable in constrained settings where contact intensity is high. This suggests that the implicit scope conditions for health homophily are shaped by the nature of the setting and the frequency of interactions within it. To refine these scope conditions and deepen theoretical understanding, future research should systematically examine a variety of settings characterized by different levels of contact intensity and boundary constraints. For example, fully constrained settings with high contact intensity include schools or retirement homes, while low-intensity constrained settings include urban neighborhoods. Semi-constrained settings—such as religious groups or workplaces—offer varying degrees of both structure and contact. Finally, fully voluntary settings range from low contact environments like political activism or voluntary clubs to high contact contexts such as team sports or musical ensembles. Future studies should examine these variations to evaluate the consistency of health homophily dynamics and explore potential deviations. Critical tests could include examining in which contexts and under which scope conditions health homophily emerges. By delineating distinctions, we can refine our understanding of the mechanisms driving health and social network formation across a broader spectrum of populations and settings.
5.2. Limitations and future research
A limitation that our investigation shares with other whole network studies is the fact that we lack information about close ties outside the observed networks, including spouses, children, or friends. Previous research has shown that particularly these relationships have a profound impact on individual health, both directly—through social support—and indirectly, by their health as well as influencing behaviors and perceptions related to health (Berkman et al., Reference Berkman, Glass, Brissette and Seeman2000; Holt-Lunstad et al., Reference Holt-Lunstad, Smith, Layton and Brayne2010; Uchino, Reference Uchino2006).
Another limitation is the sample size of our study. A larger sample size and data from additional clubs could enhance statistical power, enabling researchers to distinguish between effects that are genuinely absent and those that are merely undetectable due to limited data. However, even with extensive sensitivity analyses, effects remained stable in size and significance, suggesting that these effects may genuinely be robust. While case studies inherently limit generalizability, the largely absent health and network effects, theorized and often empirically observed in constrained settings, are likely attributable to the voluntary nature of the context. This feature is also common in other carnival clubs and similar voluntary organizations, which is why we expect that comparable settings would exhibit similar results. At the same time, the differences between the two clubs studied—particularly regarding contextual factors and health distributions—suggest that some observed dynamics are context-specific. Future research should thus balance the expectation of structural similarity across voluntary associations with attention to contextual variability that may amplify or attenuate specific social processes.
A third limitation is the short time frame of the study. While many health contagion effects have been documented over longer periods, such as decades (Cacioppo et al., Reference Cacioppo, Fowler and Christakis2009; Christakis & Fowler, Reference Christakis and Fowler2007; Fowler & Christakis, Reference Fowler and Christakis2008; Hill et al., Reference Hill, Rand, Nowak and Christakis2010; Kensbock et al., Reference Kensbock, Alkærsig and Lomberg2022; Rosenquist et al., Reference Rosenquist, Fowler and Christakis2011), our study examined health effects over only 1.5 years. Future research should explore similar settings over extended time frames to better capture potential health influence effects that may take longer to manifest.
The findings of this study underscore the importance of considering the setting’s boundedness and its influence on social network dynamics. While our study provides valuable insights into health and social networks in voluntary settings, further research is needed to examine how different levels of contact intensity and environmental constraints impact health selection and influence effects. Future studies should explore various settings to better understand the nuanced ways in which social ties influence health outcomes. Additionally, these insights have important implications for promoting inclusive environments where individuals can build meaningful social networks without fear of marginalization. Voluntary clubs and other self-selecting settings may provide valuable spaces for individuals to engage socially and emotionally, thereby enhancing resilience and mitigating the impact of health challenges. As such, fostering these spaces can play an important role in improving public health and promoting social cohesion, particularly in aging populations.
Data availability statement
The data that support the findings of this study are not publicly available due to data protection regulations. Access to these data is restricted to the research team. Requests for access to the data may be considered on a case-by-case basis and should be directed to Prof. Dr. Lea Ellwardt (University of Cologne).
Acknowledgments
We would like to thank all the participants of the study for their time and contributions. Further, we would like to thank jimi adams, David Schaefer, and Lea Ellwardt for comments on earlier versions of this manuscript. Additionally, we thank Tom Snijders and Christian Steglich for their methodological feedback.
During the preparation of this work the author(s) used ChatGPT and DeepL in order to refine the manuscript’s language and readability. After using this tool/service, the author(s) reviewed and edited the content as needed and take(s) full responsibility for the content of the publication.
Funding statement
This work was supported by the Deutsche Forschungsgemeinschaft (DFG, German Research Foundation) under Grant [454899704].
Competing interests
The authors report there are no competing interests to declare.
Appendix
Proportion of missing values of each variable by wave before imputation

Pooled SAOM results, based on multiple imputation

†p < 0.1 * p < 0.05 ** p < 0.01 *** p < 0.001
Standard errors in parentheses.
All t-ratios are below 0.1.
aFor the binary variable physical health, we used the sameX term instead of the simX term.
N converged denotes the number of models (out of 20 imputed datasets) that successfully converged.
N excluded refers to the number of models excluded because at least one standard error exceeded ten times the median standard error for that parameter.
Changes over time: network composition and health

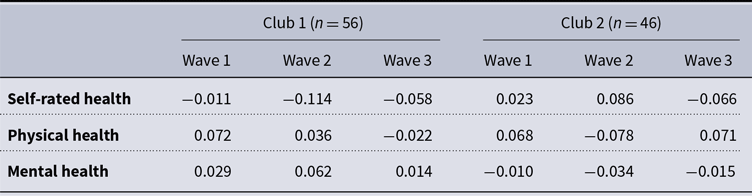
Moran’s I: Autocorrelation

Degree distribution by health; pooled data across waves.

Predicted probability of tie formation as a function of GWESP, for reciprocal and non-reciprocal dyads, exemplary for the self-rated health SAOM.

Goodness of fit
GOF, Club 1.

GOF, Club 2.

Additional analyses
Measures
Kinship ties indicated whether network members were related by blood or married. Kinship was coded as present when at least one individual indicated being related, hence it was coded as an undirected network.
To account for the organizational structure of the club, we investigated whether individuals currently hold or have previously held an official position within the club. We achieved this by asking respondents whether they are, or have ever been, members of the steering committee.
Additionally, we considered the level of general social support, as individuals with less support may be more inclined to utilize these clubs as a compensatory measure. We created a rounded additive index by combining responses from seven questions. Respondents indicated on a four-point scale—ranging from “fully true” to “not true at all”—whether there is someone who can offer advice when they are uncertain about a decision; someone who provides love and affection when they are feeling down; someone who would look after their apartment while they are away; someone to listen when they are worried; someone who would help with important tasks when they are unwell; someone who can offer guidance on handling a problem; and someone who would lend them money during financial difficulties. The resulting index scores range from one to four.
Furthermore, to evaluate whether the time spent in the club influences the reciprocal relationship between network involvement and health, we asked respondents to indicate how frequently they attend meetings, events, or sessions over the past six months. They could choose from options such as “less often,” “several times in half a year,” “several times a month,” or “several times a week.” Higher scores reflected greater frequency of participation.
Model specifications
In this study, we followed an iterative model specification process. Due to the limited sample size, the model proved to be somewhat sensitive. To address this, we tested multiple model configurations that included different parameters. The model ultimately selected for analysis demonstrated the best fit and convergence ratios across the health measures and clubs studied.
Specifically, we tested for age homophily by including the simX term for an age homophily term for the age variable (see Table A6).
Additionally, to model the different processes of tie formation and tie maintenance, we specifically model tie formation and maintenance by including the health homophily parameter once with the creation function as well as the endowment function (see Table A5). While the creation function specifically models the creation of previously non existing ties, the endowment function models the maintenance of existing ties, with a positive effect indicating tie maintenance, and a negative effect indicating tie dissolution (Ripley et al., Reference Ripley, Snijders, Boda, Vörös and Preciado2024).
Further, we checked for gender homophily in the network dynamics part for the second club (see Table A7).
Also, we accounted for the existence of kinship or marriage within the clubs (see Table A8). We additionally checked whether being or having been member in the steering committee within the club make people more likely to nominate others as close ties and whether there is homophilous sorting (see Table A9). We included the position variable as time constant.
Furthermore, we tested whether general perceived support also outside the club (see Table A10) or the time spent in the clubs (see Table A11) changes the results.
Also, we checked for whether peer influence effect is more pronounced among central people in the network by including the avInSim term instead of the avSim term (see Table A12).
SAOM results, tie formation and maintenance

†p < 0.1 * p < 0.05 ** p < 0.01 *** p < 0.001
Standard errors in parentheses.
All t-ratios are below 0.1.
aFor the binary variable physical health, we used the sameX term instead of the simX term.
SAOM results, age homophily

†p < 0.1 * p < 0.05 ** p < 0.01 *** p < 0.001
Standard errors in parentheses.
All t-ratios are below 0.1.
aFor the binary variable physical health, we used the sameX term instead of the simX term.
SAOM results, gender homophily in club 2

†p < 0.1 * p < 0.05 ** p < 0.01 *** p < 0.001
Standard errors in parentheses.
All t-ratios are below 0.1.
aFor the binary variable physical health, we used the sameX term instead of the simX term.
SAOM results, Club 1, model specification to test for kin effects

SAOM results, official position in the clubs’ steering committee

†p < 0.1 * p < 0.05 ** p < 0.01 *** p < 0.001
Standard errors in parentheses.
All t-ratios are below 0.1.
aFor the binary variable physical health, we used the sameX term instead of the simX term.
SAOM results, model specification to test for support

†p < 0.1 * p < 0.05 ** p < 0.01 *** p < 0.001
Standard errors in parentheses.
All t-ratios are below 0.1.
aFor the binary variable physical health, we used the sameX term instead of the simX term
SAOM results, model specification for frequency spent in club

†p < 0.1 * p < 0.05 ** p < 0.01 *** p < 0.001
Standard errors in parentheses.
All t-ratios are below 0.1.
aFor the binary variable physical health, we used the sameX term instead of the simX term.
SAOM results, alternative model specification for health influence

†p < 0.1 * p < 0.05 ** p < 0.01 *** p < 0.001
Standard errors in parentheses.
All t-ratios are below 0.1.
aFor the binary variable physical health, we used the sameX term instead of the simX term.


 Open access