




1. Introduction
Incentives are a cornerstone of experimental economics. The two most common methodological questions about the use of incentives are whether subjects should be paid and how subjects should be paid. Over the years, the field has accumulated a voluminous empirical literature in an attempt to inform the answers to these questions.Footnote 1 The theoretical work, on the other hand, has been relatively scarce. Following the early contributions to the question of whether to pay subjects (Smith, Reference Smith1976; Reference Smith1982), the recent literature has mostly been occupied with the question of how to pay subjects, or incentive compatibility of different payoff mechanisms (Cox et al., Reference Cox, Sadiraj and Schmidt2014; Harrison and Swarthout, Reference Harrison and Swarthout2014; Azrieli et al., Reference Azrieli, Chambers and Healy2018, Reference Azrieli, Chambers and Healy2020; Li, Reference Li2021). However, there is another question about incentives that so far has received no theoretical treatment, which is how much to pay subjects, or what should be the level of incentives. I attempt to fill in this gap by offering three main contributions. First, I use a simple utility-based framework to formalize the question about the optimal level of incentives. Second, I show theoretically that this question is well known under fairly mild conditions. Third, I illustrate my approach using the data from several well-known experiments and offer a practical guide for implementing it.
The current approach to how much to pay subjects is typically ad hoc. It usually amounts to setting incentives at some conventional level based on past experiments, a target hourly wage, or lab policies. None of these conventions, however, are standard within the field (Cloos et al., Reference Cloos, Greiff and Rusch2023). To put some structure on the problem of choosing an optimal level of incentives, I focus on an important case when incentives are a treatment variable.
Incentives are among the most commonly used treatment variables in economic experiments, both field and lab. Researchers have been studying the effect of incentives on educational outcomes, prosocial behavior, and lifestyle habits (Gneezy et al., Reference Gneezy, Meier and Rey-Biel2011), on dishonest behavior (Fischbacher & Föllmi-Heusi, Reference Fischbacher and Föllmi-Heusi2013; Gibson et al., Reference Gibson, Tanner and Wagner2013; Balasubramanian et al., Reference Balasubramanian, Bennett and Pierce2017) and distributional choices (El Harbi et al., Reference El Harbi, Bekir, Grolleau and Sutan2015), on behavior in social dilemmas (Amir et al., Reference Amir, Rand and Gal2012; Rousu et al., Reference Rousu, Corrigan, Harris, Hayter, Houser, Lafrancois, Onafowora, Colson and Hoffer2015; Yamagishi et al., Reference Yamagishi, Li, Matsumoto and Kiyonari2016; Mengel, Reference Mengel2017; Leibbrandt and Lynham, Reference Leibbrandt and Lynham2018) and coordination games (Parravano and Poulsen, Reference Parravano and Poulsen2015), on behavior in dictator (Schier et al., Reference Schier, Ockenfels and Hofmann2016; Larney et al., Reference Larney, Rotella and Barclay2019) and trust (Thielmann et al., Reference Thielmann, Heck and Hilbig2016) games, on behavior in psychological games (Bellemare et al., Reference Bellemare, Sebald and Suetens2018) and generic normal-form games (Pulford et al., Reference Pulford, Colman and Loomes2018), on risk preferences (Holt and Laury, Reference Holt and Laury2002), auctions (Smith and Walker, Reference Smith and Walker1993), preference reversals (Grether and Plott, Reference Grether and Plott1979; Cox and Grether, Reference Cox and Grether1996), finance experiments (Kleinlercher and Stöckl, Reference Kleinlercher and Stöckl2018), and performance on various tasks (Araujo et al., Reference Araujo, Carbone, Conell-Price, Dunietz, Jaroszewicz, Landsman, Lamé, Vesterlund, Wang and Wilson2016; Brañas-Garza et al., Reference Brañas-Garza, Kujal and Lenkei2019; Enke et al., Reference Enke, Gneezy, Hall, Martin, Nelidov, Offerman and van de Ven2023; Alekseev, Reference Alekseev2022).
To fix the terms, by (monetary) incentives I understand monetary payments to subjects that are expected to affect their behavior or outcomes. A classic example of that would be experiments where subjects receive a piece rate for completing a real-effort task and the question is whether a higher piece rate induces more effort. My framework also applies to cases when money is a treatment variable, but not an incentive. An example of that would be an experiment that studies the effect of money on happiness and the question is whether a higher monetary transfer leads to greater happiness.
A key factor that enables studying the optimal level of incentives is that researchers are often interested in testing qualitative hypotheses. A typical research question is whether a treatment variable affects subjects’ behavior while the specific values of the treatment variable are nuisance parameters. For example, a researcher studying performance pay is more likely to be interested in whether a higher piece rate increases effort rather than whether a specific 2-cent bump in a piece rate increases effort.Footnote 2 The qualitative nature of hypotheses creates a degree of freedom that I exploit to pick an “optimal,” in a sense precisely defined below, level of incentives.
I introduce a Budget Minimization problem in which a researcher chooses the level of monetary incentives that allows her to find a predicted treatment effect for some conventional levels of significance and power while minimizing the total expected budget. The Budget Minimization problem follows from a researcher’s utility function and relies on two key ingredients. First, it relies on the power analysis to compute the required sample size for a predicted effect size. Second, it relies on a model (structural or reduced-form) to predict the outcomes in the treatment and control groups for a given level of incentives. The outcome of the Budget Minimization problem is the optimal level of incentives in the treatment group relative to the control, a variable I refer to as the treatment strength. The treatment strength pins down the required sample size, expected payoffs per subject, and the total expected budget.
The key tension in the Budget Minimization problem is between a required sample size and expected per-subject payoffs. On the one hand, increasing incentives leads to a higher expected effect size, which in turn drives down the required sample size and hence the expected total budget (the sample-size effect). On the other hand, increasing incentives leads to higher expected per-subject payoffs, which, in turn, lead to a higher expected total budget (the payoff effect). My main theoretical result is that, under fairly mild assumptions, the Budget Minimization problem has a non-trivial solution where the two effects are in the exact balance. I illustrate the properties of a solution using existing experiments, sketch a practical guide for setting up the problem and solving it for one’s own design, and provide a sample R code (see Appendix C).
My main contribution is to offer a disciplined economic approach to the problem of choosing an optimal level of monetary incentives in experiments where incentives are a treatment variable. Experimental budgets are rarely explicitly discussed by researchers. Money, however, is a scarce resource, which makes it natural to ask what is an optimal way to use it. This question is of particular concern to junior scholars and PhD students, whose budgets are usually quite small while the pressure to produce significant results is high, as well as to researchers running expensive large-scale interventions in the field. This question is relevant both for new experimentsFootnote 3 and replications.Footnote 4 Finally, the calculations from the Budget Minimization problem can serve as a convincing justification of the grant money requested from a funding agency.
The Budget Minimization problem is an alternative approach to an optimal experimental design that expands experimental economists’ toolkit. The main point of departure from the traditional approach to an optimal design is the explicit inclusion of budget considerations. As an alternative approach, the Budget Minimization problem challenges some received wisdom in experimental design. For example, a common recommendation is to follow the maximum separation principle: to set the values of a treatment variable as far apart as possible to ensure a maximum separation between predictions or a maximum variation in the treatment (Friedman and Sunder, Reference Friedman and Sunder1994; List et al., Reference List, Sadoff and Wagner2011; Holt, Reference Holt2019).Footnote 5 My approach shows that it may not be optimal to do this if separating the treatment values as much as possible leads to prohibitively high payoffs. Maximizing treatment strength, in other words, is not equivalent to maximizing a researcher’s utility.
2. Related literature
The present work is most closely connected to the literature that exploits structural modeling to guide experimental design. This literature shows how to use theoretical models to optimize the design of an experiment, typically in terms of statistical power or precision of parameter estimates. Harrison Reference Harrison1989 brought the connection between incentives and power analysis into experimental discourse and showed that subjects’ deviations from optimal behavior in auctions lead to small utility losses (a flat-maximum problem).Footnote 6 Harrison Reference Harrison and Hey(1994) extends the flat-maximum critique to experimental tests of the expected utility theory. Moffatt Reference Moffatt and Boumans(2007) uses results from the statistical optimal experimental design literature and previous estimates from structural models to optimize (in the sense of maximizing the precision of parameter estimates) experiments that elicit willingness to pay and risk preferences. Rutström and Wilcox Reference Rutström and Wilcox2009 use two different structural models of learning along with previous estimates of their structural parameters to optimize their experiment. Woods Reference Woods(2020) proposes the use of structural (quantal response) model simulations to improve the accuracy of an ex-ante power analysis and to guide optimal design decisions. Monroe Reference Monroe2020 uses simulations to conduct the power analyses of two sets of binary lottery choices designed to classify subjects according to one of two risk preference models. The approach I take is similar to these works in that I also advocate for, and show the benefits of, using theoretical models to guide experimental design. The main difference is that I use a different objective function in the analysis. While the previous work, following the classic optimal experimental design literature (Ford et al., Reference Ford, Torsney and Wu2018; Atkinson, Reference Atkinson2018; Fedorov, Reference Fedorov1972; Silvey, Reference Silvey1980), focuses mainly on the statistical properties of a design, I use experimental budget as an objective function. My approach calls for balancing statistical considerations (required sample size) with cost considerations (expected payoff per subject) to find an optimal level of incentives.
This work also contributes to a series of papers that provide tools and guidance for conducting economic experiments. These papers offer general statistical considerations for running an experiment. List et al. Reference List, Sadoff and Wagner2011 is a concise yet comprehensive guide to experimental design covering the issues of randomization and optimal sample arrangement. Bellemare et al. Reference Bellemare, Bissonnette and Kröger2016 develop a statistical package to simulate the power of experiments for parametric and nonparametric statistical tests, different estimation methods, and treatment variables. Vasilaky and Brock Reference Vasilaky and Brock2020 focus on power analysis and provide code examples and tools needed in power calculations. The present work is similar to these papers in that it is also motivated by statistical considerations for running an experiment. The main differences are that I focus on a special, although important, class of experiments in which the treatment variable is monetary incentives and that I supplement statistical considerations with cost considerations in a novel way. Both List et al. Reference List, Sadoff and Wagner2011 and Bellemare et al. Reference Bellemare, Bissonnette and Kröger2016 feature cost and budget considerations: List et al. Reference List, Sadoff and Wagner2011 provide guidance for sample arrangement in case the sampling costs differ by treatment and Bellemare et al. Reference Bellemare, Bissonnette and Kröger2016’s package can predict the maximal power an experiment can reach given a specified budget constraint. The present work differs from these papers in that it provides empirical guidance on, and theoretical justification for, how a researcher can optimally choose a level of incentives, in case they are a treatment variable, to minimize the budget.
More broadly, this work connects to the literature that studies the use of incentives in economic experiments. This literature studies the theoretical properties of common payoff mechanisms or proposes new payoff mechanisms that improve upon the existing ones. Cox et al. Reference Cox, Sadiraj and Schmidt2014 discuss the theoretical properties of popular payoff mechanisms, explain which mechanisms are incentive compatible for which theories, and empirically show that different payoff mechanisms significantly affect subjects’ revealed risk preferences. Harrison and Swarthout Reference Harrison and Swarthout2014 empirically show that risk preference models that assume violations of the independence axiom cannot be reliably estimated when an experiment assumes the validity of this axiom via the random lottery incentive mechanism. Azrieli et al. Reference Azrieli, Chambers and Healy2018, Azrieli et al. Reference Azrieli, Chambers and Healy2020 introduce a theoretical framework for analyzing the incentive compatibility of different payoff mechanisms and identify assumptions needed to guarantee the incentive compatibility of the random problem selection mechanism and paying for every period. Li Reference Li2021 identifies necessary and sufficient conditions for a payoff mechanism to be incentive-compatible for all risk preference models with complete and transitive preferences and proves that her new payoff mechanism, the Accumulative Best Choice, is the only incentive compatible mechanism in a multiple-task setting. Johnson et al. Reference Johnson, Baillon, Bleichrodt, Li, van Dolder and Wakker2021 introduce the Prince payoff mechanism, which they show to be a transparent and incentive-compatible method for measuring preferences that improves upon popular payoff mechanisms, such as the random incentive mechanism. The main difference of the present work from these papers is that it studies theoretically the optimal level of incentives, or how much to pay subjects, in case when incentives are a treatment variable.
3. Budget minimization problem
Consider a researcher planning a budget for an experiment. The expected total experimental budget, b, depends on the number of subjects in the experiment and expected per-subject payoffs. The researcher plans to use a standard between-subject design with two groups: control (C) and treatment (T). Let  $ G = \{C, T\} $ denote the set of experimental groups and $ g \in G $ be its generic element. For simplicity, assume that the researcher plans to use an equal number of participants, n, in each group.Footnote 7 The researcher uses monetary incentives as single treatment variable. Depending on the nature of the choice variable in the experiment, the researcher could use, for example, the difference in means or the difference in proportions as the effect of interest.
Let τg denote the value of the treatment variable in group g. I denote the difference between the values of the treatment variable in the treatment and control groups as  $ \tau \equiv \tau_T - \tau_C, \tau \in \mathbb{R}_{+} $ and refer to it as the treatment strength. In some cases it can be of interest to have the treatment strength as a multiplicative factor rather than a difference. The above definition of the treatment strength accommodates these cases by defining the values of the treatment variable on a logarithmic scale. If one defines $ \tau \equiv \ln \tilde{\tau}, \tau_{g} \equiv \ln \tilde{\tau}_{g}$, then $ \tilde{\tau} = \exp(\tau) = \exp(\tau_T)/\exp(\tau_C) $ is the multiplicative treatment strength. I assume that the treatment strength is the only lever the researcher uses to optimize the budget.Footnote 8
The researcher uses the power analysis to determine the required number of subjects in each group. This number will depend on the statistical parameters (significance α and power  $ 1 - \beta $) and on the expected outcomes in each group, µg. The researcher sets significance and power at some conventional levels.Footnote 9 The expected outcomes can be, for example, the mean choices in each group in case the choice variable is continuous or the proportions of subjects choosing a given alternative in case the outcome is discrete.Footnote 10 The expected effect size is then typically a difference in expected outcomes between the treatment and control groups, $\mu_T - \mu_C$, which depends on, although not identical to, the chosen treatment strength τ. To predict the expected effect size, the researcher uses a model parameterized by a vector of parameters γ. The model can be a structural one, in which case the vector of parameters can include, for example, risk aversion, time preferences parameters, social preferences parameters, the curvature of the cost-of-effort function, etc. Alternatively, the model can be a reduced-form one, in which case the parameters will be regression coefficients. The researcher takes the parameters as given based on prior estimates. The expected outcomes will then depend on the treatment strength, behavioral parameters, as well as any other potential parameters of the experiment lumped in a vector δ: $\mu_{g} = \mu_{g}(\tau \mid \gamma, \delta) $. Vector δ includes things that are not explicitly modeled but that can nevertheless affect behavior, for example, subject pool, number of rounds, framing of the instructions, whether a study is done in the lab or in the field, etc. To make everything a function of τ only, I use a convention that the level of incentives in the control group, τC, is included in vector δ. To summarize, the required number of subjects in each group depends on the parameters as follows: $ n = n(\tau \mid \alpha, \beta, \gamma, \delta) $. It is worth emphasizing that the researcher does not pick n, as is the case in a typical power analysis. Instead, she picks τ that affects expected outcomes that in turn pin down n, conditional on other parameters.
The expected per-subject payoffs in each group, πg, will depend on expected outcomes and on the way the outcomes are translated into payoffs. For example, when the outcome is the mean number of problems solved in a real-effort task and the treatment variable is a piece rate, the relationship between outcomes and payoffs takes a separable form:  $ \pi_{g}(\tau \mid \gamma, \delta) = \tau_{g}\mu_{g}(\tau \mid \gamma, \delta)$. In addition to the payoffs πg, subjects in each treatment group receive a participation payment w. The total expected per-subject payoff across two groups is then $2w + \pi_C + \pi_T$.
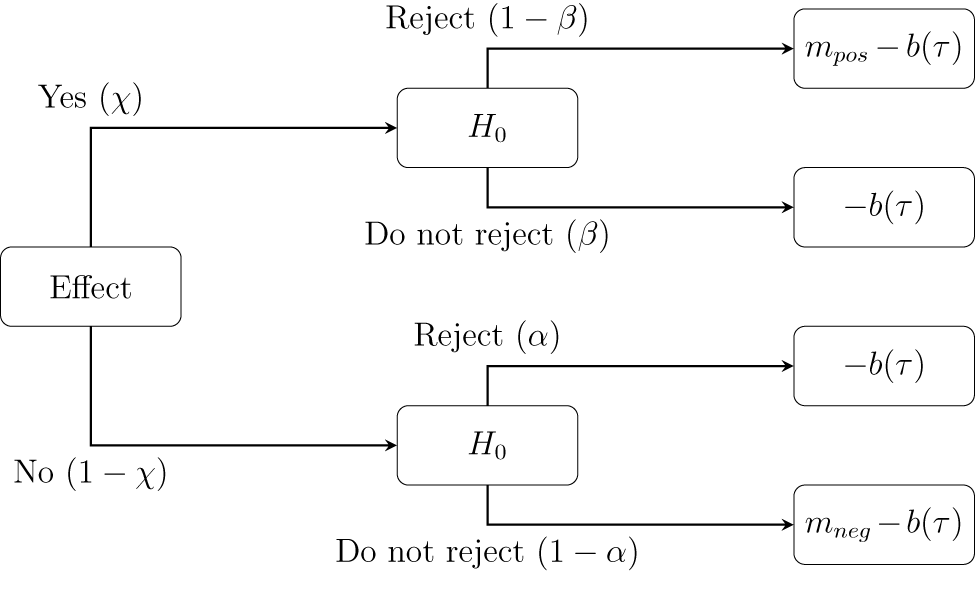
Assume the researcher is risk-neutral and places a prior probability of 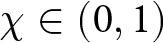 $ \chi \in (0, 1) $ on the existence of the effect she is trying to find. For the sake of illustration, I assume that mneg is her benefit from finding a true negative result, mpos is her benefit from finding a true positive result, and that she receives zero benefits from making either a Type I or Type II errors. The researcher’s budget is $b(\tau)$, which is a function of the treatment strength. In Appendix A, I show that the results hold under arbitrary benefits and arbitrary utility function (as long as it is strictly increasing), including the case of risk aversion. Figure 1 shows all four possible outcomes for the researcher that are contingent on whether the effect exists or not and whether the researcher rejects the null hypothesis or not.
Possible outcomes and probabilities
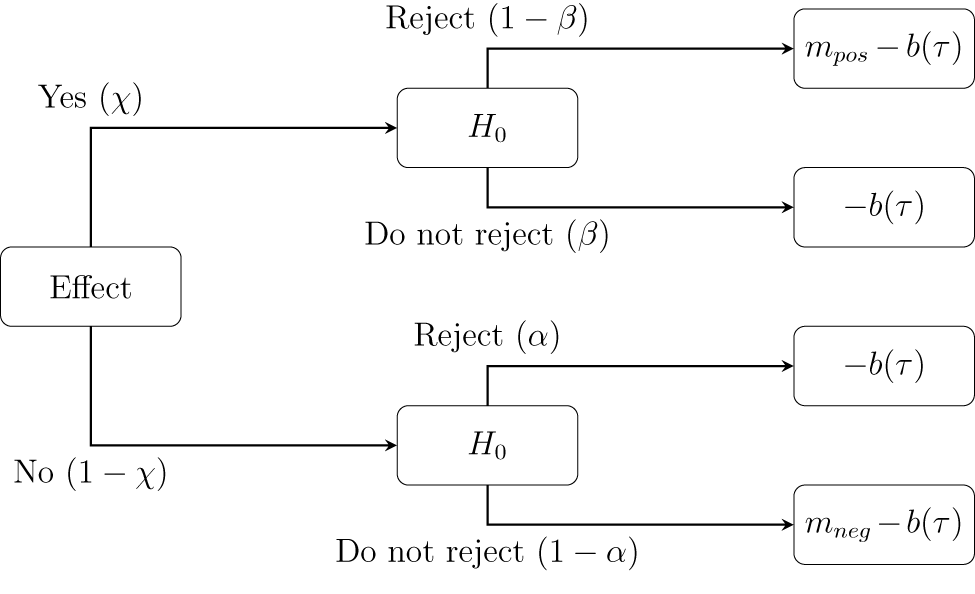
Using Figure 1, it is easy to derive the researcher’s expected utility function from conducting the experiment:
 \begin{equation}
U(\tau \mid \alpha, \beta, \chi, \gamma, \delta) = \chi(1-\beta)m_{pos} + (1-\chi)(1-\alpha)m_{neg} - b(\tau \mid \alpha, \beta, \gamma, \delta).
\end{equation}
\begin{equation}
U(\tau \mid \alpha, \beta, \chi, \gamma, \delta) = \chi(1-\beta)m_{pos} + (1-\chi)(1-\alpha)m_{neg} - b(\tau \mid \alpha, \beta, \gamma, \delta).
\end{equation}Since the researcher’s utility as a function of τ equals to the negative of the budget, which is also a function of τ, plus a term that does not depend on τ, maximizing the utility function is equivalent to minimizing the budget:
 \begin{equation}
\min_{\tau} b(\tau \mid \alpha, \beta, \gamma, \delta) = n(\tau \mid \alpha, \beta, \gamma, \delta)\left(2w + \pi_C(\gamma, \delta) + \pi_T(\tau \mid \gamma, \delta)\right).
\end{equation}
\begin{equation}
\min_{\tau} b(\tau \mid \alpha, \beta, \gamma, \delta) = n(\tau \mid \alpha, \beta, \gamma, \delta)\left(2w + \pi_C(\gamma, \delta) + \pi_T(\tau \mid \gamma, \delta)\right).
\end{equation}I refer to this dual problem as the Budget Minimization problem. I formulate this problem without any constraints for simplicity. I discuss constraints in Section 6.
The intuition for why the Budget Minimization problem is well defined is the following. The response of the budget to a change in the treatment strength depends on two effects: the sample-size effect and the payoff effect. Increasing τ is expected to increase the difference in outcomes between the treatment and control groups. The predicted effect size will increase, which in turn will drive down the required number of subjects (the sample-size effect). On the other hand, increasing τ will increase the expected per-subject payoff in the treatment group due to the direct effect of higher incentives and the indirect effect of higher outcomes due to higher incentives (the payoff effect).Footnote 11 For example, if the expected per-subject payoff in the treatment group is  $ \pi_{T}(\tau \mid \gamma, \delta) = \tau_{T}\mu_{T}(\tau \mid \gamma, \delta)$, then the increase in τT is the direct effect of increasing τ, the increase in $\mu_{T}(\tau \mid \gamma, \delta)$ is the indirect effect of increasing τ, and the total increase in πT is the payoff effect. These two opposing effects—the sample-size effect and the payoff effect—can potentially lead to a point $ \tau^{*} $ where the expected total budget is minimized.
Formally, the following first-order necessary condition must hold at the optimal point  $ \tau^{*}$ (to avoid notational clutter, I drop the dependence on the parameters $ \alpha, \beta, \gamma, \delta $):
 \begin{equation}
-\underbrace{\frac{n'(\tau)}{n(\tau)}}_{\text{sample-size effect}} = \underbrace{\frac{\pi_{T}'(\tau)}{2w + \pi_{C}(
\tau) + \pi_{T}(\tau)}}_{\text{payoff effect}}.
\end{equation}
\begin{equation}
-\underbrace{\frac{n'(\tau)}{n(\tau)}}_{\text{sample-size effect}} = \underbrace{\frac{\pi_{T}'(\tau)}{2w + \pi_{C}(
\tau) + \pi_{T}(\tau)}}_{\text{payoff effect}}.
\end{equation}The condition states, intuitively, that at the optimum the percentage decrease in the required number of subjects due to the higher treatment strength (the sample-size effect) exactly offsets the percentage increase in the per-subject payoffs (the payoff effect). The theoretical question is under what conditions the Budget Minimization problem has a non-trivial solution. Before I turn to the formal analysis of this question, I present two examples of the Budget Minimization problem at work.
4. Budget minimization in practice
I illustrate the Budget Minimization problem in two common cases. In the first case, subjects’ choice variable is continuous and the effect of interest is the difference in mean choices. In the second case, subjects’ choice variable is discrete. In this case, the effect of interest can be either the difference in proportions of subjects choosing a given alternative (binary choice) or the difference in mean choices (more than two alternatives). I focus on the former case when the choice is binary, although a similar logic would apply to the latter case.
4.1. Continuous case
To illustrate the Budget Minimization problem in the continuous case, I use the experiment of DellaVigna and Pope Reference DellaVigna and Pope2018. In the experiment, subjects perform a real-effort task in which they have to repeatedly press two buttons for ten minutes. Subjects receive  $ w = \$1 $ for their participation. A subject’s choice variable is the number of button presses, a proxy for a subject’s effort. The outcome variable is the average number of button presses.
Suppose that the researcher is interested in testing whether introducing a piece rate in the treatment group increases effort relative to the control group that receives no piece rate,  $ \tau_C = 0 $. The expected per-subject payoff in group g is $ \pi_g = \tau_g \mu_g $. Subjects receive a piece rate for each 100 button presses. The goal is to determine the treatment strength τ that allows one to detect an increase in effort for the conventional levels of significance (α = 0.05) and power ( $1-\beta = 0.8$) while minimizing the required budget.
DellaVigna and Pope (Reference DellaVigna and Pope2018; P. 1063) propose a model of effort choice that gives the following closed-form solution for the mean effort:Footnote 12
 \begin{equation}
\mu_g(\tau \mid \gamma, \delta) = \frac{1}{\eta}[\ln(s + \tau_g) - \ln k].
\end{equation}
\begin{equation}
\mu_g(\tau \mid \gamma, \delta) = \frac{1}{\eta}[\ln(s + \tau_g) - \ln k].
\end{equation}where η and k are the curvature and scale parameters of the cost-of-effort function, respectively, s is an intrinsic reward for performing the task, and τg is a piece rate in group g.
One can find the required number of subjects per group conditional on τ and other parameters using the standard formula for computing the sample size in a two-sided t-test for the difference in means:
 \begin{equation}
n(\tau \mid \alpha, \beta, \gamma, \delta) = 2\left(z_{1-\alpha/2} + z_{1-\beta}\right)^2\left(\frac{\sigma}{\mu_T(\tau \mid \gamma, \delta) - \mu_C(\gamma, \delta)}\right)^2,
\end{equation}
\begin{equation}
n(\tau \mid \alpha, \beta, \gamma, \delta) = 2\left(z_{1-\alpha/2} + z_{1-\beta}\right)^2\left(\frac{\sigma}{\mu_T(\tau \mid \gamma, \delta) - \mu_C(\gamma, \delta)}\right)^2,
\end{equation} where  $z_{1-\alpha/2}$ and $z_{1-\beta}$ are the quantiles of the standard normal distribution, µC and µT are the predicted mean efforts in the control and treatment groups, which can be computed using (4), and σ is the standard deviation of effort.Footnote 13
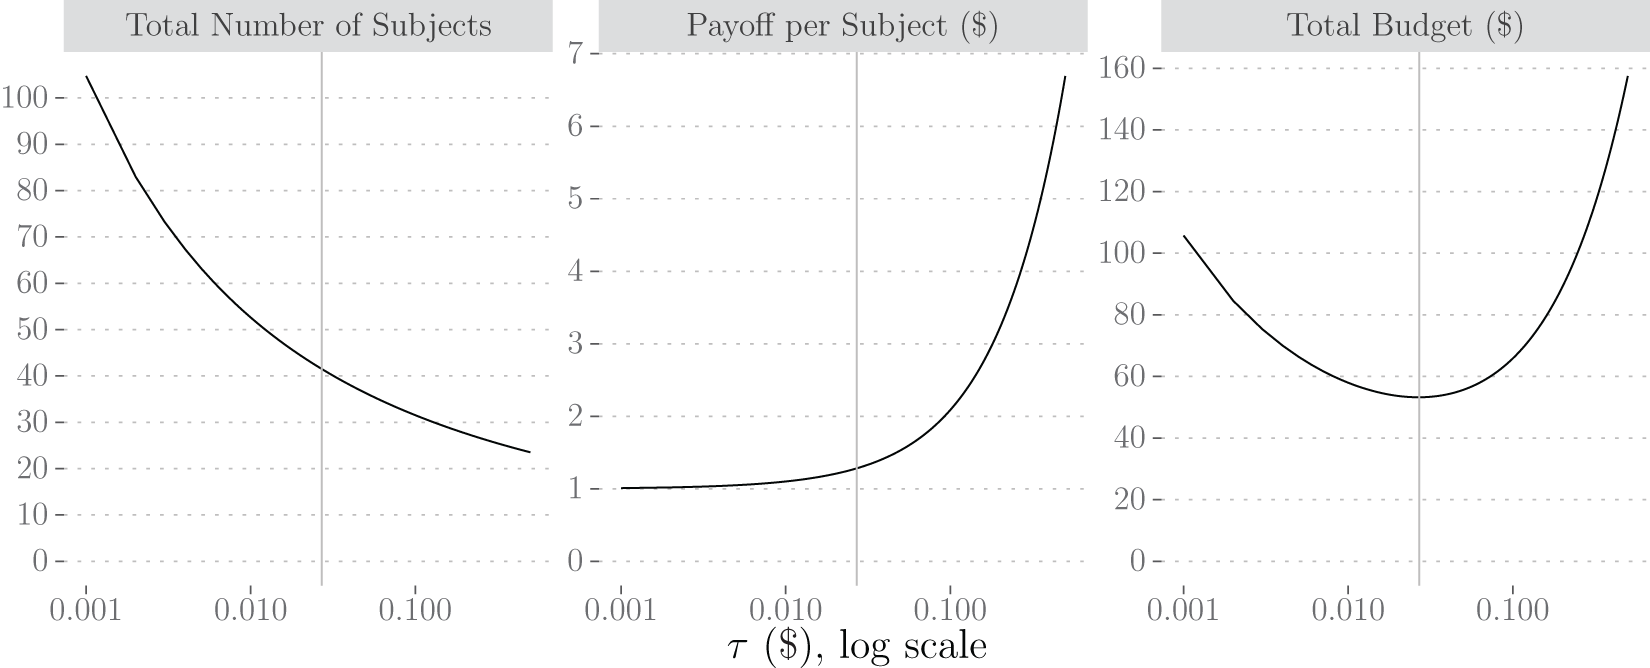
Figure 2 shows how the total number of subjects, the expected payoff per subject, and the total budget change with τ. I compute the total number of subjects across both groups, 2n, using (5). I plug in the values of the quantiles of the standard normal distribution using the conventional levels of α = 0.05 and β = 0.2. I use the authors’ estimate of σ = 653.578104 (Supplementary Material “NLS_results_Table5_EXPON.csv:”). I use (4) to compute the predicted mean effort in the control group µC by plugging in the authors’ estimates of behavioral parameters:  $ \eta = 0.015641071, k = 1.70926702\times 10^{-16}, s = 3.72225938\times 10^{-6}$ (Supplementary Material “NLS_results_Table5_EXPON.csv:”) and using $\tau_C = 0$. Finally, I use (4) to compute the predicted mean effort in the treatment group µT using the same estimates of behavioral parameters as for µC but for different values of $\tau_T = \tau_C + \tau = \tau$. As Figure 2 shows, the total number of subjects decreases in τ since higher incentives increase the expected effect size.
Variables of the DellaVigna and Pope Reference DellaVigna and Pope2018 Experiment as a Function of τ
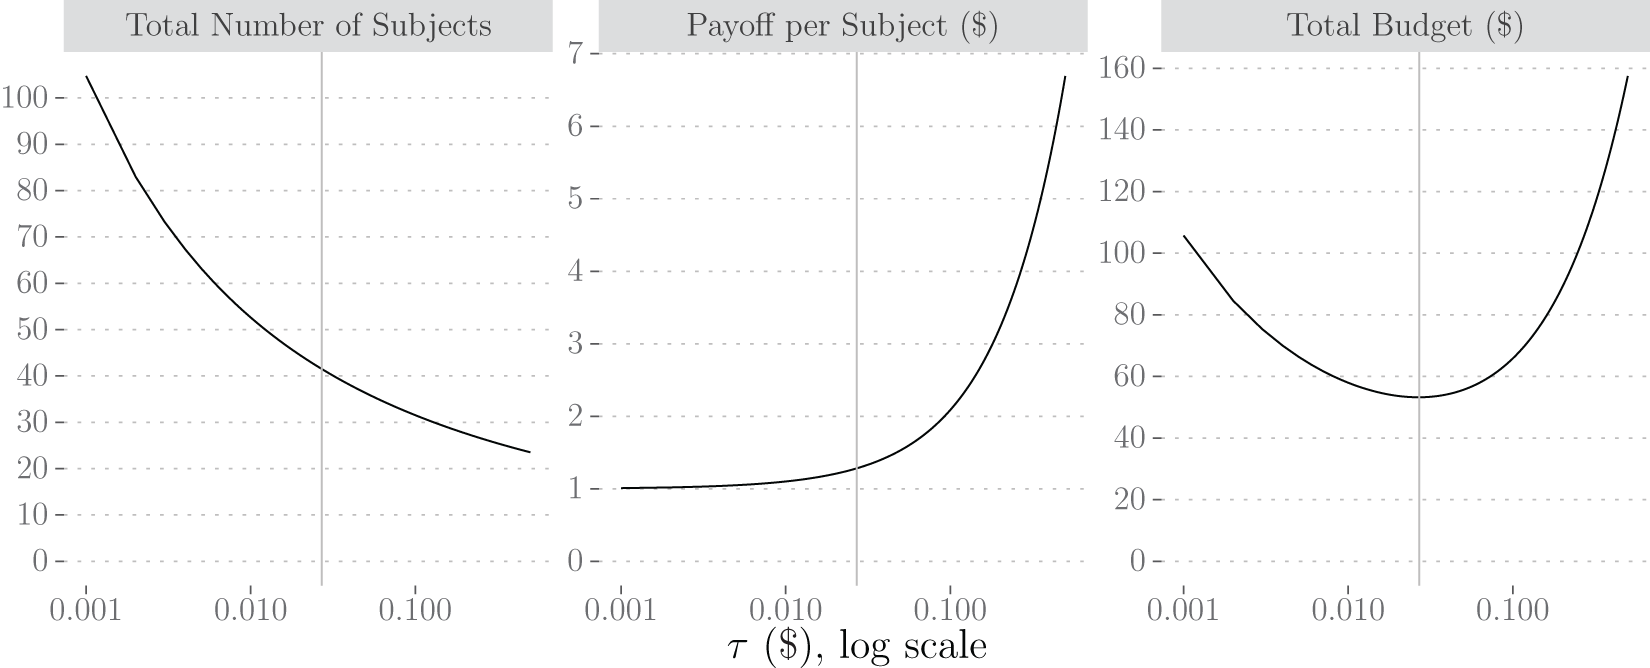
To compute the expected payoff per subject across both groups,  $ w + (\pi_C + \pi_T)/2 $, I first plug in the value of the fixed payment used in the experiment, w = 1. I compute the expected payoff per subject in the control group as $ \pi_C = \tau_C \mu_C = 0 $ (since $\tau_C = 0$). I compute the expected payoff per subject in the treatment group as $ \pi_T = \tau_T \mu_T = \tau \mu_T $ for different values of treatment strength τ, where µT is computed as before. The expected payoff per subject increases in τ since higher incentives increase expected effort, as well as the payoff per unit of effort.
I compute the expected total budget for different values of τ using (2), which is simply the product of the two previously computed quantities: the total number of subjects, 2n, and the expected payoff per subject,  $w + (\pi_C + \pi_T)/2$. The expected total budget b has a convex shape and reaches a minimum at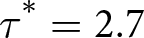 $ \tau^* = 2.7$ cents.
Conducting an experiment with the optimized parameters would be extremely cheap: the experiment would require a total of 42 subjects with an expected per-subject payoff across both groups of $1.28 and an expected total budget of just $53. For comparison, the original experiment has 0 and 4 cents treatments, although the total number of subjects in both groups is more than 1000. While the optimal numbers appear small, they are not unreasonable given the large treatment effects found in the data. For instance, the mean effort levels in the 0 and 4 cents treatments are 1521 and 2132, respectively (DellaVigna and Pope, Reference DellaVigna and Pope2018; P. 1045, Table 3). Assuming a common standard deviation of 650, the traditional power analysis would yield 18 subjects per treatment group for the levels of significance (0.05) and power (0.8) assumed in my calculation.
4.2. Discrete choice
To illustrate the Budget Minimization problem in the discrete-choice setting, I use the classic Holt and Laury Reference Holt and Laury2002 experiment on risk aversion. In this experiment, which popularized the multiple-price-list elicitation method, subjects make a series of binary choices between a safe and a risky lottery. The alternatives are ordered such that a risky lottery gradually becomes more attractive. Experimental treatments involve changing the level of incentives by large factors to see whether this affects the proportion of subjects choosing a safe lottery.
For illustrative purposes, suppose that the researcher is interested in testing whether scaling the payoffs of each lottery up affects the proportion of subjects choosing a safe lottery in just one pair.Footnote 14 Suppose the researcher picks pair 5 (Holt and Laury, Reference Holt and Laury2002; P. 1645, Table 1) in which the safe lottery pays $2 or $1.6 with equal chances and the risky lottery pays $3.85 or $0.1 with equal chances in the control group, and in which the safe lottery pays $2 $ \times \tau $ or $1.6 $ \times \tau $ with equal chances and the risky lottery pays $3.85 $ \times \tau $ or $0.1 $ \times \tau $ with equal chances in the treatment group. Here τ is the multiplicative treatment strength. The expected per-subject payoff in group g is $ \pi_{g} = \tau_{g}(\mu_{g}EV_{A} + (1 - \mu_{g})EV_{B}) $, where EVA and EVB are the expected values of the safe and risky lotteries, respectively, in the control group (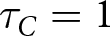 $ \tau_C = 1 $) and µg is the proportion of subjects choosing the safe lottery in group g. The goal is to determine the treatment strength that allows the researcher to detect a change in the proportion of subjects choosing the safe lottery for the conventional levels of significance (α = 0.05) and power ( $ 1 - \beta = 0.8 $) while minimizing the required budget.
Holt and Laury Reference Holt and Laury2002 use the stochastic choice model that specifies the probability of choosing the safe lottery in group g as follows:
 \begin{equation}
\mu_{g}(\tau \mid \gamma, \delta) \equiv \mathbb{P}(A)_{g} = \frac{U_{A_{g}}^{1/\lambda}}{U_{A_{g}}^{1/\lambda} + U_{B_{g}}^{1/\lambda}},
\end{equation}
\begin{equation}
\mu_{g}(\tau \mid \gamma, \delta) \equiv \mathbb{P}(A)_{g} = \frac{U_{A_{g}}^{1/\lambda}}{U_{A_{g}}^{1/\lambda} + U_{B_{g}}^{1/\lambda}},
\end{equation} where  $ U_{A_{g}}, U_{B_{g}} $ are the expected utilities of the safe and risky lotteries, respectively, in group g and λ is the noise parameter. The expected utility uses an expo-power utility-of-money function of the formFootnote 15
 \begin{equation}
u(x) = \frac{1 - \exp(-ax^{1-r})}{a},
\end{equation}
\begin{equation}
u(x) = \frac{1 - \exp(-ax^{1-r})}{a},
\end{equation}where x is a monetary outcome, a is the constant risk aversion parameter, and r is the relative risk aversion parameter.
One can find the required number of subjects per group conditional on τ and other parameters using the standard formula for computing the sample size in a test for the difference in proportions:Footnote 16
 \begin{equation}
n(\tau \mid \alpha, \beta, \gamma, \delta) = (z_{1-\alpha/2} + z_{1-\beta})^2\frac{\mu_T(1-\mu_T) + \mu_C(1-\mu_C)}{(\mu_T - \mu_C)^2},
\end{equation}
\begin{equation}
n(\tau \mid \alpha, \beta, \gamma, \delta) = (z_{1-\alpha/2} + z_{1-\beta})^2\frac{\mu_T(1-\mu_T) + \mu_C(1-\mu_C)}{(\mu_T - \mu_C)^2},
\end{equation} where 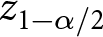 $z_{1-\alpha/2}$ and $z_{1-\beta}$ are the quantiles of the standard normal distribution, and µC and µT are the predicted proportions of subjects choosing the safe lottery in the control and treatment groups, computed as in (6).
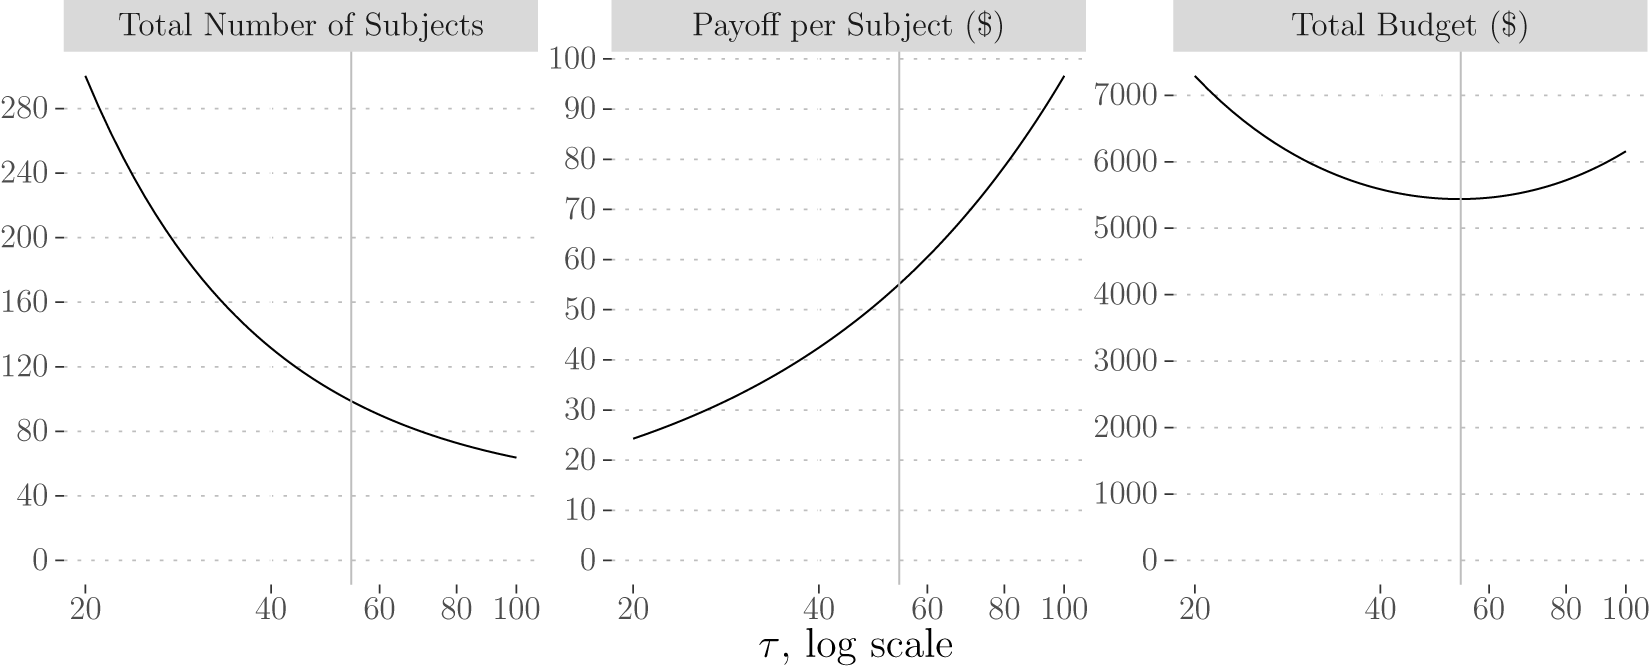
Figure 3 shows how the total number of subjects, the expected payoff per subject, and the total budget change with τ. I compute the total number of subjects across both groups, 2n, using (8). I plug in the values of the quantiles of the standard normal distribution using the conventional levels of α = 0.05 and β = 0.2. In the control group, I compute the expected utility of the safe lottery as  $U_{A_{C}} = u(2)0.5 + u(1.6)0.5$ and the expected utility of the risky lottery as $U_{B_{C}} = u(3.85)0.5 + u(0.1)0.5$, where the utility function u is given by (7) and the estimates of behavioral parameters are $ a = 0.029, r = 0.269$ (Holt and Laury, Reference Holt and Laury2002; P. 1653). I then plug in the resulting expected utilities, along with the authors’ estimate of λ = 0.134 (Holt and Laury, Reference Holt and Laury2002; P. 1653), into (6) to compute the predicted proportions of subjects choosing the safe lottery in the control group, µC. In the treatment group, I compute the expected utility of the safe lottery as $U_{A_{T}} = u(2\tau)0.5 + u(1.6\tau)0.5$ and the expected utility of the risky lottery as $U_{B_{T}} = u(3.85\tau)0.5 + u(0.1\tau)0.5$ for different values of τ. The utility function u is computed as in the control group. I then plug in the resulting expected utilities into (6) to compute the predicted proportions of subjects choosing the safe lottery in the treatment group, µT, for different values of τ. Finally, I plug in the resulting values for µC and µT into (8) to get the total number of subjects as a function of τ. As Figure 3 shows, the total number of subjects across both groups decreases in τ.
Variables of the Holt and Laury Reference Holt and Laury2002 Experiment as a Function of τ
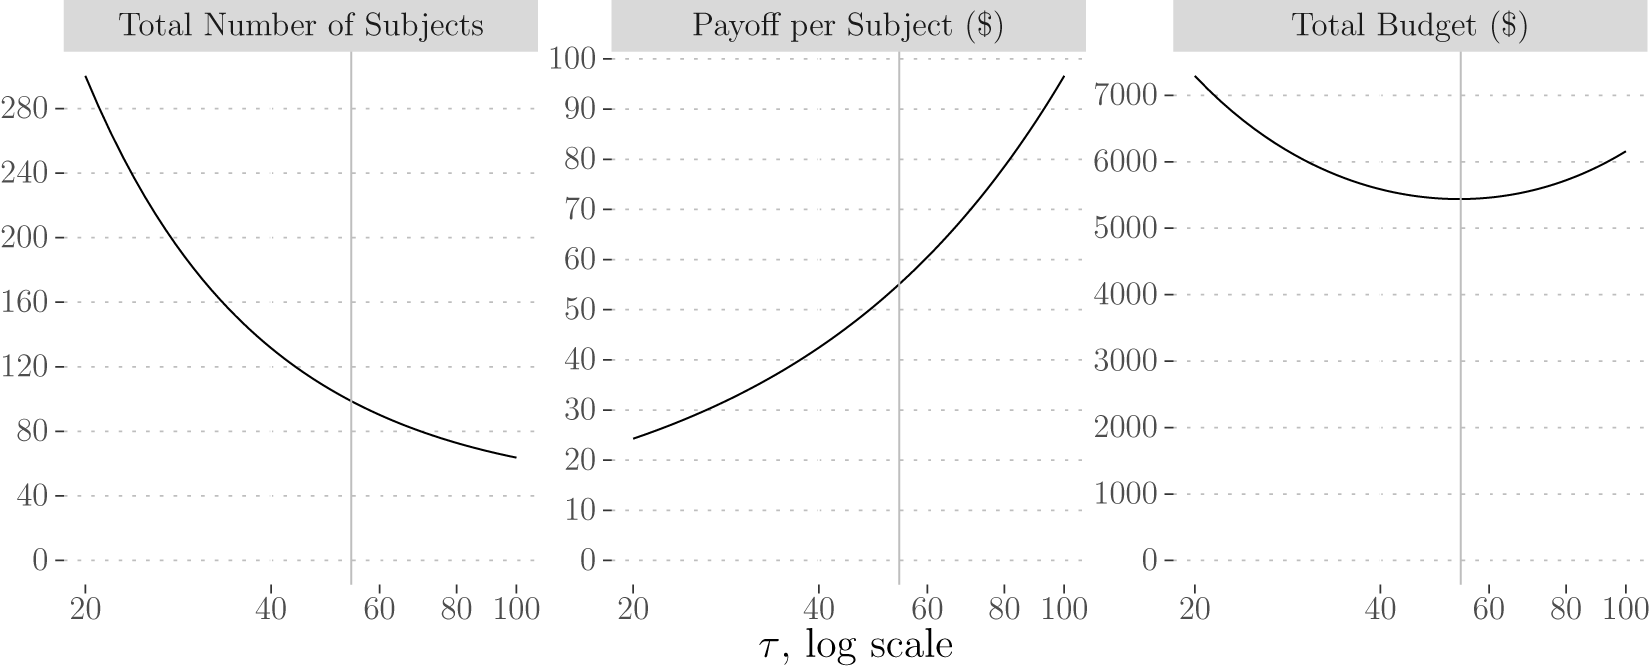
I compute the expected payoff per subject across both groups as  $ w + (\pi_C + \pi_T)/2 $. While the participation payment is not explicitly mentioned in the text, I assume $ w = \$5 $, which is a typical amount for laboratory experiments. I compute the expected payoff per subject in the control group as $ \pi_{C} = \tau_{C}(\mu_{C}EV_{A} + (1 - \mu_{C})EV_{B}) = \mu_{C}EV_{A} + (1 - \mu_{C})EV_{B} $, since $\tau_C = 1$. The proportion of subjects choosing the safe lottery, µC, is computed as above, and the expected values are computed as $EV_A = 2\times0.5 + 1.6\times0.5 = 1.8$ and $EV_B = 3.85\times0.5 + 0.1\times0.5 = 1.975$. I compute the expected payoff per subject in the treatment group as $ \pi_T = \tau(\mu_{T}EV_{A} + (1 - \mu_{T})EV_{B}) $ for different values of treatment strength τ, where µT and the expected values are computed as before. As Figure 3 shows, the expected payoff per subject increases in τ.
I compute the expected total budget for different values of τ using (2), which is simply the product of the two previously computed quantities: the total number of subjects, 2n, and the expected payoff per subject,  $w + (\pi_C + \pi_T)/2$. The expected total budget has a convex shape, as in the previous example, and reaches a minimum at $\tau^* = 54$ (rounded to the nearest digit). This means that the payoffs need to be scaled by more than 50 times.
For the optimized parameters, the experiment would require a total of 99 subjects with an expected per-subject payoff across both groups of $ 55.1 and an expected total budget of $ 5439. For comparison, the original experiment does have a 50x treatment, although the number of subjects in this group is only 19.
5. Budget minimization in theory
I make two assumptions about the outcome function  $ \mu_T(\tau) $ to establish a theoretical result.
Assumption 1 (Continuous Differentiability) $\mu_T \in C^{1}$.
Assumption 2 (Regularity) $\lim_{\tau \rightarrow \tau^{low}} |\mu_T'| \lt \infty $ and $ \lim_{\tau \rightarrow \infty}d\ln \mu_T/d\ln \tau \lt 1$.Footnote 17
The first assumption is a technical one. The second assumption takes care of the case when µT is unbounded. In this case, it has to satisfy regularity conditions that require the outcome function (a) not to change too quickly when treatment increases from the lowest value and (b) that the elasticity of the outcome with respect to τ is small as the treatment strength gets large. Assumption 2 is satisfied automatically if µT is bounded.
Proposition 5.1. If µT satisfies Assumptions 1 and 2 the Budget Minimization problem has an interior solution.
Proof. See Appendix B.□
The idea of the proof relies on the Intermediate Value Theorem and the properties of the two components of the total budget: the sample size and expected payoffs.Footnote 18 I consider the limiting behavior of the derivative of the logarithm of the total budget with respect to τ. At the lower limit, when the treatment strength approaches the lower bound, the derivative of the budget goes to negative infinity. The driver behind this result is the required sample size. When the treatment strength is zero (additive case) or one (multiplicative case) the outcomes in the treatment and control groups are identical, which makes the required sample size infinite. Even the smallest increase in the treatment strength is enough to produce an infinitely large decrease in the required sample size. At the lower limit, therefore, the negative sample-size effect dominates the positive payoff effect.Footnote 19 When the treatment strength is infinitely large, neither the required sample size nor the expected payoffs change. The derivative of the total budget in the limit is zero. However, one can always find a large enough value of the treatment strength at which the derivative of the total budget is positive. At the upper limit, therefore, the positive payoff effect dominates the negative sample-size effect.Footnote 20 The derivative of the total budget is thus negative at the left endpoint and positive at the right endpoint. Since µT is continuously differentiable by Assumption 1, the Intermediate Value Theorem implies that the derivative of the total budget must cross zero. Since the first crossing will occur from below, the First Order Sufficient Condition for a Minimum implies that the point  $ \tau^{*} $ at which this happens must be a minimum point.
The result in Proposition 5.1 is surprisingly general. It applies both in the continuous and discrete cases. The assumptions required for the result are fairly weak. The discrete case effectively only requires Assumption 1, since the outcome is a proportion bounded between zero and one. The continuous case would in addition require Assumption 2 only if the outcome function is unbounded.
Proposition 5.1 explains why the motivating examples work. In the discrete case example, only Assumption 1 needs to be checked. Indeed, since the utility-of-money function (7) is continuously differentiable, so are the expected utility and outcome (6) functions. Proposition 5.1 immediately applies. In the continuous case example, the outcome function (4) is continuously differentiable but unbounded, hence we need to check Assumption 2, as well. First, consider
 \begin{align*}
\lim_{\tau \rightarrow 0^{+}}|\mu_T'| &= \lim_{\tau \rightarrow 0^{+}}\frac{1}{\eta(s + \tau)} = \frac{1}{\eta s}.
\end{align*}
\begin{align*}
\lim_{\tau \rightarrow 0^{+}}|\mu_T'| &= \lim_{\tau \rightarrow 0^{+}}\frac{1}{\eta(s + \tau)} = \frac{1}{\eta s}.
\end{align*}The limit is finite, since the estimates of s and η are strictly positive. On the other hand,
 \begin{equation*}
\lim_{\tau \rightarrow \infty}\tau (\ln \mu_T)' = \lim_{\tau \rightarrow \infty} \frac{\tau}{(s + \tau)\ln \left( \frac{s + \tau}{k} \right)} = \lim_{\tau \rightarrow \infty} \frac{1}{\left(\frac{s}{\tau} + 1\right)\ln \left( \frac{s + \tau}{k} \right)} = 0 \lt 1,
\end{equation*}
\begin{equation*}
\lim_{\tau \rightarrow \infty}\tau (\ln \mu_T)' = \lim_{\tau \rightarrow \infty} \frac{\tau}{(s + \tau)\ln \left( \frac{s + \tau}{k} \right)} = \lim_{\tau \rightarrow \infty} \frac{1}{\left(\frac{s}{\tau} + 1\right)\ln \left( \frac{s + \tau}{k} \right)} = 0 \lt 1,
\end{equation*}provided that k > 0, which is indeed the case given the model estimates. Hence, Proposition 5.1 also applies.
A few remarks about the theoretical result are in order. The first remark is that Assumptions 1 and 2 are sufficient but not necessary. It might as well be that they are not satisfied but the Budget Minimization problem has an interior solution. The second, and related, remark is that Assumption 1 can have a bite in some cases. It might fail to hold in reference-dependent models, which feature a discontinuity around a reference point. The budget, however, is still likely to have a minimum. The third, and final, remark is that Proposition 5.1 guarantees the existence but not the uniqueness of a solution. It is safe to assume that it should not cause any issues in practice. If there are several minimum points, one can simply compute the budget at each of the candidate solutions and pick the one giving the smallest budget.
6. Discussion
In this section, I propose some extensions of the Budget Minimization problem and show that its applicability goes beyond the examples analyzed so far. I also discuss some of the limits of its applicability.
6.1. Qualitative hypotheses
A key assumption that enables studying the optimal level of incentives in the present framework is that a researcher is interested in testing qualitative hypotheses, for example, whether increasing incentives increases a certain behavior or outcomes. The qualitative nature of a hypothesis creates a degree of freedom in the level of incentives that I exploit in the Budget Minimization problem. However, sometimes researchers are interested in specific values of a treatment variable, in which case the present framework is not applicable. For example, researchers might need to use several specific levels of incentives to estimate a structural model or identify a non-linear effect over that range of levels. In these cases, the levels of incentives are determined by identification concerns and cannot be used to optimize the budget. Instead, researchers should use the guidelines for how to optimally arrange their sample across those different levels of the treatment variable (McClelland, Reference McClelland1997; List et al., Reference List, Sadoff and Wagner2011).
6.2. Continuous treatment variable
Another key assumption is that a researcher can vary the level of incentives in a continuous manner, which enables the use of calculus to optimize the budget. While incentives can be typically varied that way, sometimes researchers might consider a few discrete levels, for example, for procedural reasons. Budget minimization is still possible in this case. A researcher can find the budget-minimizing level of incentives by simply evaluating the expected budget at those few discrete levels and picking the one that minimizes the budget. On the other hand, if a researcher cannot vary the level of incentives at all, the Budget Minimization problem is not applicable. What makes the Budget Minimization problem possible is the trade-off that incentives create between the sample-size effect and the payoff effect. Changing statistical parameters, for example, the power, only affects the sample-size effect but not the payoff effect, hence there will be no optimal level of power.
6.3. Strategic settings
Even though the examples I considered are from individual-choice settings, the logic of the Budget Minimization problem carries over to strategic settings. The natural counterpart to the theoretical outcome function µT, such as (6), in game theory is the Quantal Response Function (McKelvey and Palfrey, Reference McKelvey and Palfrey1995; Goeree et al., Reference Goeree, Holt and Palfrey2005). By combining, for instance, the framework developed by Woods Reference Woods(2020) for the quantal response model with the present approach, one can pose and solve the Budget Minimization problem in game-theoretic experiments.
6.4. Parameter uncertainty
The solution to the Budget Minimization problem relies on the estimates of the structural parameters of a model. These estimates will have standard errors. The analysis conducted in motivating examples ignores this parameter uncertainty for simplicity. However, the budget-minimizing treatment strength is a function of parameters and hence inherits the uncertainty in their estimates. The optimal treatment strength is unlikely to have a closed-form solution in most cases, hence, using the Delta method would be impossible. A practical solution to deriving the standard errors of the treatment strength would be to use the bootstrap.
6.5. Parameter estimates
A related point about parameter estimates is that they have to exist in order to take advantage of the Budget Minimization problem.Footnote 21 In the best-case scenario, these estimates could be readily available from the literature. This is likely to be the case for the models of risk and time preferences (Harrison and Rutström, Reference Harrison, Rutström, Cox and Harrison2008b), lying aversion (Abeler et al., Reference Abeler, Nosenzo and Raymond2019), social preferences (Goeree et al., Reference Goeree, Holt and Laury2002; Cox et al., Reference Cox, Friedman and Gjerstad2007; Bellemare et al., Reference Bellemare, Kröger and Van Soest2008), and real-effort tasks (DellaVigna and Pope, Reference DellaVigna and Pope2018). But what should a researcher do when those estimates are not available or cannot be used?
One possibility is that a researcher can use an existing structural model but does not want to use existing parameter estimates. Using existing estimates might not be reliable if, for example, they are derived from a subject pool that is very different from a researcher’s subject pool. In other words, a researcher might worry about the portability of the existing estimates. A solution in this case is to run pilot sessions on the subject pool of interest and estimate the parameters of the model using the pilot data. Using pilots to conduct the power analysis is a standard practice in experimental economics, and the only modification to that practice would be the way the data are used. An alternative solution is to exploit an auxiliary variation in the control group that is not related to the treatment variation of interest. For example, experiments on risk and uncertainty preferences involve variation in prospects that allows one to estimate behavioral parameters. A researcher then can use these estimated parameters to optimize the design of the treatment of interest.
6.6. Structural model
A more fundamental issue is that an off-the-shelf structural model simply might not exist. In this case, researchers have two possibilities. They can come up with their own model and run pilot experiments, as suggested above, to get initial parameter estimates needed for calculations. Another option would be to use a reduced-form approach instead of a structural approach. The Budget Minimization problem, at its core, relies on knowing how the outcome variable changes with the treatment strength,  $\mu_{T}(\tau)$. Nothing in the logic of the problem requires that this relation comes from a structural model. If there are previous observations on τ and µT, a researcher can use a reduced-form, predictive approach to recover $\mu_{T}(\tau)$ and then use it in the Budget Minimization problem.
6.7. Expected outcomes
The analysis of the Budget Minimization problem has so far focused on the case when the treatment strength affects only expected outcomes. The researcher, however, can also use information on how the treatment strength affects other moments of the distribution of outcomes, or even the whole distribution itself.Footnote 22 Using this additional information will make the analysis more efficient. For example, the formula for computing the sample size in a two-sided t-test for the difference in means (5) relies on knowing the standard deviation σ. If the researcher knows how the standard deviation changes with the treatment strength,  $\sigma(\tau)$, she can use this information to derive better predictions about how the treatment strength affects the sample size.
A common finding is that higher incentives reduce the standard deviation of outcomes, that is,  $\sigma(\tau)$ is likely to be a decreasing function (Camerer and Hogarth, Reference Camerer and Hogarth1999). The sample-size effect will become stronger relative to the case when σ does not change with τ. The standardized effect size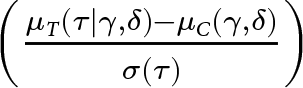 $\left(\frac{\mu_T(\tau \mid \gamma, \delta) - \mu_C(\gamma, \delta)}{\sigma(\tau)}\right)$ will increase faster in τ, which will cause the required sample size to decrease faster. In other words, the same increase in τ will now result in a bigger reduction in the required sample size. The sample-size effect will be present even if the treatment strength affects only the standard deviation and has no effect on the difference expected outcomes, as long as this difference is non-zero: the standardized effect size will still increase in τ.
As an illustration, let us revisit the continuous example from Section 4.1 but now assume that σ in the formula (5) is linearly decreasing in τ:  $\sigma(\tau) = 653.578104 - 500\tau$. Conducting an experiment with the re-optimized parameters would now require a total of 37 subjects (a decrease from 42 in case of constant σ) with an expected per-subject payoff across both groups of $ 1.36 (a slight increase from $ 1.28) and an expected total budget of $ 51 (a slight decrease from $ 53). The budget-minimizing treatment strength would be $ \tau^* = 3.4$ cents, which is slightly higher than 2.7 in case of constant σ.
6.8. Constraints
I have presented and analyzed the Budget Minimization problem as an unconstrained problem. In reality, a researcher might face constraints on subjects’ payoffs and/or a sample size. Suppose the sample size at  $\tau^{*}$ is too low to be acceptable (the constraint binds), as we saw in the continuous case example. A researcher can simply tweak the statistical parameters: decreasing α or β increases the optimal sample size without changing the optimal treatment strength. Suppose now that the expected per-subject payoffs are too low at $ \tau^{*} $. In this case the optimal treatment strength will have to change. There are several possibilities to satisfy the constraint in that case. One possibility is to change the level of the treatment variable in the control group, re-optimize, and check if the constraint is satisfied. The benefit of this approach is that one can both satisfy the constraint and get an optimal level of τ. Another possibility is to keep increasing τ until the constraint is satisfied. This approach will distort τ away from the budget-minimizing level. However, it can be more cost-effective than increasing τC. One might also consider changing the participation payment w, which will change $ \tau^{*} $. The participation payment, however, is typically set by lab policies and rarely tweaked for the purposes of a particular experiment.Footnote 23 On the other end of the spectrum is the case when the expected per-subject payoffs are too high. No simple solution exists in this case, since $ \tau^{*} $ already minimizes the budget and any deviation will only increase it. A researcher would likely have to reconsider other parameters of the design to bring down the budget.
6.9. Non-parametric tests
In practice, researchers often use non-parametric tests, such as the Wilcoxon-Mann-Whitney test, to analyze treatment effects. The reason for relying on parametric tests in my analysis is that they have simple analytical formulas for power calculations and require only minimal predictions about outcomes, such as averages. Power analysis for non-parametric tests, on the other hand, is based either on simulations in which case deriving theoretical results is impossible, or on explicit formulas that require rich predictions about outcomes, such as the entire distribution of outcomes (Rahardja et al., Reference Rahardja, Zhao and Qu2009; Happ et al., Reference Happ, Bathke and Brunner2019). One can still pose a practical question about the optimal level of incentives for a non-parametric test, or other more complicated designs, in a given experiment and combine simulations (Bellemare et al., Reference Bellemare, Bissonnette and Kröger2016) with the present framework to solve the Budget Minimization problem.
7. Conclusion
I study an optimal design of incentives in experiments where incentives are a treatment variable. Using a utility-based framework, I formulate a Budget Minimization problem. In the problem, a researcher chooses a treatment strength that minimizes the expected budget while allowing for the detection of an effect at the given levels of statistical significance and power. The effect of the treatment strength on the budget can be decomposed into two channels: the sample-size effect and the payoff effect. Increasing the treatment strength decreases the required budget via the sample-size effect but increases it via the payoff effect. At a minimum point, the two effects must be in the exact balance. I show theoretically that such a point exists under fairly mild conditions, and thus the Budget Minimization problem is guaranteed to have a non-trivial solution. I illustrate how the Budget Minimization problem applies in practice using existing experiments. The Budget Minimization problem also applies, under certain conditions, to designs where a treatment variable is not monetary incentives.
The main challenge in taking advantage of my approach is having a model of how the outcomes respond to incentives and reliable prior estimates of the model, in other words, good prior data, albeit this is true in general for any optimal design. The main contribution of my analysis is that it takes the guesswork out of the design of the level of incentives and replaces it with a disciplined economic approach. I believe that my approach to the design of incentives will enrich experimental economists’ toolkit and help guide future designs. Young researchers on tight budgets and researchers running expensive field interventions will particularly benefit from using the Budget Minimization problem.
Supplementary material
The supplementary material for this article can be found at https://10.1017/esa.2025.10019.
Acknowledgements
I thank the Editor (Lionel Page) and anonymous reviewers whose detailed suggestions helped significantly improve the quality of the paper. I thank James Bland, Jim Cox, Glenn Harrison, P. J. Healy, Marco Lambrecht, Lily Li, Nate Neligh, and David Rojo-Arjona for valuable suggestions on the early drafts. I thank the seminar participants at the Helsinki Graduate School of Economics, LMU Munich, University of Regensburg and the conference participants at the 2023 ESA World Meeting and 2021 ESA Global Online Around-the-Clock Conference for helpful comments. The replication code is available at https://github.com/aalexee/power_incentives. All remaining errors are my own.
Competing interests
I declare that I have no interests, financial or non-financial, that relate, directly or indirectly, to the research described in this paper.



 Open access

