

The transition from defined benefit to defined contribution (DC) plans has placed significant financial responsibilities on retirement savers. Out of concern that many retirement investors do not have the time or financial literacy required to make sound investment decisions, the past few decades have seen both the development of innovative financial products and the widespread adoptions of default options designed to improve the behavior of investors by replacing potentially erroneous retirement saving and portfolio choices with those based on robustly optimal rules derived from quantitative finance theory.
However, when retirement savers are defaulted into these financial products and stay due to inertia, the rules behind these products change not only the outcomes of many investors individually, but also the behavior of a large amount of capital in the economy and so potentially national saving rates, interest rates, and asset returns. For example, a retirement plan feature that increases the saving of retirees can lower interest rates and lead to more capital accumulation and economic growth. But in practice, the impact of these defaults and products on retirement saving rates, and thus interest rates, has been minimal. In contrast, the impact on the stock and bond allocations of typical retirees appears to have been dramatic (Parker et al., Reference Parker, Schoar, Cole and Simester2022).
This paper focuses on one of the most important products automating such portfolio choices for retirement investors, target date funds (TDFs), also known as life-cycle funds. TDFs are funds-of-funds that invest primarily in equity and fixed-income mutual funds to maintain specific proportions of their assets in different asset classes, such as stocks and bonds, based on the investor's expected retirement date. Most importantly for our purposes, in maintaining these specific proportions, TDFs trade against excess returns in each asset class, selling stocks and buying bonds when the stock market outperforms the bond market, and vice versa.
We show that this contrarian trading by TDFs (and TDF-like entities) stabilized the funding of equity funds and even stabilized the prices of the underlying stocks that TDFs held (indirectly) during the COVID-19 period of unprecedented economic volatility. Though this was not the primary intent of the product design of TDFs, which was simply to improve the individual-level portfolio choices of inattentive or unsophisticated retail investors, the contrarian behavior of TDFs has started to generate market-wide impacts. These mechanisms were proposed in Parker et al. (Reference Parker, Schoar and Sun2023) (PSS), which shows that from 2008 to 2018, TDF trading has been macro-contrarian: after high stock market returns, TDFs sell stocks to return to their prescribed asset allocations within a short period of time, and that as a result TDFs stabilized markets during a period of rapid growth in TDFs.
TDFs have a significant effect on fund flows and individual stock prices in the pandemic because they now manage a lot of money. The capital invested in TDFs and other balanced funds (BFs) rose from under $8 billion in 2000 to almost $6 trillion in 2021, then fell to $4.7 trillion in 2022 due to negative returns in that year, as shown in Figure 1(a).Footnote 1 The share of 401(k) plan mutual fund assets invested in TDFs increased from 3 percent in 2005 to about one-quarter in 2022 (also Figure 1(a), right axis). Figure 1(b) shows that the largest growth in TDF assets is driven by TDFs with fewer than 20 years to retirement date, funds which mostly hold more than 40 percent of their assets in each of stocks and bonds. According to Vanguard (Reference Vanguard2022), 95 percent of plans offered TDFs in their investment options at end of 2021, up from 84 percent in 2012. Further, 81 percent of all participants used TDFs and 69 percent of participants that owned a TDF had their entire account invested in a single TDF.
Rise of assets in TDFs and TDF-like funds.
Note: Panel (a) plots the sum of total net assets of TDFs, target date collective investment trusts (CITs), and BFs during 2000Q1–2022Q4 (left axis) and TDF assets as a fraction of total 401(k) assets in mutual funds (right axis). Assumed 67% of TDF investment is through 401(k) plans, following the ICI Factbook, 2022, Figure 8.20. Panel (b) plots the sum of total net assets (TNA) of TDFs broken down by years to retirement (grouped by 10 years).
Source: Assets in TDFs and BFs are estimated using CRSP. Assets in CITs are collected from annual Morningstar TDF research reports. Total assets for 401(k) plans from ICI Quarterly Retirement Market data.

The growth of TDFs was facilitated by the Pension Protection Act (PPA) of 2006, which qualifies both TDFs and BFs as default options in defined-contribution retirement saving plans (see Parker et al., Reference Parker, Schoar, Cole and Simester2022). But similar strategies that automatically stabilize the share of an investor's portfolio in different asset classes have recently been incorporated into a broader set of investment products, such as some automated advisory programs (e.g., model portfolios).
To summarize, retail investors move their money across funds in ways that appear to be stabilizing during the COVID-19 pandemic, in contrast to the trend-chasing behavior that we observe during previous periods. Our first main finding is that this change in flow patterns is significantly but far from solely due to the rebalancing by TDFs and TDF-like funds that trade mutual funds against market movements. Our second main finding is that stocks with higher TDF ownership (through the mutual funds held by TDFs) have lower returns after higher market performance, consistent with TDFs selling equity funds which then pass on the flow pressure to the prices of underlying stocks. Further, stocks with higher TDF holdings before the pandemic period show lower overall volatility during the subsequent market fluctuations during the pandemic, which suggests that TDFs and similar rebalancing investment vehicles that overlap with TDFs' holdings dampened stock price volatility during the pandemic.
Our first main result is partly summarized by the aggregate flow to performance relationships for US equity funds shown in Figure 2. Panel A shows the financial crisis period and its aftermath, during 2008–11. Flows to US domestic equity funds track the equity market returns closely during this period. The correlation between flows and returns is 0.78, implying possible de-stabilizing effects. Panel B focuses on the COVID-19 pandemic period and shows different flow patterns. Strikingly, flows appear to be much less trend chasing during this period. We observe only mild outflows during the market decline of February–March 2020 and a lack of inflows during the rally in 2021. Moreover, we observe inflows to equity funds during the bear market of 2022. Of course, part of the reason for the new shape of flow sensitivity could be some trend-chasing flows have left mutual funds, for example, retail investors have started engaging more in direct stock trading during this period. However, retail investor behavior cannot explain the fund inflow during 2022, which is more likely to be caused by funds of funds like TDFs which buy equity funds after market declines depress their equity share to below the desired level.
Equity returns and fund flows during financial crisis and pandemic periods.
Note: This figure shows aggregate flows to US domestic equity funds during 2008.1–2011.12 (panel A) and 2019.1–2022.12 (panel B) (left axis) and the US total equity market returns (right axis). Aggregate dollar flows are smoothed using 3-month moving averages and normalized by total assets with a 3-month lag. Returns are shown as 3-month moving averages.
Source: CRSP.

Our second main finding is reported in Figure 3 which shows that stocks that have (indirect) ownership by TDFs have lower volatility during the pandemic and are less likely to have extreme returns. We sort stocks into quintiles based on the fractions of their shares outstanding that are held (indirectly) by TDFs before the pandemic (averaged over the four quarters of 2018), and plot their subsequent volatility during the pandemic period, 2019–22. Panel A plots the volatility of the monthly returns during the 48-month period. Stocks with the lowest TDF holding at the beginning of the period on average had a standard deviation of monthly returns of 14 percent, as opposed to a volatility of 11 percent for stocks with high-TDF holdings (quintiles 5 and 4). Panel B plots the likelihood of extreme returns (monthly returns with magnitudes larger than ±10%) out of all monthly observations. Stocks in the lowest-TDF quintile had these large swings in returns in 39 percent of the stock-month observations, while the fraction is at 32 percent for stocks with the highest TDF holdings. Of course, these are simply correlations and not adjusted for stock characteristics. In Section 4, we show that these relationships between TDF ownership and both volatility and extreme returns also hold in regression analysis that controls for a large set of other determinants of returns.
Correlation between TDF investment and stock-level volatility.
Note: This figure plots the average raw monthly return volatility and the likelihood of extreme returns of stocks during 2019–22 by levels of TDF investment in 2018. Stocks are sorted into quintiles according to their average indirect TDF ownership during 2018. Raw return volatility is the standard deviation of the monthly stock returns during 2019.1–2022.12. To reduce the influence of outliers, we winsorize stock returns at 1% and 99% before calculating the standard deviation. Likelihood of extreme returns is the fraction of months during 2019.1–2022.12 where a stock's monthly return is larger than 10% or smaller than −10%. We require stocks to have observable monthly returns for at least 24 months during the 4-year window. Regression evidence with stock-level controls is shown in Table 7.

Historically, a majority of retirement investors have been either passive – letting their portfolio shares rise and fall with the returns on different asset classes – or active but re-allocating into asset classes or funds with better past performance, a behavior known as positive feedback trading or momentum trading that can amplify price fluctuations. Complementing evidence in PSS, this paper points out that due to the adoption of TDFs and TDF-like funds as default options in DC plans and their mechanical trading rules, retirement savers have been moved from being passive or trend-chasing to contrarian traders who reduce market fluctuations even in times of extreme market stress and volatility.Footnote 2
The expected magnitude of rebalancing by TDFs and TDF-like funds is the greatest with a target equity share of 50 percent; in contrast, funds with 0 or 100 percent equity share do not experience allocation distortions under differential asset class returns and do not need to rebalance (an important result we review in Section 1). Therefore, the effects of rebalancing that we document both in PSS and in this paper are expected to grow, not only with continued growth of assets in TDF-like funds, but also as the younger workforce that are defaulted into TDFs get older and their portfolios are gradually shifted toward a more equal balanced between stocks and bonds by the glide paths of the TDFs.
Related literature: The most important precursor to our paper is PSS, and we refer the reader to that paper for a broader discussion of the literature that it builds on. We note here that there is a substantial amount of evidence that the rise of TDFs followed from financial innovation and regulatory changes and altered investor portfolio behavior. In particular, Mitchell and Utkus (Reference Mitchell and Utkus2021), using data from one large 401(k) provider, show that plan-level features, such as auto-enrollment, are key drivers of TDF adoption, and make a sizable impact on the portfolios of the adopters (see also Chalmers and Reuter, Reference Chalmers and Reuter2020; Parker et al., Reference Parker, Schoar, Cole and Simester2022; Zhang, Reference Zhang2022). And there is substantial work on the differences across TDFs and its causes and impact on investors (Balduzzi and Reuter, Reference Balduzzi and Reuter2019; Brown and Davies, Reference Brown and Davies2020; Massa et al., Reference Massa, Moussawi and Simonov2020; Shoven and Walton, Reference Shoven and Walton2020). A few recent papers also propose improvements to the glide path design of TDFs to consider realistic household characteristics and heterogeneity (Duarte et al., Reference Duarte, Fonseca, Goodman and Parker2021), as well as the time variation in the expected equity premium (Gomes et al., Reference Gomes, Michaelides and Zhang2022).
Our study also complements the literature on flows to mutual funds through DC plans. For example, Sialm et al. (Reference Sialm, Starks and Zhang2015a) and Sialm et al. (Reference Sialm, Starks and Zhang2015b) show that menu adjustments by plan sponsors generate flows among equity and fixed income mutual funds that are more sensitive both to idiosyncratic performance and to macroeconomic shocks than flows outside of DC plans. In contrast, our paper studies the indirect flows to and from mutual funds through the trading by mixed-asset-class funds in DC plans like TDFs and BFs. These flows are counter-cyclical, thus offsetting the trend-chasing in the rest of the DC plans (i.e., direct listings of equity and bond funds). We do not have data on the menus or default options of DC plans, so we cannot speak to whether menu adjustments with respect to TDFs contribute to or reduce their main contrarian effect. However, our findings suggest that any discretionary decisions by plan sponsors, investors, or TDFs themselves do not cancel out the main rebalancing effect of the TDFs.
1. Summary of evidence on TDF rebalancing
This section summarizes the evidence that TDFs rebalance within a few months after differential asset class returns to restore the desired asset-class allocations. We describe the evidence from PSS that documents how the actual rebalancing trades of TDFs across asset classes match what one would expect given asset-class returns and the stated fund strategies.
First, how should we expect TDFs to rebalance? Consider a TDF with $1 of assets, a target weight of S* invested in equity funds and a target weight of 1 − S* invested in bond funds. Further assume that the TDF is at its target allocation at the beginning of the period and that the target shares do not change (no move along the glide path) during the period. As shown in the second panel of Table 1, following equity and bond asset returns of R E and R B, the TDF needs to sell the equity fund in the amount of −S*(1 − S*)(R E − R B), and buy the same amount of the bond fund (row 2). These same quadratic patterns hold when there are fund inflows or outflows, or when there are more than two asset classes.Footnote 3
TDF rebalancing in response to asset class returns

Note: This table shows the formula for rebalancing that restores the target asset allocation of a TDF after realized asset class returns R E (equity) and R B (bond). The target equity share is S* and the target bond share is 1 − S*. The TDF is assumed to hold the target allocation at the beginning of the period and to reinvest all dividends paid out by the underlying mutual funds. Dividends declared by the TDF are assumed to be reinvested by investors. TDF asset value at the beginning of the period before the asset class returns is normalized to $1. The formula in this table assumes zero net flow to the TDF. V denotes the value of the portfolio before trades and flows, or 1 + R B + S*(R E − R B).
Source: Parker et al. (Reference Parker, Schoar and Sun2023).
The rebalancing formulae – the last row of Table 1 – show that the better an asset class performs, the more the TDF must sell of that asset class and buy of the other asset class to rebalance. That is, TDF strategies are contrarian at the level of asset classes.
Importantly for testing, these formulae predict how different TDFs should rebalance: the amount of equity or bonds that a given TDF must sell in response to a positive excess return on that asset class is a quadratic function of its desired equity share, with a maximum for a TDF with a 50 percent desired equity share. This result is intuitive: for the same amount of differential asset class moves (R E − R B), a TDF with 100 or 0 percent equity share has no need to rebalance, and a TDF with 50 percent equity share faces the largest distortion to its asset allocation.
Second, do TDFs actually rebalance as predicted? While TDFs have some discretion over rebalancing across asset classes, the answer is that TDF rebalancing is contrarian and quadratic as predicted. Further, one can measure the timing of the rebalancing. PSS shows that TDFs rebalance within a couple of months with passive funds rebalancing rapidly and more active funds rebalancing more slowly.Footnote 4
PSS develops a relatively standard method to measure rebalancing trades by TDFs, but we describe it precisely here because we use the same measures later in our paper. Given holdings data of the underlying mutual funds by TDF k in quarter q, define the dollar amount of the ‘total trade’ for each share class (c) as the change in the value of holdings in excess of the value predicted by the quarterly share class return, that is, TotalTrade ckq = MV ckq − MV ck,q−1(1 + r cq). The observations from each holding to the TDF-by-asset-class level are aggregated to obtain $TotalTrade_{kq}^y$ where y stands for either the equity (E) or the fixed income (B) asset class. Given these amounts, the ‘flow-driven trade’ by a TDF of an asset class is measured as the dollar flow to the TDF allocated pro rata to lagged portfolio weight of the asset class. Finally, the ‘rebalancing trade’ is the difference: $Rebalancing_{kq}^y = TotalTrade_{kq}^y -FlowDrivenTrade_{kq}^y$
 . To match the formulae in Table 1, where the total assets of the TDF are assumed to be $1, the dollar rebalancing trades are normalized by the lagged total assets of the TDF.Footnote 5 The return on equity, R E, is the average return on domestic equity and foreign equity weighted using lagged TDF portfolio weights, thus is TDF-specific.
Before quantifying the relationship between predicted and actual rebalancing at the TDF level, Figure 4, reproduced from PSS, shows in broad terms that the rebalancing trades are contrarian at the asset-class level and that they match the quadratic pattern of the simple formula quite well. For each range of stated equity share, the median rebalancing across periods and TDFs with that stated equity share in response to a 10 percent excess return on equity in a quarter fits the quadratic function well for equity and slightly less well for bonds (panels (a) and (b) of Figure 4). For example, when R E − R B = 10%, a TDF with 0.65 equity share is expected to sell 2.3 percent of its portfolio value in stocks, which is also what the median fund sells. Rebalancing with respect to bonds also has a quadratic shape, but the magnitude is lower than predicted. Panels (c)–(f) show the results for passive and active TDFs separately. The smaller magnitude in bond rebalancing is due to active TDFs.
Median rebalancing by equity share.
Note: The connected lines plot the median ratio of rebalancing by TDFs in each stated equity-share group: greater than 90%, greater than 80% up to 90%, … but the bin centered at 0.25 includes all TDFs whose equity share is at or below 30%. The outcome variable is the amount of rebalancing trade (in equity or bonds) scaled to show the amount of rebalancing for each 10% movement in R E − R B. The dotted line represents the theoretical predicted magnitude of the ratio at the midpoint of each interval. (a) and (b) use the full sample, (c) and (d) use the sample of passive TDFs whose holdings in index mutual funds are at least 50% of their portfolio values, and (e) and (f) use the sample of active TDFs whose holdings in index funds are less than 50% of their portfolio values.
Source: Parker, Schoar, and Sun (Reference Parker, Schoar and Sun2023).

It is worth noting that TDFs designed for young and old investors engage in different degrees of this counter-cyclical rebalancing. Most TDFs start with a large desired share of equity – on the order of 90 percent – until roughly 25 years before retirement. The desired equity share declines smoothly over time to reach roughly 40 percent 10 years after the target date. Therefore, an aging population (such as for the United States) can generate stronger counter-cyclical rebalancing demand, according to life cycle models, than a young population does.
To be more precise (and not limit analysis to the median TDF in each group), Table 2 presents a subset of the results on rebalancing contained in PSS and highlights three key findings in PSS about TDF rebalancing. First, during a quarter, TDFs rebalance roughly 80% of the amount predicted by the rebalancing formulae. Columns 1–2 show that TDFs rebalance 44, 70, and 83 percent of the predicted amount of equity in the same month as the return differential (row 1), by 1 month after the return (row 2), and by 2 months after (row 3) respectively. These coefficients trace out the monthly speed of rebalancing for the average TDF in equity funds. Control variables (added in column 2) make little difference to the estimated coefficients.
TDF rebalancing as a fraction of predicted rebalancing, 2008–18

This table presents a subset of results in estimating the relationship between actual rebalancing by TDFs in quarter q and the predicted values of rebalancing given the TDFs' equity shares and realized differential asset-class returns during the third, second, and first months of quarter q and during q − 1 in the period 2008Q3–2018Q4. Observations are at the TDF quarterly level. Rebal(E)q/TNA q−1 (Rebal(FI)q/TNA q−1) in columns 1–4 (5–8) is TDF-level rebalancing trade in quarter q with respect with equity (bond), divided by $TDF{\mkern 1mu} {\kern 1pt} TNA$ in quarter q − 1 and winsorized at 1% and 99%. Pred.rebal q,m=t stands for predicted rebalancing in response to the realized return of the tth month of quarter q < ddollar > Pred.rebal q−1 stands for the value of predicted rebalancing in response to the realized return of quarter q − 1. R E is approximated by the weighted average between total US and foreign equity market return. Control variables include lagged quarter's log $TDF{\mkern 1mu} {\kern 1pt} TNA$
 , log $Series{\mkern 1mu} {\kern 1pt} size$
 , $Cash{\mkern 1mu} {\kern 1pt} share$
 , and current quarter's $TDF{\mkern 1mu} {\kern 1pt} flow{\mkern 1mu} {\kern 1pt} rate$
 , $TDF{\mkern 1mu} {\kern 1pt} quarterly{\mkern 1mu} {\kern 1pt} return$
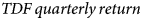 , and $Years{\mkern 1mu} {\kern 1pt} to{\mkern 1mu} {\kern 1pt} retirement$
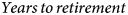 . Standard errors are clustered two ways by TDF and quarter.
*p < 0.1; **p < 0.05; ***p < 0.01.
Source: Table 3 of Parker et al. (Reference Parker, Schoar and Sun2023).
Second, passive TDFs rebalance more rapidly and more completely than active TDFs do. Splitting the sample of TDFs according to whether the majority of assets are invested in index funds or actively managed funds, column 3 shows that 50 percent of the predicted rebalancing is implemented within the same month for passive TDFs, and 85 percent by the end of the quarter. In contrast, column 4 shows that only about 40 percent is implemented by active TDFs within the same month, an amount which is not statistically significant. Similarly, passive TDFs completely return to desired shares within the same quarter, while active TDFs still have 27 percent of the way to go at the end of the quarter. As expected, portfolios of passive TDFs track their desired asset allocations more closely than active TDFs.
Third, smaller and less statistically significant coefficients in columns 5–8 suggest that TDF rebalancing in fixed income is weaker and slower. However, this finding may not reflect true economic exposure over time because TDFs' use cash and derivatives to rebalance fixed income exposures.Footnote 6
We now turn to describing that data that we use in our analysis of the role of TDFs in stabilizing the equity market during the pandemic.
2. Data on TDFs, funds, stocks, and returns
To maintain consistency, our use of data largely follows PSS.
TDFs: We obtain quarterly fund characteristics and holdings of TDFs from the CRSP Mutual Fund Database. TDFs are identified from fund names containing target retirement years at 5-year intervals ranging from 2000 to 2070, then manually cleaned using the TDF series names listed in the Morningstar annual TDF research reports. Most holdings of TDFs are other mutual funds which we link to the CRSP Mutual Fund Database using the CUSIP codes of the share classes. We use this matching to categorize each holding as domestic equity, foreign equity, or fixed income.
Equity mutual funds: Using CRSP, we construct a dataset on the underlying mutual funds that focuses on domestic equity mutual funds (CRSP objective codes starting in “ED”, i.e., Equity-Domestic). We use funds sold both to retail and institutional investors, and aggregate different share classes to the fund level. For each mutual fund, the percent ownership by TDFs is the total of TDF holdings (across all share classes) by the total assets of the fund.
Individual stocks: Our panel dataset of monthly stock return, price, volume, and market capitalization is built from CRSP and financial data from Compustat. We include all stocks traded on the New York Stock Exchange, NASDAQ, and American Stock Exchange. We use Thomson Reuters and MFLINKS to measure stockholding by TDFs through mutual funds. For concerns over lack of liquidity, we drop stocks with market capitalizations that place them in the bottom 5 percent of NYSE stocks or with beginning-of-month prices below $5 (penny stocks), following Jegadeesh and Titman (Reference Jegadeesh and Titman2001).
In Table 3, we present the summary statistics on TDFs, equity mutual funds, and stocks in our sample period 2019–22. Compared with the earlier period of 2008–18 studied in PSS, TDFs have higher but more volatile returns during the more recent period and have a reduced cash share. There are more passive TDFs in the new sample and the underlying mutual funds are more likely to be passive. We also observe that TDF ownership at the fund level and its indirect ownership at the stock level are both higher than in the earlier sample period. At the fund level, the average TDF ownership increased from 10 to 13 percent. At the stock level, TDF indirect ownership is doubled, from 0.64 to 1.28 percent.
Summary statistics of TDFs, equity mutual funds, and stocks, 2019–22

Note: For TDFs, $Target{\mkern 1mu} {\kern 1pt} year$ is the target retirement year stated in the fund name. $Years{\mkern 1mu} {\kern 1pt} to{\mkern 1mu} {\kern 1pt} retirement$
 is $Target{\mkern 1mu} {\kern 1pt} year$
 minus current year. $Series{\mkern 1mu} {\kern 1pt} size$
 is total size across TDFs in a series (a collection of TDFs with the same manager(s) but different target retirement years). $Passive{\mkern 1mu} {\kern 1pt} TDFs$
 are those with more than 50% of their assets invested in index funds. For mutual funds, Fund flow rate is the quarterly growth rate in assets in excess of that implied by net fund return. Fraction held by TDFs is the total value of TDF holdings of a fund divided by Fund size. Fund family size is the total size of funds managed by a management company. Fund age is the years since inception of the oldest share class of a fund. Expense ratio is the weighted-average net expense ratio across share classes. Return volatility is the 1-year standard deviation in the monthly returns. For stocks, Monthly return is the monthly total return of a stock. 4-Factor market beta is the monthly return adjusted for market, SMB, HML, and momentum factor returns using betas estimated with the pre-window (1996–2005, requiring 24 monthly return observations). TDF ownership refers to the fraction of a stock owned indirectly by TDFs through mutual funds. Mutual fund ownership is the fraction of a stock owned by equity mutual funds that have no investment from TDFs. Market capitalization is total shares outstanding times the share price. Monthly volume/Shares out. is monthly trading volume normalized by the number of shares outstanding.
Source: CRSP.
Market excess returns: We study monthly returns during from January 2019 to December 2022 inclusive. We measure equity returns as the total return of the US equity from CRSP, and bond returns as the pre-fee return on the Vanguard Total Bond Market Index Fund. Figure 5 plots of the cumulative returns of the US equity market and the differential returns between equity and bonds during this pandemic period.
Cumulative return of the stock market in excess of the bond market, 2019–22.
Note: The cumulative excess return of the value-weighted monthly total US equity market (R E, solid line) less the Vanguard Total Bond Market Index Fund (R E − R B, dashed line) during 2019.1–2022.12. Both index levels are normalized to 1 at the start of 2019.
Source: CRSP.

Following a sharp drop of 20 percent in the equity market during February–March 2020, the market experienced a rapid recovery, followed by strong performance in 2021, and a correction period with high volatility in 2022. Equity and bond returns have a correlation of 0.34 during this period, thus both the run-up in 2021 and the correction in 2022 appear smaller for the differential asset class return R E − R B than for R E.
3. The stabilizing effects of TDF ownership on equity mutual funds during the pandemic
The extreme stock market volatility during the COVID-19 pandemic period of 2019–22 provides a useful window into the stabilizing effects of TDFs as well as a test of this effect during a crisis. The unprecedented volatility of the economy during the pandemic changed lots of economic relationships, and TDFs may have delayed rebalancing or even changed strategies. Similarly, retirement investors may have moved money out of TDFs in response to poor performance. Either of these changes would have made TDFs less market contrarian and reduced their stabilizing effects. This section builds on the evidence that we presented in Figure 2 and shows that, in fact, TDFs acted as stabilizer during the pandemic; they sold stock funds when the stock market did relatively well and bought them when it did poorly. For example, following the stock market crash of March 2020, we observe significant investment by TDFs into equity mutual funds during March and April of 2020, consistent with 70 percent of TDF rebalancing in equity being completed within the contemporaneous month and month following a differential asset class return (Table 2).
Quantifying and generalizing this example in steps, we first study fund flows to equity mutual funds with different levels of TDF ownership during the months in which the difference in return between equity and bonds exceeded 8 percent. The fund flow rate for mutual fund j in month m is measured as the growth rate (in percent) in assets in excess of the realized net fund return, or (TNA j,m − TNA j,m−1(1 + r j,m))/TNA j,m−1 where TNA j,m is total net assets and r j,m is net return. We sort equity funds into high-TDF and low-TDF groups using the average TDF investment in 2018.
Table 4 shows that during the months of the pandemic with extreme returns, domestic equity funds with higher TDF exposure experience higher flows when equity underperforms bonds, and vice versa.Footnote 7 Means tests between the two groups show that several differences are statistically significant based on data for that 1 month alone. For example, during March 2020 when equity underperformed bonds by 12.7 percent, equity funds that had low-TDF investments (measured in 2018) saw an outflow of 4.2 percent of assets, while those with high-TDF investment experienced 2.9 percent outflow. The difference is statistically significant with a p-value of 0.03. Similarly, most differences in the flows in the other months are aligned with the predicted signs and are often statistically significant. Thus, TDFs do appear to offer counter-cyclical flows to the underlying mutual funds during the pandemic period in months when the stock market crashed or boomed.
Flows to equity funds with high- and low-TDF ownership during months with extreme market returns

Note: Fund flow rates in percentages to equity mutual funds with high- and low-TDF holdings in months during 2019.1–2022.12 where differential return between equity and bond is larger than ±8%. Subsamples based on average TDF investments in funds in 2018 above and below median and do not include funds not held by TDFs. Differences in means between sub-samples and two-sided p-values are reported.
Source: CRSP.
Second, to quantify the average effects of TDFs on fund flows, we estimate the sensitivity of fund flows to both the current month and the lagged month's differential asset class performance in proportion to the fraction of the mutual fund that is held by TDFs (at the end of the previous quarter) using data from the entire pandemic period. We run the following regression:

In the equity fund sample, because retail investors typically invest more into equity funds when the stock market does well, we expect β 1 and β 3 to be positive for equity funds (Warther, Reference Warther1995; Edelen and Warner, Reference Edelen and Warner2001; Ben-Rephael et al., Reference Ben-Rephael, Kandel and Wohl2011). But, because TDF equity funds and buy bond funds when the stock market does well, we expect the main coefficients of interest, β 2 and β 4, to be negative. These coefficients measure the contemporaneous (β 2) and lagged (β 4) effect of greater TDF investment on fund flows following a positive return on the asset class of the fund. Equation (1) further allows the differential asset class returns to interact with an indicator for index funds to allow for potential different return-chasing dynamics in index funds and actively managed funds.
In the sample of bond funds, we expect the reverse response to excess returns on the stock market because TDFs rebalance into bonds when equity outperforms. That is β 2 and/or β 4 should be positive for bond funds.Footnote 8
We estimate equation (1) using only mutual funds with some TDF ownership at some point during the sample to avoid a large number of zeros in the regressions (with similar results using the entire sample). Further, since percent flow rates are noisy, especially for smaller funds, we drop observations below 1 percent or above 99 percent within the distribution for each asset class. Control variables X j,m include fund characteristics that have previously been found to affect fund flows, specifically fund size, fund family size, fund age, net expense ratio, and return volatility. To allow for the correlations in errors in cross sections and within the same fund over time, we cluster standard errors two-ways by time and fund.
Table 5 shows that TDF ownership stabilized inflows and outflows from mutual funds during the pandemic period. Table 5, columns 1 and 2 present the estimates from equation (1) without and with fund fixed effects for all domestic equity funds in our sample. First note that the inclusion of fund fixed effects has little impact on the estimated coefficients, suggesting that the flow sensitivity to cross-sectional differences in returns and TDF ownership is similar as that to time-series changes in returns and changes in TDF holdings. Second, the coefficients on (R E − R B)m, (R E − R B)m−1 and on their interactions with Index suggest that equity fund flows chase equity market performance and slightly more so in index funds.Footnote 9 For the typical non-index equity fund that has no holding by TDFs, a 10 percent decline in the stock market is associated with an outflow of 0.46 percent of assets under management $( \widehat{{\beta _1}})$ in the month of the return and an additional outflow of 0.22 percent of assets under management $( \widehat{{\beta _3}})$
 the following month, based on estimates in column 1.
Effect of TDF ownership on mutual fund flows, 2019–22

Note: The dependent variable $Fund{\mkern 1mu} {\kern 1pt} flow$ is the growth rate in fund assets in excess of the realized net fund return. R E − R B is the excess return of the US total stock market over the US total bond market. The sample in columns 1–4 (5–8) includes retail and institutional domestic equity funds (corporate bond funds) which are held by any TDF during the sample period. $Frac.by{\mkern 1mu} {\kern 1pt} TDFs$
 is measured as the fraction of fund assets held by TDFs, measured at the end of the previous quarter. Control variables include the lagged month's log $Fund{\mkern 1mu} {\kern 1pt} size$
 , log Fund family size, current month's log Fund age, Expense ratio, and lagged Return volatility. Standard errors are clustered two ways by time and fund.
*p < 0.1; **p < 0.05; ***p < 0.01.
Source: CRSP.
Our key result however is that this trend-chasing behavior is significantly reduced for funds with higher TDF ownership. The coefficients on the interaction terms with TDF ownership, $\widehat{{\beta _2}}$ implies that, in response to a decline in the stock market, the associated outflow is reduced by 24 percent in the month of the return (1.09 × 0.1/0.46) for each 10 percent of the mutual fund that is owned by TDFs, and by a total of 38 percent ((1.09 + 1.52) × 0.1/(0.46 + 0.22) = 0.261/0.68 = 0.38) on average over the month of and following the stock market decline. The estimates imply that the average TDF rebalances by a similar amount in the month of the return and the month after ($\widehat{{\beta _2}}$
 and $\widehat{{\beta _4}}$
 respectively), consistent with the timing of rebalancing by TDFs in the period prior to the pandemic (Section 1).
This contrarian trading behavior is stronger for index funds that are held by TDFs than it is for actively managed funds (as seen in columns 3 and 4). Rebalancing in index funds is also faster. Column 3 shows that rebalancing in index funds is stronger in the contemporaneous month as the return shock, while column 4 shows that rebalancing in actively managed funds is stronger in the following month. The greater and more rapid rebalancing in index funds almost surely reflects differences in TDFs rather than differences in rebalancing across funds within TDFs. The Vanguard TDFs for example hold index funds (and derivatives) and rebalance to desired equity exposure on a daily level, while Fidelity TDFs that tend to invest more in active funds and also have more discretion and allow equity share to vary over time to seek higher total returns and to save on trading costs.
For corporate bond mutual funds, Table 5 also shows that rebalancing by TDFs into bond funds when equity outperforms is passed on to the underlying fund level, and mainly in the following month (in columns 5–8, $\widehat{{\beta _4}}$ is consistently positive and significant).
In sum, we find that TDF ownership in mutual funds had a significant contrarian effect on equity fund flows during the pandemic. Thus, even in this time of extreme economic disruption, neither a reduction in rebalancing by TDFs nor active rebalancing out of TDFs by retirement investor undid the automatic TDF rebalancing that is documented in the pre-pandemic period by PSS. The typical automatic rebalancing by TDFs and inertial behavior by TDF investors respectively meant that TDFs continued to produce contrarian flows to equity funds. Did these funds stabilize the stock and bond markets during the pandemic? We turn next to evidence on the effect of TDFs on return differentials across stocks.
4. TDF ownership and stock returns during the pandemic
This section shows that, because TDFs buy stock funds when the overall stock market does poorly and sell stock funds when the stock market does well, they affect both the co-movement between stocks and market and the individual volatility of stocks.
4.1. TDFs lower stock return sensitivity to recent market performance
Because TDFs have a contrarian effect on fund flows which then put counter-cyclical pressure on stock prices, we expect stocks with higher indirect holdings by TDFs – through the mutual funds that TDFs invest in – to have lower sensitivity to systemic shocks that move the stock or bond markets. PSS shows evidence in line with this hypothesis during the decade before the pandemic, and hypothesized an increasingly important role for TDFs and TDF-like strategies. Here we use the pandemic market movements to test this hypothesis.
We estimate the impact of TDF trading on monthly ‘alphas’, which are monthly returns in excess of the returns one would expect based on their historical correlation with standard systemic risk factors and the realizations of these risk factors (described in more details below). We run the following regression using monthly data from 2019 to 2022, a period with both sizable TDF assets and high market volatility:

where i indexes the stocks, m represents a month, l refers to the three-digit Standard Industrial Classification (SIC) industry classification, and (R E − R B)m and (R E − R B)m−1 are the current and lagged months' excess return of equity over bonds. The coefficients λ 1 and λ 2 measure the effect of TDF ownership on stock returns by measuring differences in risk-adjusted returns among stocks that are held in different amounts (indirectly) by TDFs. These are the coefficients on the asset class returns interacted with lagged percentage of indirect TDF ownership at the stock level, calculated as TDF i,q−1 = Σjka ij,q−1b jk,q−1 for stock i in the lagged quarter q − 1, where a ij,q−1 is the fraction of stock i held by mutual fund j and b jk,q−1 is the fraction of mutual fund j held by TDF k. Our analysis also controls for the typical co-movement of stock returns within industries by including industry(3-digit SIC)-by-time fixed effects (θ ml). If TDFs stabilize stock returns, then λ 1 and λ 2 should be negative. The analysis clusters the standard errors two-ways by time (year–month) and stock.Footnote 10
In addition to controls directly included in equation (2), we control for typical differences in returns for different stock by using the risk-adjusted monthly return of the stocks as the dependent variable rather than the raw return. We follow a standard four-factor risk adjustment model, which includes Market-rf (the excess return of the total equity market over the risk-free rate), small-minus-big (SMB or the size factor), high-minus-low (HML or the value factor) (Fama and French, Reference Fama and French1993), and momentum (Carhart, Reference Carhart1997). An issue with this risk adjustment is that TDF trading can directly affect the sensitivity of a stock's return to the performance of the market, that is, TDFs lower the market beta of stocks, which is the main effect we want to measure. To alleviate this problem, we estimate the factor betas using the period 1996–2005 which is before the PPA of 2006, so that the betas are (largely) free of TDF impact. We require at least 24 observations for each beta estimate and winsorize the alphas at 1 percent and 99 percent to account for the fat tails due to extreme movements unrelated to TDF trading.
Table 6 shows that higher TDF ownership is associated with lower sensitivity to market momentum. That is, when the overall stock market does well, stocks that have a large indirect TDF ownership perform worse than they should have given their (pre-TDF-period) risk-factor exposure and the movement in these risk factors. This lower return is consistent with their underperformance because they are being disproportionately sold by TDFs when the overall stock market return is relatively high. In column 1, a specification without controls, the coefficient on (R E − R B)m × TDF iq−1 indicates that a 1 percent higher TDF ownership of a stock implies a 0.051 lower sensitivity of the four-factor alpha of that stock to the contemporaneous market return. We offer an interpretation of the magnitude below.
TDF ownership and stock return sensitivity to market performance

Note: This table examines the relationship between indirect TDF ownership and monthly stock return sensitivity to differential asset class performance during 2019–22. The dependent variable 4-factor alpha is the risk-adjusted return winsorized at 1% and 99%, where the factors include Market-rf, SMB, HML (Fama and French, Reference Fama and French1993), and momentum (Carhart, Reference Carhart1997). The beta loadings are estimated using monthly stock returns during 1996–2005 in columns 1–5, 2006–15 in column 6, and 2009–18 in column 7. Each estimation requires 24 monthly return observations. TDFq_ 1 (%) is the share of a stock indirectly owned by TDFs measured at the end of the previous quarter expressed in percentage points. Control variables include log of lagged values of Market capitalization, Monthly volume/Shares out., Market-to-book ratio, and lagged values of Dividend yield 12m, ROE, Investment, Illiquidity, and Mutual fund ownership. Standard errors in this table are clustered two ways by time and stock.
*p < 0.1; **p < 0.05; ***p < 0.01.
Source: CRSP.
We also find that TDF ownership significantly stabilizes the returns on a stock the month after the market return: the coefficient on (R E − R B)m−1 × TDF iq−1, which was not precisely estimated in PSS, is significant and just over half the size of the contemporaneous effect during the pandemic period. The fact that there is a large and measurable lagged effect – consistent with the delayed rebalancing documented in the previous section – may be due to the larger size of TDFs or the larger size of the market movements in this more recent period than in the period studied by PSS.
When adding stock characteristics in column 2 as controls, the estimated effect of TDF ownership becomes slightly stronger. In column 3, we further control for the stock return lagged by 1 month and the cumulative return from month m − 6 to m − 2 to account for both short-term reversal and medium-term momentum in the stock returns. We observe a strong negative coefficient on the 1-month lagged return, consistent with the well-known reversal effect. However, controlling for lagged returns does not change our estimates of the TDF effect in the contemporaneous month.
Controlling for interactions of market returns with stock-level characteristics does not alter the estimated TDF effect, implying that the TDF effect is distinct from the potential effects of other stock characteristics on return dynamics. Columns 4 and 5 show the main coefficients when we include the full set of stock characteristics interacted with both (R E − R B)m and (R E − R B)m−1. The set of characteristics include log of lagged market capitalization, trading volume, the market-to-book ratio, lagged trailing-twelve-month dividend yield, ROE, investment, illiquidity, and the holdings by mutual funds that are not held by TDFs. If our results were entirely driven by the different characteristics of TDF-held stocks, we would expect the main coefficients on the interaction terms between differential asset class returns and indirect TDF investment to disappear in this specification. In fact, the effects of TDFs remain significant.
One possible concern is the use of the period 1996–2005 to estimate the stock betas and so to infer risk-adjusted returns, our alphas in equation (2). For example, if betas varied dramatically over time, our measure would then be poor and possibly introduce bias. In addition, the mechanical requirement for a stock to be traded during the pre-window excludes a large fraction of observations which may be important for testing our hypothesis. Below we offer several pieces of evidence to alleviate these concerns.
First, the stock betas do not move much in a way that is correlated with (indirect) TDF ownership. Though stock betas have on average risen over time, the change is not dramatic relative to the standard deviation within each estimation window.Footnote 11 The table also shows that the lowest-TDF quintile is the most affected by the mechanical data restriction problem, thus the procedure mostly excludes ‘control’ stocks which are less affected by TDFs. Further, the newer firms that were not traded during the earlier window are tilted toward technology companies, so these companies which had abnormal performance during our period are actually under-represented in our sample and so are not driving our results.Footnote 12
Our results are also somewhat robust to some plausible alternative ways of calculating the betas used in risk adjusting stock returns. In columns 6 and 7 of Table 6, we report results using the alternative windows 2006–15 and 2009–18. As expected, the estimated same-month TDF effect $( \hat{\lambda }_1)$ becomes much smaller and statistically insignificant, because estimated betas in these more recent windows absorb some of the TDF effect.Footnote 13 However, the effect of the lagged R E − R B ($\hat{\lambda }_2$
 , not taken out by the estimated beta) is almost the same as in the other columns. This result reassures that the main effect of using the early pre-2006 window for beta is to prevent the TDF effect from being taken out by the risk adjustment, thus allowing the estimation of $\hat{\lambda }_1$
 .
.
4.2. How much did TDFs cushion the market decline during February–March 2020?
We now take the estimates above to do a back-of-the-envelope exercise to approximately quantify (i) how much the rebalancing policy by TDFs offset fund outflows at the onset of the pandemic (February and March 2020, when the equity market dropped relative to bonds by 9.7% and 12.7%, respectively), and (ii) how much TDFs may have cushioned these stock price declines.
First, from the coefficients in Table 5, column 2, during the 2-month period including and following a return, TDFs offset roughly 38% of fund flows in our sample of funds and about 19 percent of flows of all domestic equity funds. We calculate the first number based on our result that for any excess equity market return (R E − R B)m in month m, the aggregate domestic equity fund would experience a total net flow of (R E − R B)m × 0.089 during both m and m + 1 had there been zero-TDF investment. We obtain 0.089 by summing up the flow sensitivity to both the current month return (0.055) and the lagged month return (0.034). Then, using the coefficients on the interaction terms with fractions held by TDFs and the fact that the average fund in our sample has a 13 percent TDF ownership, TDFs affect fund flows by −(R E − R B)m × (0.107 + 0.154) × 13% = −(R E − R B)m × 0.034 in months m and m + 1. This result then leads to our conclusion that TDFs offset roughly 0.034/0.089 = 38% of fund outflows in a 2-month period.Footnote 14 Note that our regression sample includes only domestic equity funds that are held by TDFs during our sample. Those funds account for around 50 percent of all fund assets, so that, scaling down the fraction by half, TDFs offset about 19 percent of fund flows of all domestic equity funds.
Turning to the effect on asset prices, the coefficients in Table 6 suggest that for the average stock that is held 1.3 percent (indirectly) by TDFs (Table 3), TDFs can cushion return changes by (0.051 + 0.027) × 1.3(R E − R B)m, or 0.1014(R E − R B)m in months m and m + 1, for an excessive equity return (R E − R B)m in month m. Therefore, during the 21 percent drop in the first 2 months of the COVID crisis, TDFs should have pushed up the average stock price by 0.1014 × 21% = 2.13%, or about one-tenth of the aggregate decline.
This effect on asset prices may seem large, given that indirect TDF holdings account for a small fraction of the shares outstanding of the typical stock. However, as we discuss above, TDF trades can offset a greater fraction of the flow-induced trades by mutual funds, so the impact of TDFs may be big from a flow perspective.Footnote 15 In addition, our measure of indirect TDF holdings almost surely picks up TDF-like funds that rebalance in a similar contrarian manner. We discuss other rebalancing funds in Section 4.4.
Our calculation above also illustrates how the growth of TDFs can change the flow and price dynamics during crisis periods, which may contribute to some of the stark contrast in asset price movements between the 2020 COVID period and the 2008 financial crisis (although there are many other sources of differences too). Interestingly, the estimated coefficients of TDF effects, which are scaled by TDF holdings of mutual funds or stocks, have similar magnitudes in PSS and in the current paper, suggesting that each unit of TDF has a similar effect during the COVID crisis and the earlier periods. The main difference between the periods is then the assets in TDFs. That is, the growth in TDF and TDF-like funds leads them to account for a larger fraction of ownership of domestic equity funds and stocks and so have a bigger impact. We estimate that TDFs held at most 0.2 percent of the aggregate assets in domestic equity funds during the financial crisis in 2008,Footnote 16 compared with at least 5 percent before the pandemic. Therefore, the effects of TDFs both on fund flows and asset prices should have been minimal during 2008, consistent with Figure 2.
4.3. TDFs lower return volatility
We next examine whether TDF ownership of a stock is associated with lower volatility of the returns on that stock during the pandemic period. For this analysis, we collapse the stock panel to one cross section by calculating the standard deviation of monthly returns during the period and the likelihood of extreme returns (monthly returns higher than 10% or lower than −10%). We then examine whether these volatility measures are negatively related to TDF investments in the stocks. To avoid the regressors being affected by the dependent variables, we take the TDF indirect ownership from 2018 by averaging the four quarters. Table 7, panel A shows the summary statistics of the stock-level volatility measures. The average monthly return standard deviation during this 4-year period is about 13 percent, and in 37 percent of the monthly observations, a stock has an ‘extreme return’ where the absolute magnitude of the monthly return is larger than 10 percent, confirming the overall high volatility during this period.
TDF ownership and stock return volatility

Note: Panel A presents summary statistics of the cross section of stocks with volatility measures based on 2019–22. Panel B examines the relationship between TDF ownership and stock return volatility. SD monthly return (%) measures the standard deviation of monthly returns during the 4-year window expressed in percentages. Likelihood of extreme returns (%) is the fraction of months where the absolute value of the stock return is larger than 10%, expressed in percentages. Frac. by TDFs (%) is the percentage of a stock indirectly owned by TDFs measured as an average during 2018. Frac. by MFs (%) is the percentage of a stock owned by mutual funds with zero-TDF investment measured as an average during 2018. Control variables include logs of Market capitalization, Monthly volume/Shares out., Market-to-book ratio, and Dividend yield 12m, ROE, Investment, and Illiquidity, all measured as an average during 2019. Robust standard errors are reported.
*p < 0.1; **p < 0.05; ***p < 0.01.
Source: CRSP.
Figure 3 shows that stocks in higher quintiles of TDF indirect ownership in 2018 had lower stock return volatility during the pandemic period. Column 1 in panel B of Table 7 shows a continuous regression version of this result: stocks with greater ex ante TDF ownership have lower raw return volatility during the turbulent markets of 2019–22. Column 4 also shows that they have a lower likelihood of extreme returns. But this pattern could be due to the different characteristics of stocks that TDFs choose to own. To address this possibility, we run a cross-sectional regression with a full set of controls for stock characteristics that have been found to be associated with differential returns.
Focusing first on the role of TDFs that are unrelated to general mutual fund ownership (columns 2 and 5), we still find that stocks with greater ex ante TDF ownership have both lower raw return volatility and lower likelihood of extreme returns, but both relationships are slightly smaller. Second, in columns 3 and 6, we control for log of market capitalization, trading volume, the market-to-book ratio, and trailing-twelve-month dividend yield, ROE, investment, and illiquidity, all measured with 2018 values. The coefficient on TDF ownership drops in half again, but, even with this full set of controls, remains highly statistically significant.
To conclude, even based on the smallest estimates in columns 3 and 6, those with all controls, a 1 percent higher TDF ownership share is associated with 0.4 percent lower standard deviation of return volatility and 1.6 percent lower likelihood of realizing extreme returns.
4.4. Mis-measurement due to other TDF-like investors
A concern with our results so far is that our measure of TDF ownership at the stock level could be picking up holdings of other funds with fixed asset allocations. If these funds pursued identical strategies to the TDF sector, then we would be underestimating rebalancing flows (in the previous section), accurately measuring the effect of these strategies on stock returns (in the analysis above), but underestimating the true ownership share by investors with TDF-like strategies. If for example there were as much money outside of TDFs pursuing the same strategies as inside TDFs, then the main coefficients in Tables 6 and 7 (and their standard errors) would be biased upward by a factor of two. On the other hand, our calculation of the effect on a stock's return or volatility of moving one standard deviation in TDF ownership would be an unbiased estimate but would measure the effect of moving one standard deviation in both TDF and other funds ownership.
Alternatively, other funds pursuing TDF-like strategies might hold portfolios of stocks that are uncorrelated with and unrelated to the portfolios of stocks held by the TDF sector. In this alternative extreme case, our estimates of the stock-level impact of TDFs would be completely unbiased. But for any randomly chosen stock, there would be reduction in stock volatility coming from these other funds that we would not measure in addition to the effect of TDFs that we would measure.
The truth probably lies somewhere between these two extremes. An additional complication is that the investors in these funds could respond to the pandemic or market movements by taking money in and out of these other funds, unlike TDF investors who do not on net reallocate much even in response to the economic disruption of the pandemic.
In sum, it is likely that our main measure of TDF ownership at the stock level has measurement error due to other funds or strategies that invest in a way that is contrarian at the asset-class level in a way that is similar to TDFs. Below we follow PSS and discuss these other types of funds to consider how their strategies might interact with our analysis.Footnote 17
Model portfolios: Model portfolios are fund-of-fund strategies that mostly hold mutual funds and exchange-traded funds and that follow prescribed strategies. They include (i) robo-advisors, (ii) financial advisors, broker-dealers, and home offices that provide fund advisory or allocation programs that make or advise automated re-allocations, and (iii) some mutual fund companies that provide strategists or model platforms. Model portfolios have the feature of TDFs in that they try to maintain fixed allocations and provide some automatic rebalancing. Model portfolios managed roughly $4 trillion in 2019.Footnote 18 Given the similarity in investment objectives and overlap in sponsors between TDFs and the providers of model portfolios (e.g., companies like Fidelity), model portfolios and TDFs may seek to hold similar portfolios and so may have highly correlated holdings within the equity space at the stock level. The trading behavior of portfolios managed by model portfolios may therefore have substantial similarity to the trading behavior of assets held in TDFs at the stock level, as in our first example above.Footnote 19
Hedge funds: The global hedge fund industry does not appear to pursue similar trading strategies to those of TDFs and in fact many funds tend to try to be market neutral, so that their returns at the asset-class level are unaffected by the return on the asset class. Grinblatt et al. (Reference Grinblatt, Jostova, Petrasek and Philipov2020) show evidence that two-thirds of the hedge funds pursue cross-sectional contrarian strategies, quite different than the market-contrarian trades of TDFs. However there is one hedge fund strategy that is more akin to the trading behavior of TDFs: ‘risk parity’, which seeks to maintain a desired risk level and therefore may sell an asset class that has relatively high returns. But these strategies are typically not pursued at the asset class level and we know of no such hedge funds strategies that try to maintain an explicit target asset allocation.
Pension funds and endowments: Pension funds, foundations, family offices, and endowments tend to pursue rebalancing strategies at much lower frequencies and, while the sometimes do have target allocations at the level of the asset class, these are often revised at the same (annual or lower) frequency at which managers might seek to return to target. That is, pensions and similar institutions do state target allocations at the level of the asset class. However, these funds have more discretion over portfolio balance after initial investment, have much greater freedom to deviate from any explicit desired balance, and often adjust the targets in response to market movements (Andonov and Rauh, Reference Andonov and Rauh2020). In sum, rebalancing of pensions and endowments may provide some aggregate contrarian fund flows that complement those from TDFs, but probably rebalance much more slowly and less completely.
5. Returns from trading before or with TDFs
One question one might ask is whether the stabilizing effect of TDFs might in the future be eliminated by other strategies that trade against these funds. Put differently, have TDFs made retirement investors ‘smarter’ investors with the additional benefit of stabilizing stock prices, or have TDFs made retail investors more exploitable by other traders with more sophisticated strategies?
While a full answer to these questions requires a complete model and correct understanding of these investors' goals, a partial answer comes from studying whether the TDF trading strategy was profitable during the pandemic, or whether trading against the automatic rebalancing in these retirement funds would have been profitable. PSS investigates this before the pandemic, when retail investors were moving money into equity funds in response to positive excess returns on the stock market. In this case, one might expect sophisticated arbitrage capital to trades against these general retail/institutional flows and alongside TDFs, suggesting that TDF strategies might produce better risk-adjusted returns. However, during the pandemic retail investors traded in the opposite direction to that in normal times, buying the pandemic dip, for example. In this case, TDFs and retail investors would have traded together in a macro-contrarian manner, and one might reasonably ask whether sophisticated capital was trading against or alongside TDFs and whether doing so would have produced better risk-adjusted returns over this period.
Following PSS, we consider one long-short strategy that (infeasible) trades and holds for the month of an asset-class return (and the contemporaneous TDFs rebalancing), and one long-short strategy that (feasible) trades and holds for the month following the returns (and so trades alongside slower TDF rebalancing). To trade alongside TDFs, both of these strategies short high-TDF stocks and buy low-TDF stocks (at the start of the month in question) when the stock market return is high and take the opposite position when the market return is low (and hold for a month). The profit of these strategies approximates the profit from the aggregate rebalancing trading by TDFs while using stocks with low-TDF exposure as a hedge. As before, we sort stocks into quintiles based on TDF ownership in each quarter and then form portfolios every month based on the sign of the excess equity market return.
Consider the first strategy that takes its position prior to the asset class return during a month: if (R E − R B)m < 0, it goes long the highest TDF quintile of stocks and shorts the lowest TDF quintile at the beginning of month m and holds until the end of the month. If (R E − R B)m > 0, the strategy takes the opposite long-short position. This strategy is impossible in practice because it requires knowledge of aggregate returns during a month at the start of the month. It also involves risk. Figure 6, panel A shows that the cumulative risk-adjusted return of this strategy is 40 percent over 4 years 2019–22, or about 83 bps per month on average. We interpret this excess return as (infeasible) upper bound to the profit of a cross-sectional trading strategy that trades in the same direction, but ahead of, TDFs.
Returns from TDF-based long-short trading strategy.
Note: This figure shows the cumulative four-factor alphas from investing in a portfolio of stocks with the highest TDF ownership and shorting a portfolio with the lowest TDF ownership when the excess stock market return in the current month (panel (a)) or previous month (panel (b)) is negative, and the reverse when the excess stock market return is positive. The sample includes NYSE-, NASDAQ-, and AMEX-traded stocks with market capitalizations that are above the fifth percentile on the NYSE and with beginning-of-month prices above five dollars. Stocks are sorted into quintiles according to their average indirect TDF ownership in 2018.

Consider the second strategy that trades along with TDFs in the month following a return, month m: if (R E − R B)m−1 > 0, go long the highest TDF quintile of stocks and short the lowest quintile during month m, and the reverse when (R E − R B)m−1 < 0. Because this strategy trades the month after a return, it is feasible. This strategy trades alongside the slower rebalancing TDFs, which we show are primarily the active TDFs. Panel B of Figure 6 shows that this strategy of trading along with active TDFs still generates positive profits. In fact, somewhat surprisingly it is only slightly less profitable than the infeasible strategy that trades ahead of TDFs. That said, the key point for us is that sophisticated capital would not have been able to exploit predictable rebalancing by TDFs during this period: feasibly trading against TDFs would have generated a loss of 30 percent return over 4 years.
In sum, the TDF rebalancing the month after a return seems to be profitable in a cross-sectional sense during the pandemic period. It does not seem to be profitable to trade against TDFs based on the previous month return. Thus arbitrage capital should not be allocating funds to trading strategies that would reduce the cross-section price impact of TDF trading going forward.
6. Concluding remarks
TDFs have become an important financial instrument for retail investors, largely following the 2006 Pension Protection Act which qualified TDFs to serve as default options in 401(k) retirement plans. At present, 90 percent of employers offer TDFs as the default options in their retirement plans, and TDFs manage one-quarter of all 401(k) plan assets.
But while TDFs were designed to be optimal for households taking returns as given, they have had an unintended and significant stabilizing impact on mutual fund flows and on stock returns during the period of market volatility around the pandemic. Because TDFs rebalance portfolios by selling stocks when the stock market rises and buying stocks when the market falls, they have acted as a market-stabilizing force. These findings complement and extend the evidence of Parker et al. (Reference Parker, Schoar and Sun2023) based on the period before the pandemic when TDFs were growing and economic outcomes were more typical. We show that even during the unprecedented volatility of the last few years, TDFs have stabilized the funding of the mutual funds that they disproportionately invest in, and they have stabilized the prices of stocks that they (indirectly) disproportionately hold.
If the amount of funds invested through TDFs continues to grow, or as the population ages and remains in TDFs so that more TDF assets are near a 50 percent equity share implying maximum rebalancing, the contrarian trading of these types of funds may start to have greater effects on aggregate market returns. By putting downward pressure on stock prices after market increases and upward pressure after market drops, contrarian strategies are likely dampening overall stock market fluctuations. That said, at the moment these market-wide effects cannot be measured well given market volatility, a reasonable estimate of the elasticity of the level of the overall stock market to TDF trading, and the size of the TDF sector at the moment. TDF macro-contrarian trading is also likely affecting the serial correlation of returns, and increasing the correlation between stock and bond returns, but again in ways too small to evaluate or quantify to date.
Finally, we should emphasize that any stabilizing effect of TDFs on the stock market may or may not be beneficial for the stock market, the economy, or even the TDF investor. If a given stock market movement is an inefficient, transitory fluctuation in market prices, then trading by TDFs may increase market efficiency by reducing the deviation of prices from their efficient fundamental values. Alternatively, if a fluctuation is instead an efficient response to fundamentals (e.g., a permanent change in aggregate dividends), then trading by TDFs may decrease market efficiency (and/or TDFs would lose some returns to arbitrage capital that trades to restore fundamental prices).
An alternative design choice for TDFs that would not require a stand on whether fluctuations are or are not efficient would be to take a macro-optimal perspective and structure the TDFs to hold a portfolio comprised of an age-dependent combination of a risk-free asset and the market portfolio of all risky assets (consisting of whatever share of stocks and bonds there are in the market portfolio). As people aged, the TDF would have them hold more of the risk-free asset and less of the market portfolio, but as the stock market fluctuated, the TDF would only adjust the balance between all risky assets – stocks and bonds – and risk-free short term debt.
Supplementary material
The supplementary material for this article can be found at https://doi.org/10.1017/S1474747223000197.
Acknowledgments
For helpful comments, we thank Owen Lamont, Blake LeBaron, Joshua Rauh, Antoinette Schoar, and seminar participants at Brandeis.
Competing interest
None.
Appendix: Additional results
Summary statistics of beta estimates


 Open access