


1. Introduction
Phosphorus and barium are essential nutrient elements for all organisms on the Earth and are often utilized as effective proxies for assessing primary palaeo-productivity (Tribovillard et al. Reference Tribovillard, Algeo, Lyons and Riboulleau2006; Wei, Reference Wei2012; Li et al. Reference Li, Zhang, Li and Fu2016, Khaled et al. Reference Khaled, Li, Xi, Zhao, Wu, Yu, Zhang and Li2022). Accurate determination of oceanic phosphorus concentrations throughout Earth’s history is crucial for gaining insight into the evolution of major biogeochemical cycles and the development of the biosphere. It is believed that the availability of phosphorus played a significant role in regulating primary productivity in oceans by oxic photosynthesis (Kipp & Stüeken, Reference Kipp and Stüeken2017; Rasmussen et al. Reference Rasmussen, Muhling, Suvorova and Fischer2021). Enrichment of organic matter is predominantly influenced by detrital influx, palaeo-productivity and palaeoclimate (Murphy et al. Reference Murphy, Sageman, Hollander, Lyons and Brett2000; Wignall & Newton, Reference Wignall and Newton2001). On the other hand, preservation of organic matter is primarily influenced by a combination of factors, such as deposition rate, redox conditions and water depth (Demaison & Moore, Reference Demaison and Moore1980; Arthur et al. Reference Arthur, Dean and Laarkamp1998; Sageman et al. Reference Sageman, Murphy, Werne, Straeten, Hllander and Lyons2003).
The concentration of phosphorus (P) in seawater plays a significant role in primary productivity, the burial of organic matter and redox conditions of ocean-atmosphere system (Holland, Reference Holland1984; Bjerrum & Canfield, Reference Bjerrum and Canfield2002; Planavsky et al. Reference Planavsky, Rouxel, Bekker, Lalonde, Konhauser, Reinhard and Lyons2010; Jones et al. Reference Jones, Nomosatryo, Crowe, Bjerrum and Canfield2015; Li et al. Reference Li, Lang, Ma, Cui, Pei and Shen2020; Tang et al. Reference Tang, Xie, Shi and Zhou2022). In contrast to bioavailable nitrogen, another important element for biological activities, from the atmosphere that can be fixed by microbes, phosphorus is primarily derived from the sources of river water. The amount of phosphorus in river water is influenced by continental weathering (Ruttenberg, Reference Ruttenberg2003), which has played a crucial role in regulating availability of nutrients and thus net primary productivity in seawater (Howarth, Reference Howarth1988; Tyrrell, Reference Tyrrell1999; Kipp & Stüeken, Reference Kipp and Stüeken2017). Therefore, estimation of the marine phosphate pool size variation over time is necessary to reconstruct significant aspects of the geochemical evolution of seawater and biological evolution of organisms (Holland, Reference Holland2006).
The seawater phosphorus concentrations can be indirectly estimated from P/Fe ratio of iron oxide-rich chemical sediments (Bjerrum & Canfield, Reference Bjerrum and Canfield2002; Planavsky et al. Reference Planavsky, Rouxel, Bekker, Lalonde, Konhauser, Reinhard and Lyons2010; Jones et al. Reference Jones, Nomosatryo, Crowe, Bjerrum and Canfield2015; Li et al. Reference Li, Lang, Ma, Cui, Pei and Shen2020; Tang et al. Reference Tang, Xie, Shi and Zhou2022). This estimation is based on the geochemical reactions during oxidation of ferrous iron (Fe2+) to ferric (Fe3+) oxides or oxyhydroxides, producing positively charged surfaces which attract negatively charged anions, such as phosphate (PO4 3 -) (Feely et al. Reference Feely, Trefry, Lebon and German1998; Toner et al. Reference Toner, Santelli, Marcus, Wirth, Chan, McCollom, Bach and Edwards2009; Robbins et al. Reference Robbins, Lalonde, Planavsky, Partin, Reinhard, Kendall, Scott, Hardisty, Gill, Alessi, Dupont, Saito, Crowe, Poulton, Bekker, Lyons and Konhauser2016). Therefore, P is mainly absorbed by iron oxides (Hemmingsson et al. Reference Hemmingsson, Pitcairn and Fru2018). The process produces a positive correlation of P and Fe concentrations in the samples (Planavsky et al. Reference Planavsky, Rouxel, Bekker, Lalonde, Konhauser, Reinhard and Lyons2010; Li et al. Reference Li, Lang, Ma, Cui, Pei and Shen2020). Furthermore, the magnitude of P adsorption depends on the dissolved Si concentration in seawater, allowing for estimation of seawater P concentration from the P/Fe ratio of BIFs and iron oxide-rich sedimentary rocks at a known Si content (Bjerrum & Canfield, Reference Bjerrum and Canfield2002; Konhauser et al. Reference Konhauser, Lalonde, Amskold and Holland2007; Jones et al. Reference Jones, Nomosatryo, Crowe, Bjerrum and Canfield2015). Detrital contribution affecting the phosphorus concentrations in the seawater can be minimized by using the screening criteria of detrital-poor (Fe/Al ratios > 5), Mn-poor (Fe/Mn ratios > 5) and iron oxide-rich sedimentary rocks (Fe > 5 wt %) for measurements (Planavsky et al. Reference Planavsky, Rouxel, Bekker, Lalonde, Konhauser, Reinhard and Lyons2010; Li et al. Reference Li, Lang, Ma, Cui, Pei and Shen2020).
Phosphorus concentrations in the late Palaeoproterozoic seawater (∼2.0–1.8 Ga) from Indian subcontinent have rarely been measured, mostly because of the paucity of BIFs of this time period in India (Bekker et al. Reference Bekker, Planavsky, Rasmussen, Krapez, Hofmann, Slack, Rouxel, Konhauser, Holland and Turekian2014). Therefore, a well-preserved BIF horizon in the Chilpi Group, Bastar Craton of Central India (Mishra & Mohanty, Reference Mishra and Mohanty2021; Mohanty & Mishra, Reference Mohanty and Mishra2023) offers a unique opportunity to assess phosphorus levels in the late Palaeoproterozoic seawater. In this contribution, geochemical analyses and petrographic studies were performed on a shallow marine BIF of the Chilpi Group to evaluate seawater phosphorus concentrations. The result would provide insight into the geochemistry of phosphorus during late Palaeoproterozoic and might aid in understanding the delayed evolution of early Eukaryotes.
2. Geological setting
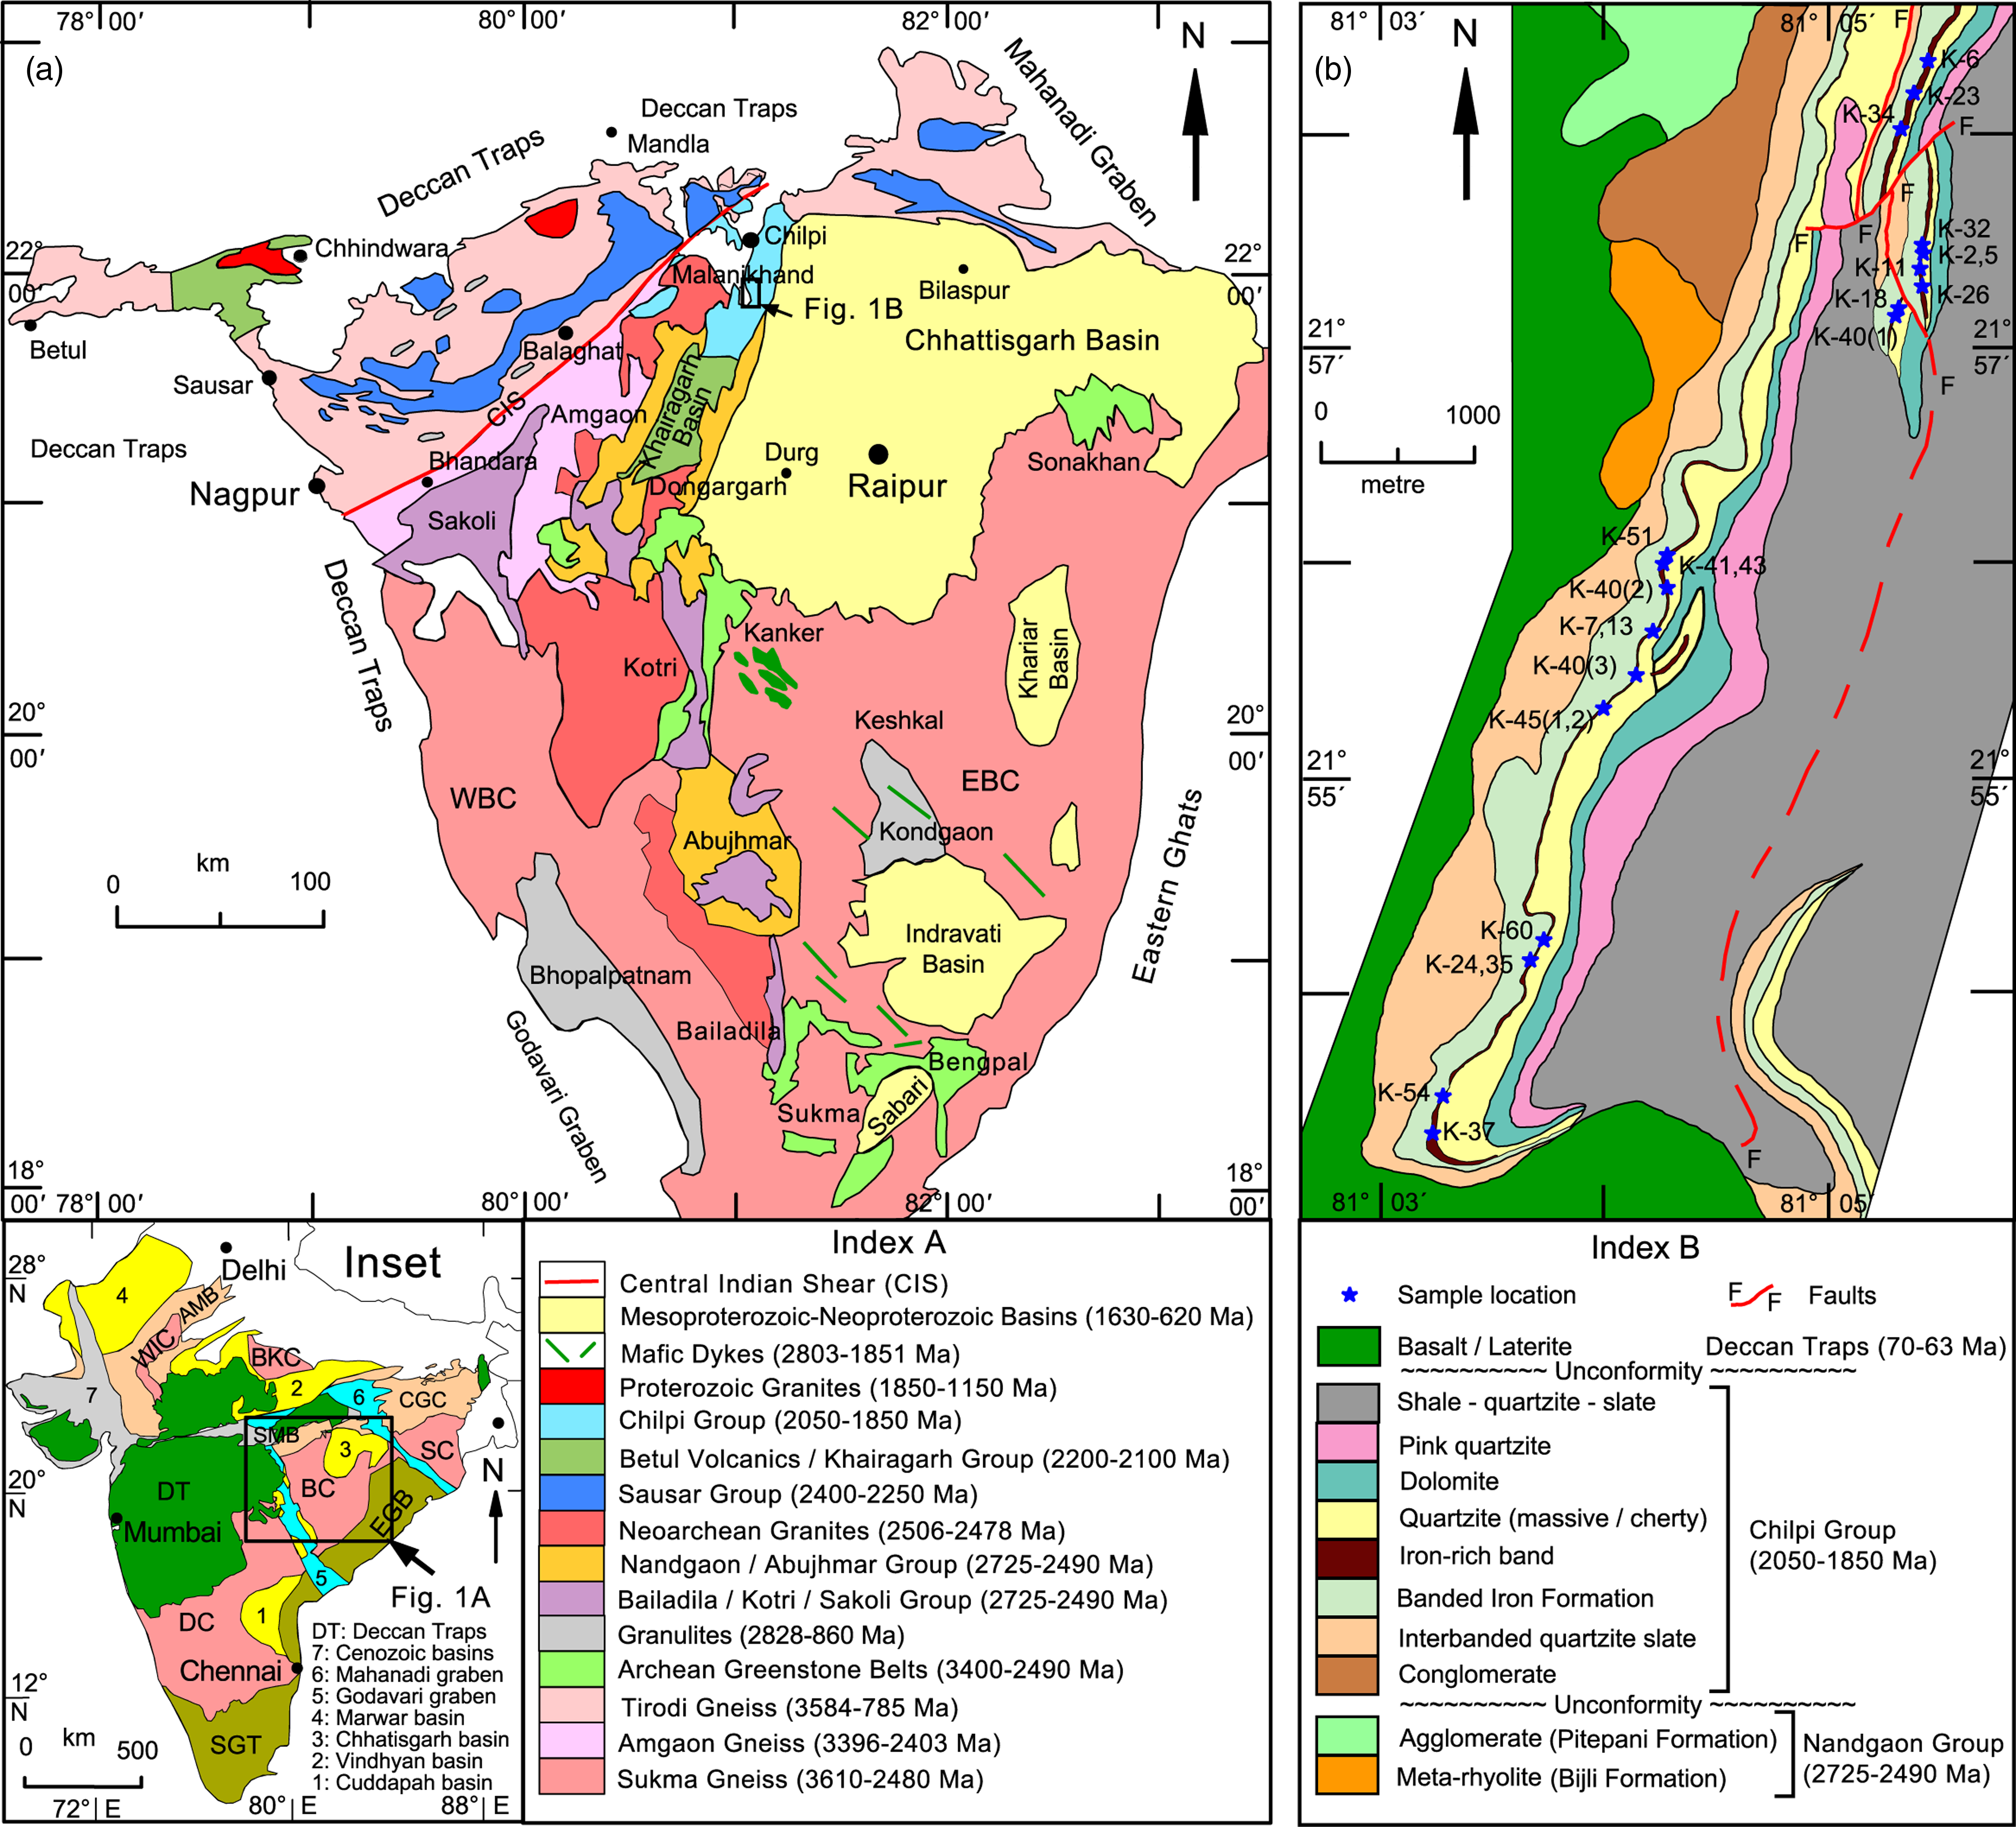
Bastar Craton is one of the oldest cratons in Indian Peninsula (Figure 1(a)). The oldest rock unit of the craton is the Palaeoarchean Sukma Gneiss (3610 ± 336 Ma Rb-Sr whole isochron age, Sarkar & Gupta, Reference Sarkar and Gupta1990; 3582 ± 4 Ma U-Pb zircon age, Rajesh et al. Reference Rajesh, Mukhopadhyay, Beukes, Gutzmer, Belyanin and Armstrong2009; 3561 ± 11 Ma U-Pb zircon age, Ghosh, Reference Ghosh2004, and 3509 ± 14 Ma U-Pb zircon age, Sarkar et al. Reference Sarkar, Corfu, Paul, McNaughton, Gupta and Bishui1993), forming the basement for the Mesoarchean greenstone belts and associated BIFs (the Sukma Group and Bengpal Group). A second cycle of basin development during Neoarchean was marked by deposition of BIF and volcanics, constituting the Bailadila Group (Mohanty, Reference Mohanty2015, Reference Mohanty2021). The rock records of Archean-Palaeoproterozoic transition period are found in the north-western part of the craton; these constitute the Dongargarh Supergroup (Sarkar, Reference Sarkar1957). The Archean volcano-sedimentary units in the lower part of the Dongargarh Supergroup constitute the Nandgaon Group, which is intruded by the Dongargarh Granite (2465 ± 22 Ma; Krishnamurthy et al. Reference Krishnamurthy, Chaki, Pandey, Chimote and Singh1988) and the Malanjkhand Granite (2478 ± 9 Ma; Panigrahy et al. Reference Panigrahy, Misra, Bream and Naik2002). The upper part of the Dongargarh Supergroup comprises Palaeoproterozoic volcano-sedimentary successions, constituting the Khairagarh Group (2120 ± 35 Ma; Sinha et al. Reference Sinha, Rai, Parihar and Hansoti1998). The Dongargarh Supergroup is unconformably overlain by the Chilpi Group (cf. Mohanty, Reference Mohanty2015; Mishra & Mohanty, Reference Mishra and Mohanty2021). The Chilpi Group, deposited between 2000 and 1800 Ma (i.e. before the ‘Proterozoic iron ore gap’), has unconformable relationship with the overlying Chhattisgarh Supergroup of Mesoproterozoic age (Patranabis-Deb et al. Reference Patranabis-Deb, Bickford, Hill, Chaudhuri and Basu2007; Mukherjee & Ray, Reference Mukherjee and Ray2010; Mohanty, Reference Mohanty2015; Mohanty, Reference Mohanty and Mondal2019; Mishra & Mohanty, Reference Mishra and Mohanty2021; Mohanty & Mishra, Reference Mohanty and Mishra2023).
Generalized geological maps. (a) Map of the Bastar Craton with the distribution of sedimentary basins and relationship with the Sausar Mobile Belt (after Mohanty & Mishra, Reference Mohanty and Mishra2023). Details of the framed area (marked as Figure 1(b)) are shown in Figure 1(b). Notes: 1. The zone north of the Central Indian Shear is known as the Central Indian Tectonic Zone. 2. Some of the older units have younger age range than the younger units because of the presence of undifferentiated younger components. (b) Map of the central part of the Chilpi Basin, showing the distribution of different stratigraphic units and sample locations (modified after Mishra & Mohanty, Reference Mishra and Mohanty2021; Mohanty & Mishra, Reference Mohanty and Mishra2023). Inset: Outline map of India showing five Archean cratonic nuclei (mauve; BC: Bastar Craton, BKC: Bundelkhand Craton, DC: Dharwar Craton, SC: Singhbhum Craton and WIC: Western Indian Craton), Palaeoproterozoic-Mesoproterozoic orogenic belts (pale orange; AMB: Aravalli Mountain Belt; SMB: Satpura Mountain Belt; CGC: Chhotanagpur Gneiss Complex), Mesoproterozoic-Neoproterozoic orogenic belts (yellowish green; EGB: Eastern Ghats Belt; SGT: Southern Granulite Terrain), Palaeoproterozoic-Neoproterozoic sedimentary basins (yellow), Gondwana Grabens (bright blue), Deccan Traps (green) and Mesozoic-Cenozoic sedimentary basins (grey). Framed rectangle shows the position of Figure 1(a).

The Chilpi basin covers an area of ∼600 square kilometres on the north-western margin of the Bastar craton (Figure 1(a)). The Nandgaon Group divides the Chilpi basin into two separate sub-basins in the form of basement high. The Chilpi Group comprises conglomerate, coarse arenite (grit), shale and quartzite, with local occurrences of carbonates, cherts and iron-rich beds. A shallow-water cratonic rift or island arc-related environment of deposition has been suggested for the Chilpi Group (Tripathi et al. Reference Tripathi, Ghosh, Thambi, Rao and Chandra1981; Thorat et al. Reference Thorat, Natrajan, Guha and Chandra1990; Basu, Reference Basu2001; Ramakrishnan & Vaidyanadhan, Reference Ramakrishnan and Vaidyanadhan2010).
The study was carried out in the northern basin where exposures of the basement rocks, mostly low-grade metamorphosed rhyolites and andesites of the Nandgaon Group, are unconformably overlain by a basal conglomerate of the Chilpi Group (Figure 1(b)). Successively younger rocks of the Chilpi Group occur towards the east, showing gradations from yellowish brown, gritty quartzite with interbanded chert, variegated interbanded quartzite and slaty shale (IBQS), banded hematite jasper/quartzite (BHJQ) with or without carbonate, iron-rich bands associated with BHJQ, massive quartzite (grey, white, light pink), cherty quartzite, dolomite/magnesian limestone, reddish pink slate, buff quartzite, splintery purple shale and shale (Figure 1(b)). Quartz, epidote and calcite veins cut across the layering in the Chilpi succession. The Chhattisgarh Supergroup in the east has a fault contact with the Chilpi Group.
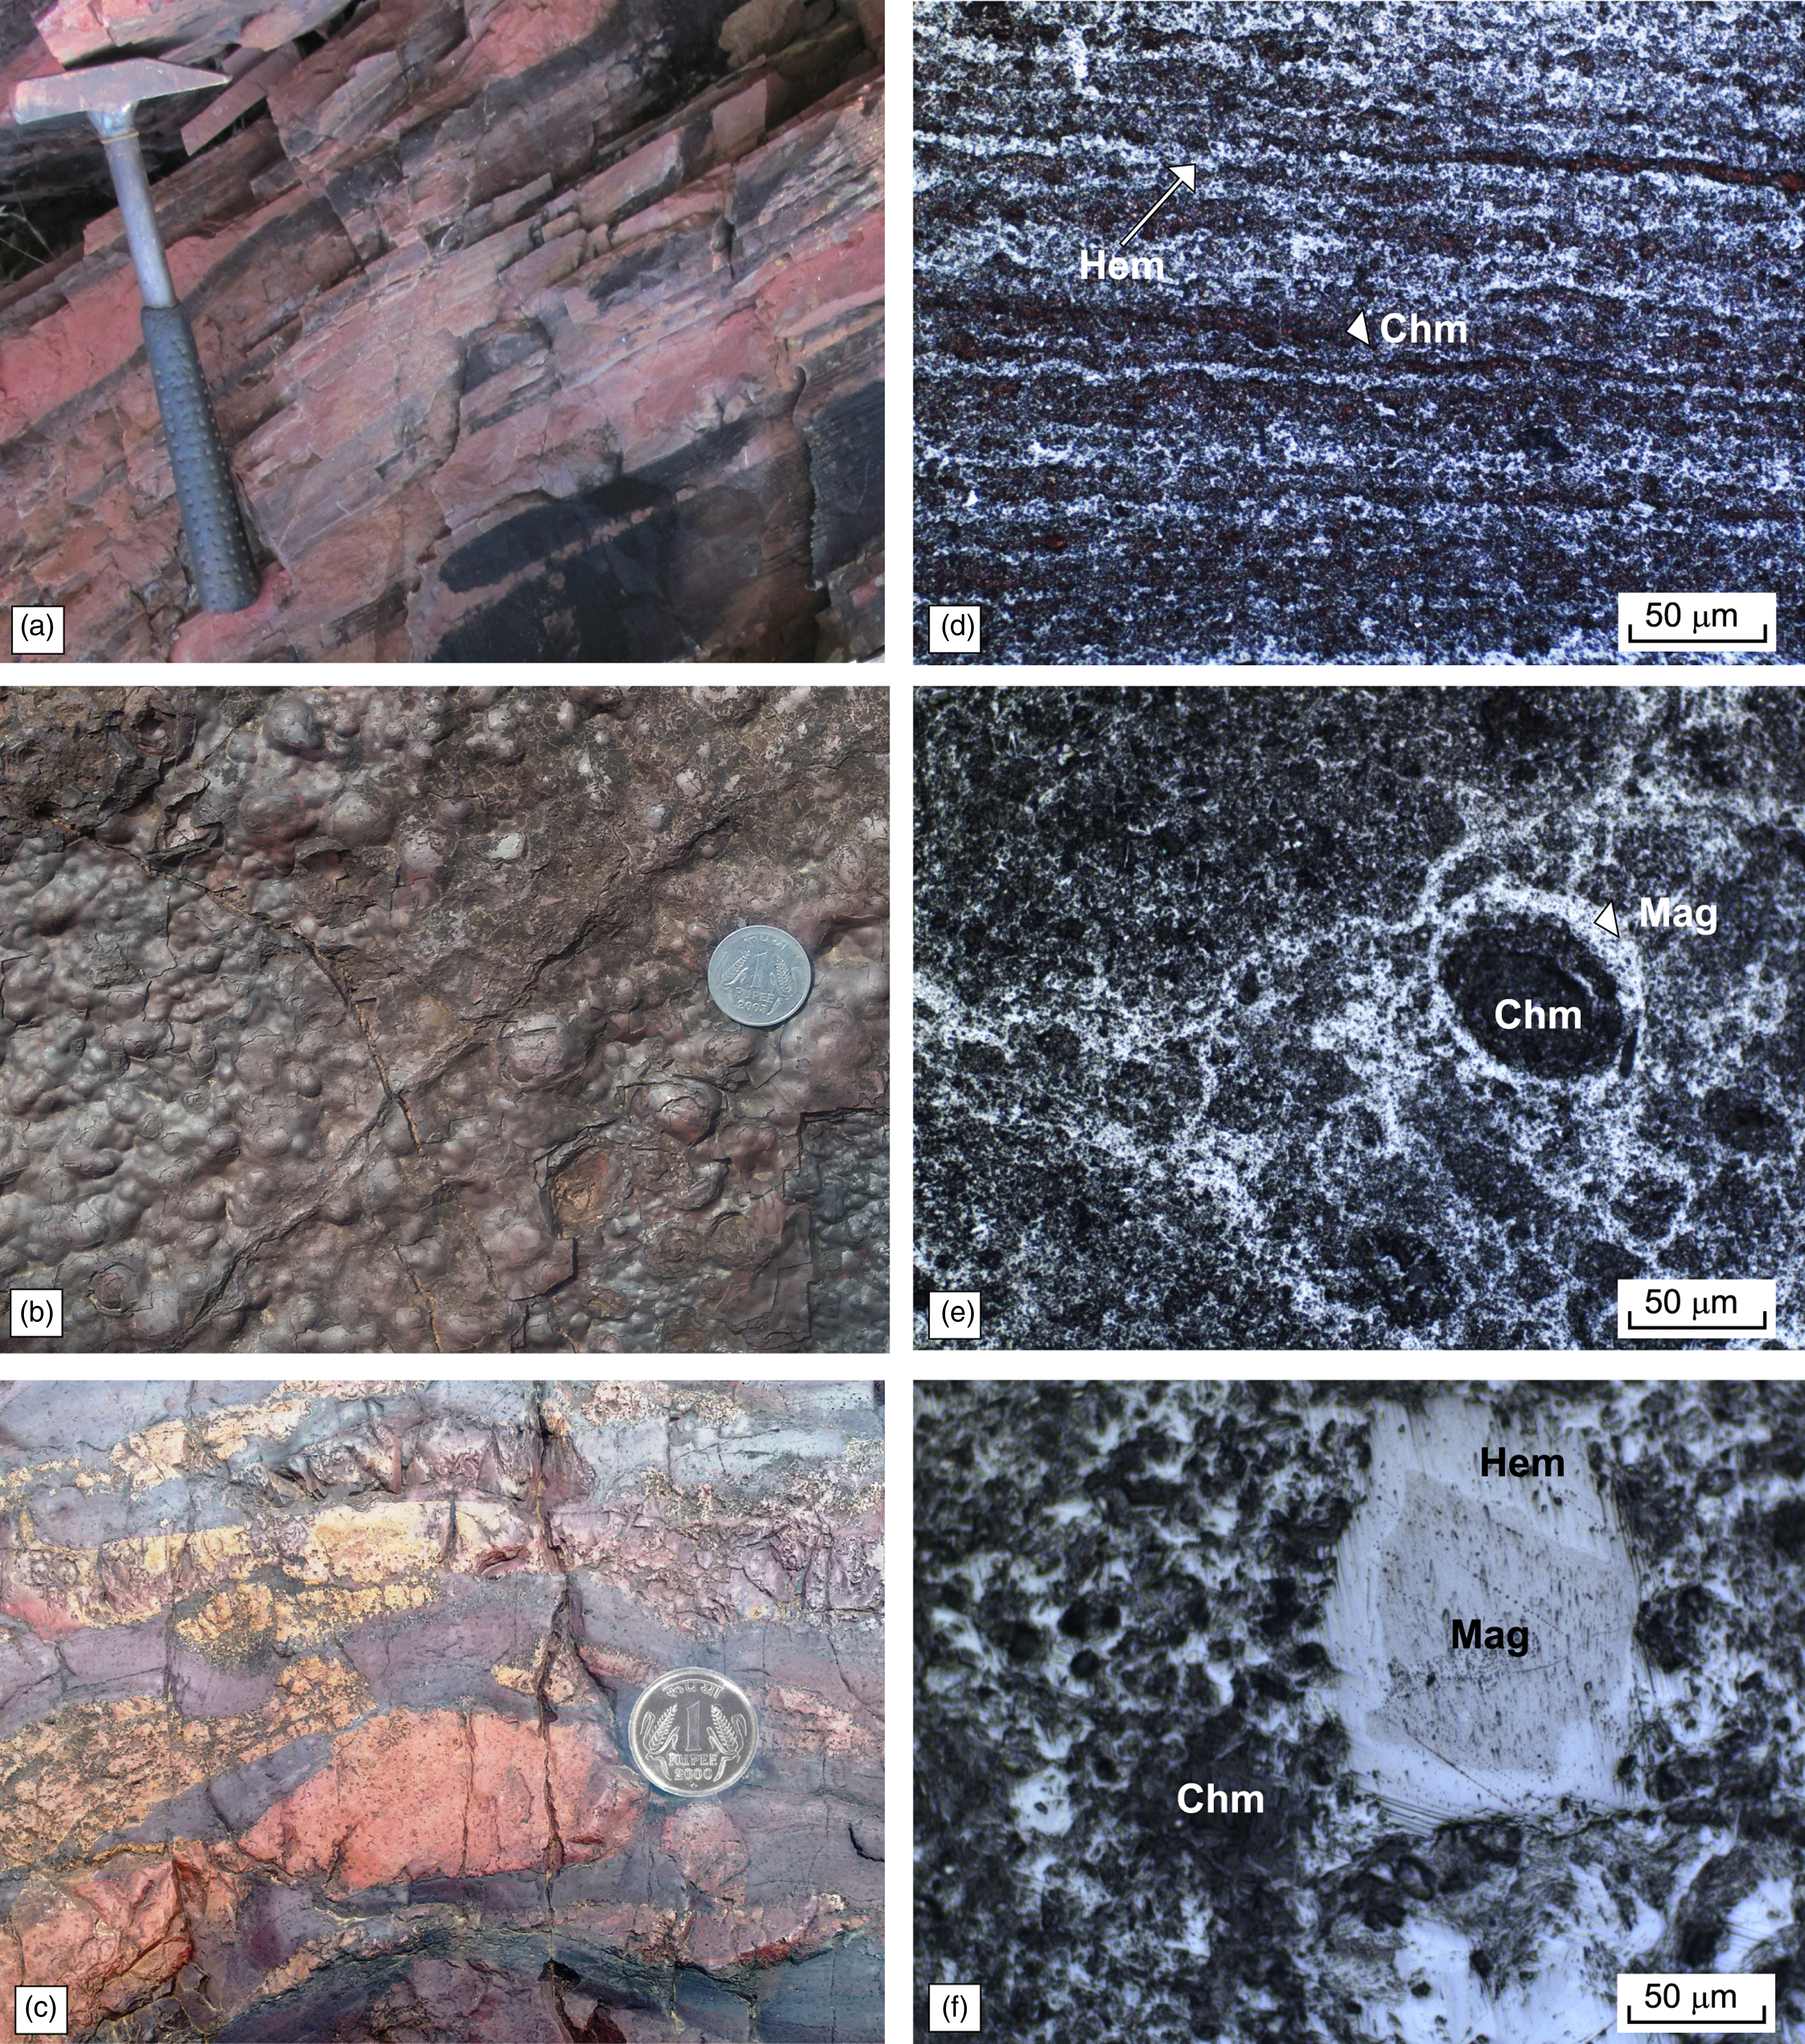
In the studied area, discontinuous bands of BIF occur in the NE-SW and NNE-SSW direction and remain in the contact with BHJQ (footwall) and massive quartzite/dolomite (hanging-wall). The Chilpi BIF varies in texture from massive to platy/laminated, and in colour from steel grey, bluish grey to dark brown, and is mainly composed of haematite with some specularite, goethite and occasionally magnetite. Frequently, the iron-rich bands display ferruginous shale/ferruginous silica parting. Goethite has botryoidal form, and lateritic iron layers are exposed at places. Thin laminae of iron-rich bands also occur within BHJQ (Figure 2).
Photographs showing different characters of iron-rich units of the Chilpi Group. (a) Alternate hematite and jasper mesobands in the BHJQ unit, (b) botryoidal/pisolitic texture of the iron formation, (c) iron-rich and iron-poor bands showing gradational contact, disruption and presence of chamosite/greenalite-rich band (green unit in the lower part), (d) alternate bands of hematite and silicates minerals (greenish-brown chamosite/greenalite/cronstedtite) in combined transmitted and reflected light, (e) oolitic texture in iron-rich rocks containing chamosite/greenalite oolites with magnetite-hematite borders in reflected light, (f) euhedral magnetite showing replacement by hematite at the peripheral part, and oolitic chamosite/greenalite in reflected light. (Note: Chm – Chamosite, Hem – Hematite, Mag – Magnetite).

3. Methods
Fresh BIF samples of the Chilpi Group were collected from the Lohara area in the eastern basin. The cleaned samples were used for petrographic studies, electron probe micro-analysis (EPMA), X-ray diffraction (XRD) and whole-rock geochemical analyses. The detailed procedure and results of analysis of the carbonate rocks and BIF are given in Mishra & Mohanty (Reference Mishra and Mohanty2021) and Mohanty & Mishra (Reference Mohanty and Mishra2023).
The total organic carbon (TOC) and total sulphur content of 10 randomly selected BIF samples were analysed using Elementar’s CHNS Analyzer at CSIR-Central Institute of Mining and Fuel Research (CIMFR), Dhanbad, Jharkhand, India. For this analysis, ∼40 mg of -200 mesh powder sample was treated with concentrated HCl to remove inorganic carbon. After complete removal of inorganic carbon, the samples were neutralized by washing in a crucible and the treated sample powder was dried completely on a hotplate. Detailed experiment procedures for the TOC and S analyses are given in Sinha et al. (Reference Sinha, Preety, Rai, Mohanty and Sarangi2017). The analytical precision is reported to be higher than ± 0.1 %.
4. Results
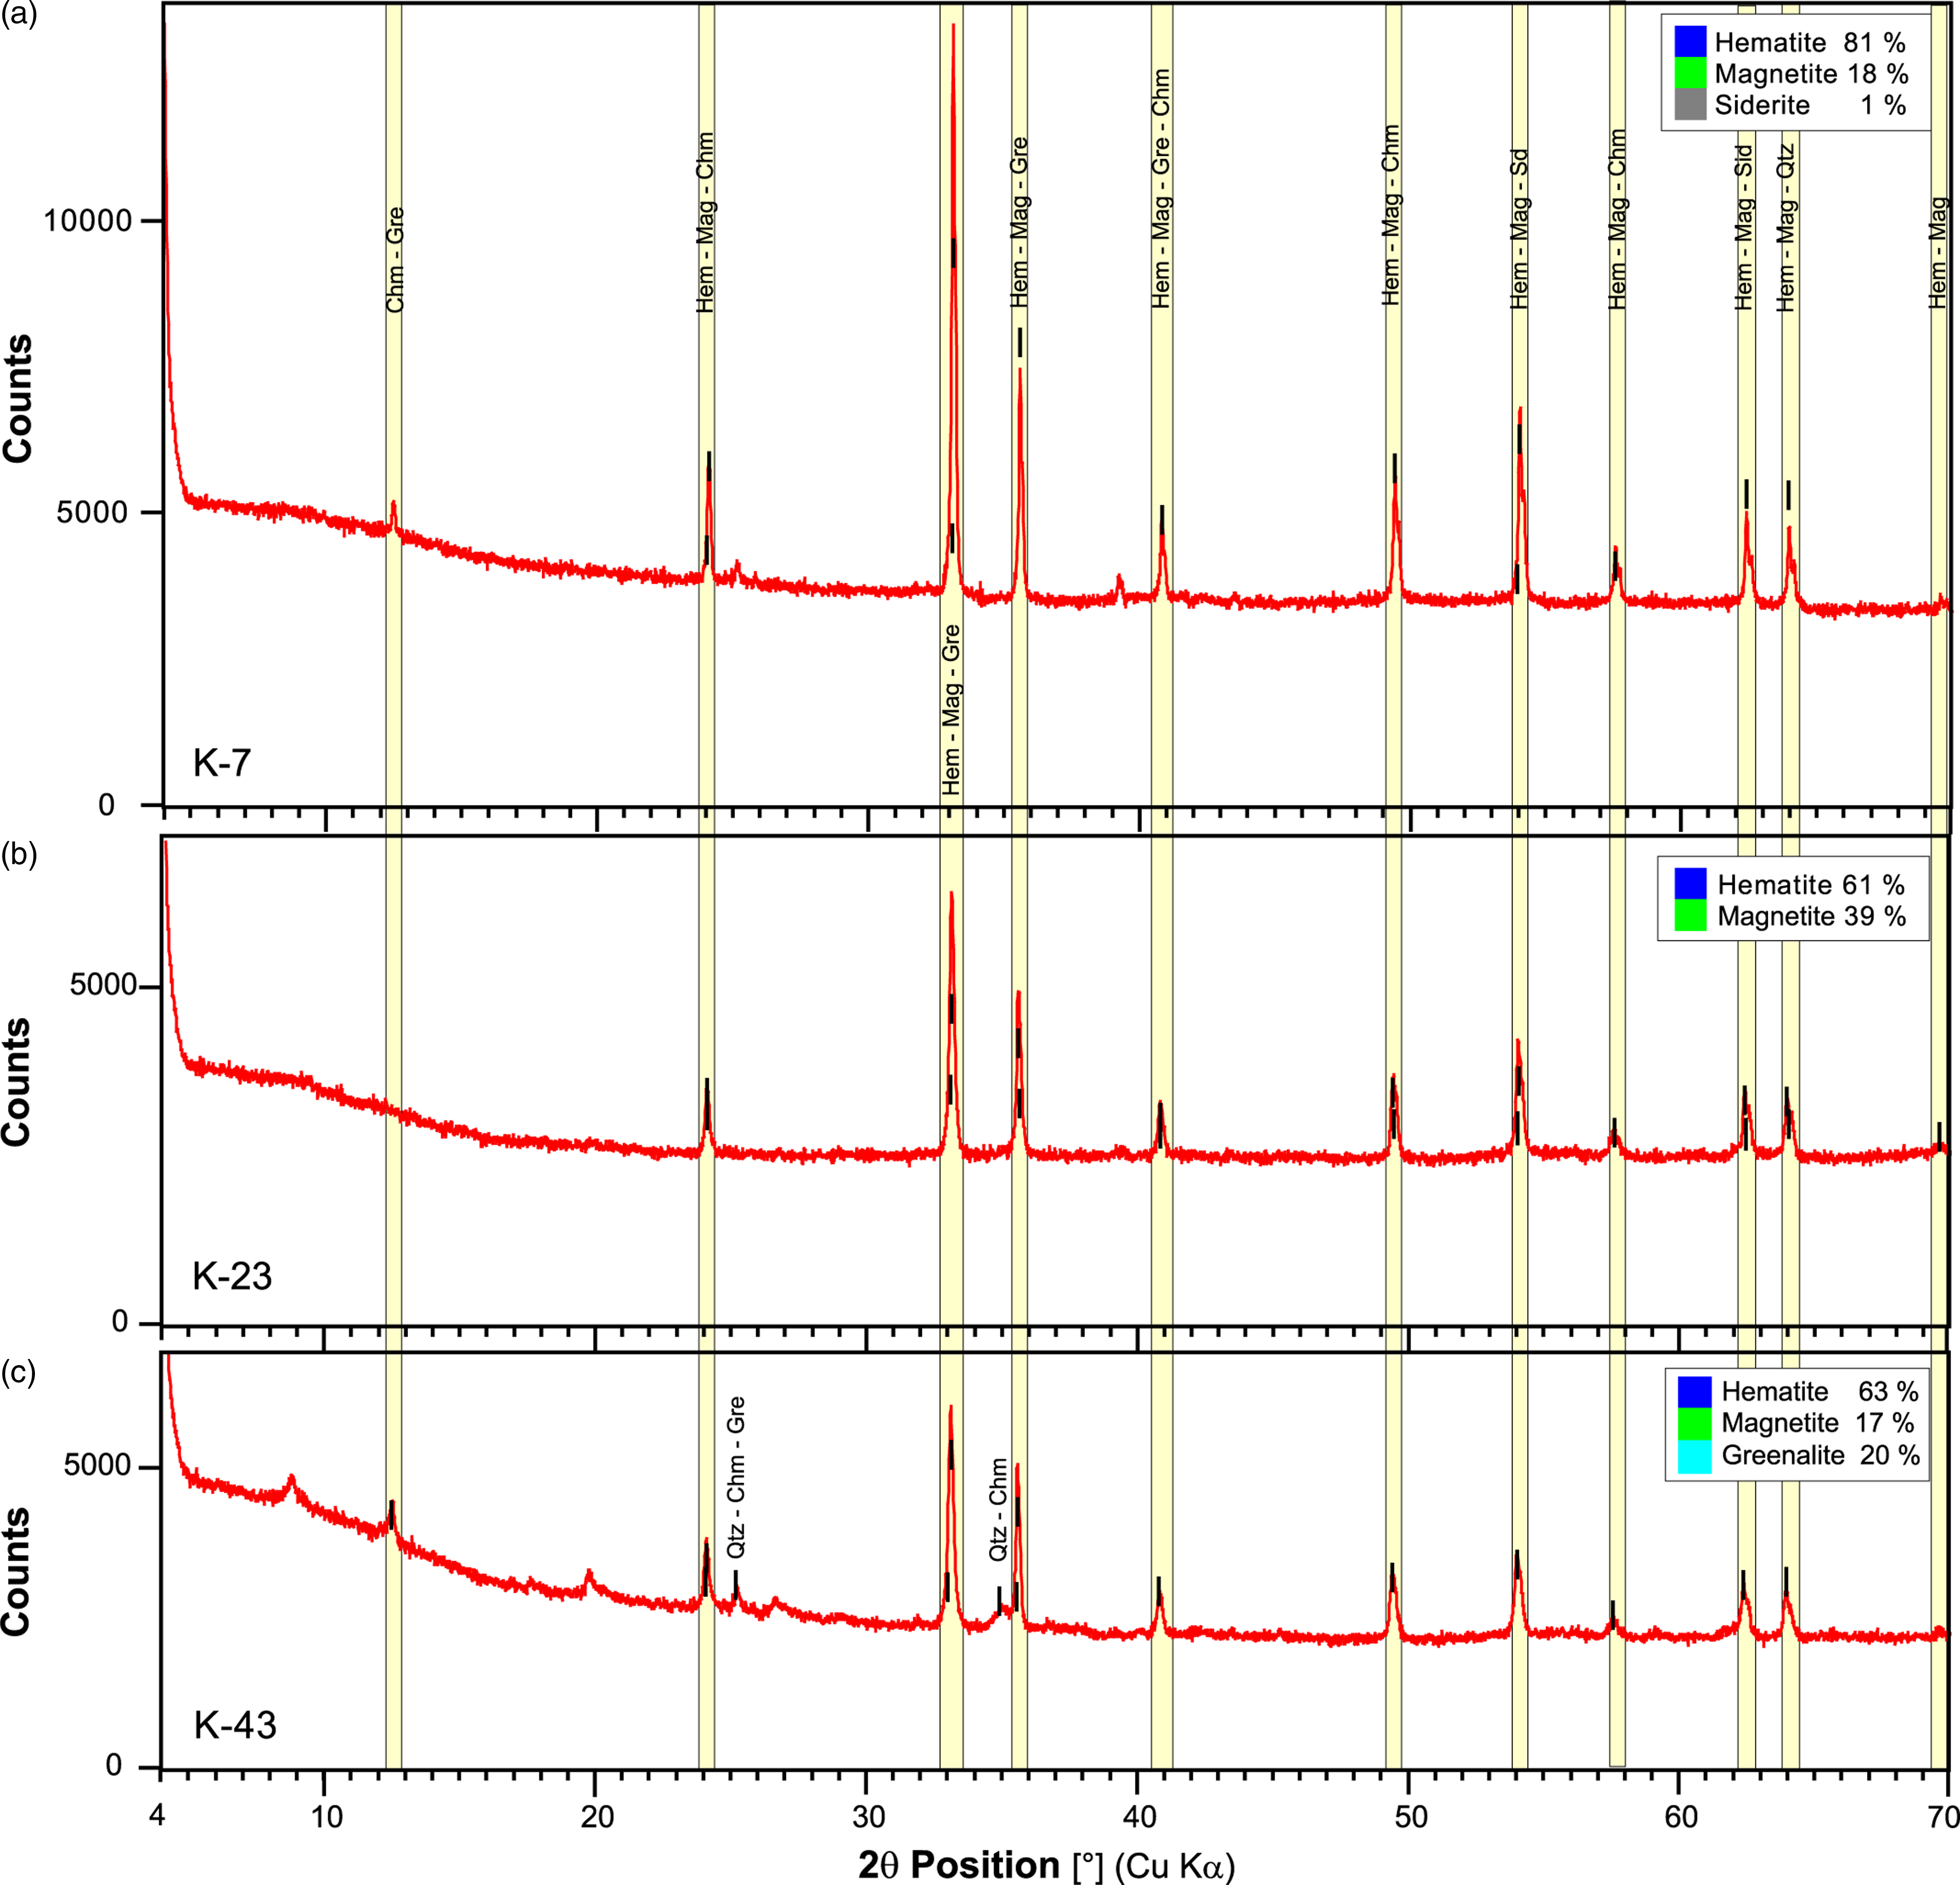
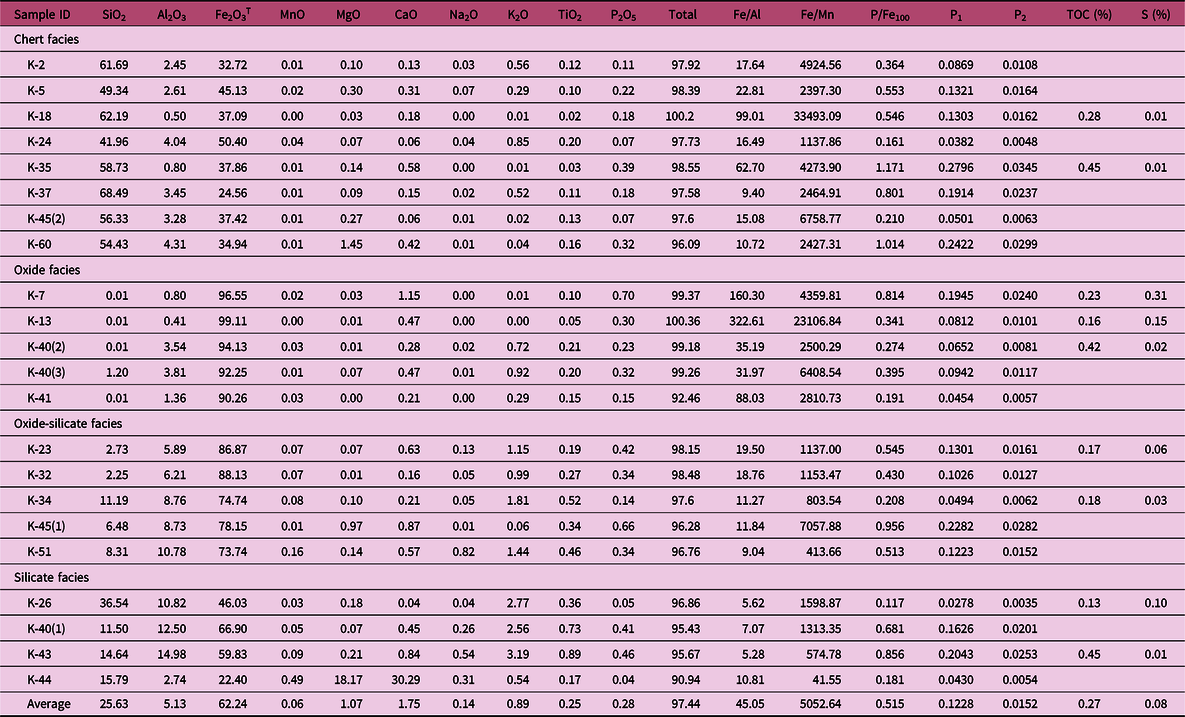
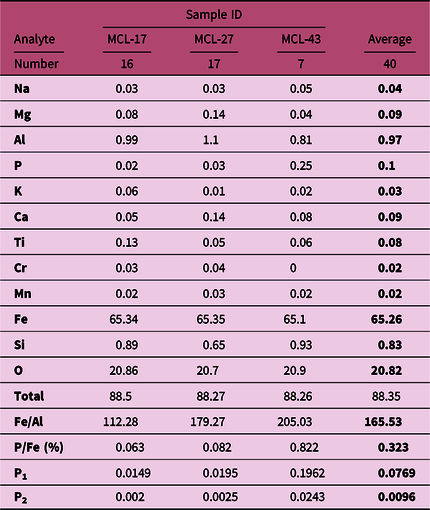
The studied BIFs comprise oxides (magnetite, maghemite and hematite), goethite, apatite, carbonates (dolomite and ankerite), silicates (greenalite, chamosite, cronstedtite) with chert and clay minerals (Mohanty & Mishra, Reference Mohanty and Mishra2023). The presence of chamosite-greenalite, important indicators for suboxic and anoxic depositional environment, was detected from the XRD analysis showing dominant peak positions at 12-14 °2θ (7.1 Å) and 35-37 °2θ (2.5 Å), along with a flattened peak at ∼6-7 °2θ (14.2 Å) (Figure 3). SiO2 and Fe2O3 are the two main constituents of the Chilpi BIFs (Table 1). The bulk rock molar ratios of P/Fe100 in the Chilpi BIF vary between 0.11 and 1.17 (average 0.51 ± 0.3; Table 1). The major element composition of iron-rich minerals was quantitatively analysed using EPMA of carbon-coated samples. Overall, 54 points on 3 samples were examined. The results (Table 2) indicate a low molar P/Fe100 ratio (average: 0.32 ± 0.4). Similar values of P/Fe100 molar ratios were obtained from the bulk rock (0.51 ± 0.3) compositions. The studied iron-rich rock samples show relatively low concentration of Post-Archean Australian Shale (PAAS) normalized REE+Y, with low (Pr/Yb)PAAS (0.13 – 1.91; average 0.69), and (Tb/Yb)PAAS (0.22 – 1.51; average 0.77) indicating depletion of LREE compared to HREE (Figure 4(a)). Further, the Chilpi BIFs exhibit positive anomalies of La, Gd and Y, super chondritic Y/Ho ratio (average 32.15), positive Eu anomaly (average Eu/Eu*PAAS = 1.02) and low positive to transitional negative Ce anomaly (Ce/Ce*PAAS = 0.7 – 1.26). The PAAS normalized REE patterns indicate precipitation of Chilpi BIFs from ambient sea water and preservation of seawater-like signatures (Mohanty & Mishra, Reference Mohanty and Mishra2023). Sulphur and TOC analyses (Table 1) indicate the TOC content of 0.13 – 0.45 % (average 0.27 %) and sulphur concentrations of 0.01 and 0.31 % (average 0.08 %).
Diffractograms of selected iron-rich rock samples of the Chilpi Group, showing identified peaks (highlighted) and the corresponding 2θ positions in XRD analysis using Cu-Kα radiation: (a) oxide facies hematite-rich sample (K-7), containing magnetite, siderite, and negligible amounts of chamosite-greenalite and quartz, (b) oxide-silicate facies hematite-rich sample (K-23), containing magnetite as a major phase and negligible amount of quartz, and (c) silicate facies hematite-rich sample (K-43), having magnetite, greenalite, chamosite and quartz. The relative proportions of different minerals are given in the panel at the top right. Abbreviations: Chm – chamosite, Gre – greenalite, Hem – hematite, Mag – magnetite, Qtz – quartz, and Sd – siderite.

Major oxide (in wt%), TOC and S content, selected element ratios and estimated P content for two different silica activities in the studied iron-rich rocks. P1 = P concentration (μM) at a [Si] = 0.67 mM, and P2 = P concentration (μM) at a [Si] = 0 mM

Elemental composition (in wt%) of iron oxide phases determined by EPMA analysis, selected element ratios and estimated P content for two different silica activities in the studied iron-rich rocks. P1 = P concentration (μM) at a [Si] = 0.67 mM; P2 = P concentration (μM) at a [Si] = 0 mM

5. Data interpretation
5.a. Characteristics of the Chilpi BIF
The Chilpi Group BIFs are characterized by simple and homogeneous mineralogy (Figures 2, 3; Mohanty & Mishra, Reference Mohanty and Mishra2023). However, the modal proportion of the minerals and textures are different due to minor difference in paragenetic sequences (Figure 3). The boundary between the iron-poor and iron-rich bands is rarely sharp and usually gradational (Figure 2(c)). Iron-rich bands are mostly discontinuous and exhibit micro-folding and fracturing in some areas. Magnetite tends to occur as euhedral to subhedral, fine-to-medium-grained crystals and exhibits granular texture (Figure 2(f)). Iron-rich bands comprise hematite as the dominant component, which are coarse-grained, with platy and needle-shaped morphology as well as granular texture. Hematite often replaces magnetite in the peripheral parts (Figure 2(f)). Microplaty hematite displays vermicular-net like-structure and remains in association of goethite. Goethite exhibits botryoidal form and occurs around the silicate minerals (Figure 2(b), 2(e)). Goethite replaces hematite at the peripheral part and also in the cracks and voids. Apatite grains, though scanty, are massive and anhedral, found in vicinity of iron oxide minerals. Presence of greenalite, chamosite, and cronstedtite as silicates phases, occurring as oolites and needle-shaped grains, have been confirmed by the XRD and EPMA analysis (Figure 2(d), 2(e), 2(f), 3; Mohanty & Mishra, Reference Mohanty and Mishra2023).
5.b. Factors controlling P/Fe ratio
5.b.1. Solution composition
The molar P/Fe ratios of iron oxide-rich chemical sediments were utilized to evaluate P concentration in palaeo-seawater (e.g. Bjerrum & Canfield, Reference Bjerrum and Canfield2002; Planavsky et al. Reference Planavsky, Rouxel, Bekker, Lalonde, Konhauser, Reinhard and Lyons2010; Jones et al. Reference Jones, Nomosatryo, Crowe, Bjerrum and Canfield2015). The removal/sorption of P from solution can be calculated by the equation:
 $$\rm {K_D} = [P_{Fe}]/([P_d][Fe]) $$
where KD is distribution coefficient/sorption constant, [Pd] is dissolved concentration of phosphorus, [PFe] is concentration of phosphorus in the iron precipitate, and [Fe] is concentration of iron precipitate (Jones et al. Reference Jones, Nomosatryo, Crowe, Bjerrum and Canfield2015; Hemmingsson et al. Reference Hemmingsson, Pitcairn and Fru2018). The value of KD changes in relation to the composition of the solution, particularly the concentrations of silicon ion (Konhauser et al. Reference Konhauser, Lalonde, Amskold and Holland2007) and divalent cations (Mg2+, Ca2+) in seawater (Jones et al. Reference Jones, Nomosatryo, Crowe, Bjerrum and Canfield2015). Iron oxyhydroxide particles in present-day marine systems are formed through Fe2+ oxidation and adsorb phosphate ions with a fixed distribution coefficient at a narrow range of silica concentrations (0 – 2.2 mM) (Konhauser et al. Reference Konhauser, Lalonde, Amskold and Holland2007). The KD values for seawater with three different values of Si at 0, 0.67 and 2.2 mM are determined to be 0.338 ± 0.018 (R2 = 0.98), 0.042 ± 0.002 (R2 = 0.98), and 0.008 ± 0.000 (R2 = 0.98) μM-1, respectively (Jones et al. Reference Jones, Nomosatryo, Crowe, Bjerrum and Canfield2015). Further, in the presence of divalent cations (Mg2+, Ca2+) in seawater, the KD values increase 4-5 times, compared to seawater without these cations.
5.b.2. Detrital contamination
In order to reconstruct the concentration of P in seawater using the P/Fe ratio of iron-rich chemical sediments, it is essential to assess the purity of the samples and any alteration that might have occurred after deposition. High Al content in the sample is indicative of contamination from terrestrial sources, producing a lower P/Fe ratio. On the other hand, the presence of detrital phosphate minerals such as apatite could increase the P/Fe ratio (Poulton & Raiswell, Reference Poulton and Raiswell2002; Raiswell et al. Reference Raiswell, Hardisty, Lyons, Canfield, Owens, Planavsky, Poulton and Reinhard2018). Therefore, only samples with high Fe/Al ratio (> 5) in the spot and the bulk rock analysis were considered. Additionally, samples with high Mn content, indicated by Fe/Mn < 5, were excluded from the interpretation (Yao & Millero, Reference Yao and Millero1996).
5.b.3. Diagenesis
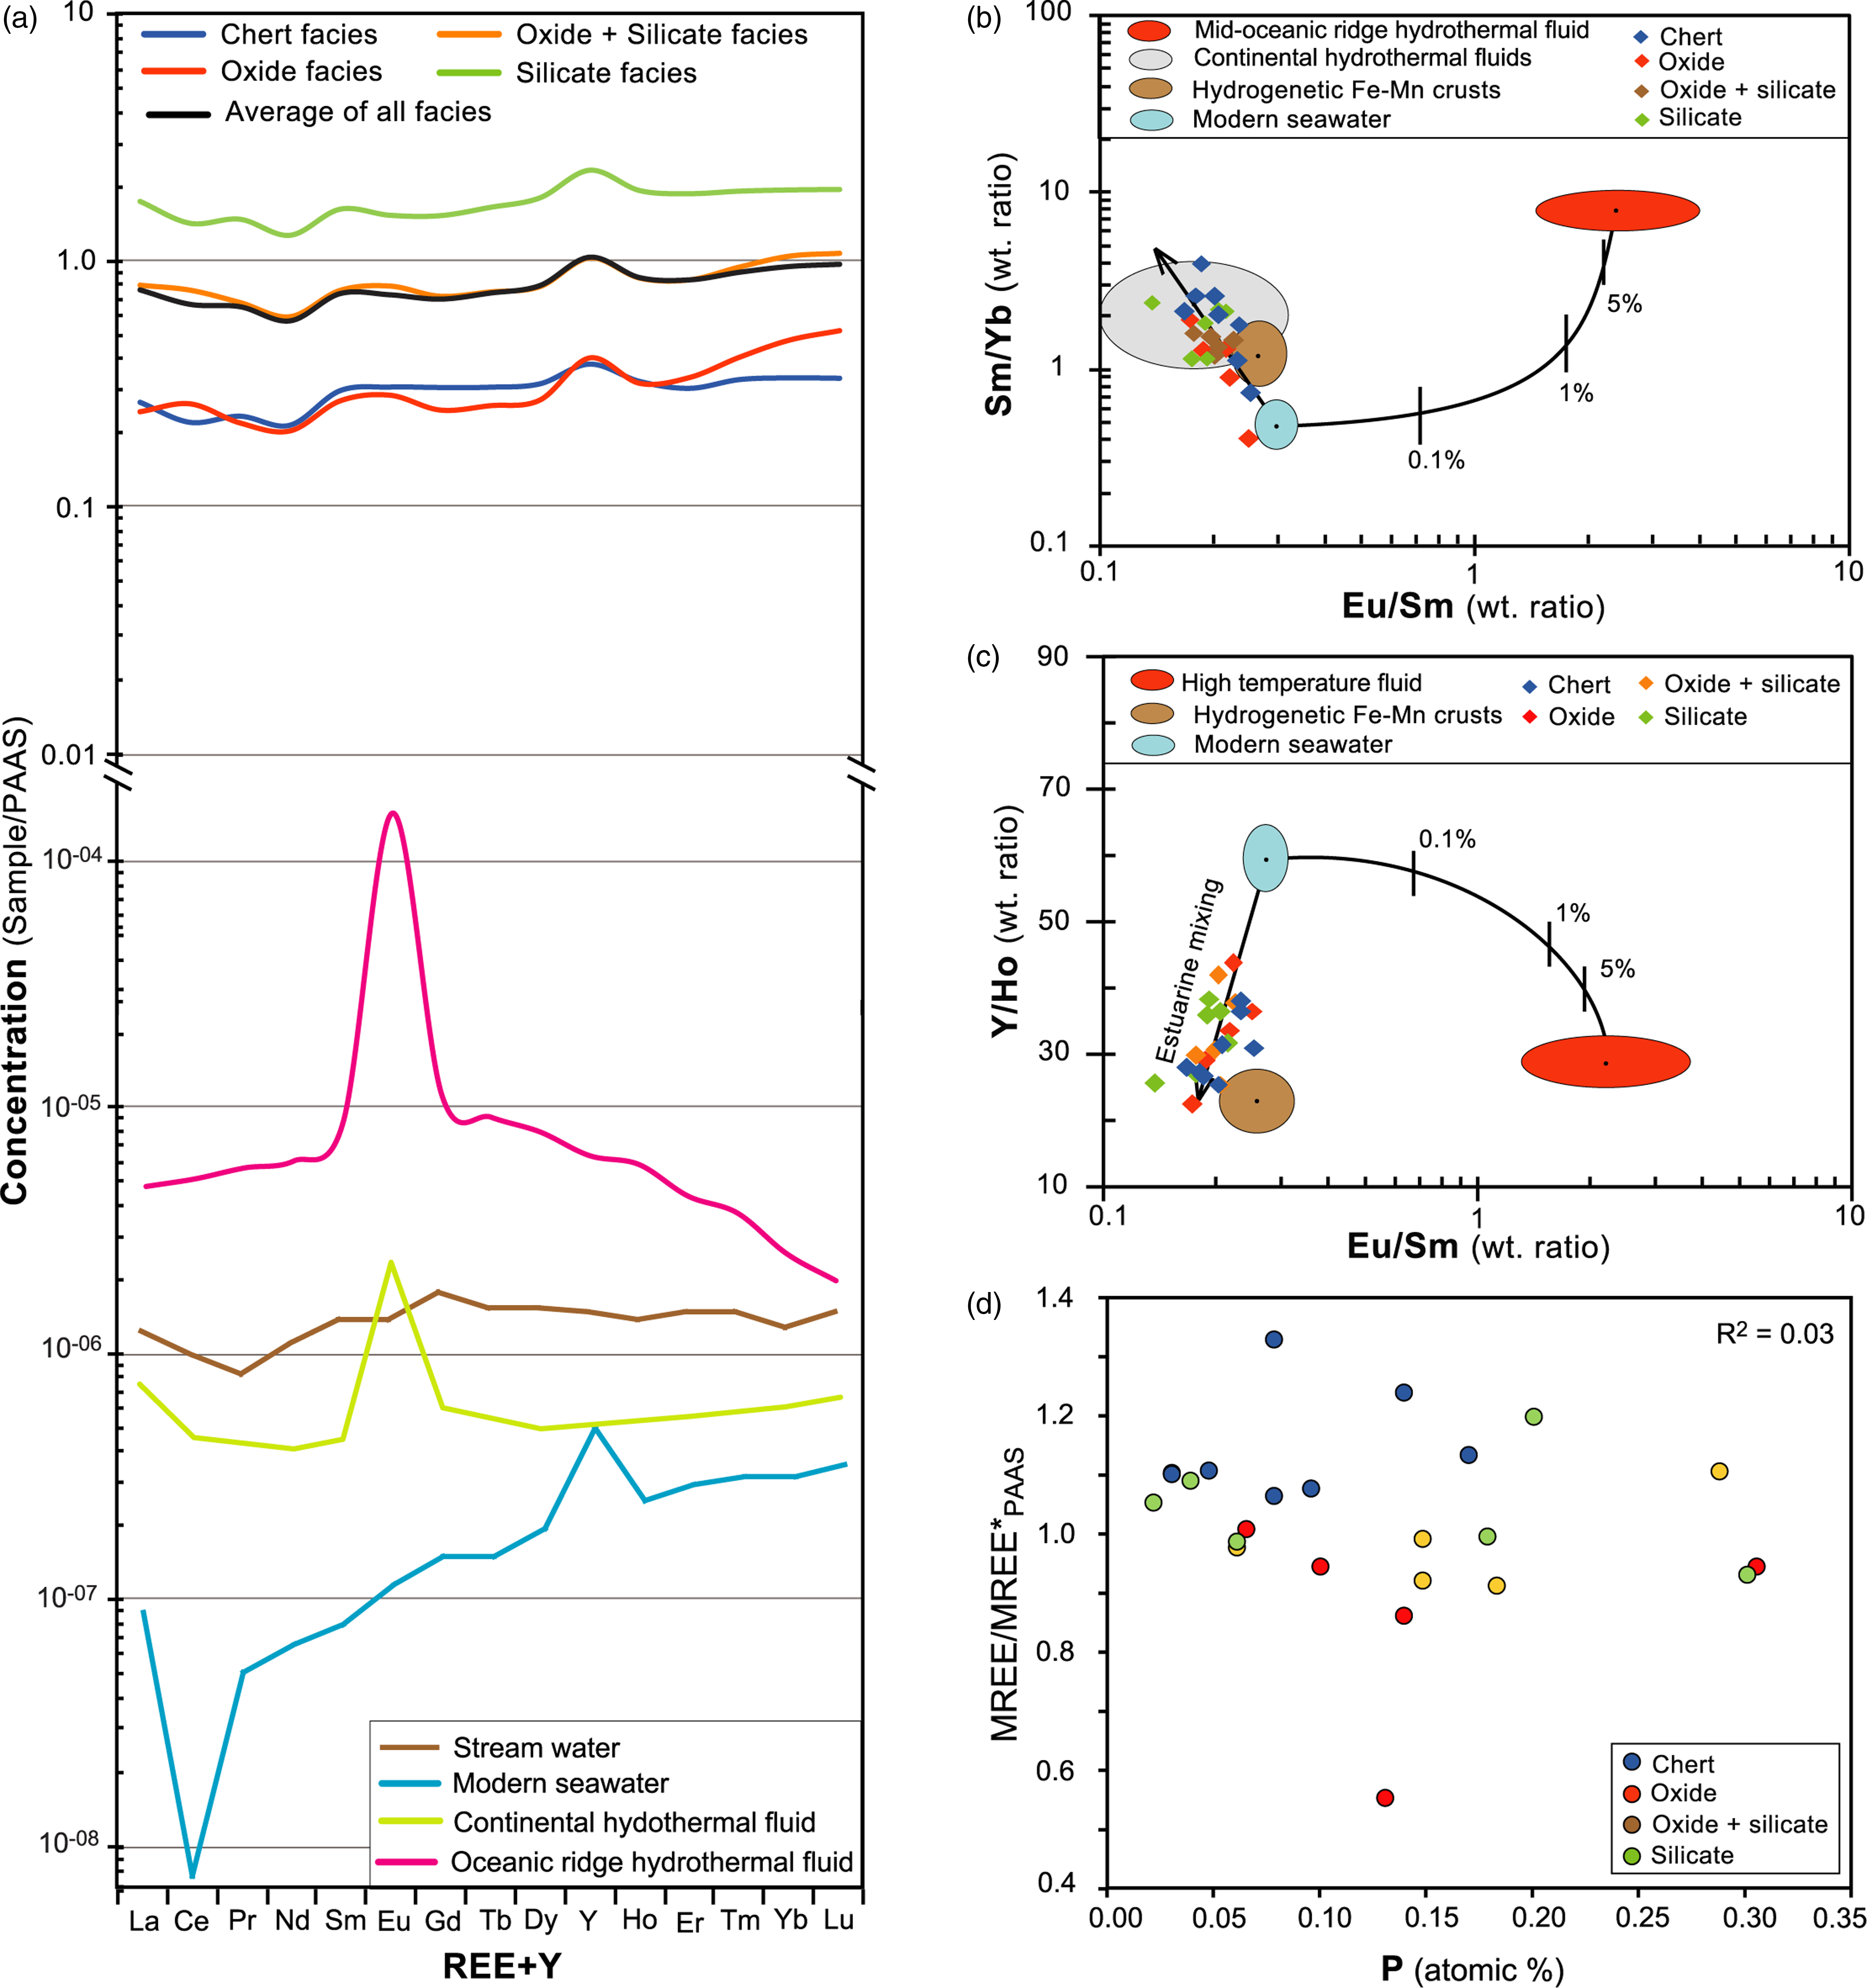
The diagenesis can modify the P/Fe ratio of primary iron-oxyhydroxide precipitates. Under anoxic conditions, microbial reduction of ferric iron can result in the release of phosphorus into porewater, which can be sequestered as authigenic phosphate minerals like francolite. Additionally, the recycling of Fe2+ into seawater can transport seawater phosphorus into sediments, leading to an increase in the P/Fe ratio of bulk samples due to repeated absorption of seawater phosphorus during iron redox cycles (Ruttenberg & Berner, Reference Ruttenberg and Berner1993; Foellmi, Reference Foellmi1996). The iron redox cycle can promote the precipitation of authigenic phosphate. Diagenetic changes have the potential to alter the phosphorous budget in carbonate and iron-rich rocks and result in enriched MREE, showing a bell-shaped pattern (Mohanty & Mishra, Reference Mohanty and Mishra2023). The average MREE/MREE*PAAS of the studied samples is 1.03 and indicates no MREE anomaly. The MREE/MREE*PAAS has no correlation with P (Figure 4(d)), which corroborates no contribution of diagenesis on phosphate deposition/leaching in the studied samples.
Plots to characterize the environment of deposition of iron-rich rocks of the study area (from Mohanty & Mishra, Reference Mohanty and Mishra2023): (a) PAAS normalized REE+Y patterns of different facies of the studied samples compared with different fluids, (b) ratio plots of Sm/Yb and Eu/Sm to distinguish different mixing trends, (c) ratio plots of Y/Ho and Eu/Sm to identify fluid mixing patterns, and (d) cross-plot of PAAS normalized MREE enrichment and P to evaluate the effect of diagenesis on phosphate deposition/leaching. The fields of modern seawater and high-temperature hydrothermal fluids and the mixing curve with the estimated proportion of mixing are adopted from Alexander et al. (Reference Alexander, Bau, Andersson and Dulski2008).

5.b.4. Palaeo-productivity
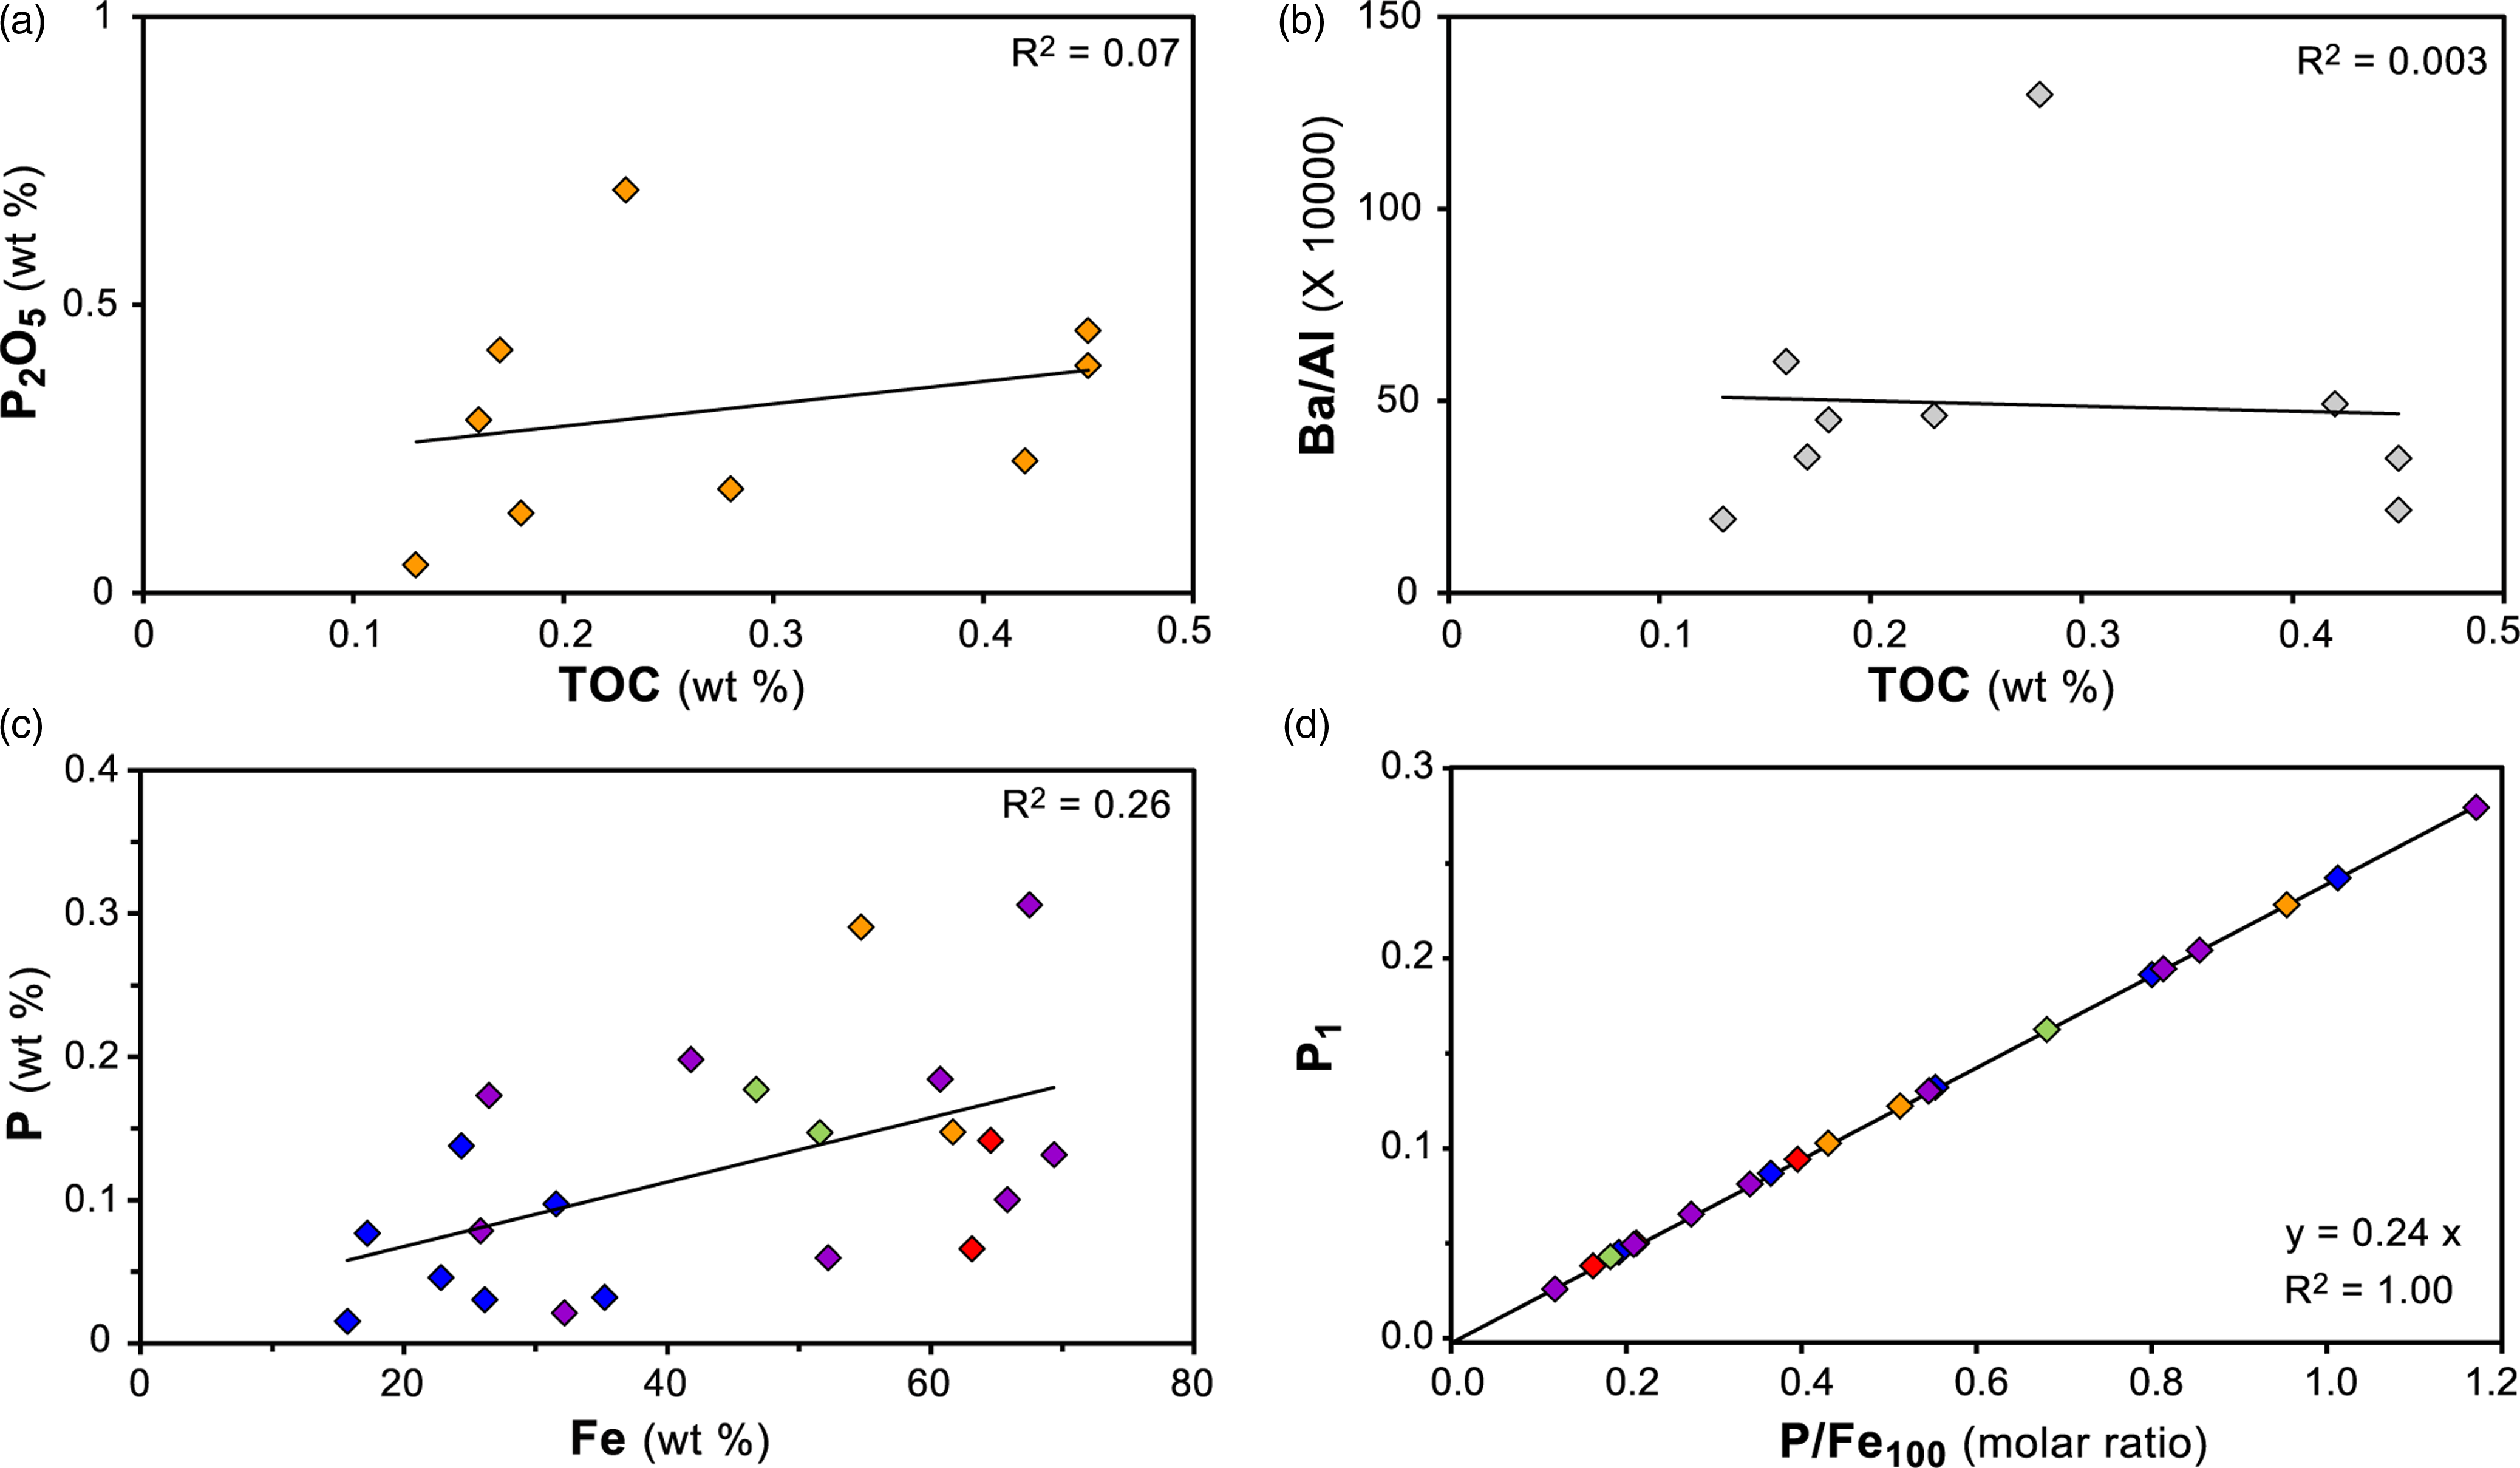
The samples analysed in this study show P2O5 contents ranging from 0.05 % to 0.7 % (average 0.29 %). The average value is slightly higher than the UCC value of 0.15 % (McLennan, Reference McLennan2001), which imply a low concentration of nutrient elements in the basin of deposition and this implies low primary productivity in the samples. The content of Ba and Ba/Al is commonly used as proxies for assessing palaeo-productivity (Dean et al. Reference Dean, Gardner and Piper1997). The value of Ba in Chilpi samples varies from 9.06 to 519.28 ppm (average 107.44 ppm), and the Ba/Al value has a range of 3.55 – 129.71 ppm/% (average 36.04 ppm/%); both values are much lower than the UCC values of 550 ppm and 67.46 ppm/%, respectively. The samples analysed in this study do not exhibit any correlation between TOC and P2O5 as well as TOC and Ba/Al values (Figure 5(a), 5(b)). This observation suggests that the palaeo-productivity had no impact on the organic matter content in the studied samples. The Ba and Ba/Al results indicate a low productivity during the sedimentation of the late Palaeoproterozoic Chilpi Group. Redox conditions play a vital role in the preservation and accumulation of organic matter (Jones & Manning, Reference Jones and Manning1994; Chang et al. Reference Chang, Chu, Feng, Hu and Zhang2009; Tang et al. Reference Tang, Song, Pang, Jiang, Guo, Zhang, Pan and Jiang2020). Good correlation between P1 and P/Fe100 molar ratio and a low correlation between P and Fe content indicate Fe-redox as a contributory factor for P enrichment (Figure 5(c), 5(d)). The limited enrichment of organic matter in the studied samples indicates limited microbial iron reduction, and consequently, decrease in the P/Fe ratio because of higher mobility of Fe than P during late-stage diagenesis (Webb et al. Reference Webb, Dickens and Oliver2003).
Cross-plots showing the relationship between (a) P2O5 and TOC, (b) Ba/Al ratio and TOC, (c) P and Fe and (d) P1 and P/Fe100 molar ratio. Purple coloured markers in (c) and (d) are used for 9 samples having TOC data and other coloured markers represent different iron-rich facies having same annotation as in Figure 4. Negligible correlations suggest no effect of the organic matter on the palaeo-productivity indices in the Chilpi Group. Good correlation between P1 and P/Fe100 molar ratio and a low correlation between P and Fe content indicate Fe-redox as a contributory factor for P enrichment.

5.b.5. Mixing of hydrothermal fluids
Ferrous iron in hydrothermal fluids can be oxidized to form ferric oxyhydroxide which may scavenge or remove phosphorus from seawater (Wheat et al. Reference Wheat, Feely and Mottl1996). This process results in lowering the concentration of phosphorus both in hydrothermally influenced seawater and hydrothermal fluids (Ruttenberg, Reference Ruttenberg2003). To examine the possible impact of hydrothermal activity, we evaluated the rare earth element (REE) compositions of the BIF samples (Figure 4). The PAAS normalized samples of the Chilpi BIFs show LREE depletion, and positive La, Gd and Y anomalies similar to the seawater pattern. A weak positive Eu anomaly (0.77 – 1.24; average Eu/Eu*PASS = 1.02) in the studied samples is similar to continental hydrothermal fluids, and other Palaeoproterozoic BIFs (Konhauser et al. Reference Konhauser, Planavsky, Hardisty, Robbins, Warchola, Haugaard, Lalonde, Partin, Oonk, Tsikos and Lyons2017 and references therein), and could be a result of possible mixing of hydrothermal fluid with the seawater (Halverson et al. Reference Halverson, Poitrasson, Hoffman, Nédélec, Montel and Kirby2011). We utilized the Eu/Sm vs. Sm/Yb ratio plot (Alexander et al. Reference Alexander, Bau, Andersson and Dulski2008) to evaluate the potential sources of the positive Eu anomaly, which can also arise in a reducing ocean environment (Mishra & Mohanty, Reference Mishra and Mohanty2021). It is noted that our samples fall opposite to the mixing line for seawater and high-temperature hydrothermal fluids (Figure 4(b) 4(c)). The analysis reveals < 0.1 % contribution of hydrothermal fluids towards the low P/Fe ratio observed in the Chilpi BIF.
5.b.6. Mineral-specific analysis
The positive correlation between iron and phosphorus concentrations in the bulk rock is suitable for the calculation of phosphorus concentration in the seawater (Planavsky et al. Reference Planavsky, Rouxel, Bekker, Lalonde, Konhauser, Reinhard and Lyons2010; Li et al. Reference Li, Lang, Ma, Cui, Pei and Shen2020). However, the correlation between iron and phosphorus concentrations in the bulk rock might result from detrital apatite grains in the matrix of BIFs, which requires implementation of fabric-specific P/Fe ratio analysis in iron oxide-rich chemical sediments (Tang et al. Reference Tang, Xie, Shi and Zhou2022). In our study, both the bulk rock concentration and fabric-specific EPMA spot analysis of hematite-magnetite grains to avoid the influence of phosphorous-rich minerals were evaluated to compare the difference of P/Fe molar ratio, if any, between the two methods. The bulk rock P/Fe molar ratio ranges from 0.11 to 1.17 with an average value of 0.51 ± 0.3 (Table 1) and the fabric-specific spot analysis has average molar P/Fe ratio of 0.32 ± 0.4 (n = 40; Table 2). Considerably similar and low values of phosphorus and positive correlation between iron and phosphorus concentrations are obtained in the EPMA spot analysis and the bulk rock analysis. These result indicate a minimal diagenetic contribution of P, and the samples are suitable for the evaluation of the phosphorous concentration in the late Palaeoproterozoic shallow seawater.
6. Discussion
6.a. Seawater phosphorus concentration of the Chilpi BIF
The P/Fe ratios (0.51 ± 0.3) of the Chilpi BIF samples are at a slightly higher side than some of the coeval BIFs from other localities (Table 3; Bjerrum & Canfield, Reference Bjerrum and Canfield2002; Planavsky et al. Reference Planavsky, Rouxel, Bekker, Lalonde, Konhauser, Reinhard and Lyons2010; Tang et al. Reference Tang, Xie, Shi and Zhou2022). The dissimilar values of P/Fe ratio in seawater in different sections can be attributed to several factors, and one possible explanation is the heterogeneous silica concentration. Silica present in seawater competes with phosphorus for the adsorption site in iron-oxyhydroxides, which can lead to decreased efficacy of phosphorus adsorption (Konhauser et al. Reference Konhauser, Lalonde, Amskold and Holland2007). As a result, areas with high seawater Si concentration may exhibit lower P/Fe ratios.
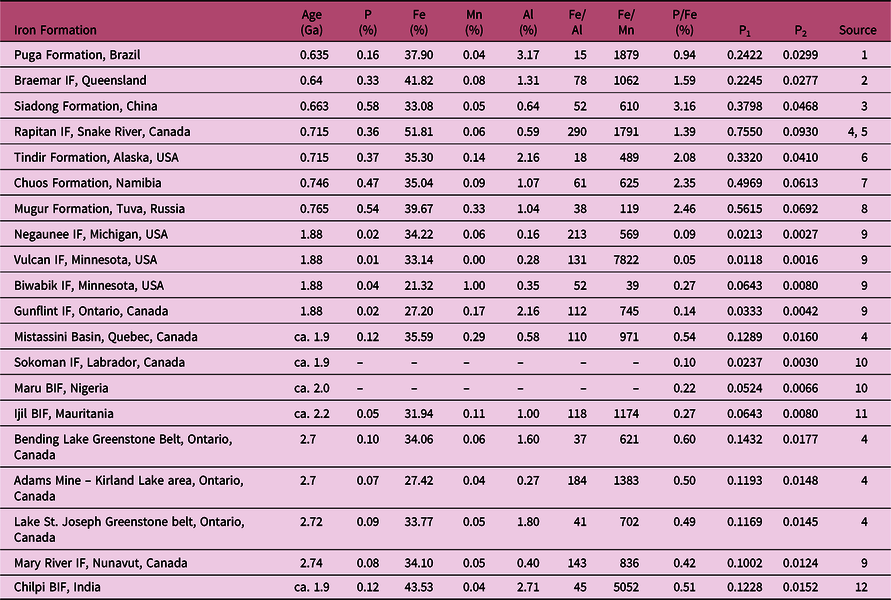
Bulk rock major element composition of some of the worldwide BIF deposits of Archean and Proterozoic Eons, considered for calculation of phosphorus concentration. P1 = P concentration (μM) at a [Si] = 0.67 mM; P2 = P concentration (μM) at a [Si] = 0 mM

Data source: 1 – Piacentini, Reference Piacentini2008; 2 – Lottermoser & Ashley, Reference Lottermoser and Ashley1999; 3 – Jiafu et al. Reference Jiafu, Heqin and Zhioiu1987; 4 – Gross, Reference Gross2009; 5 – Klein & Beukes, Reference Klein and Beukes1993; 6 – Young, Reference Young1982; 7 – Breitkopf, Reference Breitkopf1988; 8 – Ilyin & Moralev, Reference Ilyin and Moralev1958; 9 – Planavsky et al. Reference Planavsky, Rouxel, Bekker, Lalonde, Konhauser, Reinhard and Lyons2010; 10 – Bjerrum & Canfield, Reference Bjerrum and Canfield2002; 11 – Bronner et al. Reference Bronner, Chauvel and Triboulet1992; and 12 – This study.
Accurate estimation of concentration of silica dissolved in seawater during Precambrian is necessary for calculation of phosphorus concentration. Earlier assessments have relied on petrographic characterization and thermodynamic modelling of BIFs and iron oxide-rich sediments (Siever, Reference Siever1992; Planavsky et al. Reference Planavsky, Rouxel, Bekker, Lalonde, Konhauser, Reinhard and Lyons2010; Jones et al. Reference Jones, Nomosatryo, Crowe, Bjerrum and Canfield2015). Silica precipitation in seawater column during the Precambrian is estimated to be close to the amorphous silica saturation level of ∼2.2 mM (Planavsky et al. Reference Planavsky, Rouxel, Bekker, Lalonde, Konhauser, Reinhard and Lyons2010). The rate and manner of silica precipitation during early diagenesis and the features of silica absorption and adsorption on clay and zeolite minerals can be inferred from the concentrations of silica saturation, very similar to that of the silicon dioxide polymorph cristobalite (∼0.67 mM) (Siever, Reference Siever1992; Planavsky et al. Reference Planavsky, Rouxel, Bekker, Lalonde, Konhauser, Reinhard and Lyons2010). Silica sorption tests have indicated that the degree of silica absorption and adsorption onto the surface of iron oxides is dependent on the concentrations of silica present in the seawater (Jones et al. Reference Jones, Nomosatryo, Crowe, Bjerrum and Canfield2015). Therefore, the Si/Fe ratio of Precambrian BIFs and iron oxide-rich chemical sediments can be utilized as a proxy to evaluate the concentration of silica in ancient seawater.
The Si/Fe ratios of Precambrian BIF provide an estimated range of 0.6 – 1.5 mM of dissolved silica concentrations in seawater (Jones et al. Reference Jones, Nomosatryo, Crowe, Bjerrum and Canfield2015). The Si concentration in seawater might have been less than 0.1 mM towards the end of Palaeoproterozoic Era (Tang et al. Reference Tang, Xie, Shi and Zhou2022). In the absence of silica-rich authigenic minerals in the granular BIF of Yunmengshan deposit, a fairly low concentration of Si (possibly < 0.67 mM) has been proposed for terminal Palaeoproterozoic shallow seawater (Qiu et al. Reference Qiu, Zhao and Li2020). We have used a range of 0 – 0.67 mM, corresponding to the lowest and highest values of silica concentration, to reconstruct phosphorus concentrations at the late Palaeoproterozoic shallow seawater, similar to the approach followed by Tang et al. (Reference Tang, Xie, Shi and Zhou2022).
Based on experiments, Ca2+ and Mg2+ ion concentrations in seawater during the Archaean and Proterozoic Eons (up to ∼1650 Ma) were suggested to be similar to those of recent seawater (Jones et al. Reference Jones, Nomosatryo, Crowe, Bjerrum and Canfield2015; Tang et al. Reference Tang, Xie, Shi and Zhou2022). Considering this information and the inferred silica concentrations between 0 and 0.67 mM, a very low dissolved phosphorus concentration (below 0.01–0.12 μM) would be anticipated in the BIF of the Chilpi Group (Table 1; cf. Jones et al. Reference Jones, Nomosatryo, Crowe, Bjerrum and Canfield2015).
Half of the absorbed phosphorus (∼ 50 %) possibly comes back to the overlying seawater during early diagenesis, which could decrease the Pd value up to a factor of 2 (Jones et al. Reference Jones, Nomosatryo, Crowe, Bjerrum and Canfield2015). However, this release is expected to be negligible in mid-Proterozoic seawater with low-sulphate concentrations (Poulton & Canfield, Reference Poulton and Canfield2006; Luo et al. Reference Luo, Ono, Huang, Algeo, Li, Zhou, Robinson, Lyons and Xie2015). Low-sulphate reducing (anoxic non-sulphidic) environment of the shallow sea towards the late Palaeoproterozoic has been previously recognized from the Chilpi Group (Mishra & Mohanty, Reference Mishra and Mohanty2021; Mohanty & Mishra, Reference Mohanty and Mishra2023). This is indicative of minimal diagenetic effects (discussed earlier in the section 5.2) and a minimum Pd release. Therefore, during the deposition of the Chilpi BIF, the seawater phosphorus concentrations were possibly lower than those in the modern deep ocean having average phosphorous concentration of ∼2.3 μM (Jones et al. Reference Jones, Nomosatryo, Crowe, Bjerrum and Canfield2015).
The bulk rock P/Fe molar ratio of the Chilpi BIFs ranges between 0.11 and 1.17 (average of 0.51 ± 0.3; Table 1), and the spot analysis average molar P/Fe ratio is 0.32 ± 0.4 (Table 2). The bulk rock average molar P/Fe value (0.51 ± 0.3) indicates a low shallow marine phosphorus concentration below 0.12 μM for a [Si] = 0.67 mM, and possibly as low as 0.01 μM for a [Si] = 0 mM (Table 1).
6.b. Global correlation of seawater phosphorus concentration
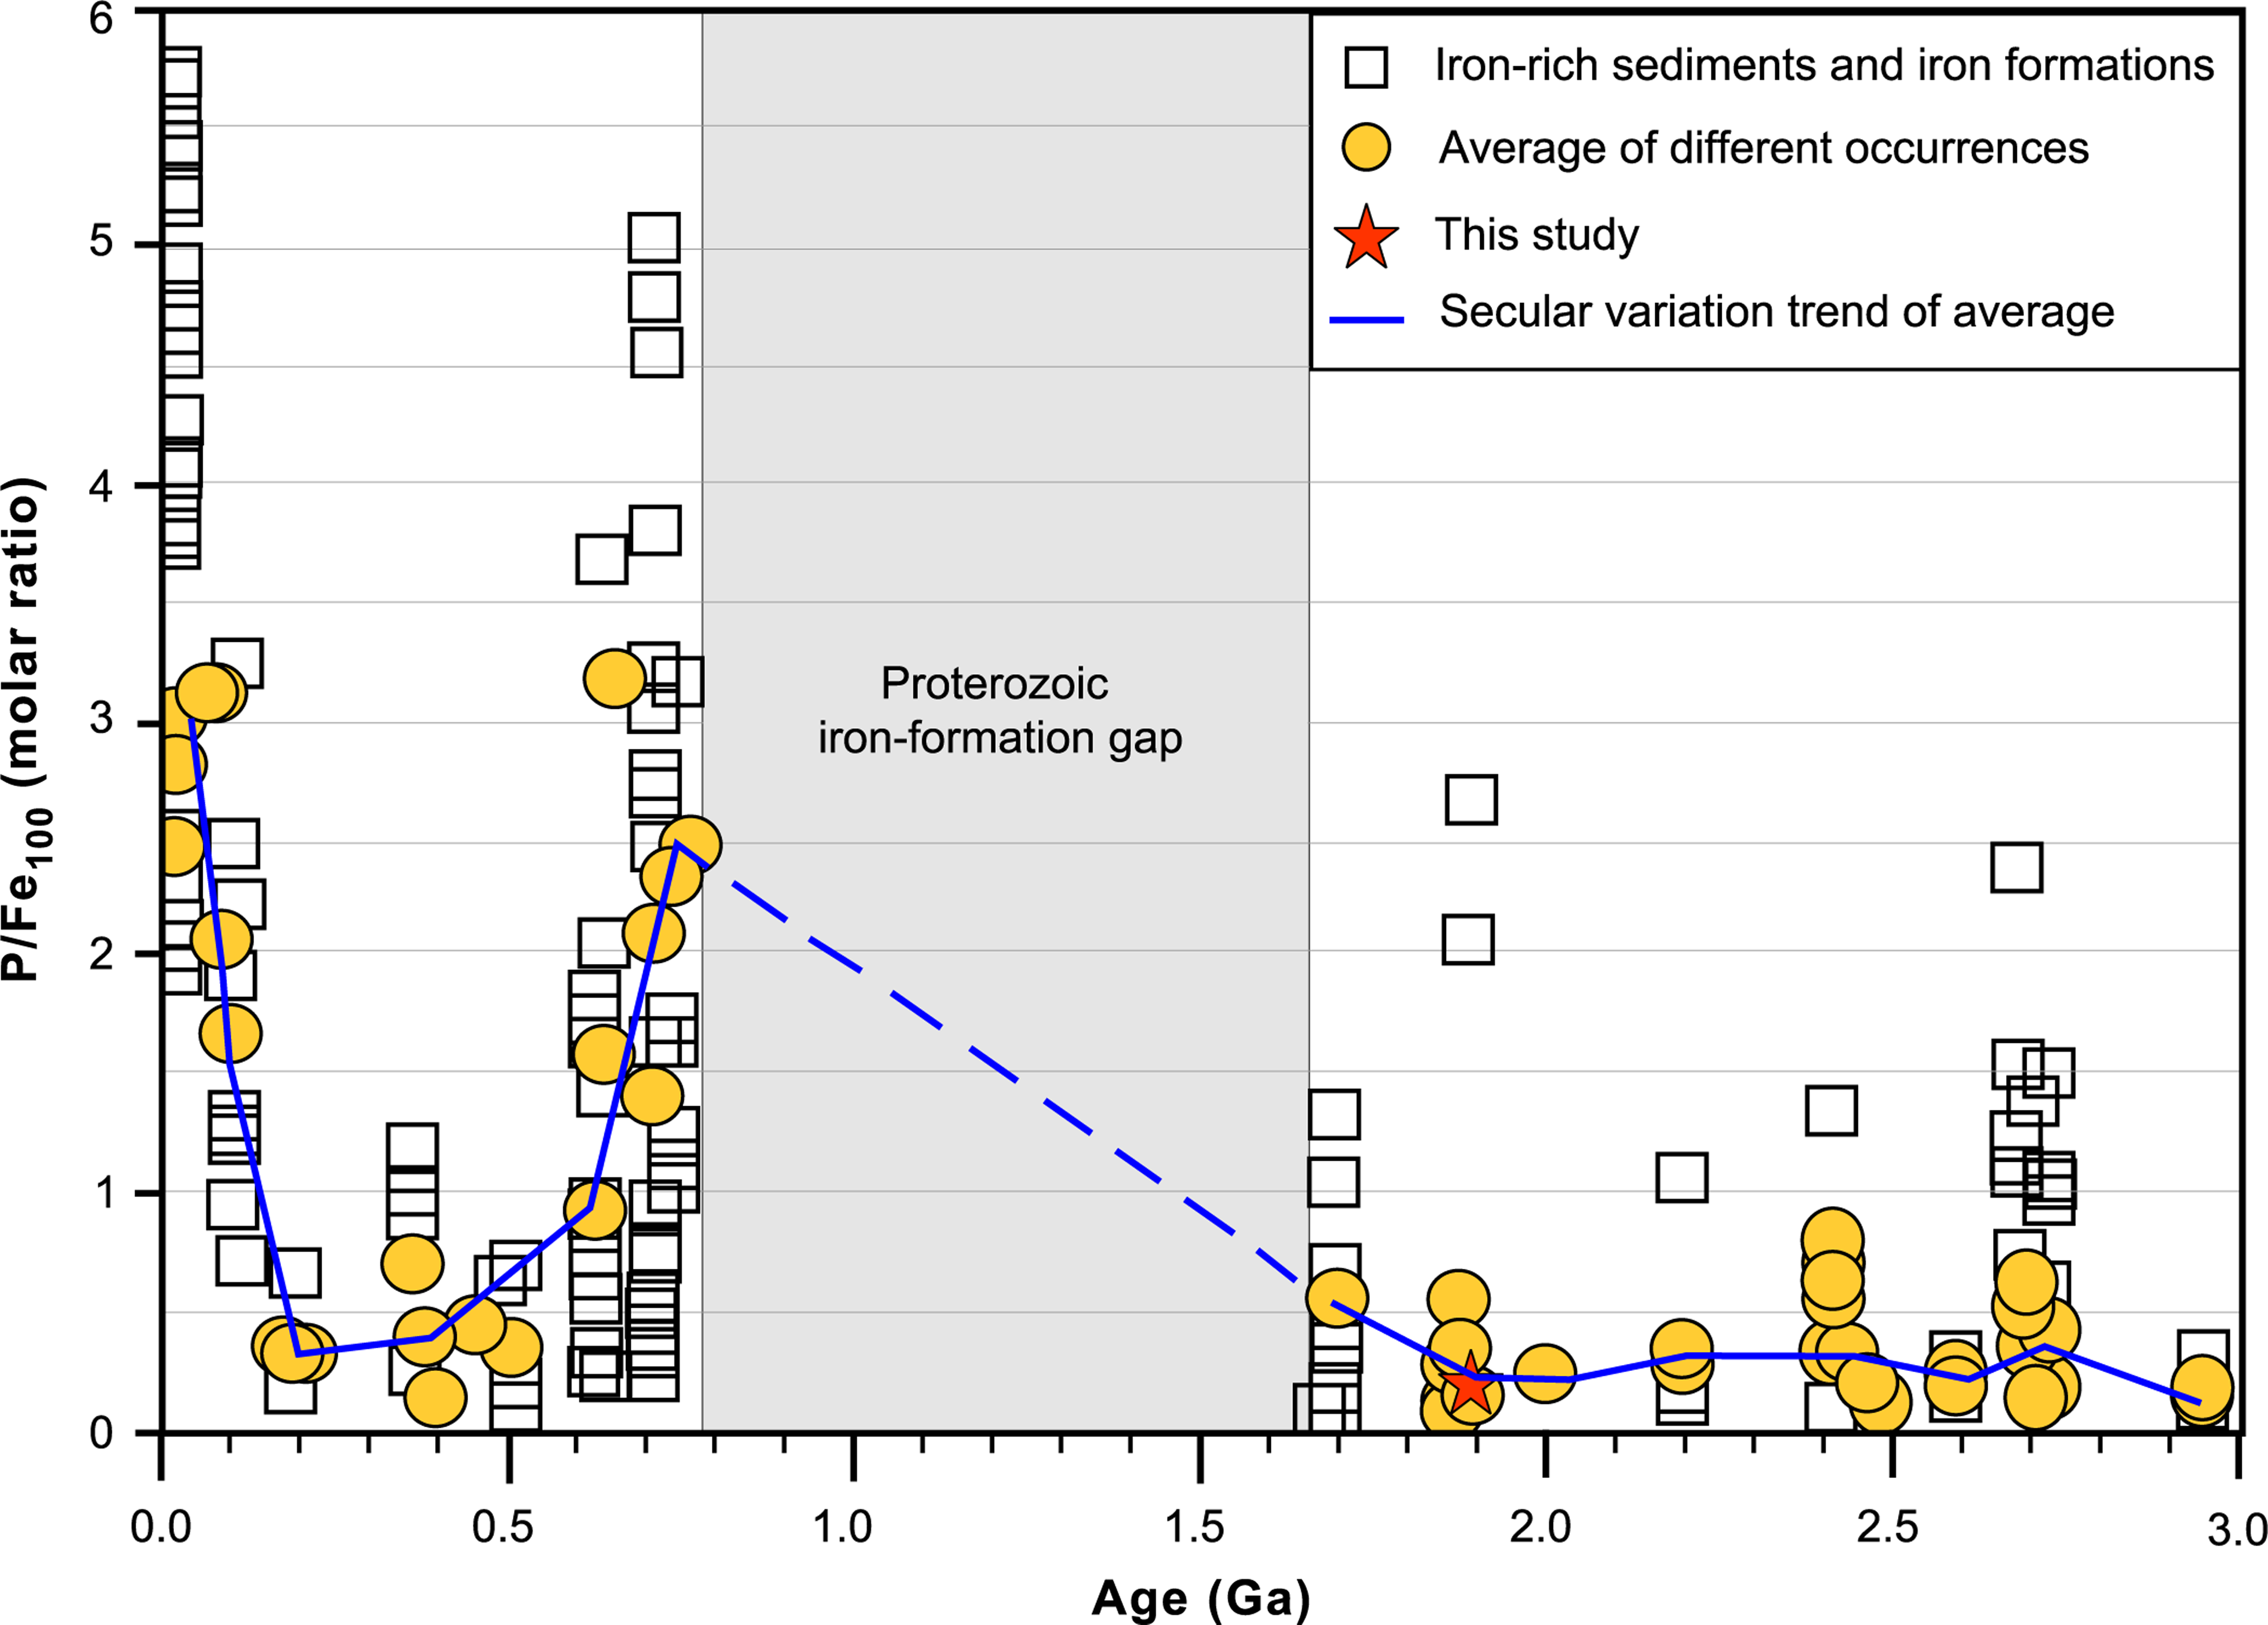
The P/Fe ratios in the late Palaeoproterozoic Chilpi BIF samples are higher compared to some of the iron formations of the same time period (Table 3), such as Negaunee BIF, Vulcan BIF, Biwabik BIF, Gunflint BIF (Planavsky et al. Reference Planavsky, Rouxel, Bekker, Lalonde, Konhauser, Reinhard and Lyons2010); Sokoman BIF, Maru BIF (Adekoya, Reference Adekoya1998; Bjerrum & Canfield, Reference Bjerrum and Canfield2002); Ijil BIF (Bronner et al. Reference Bronner, Chauvel and Triboulet1992) and Mistassini Basin BIF (Gross, Reference Gross2009). On the other hand, the P/Fe ratios of studied samples are almost equal to the ratios in some of the iron formations of the Archaean Eon (e.g. Bending Lake Greenstone Belt IF, Adams Mine Iron-Kirland Lake area IF, Lake St. Joseph Greenstone belt IF and Mary River IF (Gross, Reference Gross2009). Neoproterozoic BIFs have much higher P/Fe ratios than Chilpi BIF (Table 3). Secular variation of molar P/Fe ratios of iron-rich distal hydrothermal deposits and other BIFs (Figure 6) indicates a low level of seawater phosphorus concentration towards the late Palaeoproterozoic Era. These variations show a nearly equal average values for Archean and Palaeoproterozoic BIFs which are lower than the Neoproterozoic BIFs. A lower average value is also found in Palaeozoic and Mesozoic periods, when BIFs are absent and iron-rich deposits are characterized by oolitic deposits. Such changes might have been influenced by other factors, such as variations in the input of organic matter, fluctuations in the redox conditions of the seawater column, the presence of different mineral phases and consumption of P by different organisms for their growth process. Furthermore, the interaction between Si and Fe can be complex, and the impact of Si on phosphorus adsorption can depend on the specific mineralogical composition of the iron-oxyhydroxides present in a given locality.
Secular variation of P/Fe molar ratio normalized as percentage of iron (data adopted from Planavsky et al. Reference Planavsky, Rouxel, Bekker, Lalonde, Konhauser, Reinhard and Lyons2010; Tang et al. Reference Tang, Xie, Shi and Zhou2022 and references therein; Table 3), showing the position of the iron-rich rock samples of the Chilpi Group and secular trend (this work).

Phosphorus is an essential nutrient for primary productivity, and its availability has been a key factor affecting oxygen levels in the Earth’s atmosphere over geological time (Kipp & Stüeken, Reference Kipp and Stüeken2017; Reinhard et al. Reference Reinhard, Planavsky, Gill, Ozaki, Robbins, Lyons, Fischer, Wang, Cole and Konhauser2017; Canfield et al. Reference Canfield, Bjerrum, Zhang, Wang and Wang2020; Guilbaud et al. Reference Guilbaud, Poulton, Thompson, Husband, Zhu, Zhou, Shields and Lenton2020). The P/Fe values observed in the Chilpi BIF are similar to those estimated for older deep seawaters and lower than those for Phanerozoic shallow seawaters (Planavsky et al. Reference Planavsky, Rouxel, Bekker, Lalonde, Konhauser, Reinhard and Lyons2010; Rudmin et al. Reference Rudmin, Mazurov and Banerjee2019; Tang et al. Reference Tang, Xie, Shi and Zhou2022). If mid-Proterozoic shallow seawaters had persistently low concentrations of phosphorus, it could have led to a reduction in primary productivity (Crockford et al. Reference Crockford, Hayles, Bao, Planavsky, Bekker, Fralick, Halverson, Bui, Peng and Wing2018; Shi et al. Reference Shi, Shi, Tang, Fan, Wei and Li2021). This, in turn, could have resulted in a low burial of organic matter and potentially low levels of atmospheric oxygen during the mid-Proterozoic (Planavsky et al. Reference Planavsky, Reinhard, Wang, Thomson, McGoldrick, Rainbird, Johnson, Fischer and Lyons2014).
The sulphur (S) content of the studied samples varies between 0.01 and 0.31 % (average of 0.08 %), much lower than a typical euxinic condition (Yang et al. Reference Yang, Zhang, Wu, Li, Peng and Qin2010). A suboxic to anoxic condition of shallow sea with an oxygen level equivalent to 10-3 to 10-5 times the present atmospheric level (PAL) was reported for the BIF horizons in the lower part of the Chilpi Group (Mohanty & Mishra, Reference Mohanty and Mishra2023) and 10-3 PAL for the carbonates in the upper part of the succession (Mishra & Mohanty, Reference Mishra and Mohanty2021).
Generally, in modern iron oxide-rich chemical sediments the P/Fe ratios typically remain constant or decrease during early diagenesis. However, in Precambrian iron oxide-rich rocks, the P/Fe ratios do not show a consistent diagenetic trend, but rather appear to reflect changes in marine phosphate concentrations (Poulton & Canfield, Reference Poulton and Canfield2006). Based on available evidence, it appears that microbially driven ferric iron reduction is unlikely to increase P/Fe ratios in sediments. Rather, the anoxic environment in the basin of deposition played a significant role in the formation of the BIFs and low productivity in the basin (Li et al. Reference Li, Lang, Ma, Cui, Pei and Shen2020; Khaled et al. Reference Khaled, Li, Xi, Zhao, Wu, Yu, Zhang and Li2022). Therefore, the availability of phosphorus in the Chilpi Group of India may be linked to Archaean style of depositional conditions and precipitation of precursor greenalite materials associated with the BIF (cf. Rasmussen et al. Reference Rasmussen, Muhling, Suvorova and Fischer2021).
It is possible that the combination of low phosphorus concentration and anoxic environments during the mid-Proterozoic may have hindered the evolution and growth of eukaryotes, as phosphorus is an indispensable element for sustenance and growth of life (Shi et al. Reference Shi, Shi, Tang, Fan, Wei and Li2021). In addition, the availability of phosphorus has played a critical role in the evolution of oxygenic photosynthesis, contributing towards the evolution of the Earth’s oxygen. Without sufficient phosphorus, photosynthetic organisms could not produce enough oxygen to support aerobic life. With limited access to this essential nutrient, the growth and development of eukaryotes could have been stunted. Considering the fact that the phosphorus concentration shows high heterogeneity (Benitez-Nelson, Reference Benitez-Nelson2000; Li et al. Reference Li, Lang, Ma, Cui, Pei and Shen2020) and the Chilpi basin was very small more research is required to further ascertain the atmospheric condition and P concentration towards the late Palaeoproterozoic shallow seawater.
7. Conclusions
This study encompasses the molar P/Fe ratios of banded iron formation from the Chilpi Group, Bastar Craton, Central India. The bulk rock P/Fe molar ratio of the Chilpi BIF varies between 0.11 and 1.17 with an average of 0.51 ± 0.3 and EPMA spot analysis of P/Fe molar ratio in iron oxide phases is 0.32 ± 0.4. The low P/Fe molar ratio observed in the samples cannot be ascribed to contamination from terrestrial input, diagenetic alterations or high-temperature hydrothermal fluids; the low ratio provides indication for phosphorus-lean seawater having suboxic to anoxic (non-euxinic) conditions with low atmospheric oxygen level similar to that of Archaean Era. A combined analysis of the P/Fe ratio from other areas is indicative of low concentration (< 0.12 μM) of phosphorus in the shallow marine environment of the Chilpi Group. This study bolsters the idea that the low level of phosphorus concentrations in seawater during the late Palaeoproterozoic Era was a consequence of the low primary production resulting from the low level of atmospheric oxygen, which might have impeded the evolution of eukaryotes.
Acknowledgements
The authors would like to thank the Director, Indian Institute of Technology (Indian School of Mines), Dhanbad for providing necessary facilities. Director, CSIR-National Geophysical Research Institute, Hyderabad, is also acknowledged for providing laboratory help in geochemical analysis. The authors would like to thank Dr. R. M. Pradhan for XRD analysis. PKM thankfully acknowledges the help extended by Annapurna Satpathy during the preparation of the manuscript.
Authorship contribution
Prasanta Kumar Mishra: Conceptualization, Investigation, Formal analysis, Validation, Visualization, Writing – original draft. Sarada Prasad Mohanty: Conceptualization, Validation, Visualization, Writing – review & editing, Supervision. Debadutta Mohanty: Investigation, Formal analysis. Mrinal Kanti Mukherjee: Conceptualization, Writing – review & editing, Supervision.
Competing interests
We declare no conflict of interest with anyone.

 Open access