

In principle, we should measure what we value, yet the reality is often the opposite – we value what we can measure. Perhaps nowhere is this statement truer than in the study of corruption, which is inherently difficult to gauge and quantify. Our understanding of corruption and its relationship to economic prosperity has been profoundly shaped by the way it is conventionally measured – as a one-dimensional problem.
Standard indices of corruption assign a single score to each country and rank them annually. These indices are hugely influential, especially the Corruption Perception Index (CPI), which is produced by Transparency International (TI).Footnote 1 The media covers the release of CPI like a pageant, praising the countries on top and chastising those which lag behind. Multinational companies rely on the CPI to gauge risks when investing in foreign countries.Footnote 2 Researchers deploy it in statistical analyses to test the impact of corruption on investment and growth.Footnote 3 And China observers cite the CPI liberally when assessing the country.Footnote 4
But measuring corruption on a single scale is misleading. First, these indices do not distinguish among qualitatively different types of corruption. For instance, taking cash bribes, stealing public funds, and placing family members on corporate boards are all examples of corruption, but of different kinds with vastly different consequences.
Second, conventional measures predominantly capture the obviously illegal forms of corruption that afflict the poorest countries, such as bribery and outright looting of state assets.Footnote 5 Meanwhile, transactional corruption among the rich and the powerful, which is more cleverly disguised, even legitimized, in wealthier states, tends to fall off the radar.Footnote 6 As a result, when researchers plot bundled scores like the CPI with national income, poor countries appear to be riddled with corruption while rich countries look clean.
Unbundling corruption is a necessary first step toward revising assumptions about its relationship to capitalist wealth. While earlier studies have proposed an abundance of corruption typologies,Footnote 7 attempts to measure the different forms are rare, particularly across countries.Footnote 8 In this chapter, I begin to fill this crucial gap. Using a perception-based survey of experts in 15 countries, including China, I measure the four varieties of corruption identified in this book: petty theft, grand theft, speed money, and access money. This survey provides a systematic basis for comparing not only the perceived levels of corruption across countries, but also and more significantly, their varying composition.
Some types of corruption are immediately lethal while others poison over time. In examining the impact of corruption on growth, researchers must first identify what kind of corruption dominates. Although China is reputed to face a mounting crisis of corruption, my survey shows that its structure of corruption is distinct from other notoriously corrupt countries, including Nigeria and Russia. Chinese corruption is dominated by access money, the same type of corruption as in South Korea and the United States.
What Standard Measures Miss
Many hold up the CPI as an authoritative gauge of corruption. Even slight perturbations from year to year are interpreted as if CPI scores were temperature readings on a thermometer. In 2014, when China’s CPI score dropped from 40 to 36, headlines on CNN blared, “China slips down corruption perception index, despite high-profile crackdown.”Footnote 9 Two years later, when China’s score nudged back up to 40, commentators declared that the country’s anti-corruption efforts were paying off.Footnote 10
Despite its wide usage, however, users rarely ask how standard corruption perception scores like the CPI are produced. When I raised this question with my students, most of them guessed that TI conducts original surveys in every country. This would be ideal, but too costly and time-consuming. Instead, TI gathers surveys conducted by third parties (for example, the Economist Intelligence Unit and Political Risks Services Guide) and combines them to construct a single score for each country. In the analogy of sausage-making, the CPI is made from many different meats but none of the meat is produced in-house.Footnote 11
Critics, including the CPI’s creator, Johann Lambsdorff, have pointed to a number of problems with amalgamated corruption indices.Footnote 12 Because the CPI is compiled from third-party surveys, TI has no control over the design or quality of the sources used. Country scores may change from year to year simply because TI selects different sources or the sources themselves have changed. In addition, CPI scores reflect first-world bias. Almost all the surveys TI consults are conducted by Western-based institutions, most of which are business-oriented, such as the Economist Intelligence Unit.Footnote 13 These studies survey first-world business expatriates, who may be predisposed to perceiving foreign low-income countries as corrupt while overlooking influence-peddling back home.
A third problem, not previously noted by critics, is the wording of existing surveys. For instance, the World Competitiveness Yearbook, one of the CPI’s sources in 2016, asked senior business leaders a single terse question:
Bribery and corruption: exist or do not exist.
Other surveys bundle many different types of corruption into an overall score. The Political Risk Services Guide, another CPI source, asked respondents to evaluate a country’s corruption on a scale of 0 to 6 using this paragraph-long guideline, which appears to be the equivalent of rating a forest by roughly averaging all the animals that live within it:
This is an assessment of corruption within the political system. The most common form of corruption met directly by businesses is financial corruption in the form of demands for special payments and bribes connected with import and export licenses, exchange controls, tax assessments, police protection, or loans. The measure is most concerned with actual or potential corruption in the form of excessive patronage, nepotism, job reservations, exchange of favors, secret party funding, and suspiciously close ties between politics and business.
Overly broad wording presents a validity problem: the surveys may not measure what they intend or claim to measure.
Despite the flaws highlighted here, bundled scores such as the CPI and the World Bank’s Control of Corruption Index do provide a convenient metric for comparing perceived levels of corruption across countries every year, which is difficult and expensive to do using in-house surveys. TI also deserves credit for using these indices to push for anti-corruption efforts around the world. My point isn’t that we should discard corruption indices entirely, but that we should interpret and use them mindfully. Furthermore, researchers should strive to improve existing measures, as this study tries to do.
The Unbundled Corruption Index (UCI)
The structure of a country’s corruption – what types dominate and to what degree – may have a larger effect on economic and social outcomes than aggregate levels of corruption. To capture this qualitative variance, we need a different measurement strategy.
To the best of my knowledge, this study presents the first indicator of qualitatively distinct typologies of corruption across countries – what I call the Unbundled Corruption Index (UCI). The UCI is based on an original survey of country experts that measures the perceived prevalence of the four categories of corruption identified in my framework: access money, speed money, grand theft, and petty theft (see Chapter 1 for the theory).
Why Expert Surveys?
Analysts regularly use expert surveys to measure institutional or political contexts at the country level. Examples include the various surveys that comprise the CPI and the World Bank’s World Governance Indicators, Global Integrity’s Africa Integrity Indicators, Varieties of Democracy, and Banerjee and Pande’s study of political corruption. These surveys target experts because individuals who study, report on, or do business in a country are more likely to have a bird’s-eye view of the entire political economy. Citizens’ experiences, by contrast, are usually limited to daily encounters with petty corruption.Footnote 14
My UCI survey, which I conducted in 2017 and 2018, measured responses from these experts: academics with area expertise, journalists, and business leaders and professionals with at least 10 years of experience in a given country. To partially counter the problem of first-world bias in standard business surveys, 45 percent of my expert respondents are natives of the country they scored.
Categories and Countries
Following my framework, my survey unbundles each of four categories into sub-categories for a finer measurement, as listed in Table 2.1. The responses for each sub-category sum to a category score, which add up to the UCI total corruption score. My survey yielded both category-specific and aggregated scores for 15 countries, including China.
| Non-elites | Elites | |
|---|---|---|
| Involves theft | Petty theft | Grand theft |
| Street-level bureaucrats privately pocket illegal fees; extort street vendors for protection money; agencies coerce companies to pay for their services; take group vacations on public funds | Top officials illegally siphon public funds into private accounts; create ghost payroll for family members; illegally keep state-subsidized properties for themselves; executives in state-owned companies collude to embezzle funds | |
| Involves exchanges | Speed money | Access money |
| Citizens pay police bribes to avoid penalties; tips to receive basic medical services; private payments to expedite medical services; small bribes to speed up licensing process; excessive regulations to extract bribes | Businesses directly pay massive bribes for deals; pay for politician’s family expenses for deals; allocate corporate positions to family members of politicians; politicians build clientelist network for indirect bribe-taking; lobbying for favorable regulations; revolving door; loose oversight and bailouts with impunity |
These 15 countries include a mixture of low-income (Bangladesh, Ghana, India, Indonesia, Nigeria), middle-income (Brazil, China, Russia, South Africa, Thailand), and high-income (Japan, Singapore, South Korea, Taiwan, the United States) countries. Following V-Dem, an award-winning expert perception survey of dimensions of democracy across countries,Footnote 15 I consulted a minimum of four country experts for each country.Footnote 16 Six countries, including China, received seven or more expert responses (Appendix: Chapter 2 provides more methodological details.)
Methodological Innovations
My survey features a few methodological innovations. First and foremost, this study directly measures the four distinct categories of corruption that my theory identifies. Although many previous studies advanced typologies of corruption,Footnote 17 none, to my knowledge, measured them across countries.
Second, my survey makes a targeted attempt to measure the elusive category of access money – the purchase of lucrative privileges, both illegal and legal. Bribery and embezzlement are obviously illegal and morally reprehensible, but practices such as moving between leadership positions in the private and public sectors (the revolving door) and regulatory capture through lobbying are more ambiguous. As a result, existing perception surveys usually exclude them. Yet including them is necessary to capture what Lessig calls “institutional corruption.”Footnote 18 My survey makes a first-known empirical effort to bring access money to the surface and capture its wide universe of forms, as listed in Table 2.1.
A third innovation is the use of vignettes to more accurately capture perceptions of corruption. Most surveys ask respondents to assess corruption in broad terms, for example:Footnote 19
Rate: state capture by narrow vested interests.
Are there general abuses of public resources?
Is the government free from excessive bureaucratic regulations, registration requirements, and other controls that increase opportunities for corruption?
Any of these statements can be interpreted in multiple, even conflicting, ways. Respondents are likely to have different definitions or scenarios in mind when asked to evaluate “state capture” or “general abuses of public resources.” Again, this presents a validity problem: vague questions may not measure what they claim to measure.
To improve measurement validity, my survey asks respondents to evaluate corruption using stylized vignettes, designed to be concrete and yet generic enough to represent a class of similar corrupt activities. The vignettes are based on real events reported in scholarly work or the media. For example, inspired by the saga of the Chinese politician Bo Xilai (see Chapter 5), one question captures “crony capitalism” in this way:
By cultivating close ties with a powerful official and paying for his family’s expenses, a businessperson gains monopoly access to public construction projects.
How common do you think this type of scenario is in [country] today?Footnote 20
Another survey question, inspired by the case of Zhou Yongkang – a high-ranking Chinese politician who was netted for corruption in 2014 – is presented in this vignette:
A top politician is linked to an extensive network of former associates, protégés, and/or family members, who monopolize power in certain sectors of the economy. While the politician himself never or rarely accepts bribes, a massive amount of bribes flows through his network.
How common do you think this type of scenario is in [country] today?
A third vignette captures conflict of interest among influential actors who have a foot in government and another in corporations. It is inspired by a New York Times article on “a revolving door between Washington and Wall Street,” which revealed that the chief architects of America’s housing policies were or became heads of lobby groups or big banks.Footnote 21
Major figures move back and forth between the public and private sector, and there are no laws forbidding this practice.
How common do you think this type of scenario is in [country] today?
Previous studies used vignettes to “anchor” respondents with potentially divergent understandings of survey questions.Footnote 22 My vignette-focused survey, while not identical, is also designed to overcome cultural and other biases regarding what constitutes corruption, a perennial challenge in measuring corruption.Footnote 23 As Rose-Ackerman writes, “One person’s bribe is another person’s gift.”Footnote 24 Note that my survey questions do not ask respondents to judge or determine whether a particular scenario is corrupt; I simply ask them to rate how commonly it occurs. Using vignettes ensures that respondents are rating the same scenarios. In this way, my measurement strategy improves coder consistency.
Upgrading Perception Measures
To sum up, my survey design presents a number of advantages over standard measurements (Table 2.2). The most significant difference is that it allows researchers to examine distinct strands of corruption both in isolation and in theoretically relevant bundles, yielding portraits that are simultaneously fine-grained and parsimonious. As my survey will show, two countries with the same CPI scores (for example, China and India) can feature divergent dominant modes of corruption. In addition, this survey captures the elusive category of access money in its varied forms, both legal and illegal. Finally, it improves measurement validity by using vignettes instead of vague descriptors.
Skeptics may contend that perception-based surveys are inherently flawed and should be abandoned because perceived corruption may not align with experiences.Footnote 25 Yet for cross-national comparisons, expert perception-based indices of corruption remain the most widely used and influential measure.Footnote 26 Global indicators such as the CPI determine foreign aid allocation,Footnote 27 guide corporate investment decisions and reform policies, receive widespread media coverage, and affect the image of governments. Thus, improving expert perception measures, regardless of their limitations, has huge impact.
Comparing Bundled and Unbundled Corruption
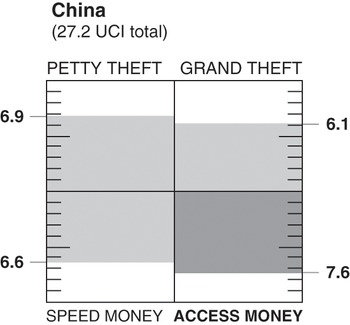
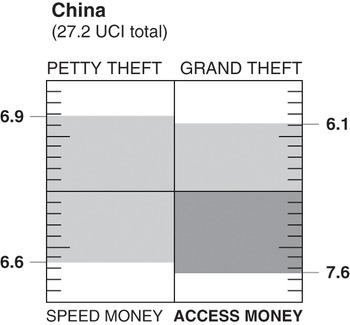
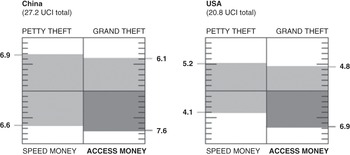
Having introduced my survey method, we may now explore the results. Table A2.1 in the Appendix lists the UCI scores in four typological clusters (petty theft, grand theft, speed money, access money) on a scale of 0 to 10, with 10 indicating the highest perceived level of corruption. The sum of the four categories is the UCI total score, which ranges from 0 to 40. To facilitate analysis, the scores are visualized in a format shown in Figure 2.1, which displays the total UCI score (listed below country name), and the distribution of this aggregate score across four categories. The category that takes up the highest proportion of score is interpreted as the dominant mode, shaded in dark gray.
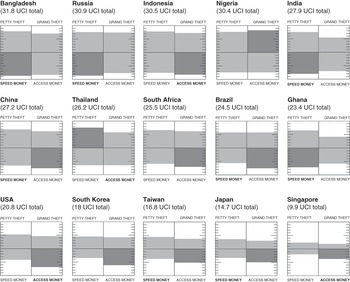
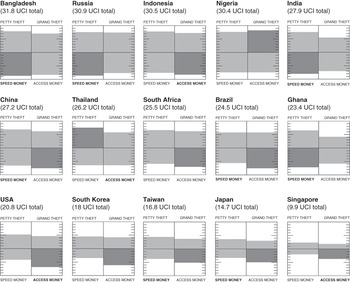
Each country’s total and unbundled scores are visualized in Figure 2.2, from the most to the least corrupt. The overall UCI ranking is consistent with casual observation. The most corrupt country is Bangladesh (No. 1) and the cleanest is Singapore (No. 15). Singapore, Japan, Taiwan, and South Korea, known collectively as the East Asian “developmental” states,Footnote 28 all rank among the least corrupt, followed by the United States. At No. 6, China is perceived as more corrupt than Brazil and South Africa, but less corrupt than Russia, Indonesia, and Nigeria.
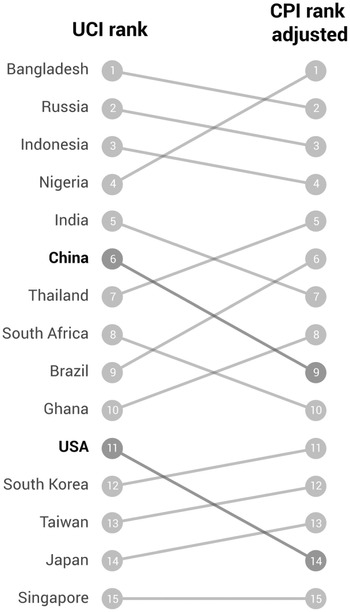
But, on comparing UCI with the countries’ CPI rank in 2017, there are some notable deviations. I find that the ratings and rankings of moderately corrupt countries such as China are more sensitive to different measurement methods than those of countries on the extreme ends. Figure 2.3 compares the two indices, where 1 is the most corrupt and 15 is the least corrupt in both.Footnote 29 At the extremes – the most and least corrupt countries – the rankings are consistent across the UCI and CPI; but there is notably less consistency in the rankings of moderately corrupt countries, including China. For example, according to my survey, China is more corrupt than Thailand, Brazil, and Ghana. But in the CPI, China is ranked as less corrupt than all three countries. The UCI ranks Nigeria as less corrupt than Russia and Indonesia, but in the CPI, it is rated the most corrupt among the 15 countries in my survey.
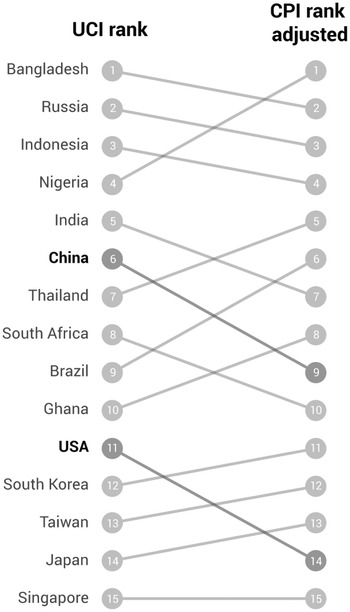
A second divergence is that the CPI rates the United States more favorably than the UCI. As Figure 2.3 shows, according to the CPI, the United States (No. 14) is less corrupt than South Korea (No. 11) and Japan (No. 13). My survey, however, shows the reverse. Why might this be the case? One possibility is cultural bias. The CPI’s sources are predominantly surveys of business expatriates conducted by Western business advisory firms; these respondents may be inclined to view the United States as less corrupt.
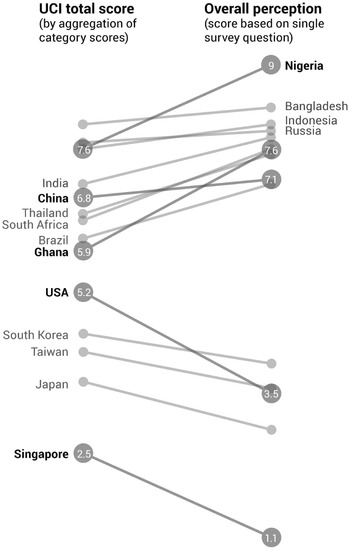
Then I turn to a different pair of comparisons. What if, instead of obtaining the UCI total score by aggregating individual responses from 20 sub-categories, we asked respondents to rate their overall impression of the severity of corruption in a single question. My survey posed this question first: “How do you grade the problem of corruption in [country] today on a scale of 0 to 10, with 10 being most severe?”Footnote 30 This is a commonly asked question in business surveys used to generate the CPI.Footnote 31
Figure 2.4 compares the two methods of scoring: one by the UCI method and the other by asking for a single bundled perception. It indicates that when respondents are asked for their overall impression of corruption, this survey design under-counts forms of corruption commonly found in wealthy economies while over-counting those in poor countries. The United States and Singapore are perceived as more corrupt by the UCI aggregated score than by overall impression. One possible explanation is that when respondents are asked to evaluate corruption in a single question, they overlook non-illegal manifestations of access money, such as influence peddling and regulatory capture. When perceptions are unbundled, however, these activities are factored into the total.
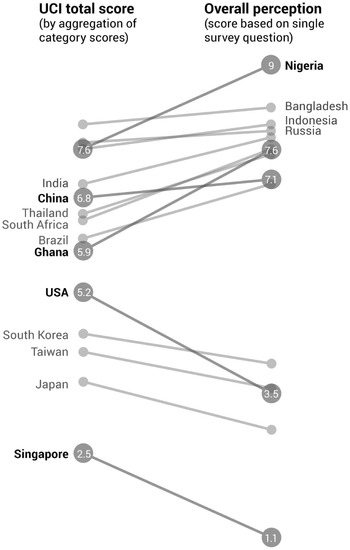
Conversely, Nigeria and Ghana are perceived as more corrupt by overall impression than by UCI aggregated scores. This could be because the forms of corruption that dominate in Ghana (speed money) and Nigeria (grand theft) are visible to the public or widely condemned. China is also rated as slightly more corrupt by the CPI than by my unbundled method, which might reflect the influence of wide media coverage of its worsening corruption and the fact that its leadership speaks openly about corruption as a crisis.
Which Mode of Corruption Dominates?
Another advantage of the UCI is that we can disaggregate the scores to examine which mode of corruption dominates in each country. Instead of subjectively selecting countries to represent various typologies, my survey allows us to examine the relative weight of each category. The category that makes up the highest share of the UCI aggregate score may be interpreted as the dominant mode of corruption. This feature is visualized in Figure 2.2, with the dominant mode of each country highlighted in a darker shade.
The results are striking. In China the dominant mode of corruption is access money, which puts it in the same league as all five high-income economies (Japan, Singapore, South Korea, Taiwan, and the United States) and three large emerging markets (Brazil, Indonesia, and South Africa). In contrast, Bangladesh, Ghana, India, and Russia are dominated by speed money, which suggests that bribes are more commonly paid to avoid harassment and delays than to buy privileges. Consistently with most qualitative accounts,Footnote 32 Nigeria’s corruption is defined by grand theft, elite embezzlement of public funds and resources. In Thailand, petty theft, malfeasance among low-level public officers that does not involve exchanges, emerges as most prevalent.Footnote 33
China vs. Russia
The empirical efforts in this chapter allow observers of China to objectively assess a long-standing question: is corruption in China different from other countries – and, if so, how?
I begin with a paired comparison of China and Russia. Students of post-communist societies have long wondered why economic liberalization brought about vibrant capitalist growth in China but regime collapse in the former Soviet Union and economic stagnation in Russia. Both China and Russia experienced an explosion of corruption over the course of transition toward capitalist markets. Why are their economic outcomes so different?
One popular explanation is that corruption is “more devastating” in Russia than in China.Footnote 34 Blanchard and Shleifer argue that unlike Russia, which abruptly introduced market reforms under a dysfunctional democracy, China did so under the CCP’s centralized rule. As a result, corruption in China did not degenerate into chaos and lawlessness.Footnote 35 Echoing this argument, Sun agrees that whereas Russia is wrecked by lawless “looting,” China is marked by “rent-seeking” and “profit-sharing.”Footnote 36 But Wedeman disagrees: “It is wrong, I conclude, to argue that corruption in China was distinct from corruption in post-communist Russia because of greater levels of profit-sharing corruption versus greater levels of looting, as Sun argues. China had plenty of both.”Footnote 37
Beyond the academy, business executives also offer anecdotal comparisons. Dan Harris, an attorney who has worked in both countries, blogs:Footnote 38 “I have been to China probably five times as often as I have been to Russia and yet I have been shaken down for bribes by police officers in Russia more than once and that has never happened to me in China.” He also asserts that Chinese authorities are less likely than their Russian counterparts to demand speed money – bribes or fees to expedite the processing of licenses. In his words, “[In Russia] what they’re essentially telling you is if you don’t pay the fee to expedite your trademark application, your company trademark application is going to go into that ‘dark corner’ over there. And that generally does not happen in China.”
Is Harris’ personal observation shared by other expert respondents? Is Sun or Wedeman correct? The UCI provides an objective basis to assess various observational claims, which, expressed in my typology, translate into three research questions.
▪ Does China have lower levels of grand theft than Russia, which Sun and Wedeman refer to as “looting”?
▪ Does China have higher levels of access money than Russia, which Sun terms “rent-seeking” and “profit-sharing”?
▪ Does China have lower levels of speed money than Russia, in Harris’ terms, “a fee to expedite things” and “shakedowns for bribes” by police?
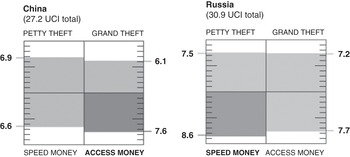
Figure 2.5 presents my answers to these questions. First, I find that China has lower levels of grand theft than Russia. In my survey, China scores 6.1 out of 10 on grand theft, lower than Russia’s 7.2. Under grand theft, one sub-category question asked how common it is for political leaders to siphon large amounts of embezzled funds overseas. The mean response in China is 2.8 out of 5 (which translates into “sometimes occurs”), lower than Russia’s score of 3.8 (“commonly occurs”).
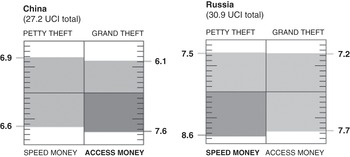
Second, does China have higher levels of access money than Russia? No, in that the two countries have almost identical scores. But the most dominant mode of corruption in China is access money, whereas in Russia it is speed money. Is Wedeman’s insistence that China has “plenty of” both types of corruption – grand theft and access money – correct? Here, it depends on what “plenty” means. It’s true that China has both types of corruption, and the frequency of both grand theft and access money in China is above average. But compared with Russia, grand theft (or looting) in China is less prevalent.
Does China have lower levels of speed money than Russia? Yes, China’s level of speed money (6.6) is lower than in Russia (8.6), being closest to Thailand (6.4) in my survey. In my dataset, Russia ranks second only to Bangladesh (8.7) in the prevalence of speed money. This supports Harris’ impression that paying bribes “to expedite things” or to avoid shakedowns is common in Russia and certainly more so than in China. For a fine-grained view, we can further compare their scores on two sub-categories of speed money (Table 2.3): petty bribes to avoid police penalties and bribes that speed up the process of obtaining permits. In both, China scores lower than Russia, but the gap is wider in the first sub-category.
While my survey is by no means perfect, it provides some systematically collected evidence that the structure of corruption in Russia is indeed distinct from China’s. I find that not only does Russia have a higher aggregate level of corruption than China, but also it exhibits more damaging types of corruption – grand theft, speed money, and petty theft – that inhibit business activities and deplete public wealth. The evidence suggests that whereas abrupt political liberalization in Russia unleashed all types of corruption, China has been more effective at curbing growth-damaging corruption. It also appears to exercise more discipline over street-level bureaucrats and police officers.
China vs. India
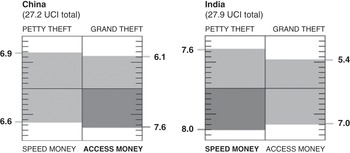
Bundled scores of corruption can mask important structural variances, as a comparison of China and India vividly demonstrates. Although the two nations are political opposites – China is the world’s largest autocracy while India is the largest democracy – both have sprawling territories with multiple levels of government. They also display nearly identical aggregate levels of corruption according to standard indices. In 2017, China’s CPI score was 41 and India’s was 40. In my survey, China and India rank next to each other, too. Yet as Figure 2.6 shows, their composition of corruption diverges.
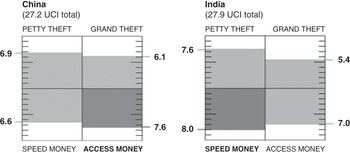
In terms of the structure of corruption, China and India are virtually mirror images of each other. Petty extortion and speed money – corruption involving street-level bureaucrats – are more prevalent in India than in China by a margin of 0.7 points and 1.4 points, respectively. On the other hand, grand theft and access money – corruption involving elites – are more widespread in China, by 0.6 points in each category.
A comparison of China and India sharply illustrates the distinction between speed money (bribes to overcome administrative barriers or delays) and access money (graft for buying privileged access). For a nuanced breakdown, Table 2.4 compares China’s and India’s score on four survey questions, two about speed money and two about access money. Although Chinese citizens do complain about arbitrary fee extraction and petty bribery,Footnote 39 these problems are even more endemic in India. For example The New York Times reported that hospital staff in India routinely demand petty bribes to deliver even basic public services, from providing wheelchairs to allowing parents to carry their newborns.Footnote 40 It is also more common for businesses in India (4.5) than in China (3.5) to pay petty bribes to accelerate the process of obtaining permits, a classic example of speed money.
| Category of corruption | Survey question | China’s score | India’s score |
|---|---|---|---|
| Speed money | At public hospitals, patients are expected to pay hospital staff “tips” or small bribes for even the most basic services, from having wheelchairs to seeing newborn infants at nurseries. | 3.1 | 3.7 |
| To speed up the process of obtaining permits, businesses pay minor bribes to approving officials. | 3.5 | 4.5 | |
| Access money | By cultivating close ties with a powerful official and paying for his family’s expenses, a businessperson gains monopoly access to public construction projects. | 4.1 | 3.3 |
| A top politician is linked to an extensive network of former associates, protégés, and/or family members, who monopolize power in certain sectors of the economy. While the politician himself never or rarely accepts bribes, a massive amount of bribes flows through his network. | 4.3 | 3.7 |
This finding is consistent with the Global Corruption Barometer (GCB), an original survey that TI conducts across countries and separate from the CPI, focusing on citizens’ personal experiences with petty corruption. The latest GCB, conducted between 2015 and 2017, asked respondents whether they had to pay a bribe during the last 12 months in order to access public services.Footnote 41 The survey found that petty bribery was highest in India, where 69 percent of respondents reported paying a bribe, compared with only 26 percent in China. According to the GCB, petty bribery is less frequent in China than in Vietnam (65 percent), Thailand (41 percent), and Indonesia (32 percent).
Although China may have less of a problem with petty bribery than India, access money flows abundantly in the middle kingdom. The scandal of Zhou Yongkang, a former member of the Standing Committee of the Politburo who fell during Xi’s anti-corruption campaign, revealed that top Chinese politicians cultivate an extensive network of clientele through which massive bribes flow, even if the patron doesn’t personally take bribes.Footnote 42 My survey finds that this style of elite, network-based bribery is more prevalent in China than in India. Plying the family members of political leaders with perks in order to cultivate close ties with them, as Bo Xilai’s saga exposed, is also more common in China.
To sum up, in India, people pay bribes to override obstacles; in China, graft buys lucrative business deals. If the former is analogous to grease, then the latter is more like sludge. This difference stems from the two countries’ contrasting political regimes.Footnote 43 In the Chinese developmental autocracy, power is concentrated in the hands of individual leaders who can easily waive restrictions and open doors. By contrast, the system of checks and balances in India’s fragmented democracy gives numerous authorities the power to block decisions but not to unilaterally approve requests or extend deals. Bardhan insightfully illustrates this with a quote from a high-level official in New Delhi: “If you want me to move a file faster, I am not sure if I can help you. But if you want me to stop a file, I can do it immediately.”Footnote 44
The economic and social effects of access money and speed money are starkly different. In India “nickel-and-dime bribery … infects everyday life,”Footnote 45 to use the words of Swati Ramanthan, co-founder of I-Paid-A-Bribe. Such corruption directly stifles growth by imposing delays, inefficiencies, and costs on businesses. Worst of all, the burden of petty bribery falls most heavily on the poor. By contrast, access money fuels China’s capitalist machine, enriching capitalists who pay for deals and rewarding communist officials for promoting rapid growth; yet it can produce serious harm in the long term by sharpening inequality and distorting policies and capital allocation (Chapter 5).
My comparison of authoritarian China and democratic India prompts a rethinking of the way we study the relationship between regime type (democracy or autocracy) and corruption. According to existing cross-national regressions, which all rely on bundled corruption scores, democracy measures do not consistently correlate positively or negatively with corruption.Footnote 46 My analysis brings attention to a different dimension: the effects of regime type on the dominant type of corruption, rather than its overall level. But existing corruption indices fail to capture qualitative variation, as Stephenson pointedly observes: “reliance on perception index scores may cause a change in the form of corruption to be misinterpreted as a change in the level of corruption.”Footnote 47 The way to correct this problem is to develop an index of different types of corruption, as I do here.
China vs. the United States
We now come to a third, intriguing comparison: China and the United States. In terms of aggregate corruption scores, the two countries are miles apart. The United States is ranked among the least corrupt countries in the world, rated No. 16 (out of 180 countries) by the CPI in 2017, whereas China trailed at No. 77. Unlike China, the United States does not confront daily corruption scandals among its top officials, nor do middle-class American citizens normally encounter bribe-taking public officers.
Yet the two countries have something in common: access money is the dominant mode of corruption. To be sure, the level of corruption in China is much higher than in the United States across all four categories, but the gap narrows when it comes to access money. Indeed, the US score on access money (6.9) is above average in my dataset of 15 countries, higher than Thailand (6.5), South Korea (6.1), and even Ghana (5.8). This striking statistic would be obscured if we relied solely on bundled scores.
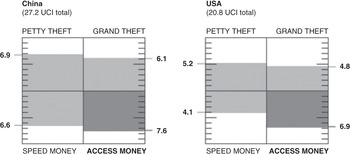
Even more interesting is that different forms of access money dominate in China and the United States. To illustrate, Table 2.5 compares their scores on three survey questions. The first vignette represents the practice of cultivating extensive client networks for bribe-taking, in which China clearly dominates. Yet when we turn to revolving door practices and regulatory capture through lobbying – the second and third vignettes – the United States dominates. This suggests that access money in the US capitalist democracy is institutional, which is consistent with arguments made by several American scholars.Footnote 48 Pointing to Congress as an example, Lessig observes, “We could imagine an institution that is corrupt even when no one within that institution is also corrupt.”Footnote 49 In short, whereas access money in the United States today is primarily institutional, in China it is enmeshed within personal relationships and still involve bribes and illegal actions. One might say China has a backward version of access money.
| Survey question | China’s score | United States’ score |
|---|---|---|
| A top politician is linked to an extensive network of former associates, protégés, and/or family members, who monopolize power in certain sectors of the economy. While the politician himself never or rarely accepts bribes, a massive amount of bribes flows through his network. | 4.3 | 3.0 |
| Major figures move back and forth between the public and the private sector, and there are no laws forbidding this practice. | 3.3 | 4.4 |
| To influence laws and regulations in favor of their industry, major corporations collectively employ lobbyists or professional middlemen, who supply policymakers with various perks, but not cash bribes. | 3.5 | 4.6 |
Revisiting the Corruption–Growth Nexus
One of the most widely cited analyses of the impact of corruption on economic growth is Mauro’s Reference Mauro1995 article “Corruption and Growth.” The author’s regression analysis of 70 countries uses bundled indices of corruption and red-tape from Business International (BI). He concludes that “the negative association between corruption and investment, as well as growth, is significant, both in a statistical and in an economic sense.”Footnote 50 More recent statistical studies generally support Mauro’s finding,Footnote 51 although a few do not.Footnote 52
My study highlights two main problems with this approach. Mauro and others rely on bundled scores of corruption, which under-measure or ignore access money. In fact, this type of corruption can be salient among high-income countries, as demonstrated by the case of the United States. A second problem is that standard regression analyses only capture the effects of corruption on a cross-section of income levels or growth rates. They do not capture lag effects or tipping points, whereby the accumulation of risks and distortions erupts in a major fallout, such as the 2008 financial crisis.
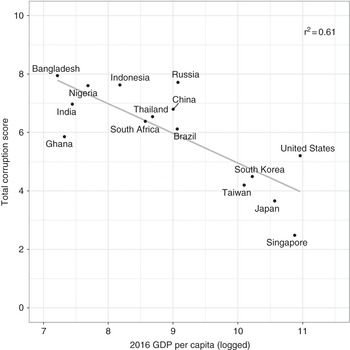
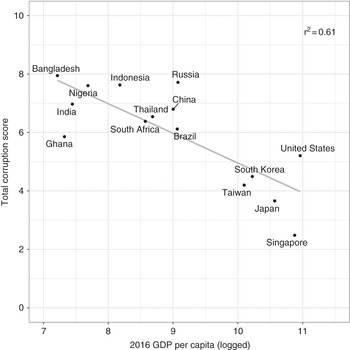
My dataset of observations on 15 countries is too small to make causal inferences; nevertheless, exploring the correlations between unbundled corruption scores and economic growth may yield some useful insights. Figure 2.8 shows a clear negative relationship between the UCI score and GDP per capita across the countries in my dataset. Consistently with prior studies, wealthier countries are less corrupt.
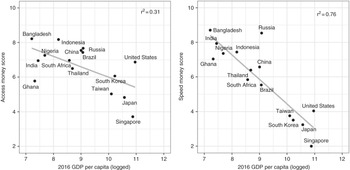
But when we break up the UCI aggregate score into speed money and access money, as shown in Figure 2.9, we observe that although wealthy countries consistently have lower levels of speed money than poor countries (r2 = 0.76), they do not always have lower levels of access money (r2 = 0.31).
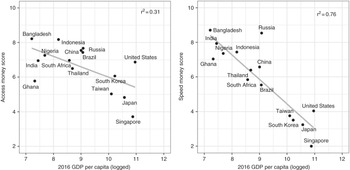
In other words, we need to qualify the assertion that wealthier countries are less corrupt by asking what type of corruption is in question. The standard practice of combining bundled corruption scores and GDP measures in cross-national regressions has produced a flawed yet powerful consensus: corruption always impedes growth. Imagine what regression results might look like if the UCI were extended across a large number of countries. We would be able to examine the relationship between types of corruption and wealth levels, instead of fixating on overall levels of corruption.
Advancing Systematic Qualitative Comparisons
Apart from improving quantitative indices of corruption, my survey serves to advance systematic qualitative comparisons across countries. While there is an abundance of excellent qualitative studies on corruption, this literature is constrained by subjectivity. Observers can have vastly different opinions on the dominant type of corruption in each country. Consider, for example, two competing characterizations of Chinese corruption.
▪ Wedeman: “Corruption in China was similar to many of the worst examples of endemic and economically destructive corruption elsewhere in the developing world.”
▪ Huang: “Corruption in China helped to navigate around excessive regulations and controls in an overly centralized bureaucracy.”Footnote 53
Which of these conflicting descriptions is correct? With data on corruption structures, we can evaluate these statements objectively. Is China’s corruption similar to “economically destructive corruption elsewhere in the developing world,” as Wedeman claims? My survey indicates that it is not – as an example, just compare the level and structure of China’s and Nigeria’s UCI. Was corruption in China primarily about “navigating around excessive regulations and controls” (the equivalent of speed money in my typology), as Huang perceives? My survey shows that speed money in China is moderate, at a level similar to Thailand, but its most prevalent type of corruption is in fact access money – graft for buying special deals.
My approach can apply beyond China to any cross-national comparative study. In qualitative comparisons, the standard practice is to illustrate each typology with a country case. For example, Johnston selects four countries to represent four varieties of corruption: Japan as “influence markets,” South Korea as “elite cartels,” India as “oligarchs and clans,” and China as “official moguls.”Footnote 54A clear problem is that different analysts may classify the same cases in different categories, depending on their focus or judgment.Footnote 55 This problem is exacerbated in large and fast-evolving countries, exemplified by China.Footnote 56 Another problem with this conventional method of national classification is the assumption that all countries have only one type of corruptionFootnote 57 – in fact, as the UCI shows, each country has a combination of multiple types in varying degrees.
Conclusion
Corruption is not a homogeneous problem, as the UCI visualizes. Standard bundled indices like the CPI mask important structural variances across countries. For example, China and India have identical aggregate corruption scores, yet access money dominates in China while speed money prevails in India. Wealthy countries with low aggregate corruption scores may have higher levels of access money than low-income countries; the United States is a case in point. Unlike standard measures, the UCI makes a clear distinction between the quantity and quality of corruption. Each UCI visual (Figure 2.1) simultaneously displays the quantity of corruption (in each of the four categories and in total) and where corruption is most concentrated.
The UCI should be viewed as a pilot, and much more work is needed to refine its design and implementation. The patterns in the survey are only suggestive, and future research is necessary to confirm or disprove them. Nevertheless, by specifying a clear, common set of criteria for measuring corruption structure, analysts may now debate procedures of data collection rather than opinions and impressions. This is a big step forward.
Below I highlight three comparative patterns that my analysis suggests.
▪ The structure of corruption matters as much as the overall level of corruption. Corruption in China is less damaging than in Russia because of divergence in composition. Both countries are rife with cronyism, but China has lower levels of corruption that directly stifles growth: speed money, petty theft, and grand theft.
▪ Regime type affects which type of corruption dominates. In authoritarian China, capitalists court politicians for their power to make sweeping decisions, whereas in India’s fragmented democracy, state actors extract rents by blocking approvals. Hence, bribery assumes different dominant forms in the two developing countries. The effect of democracy on corruption, however, appears to be moderated by levels of economic development and state capacity. Although the United States is also a democracy, access money dominates, as the government successfully brought petty bribery under control through more than a century of administrative and political reform (see the section “Two Gilded Ages” in Chapter 7).
▪ Not all systems of access money are the same. Compared with institutional corruption in the United States, China’s style of access money is crude in that elite exchanges are enmeshed with personal relationships, mostly illegal, and still involve bribes.
The findings in this chapter supplied the first important clue to the Chinese paradox of corruption and growth – access money, rather than corruption with theft or speed money, dominates. Although access money poses long-term economic risks and undermines the CCP’s legitimacy, it does not deter private investment and business activities in the short term. But how did China arrive at its present pattern of corruption? What was the corruption landscape like in the early decades of market liberalization, and why did it change over time? Chapter 3 will trace the evolution of Chinese corruption.

 Open access