


1 Motivation
Network influence shapes political outcomes across diverse domains, yet precisely measuring and explaining these patterns of influence remains a challenge. We define network influence broadly as the impact that one actor’s actions or decisions have on the behavior of others within a network, whether through direct or indirect connections. Numerous studies have demonstrated the critical role of network influences in explaining a wide range of political phenomena, from subnational policy diffusion to interstate conflict dynamics (Beardsley et al. Reference Beardsley, Liu, Mucha, Siegel and Tellez2020; Cranmer, Desmarais, and Menninga Reference Cranmer, Desmarais and Menninga2012; Edgerton Reference Edgerton2024; Nieman et al. Reference Nieman, Machain, Chyzh and Bell2021). A prominent approach to measuring influence relies on latent variable models, which position actors in a social space based on mechanisms, such as transitivity and/or stochastic equivalence (Edgerton Reference Edgerton2024; Gade, Hafez, and Gabbay Reference Gade, Hafez and Gabbay2019; Huhe, Gallop, and Minhas Reference Huhe, Gallop and Minhas2021). However, while these models can effectively describe the overall structure of a network, they frequently fall short in providing detailed explanations for the specific influence that actors exert on one another. This limitation arises because these models typically attribute influence to broad network features, without accounting for the exogenous factors that might drive such influence, leaving the mechanisms behind these interactions underexplored and poorly understood.
To address this limitation, we propose a novel approach: the social influence regression (SIR) model. This model extends vector autoregression techniques to relational data, allowing us to capture the influence of one actor on another over time while simultaneously incorporating exogenous covariates. The SIR model operates by estimating a pair of $n \times n$
matrices that measure sender- and receiver-level influence patterns, taking the form:
$n \times n$
matrices that measure sender- and receiver-level influence patterns, taking the form:
 $$\begin{align*}y_{i,j,t} \;=\; \sum_{i'=1}^{n} \sum_{j'=1}^{n} a_{i,i'} \, b_{j,j'} \, x_{i',j',t-1} \;+\; e_{i,j,t}, \end{align*}$$
where $a_{i,i'}$
describes how actor
$a_{i,i'}$
describes how actor $i'$
’s past actions (at time
$i'$
’s past actions (at time $t-1$
) help predict actor i’s actions at the current time t.Footnote 1 Similarly,
$t-1$
) help predict actor i’s actions at the current time t.Footnote 1 Similarly, $b_{j,j'}$
indicates how prior actions directed at
$b_{j,j'}$
indicates how prior actions directed at $j'$
shape the actions now directed at j. The term
$j'$
shape the actions now directed at j. The term $x_{i',j',t-1}$
represents lagged predictors of the interaction, and
$x_{i',j',t-1}$
represents lagged predictors of the interaction, and $e_{i,j,t}$
is an error term.
$e_{i,j,t}$
is an error term.
The key innovation of the SIR model is its ability to explicitly account for the role of exogenous covariates in shaping these influence patterns. While traditional models in this vein are effective at uncovering patterns within the network, they often fall short of explaining these patterns in terms of observable actor-level or dyad-level attributes. The SIR model bridges this gap by linking actor positioning in the latent social space directly to exogenous covariates, thus providing a more interpretable and theoretically grounded understanding of network dynamics.
Similarly, popular network approaches, such as ERGMs and SAOMs, while adept at capturing structural dependencies (e.g., transitivity and reciprocity), often leave open questions about the exogenous drivers underlying evolving patterns of influence. In most ERGM specifications, for example, explanatory variables enter as global effects that apply uniformly across all nodes, rather than revealing how these factors might differentially shape specific actors’ relational patterns. In contrast, SIR specifically centers on identifying how measured actor- or dyad-level attributes explain who influences whom, and to what extent. By embedding bilinear terms in a regression framework, it offers a means of mapping exogenous covariates—such as alliances or proximity—onto dynamic, node-specific influence processes, enabling researchers to investigate why certain actors wield disproportionate control or how conflict may cluster among particular sets of states. SIR thus focuses on exogenous triggers that guide or constrain influence, providing answers to a different set of questions about how external conditions catalyze or moderate these relationships over time. This emphasis on covariate-driven explanation broadens the analytic toolkit for network research and offers a direct avenue to see how observable traits guide influence within the network.
We apply this approach to data from the Integrated Crisis Early Warning System (ICEWS) event data project. Using the SIR model, we estimate the extent to which actors within the material conflict network influence one another and, crucially, explore how characteristics such as alliances or economic relationships explain the observed influence patterns. Our findings demonstrate that the SIR model significantly improves out-of-sample performance compared to existing methods. This improvement underscores the model’s effectiveness and offers new insights into the drivers of influence in international relations. By providing a more precise and interpretable representation of network dynamics, this work advances both the methodology of network analysis and the substantive understanding of international conflict processes.
The rest of the paper proceeds as follows. In Section 2, we introduce the model in detail, describing its theoretical foundations and estimation procedure. Section 3 presents our empirical application to the ICEWS data, including a description of the data, model specification, and results. We pay particular attention to how alliance relationships and trade flows influence conflict behavior. Section 4 provides a performance comparison of the SIR model against alternative approaches, demonstrating its superior out-of-sample predictive power. Finally, Section 5 concludes with a discussion of the implications of our findings for international relations theory and suggestions for future research directions in network analysis within political science.
2 Methods
2.1 Bilinear Network Autoregression Model
The bilinear network autoregression model provides a framework for understanding how interactions between actors in a network can be modeled over time (Minhas, Hoff, and Ward Reference Minhas, Hoff and Ward2016). In this paper, we extend this framework by presenting the SIR model, which not only offers a novel method to explain the factors driving the influence parameters in the bilinear autoregression model but also introduces a more efficient estimation scheme. Our iterative block coordinate descent method dramatically accelerates the estimation process compared to the Bayesian approach originally used in the bilinear autoregression framework, making it much faster and more scalable for large networks.
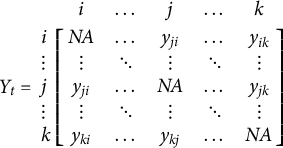
Matrix representation of a dyadic, relational measure for one time point.

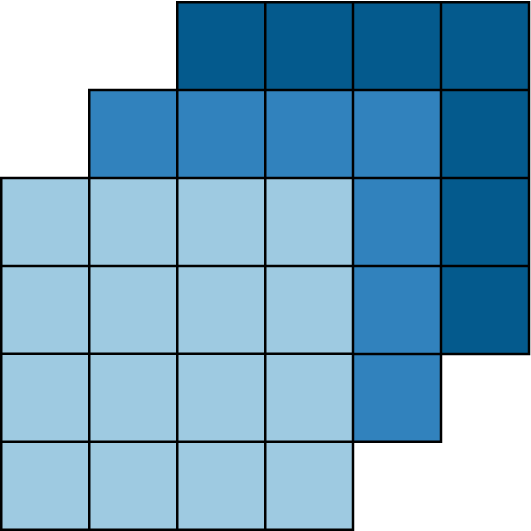
Array representation of a longitudinal dyadic measure. Darker shading indicates later time periods.

Many studies examine the flows or linkages among actors, such as whether two countries are in conflict with one another. These interactions are often represented as an $n \times n$
matrix, as shown in Figure 1, where n denotes the total number of actors in the network. We label the rows by i and the columns by j, with
$n \times n$
matrix, as shown in Figure 1, where n denotes the total number of actors in the network. We label the rows by i and the columns by j, with $i,j \in \{1,2,\dots ,n\}$
. The off-diagonal elements
$i,j \in \{1,2,\dots ,n\}$
. The off-diagonal elements $y_{ij}$
denote the interaction that actor i directs to actor j. In undirected data,
$y_{ij}$
denote the interaction that actor i directs to actor j. In undirected data, $y_{ij}$
may indicate, for example, whether i and j are allied. In directed data, the rows represent senders and the columns represent receivers, so
$y_{ij}$
may indicate, for example, whether i and j are allied. In directed data, the rows represent senders and the columns represent receivers, so $y_{ij}$
would indicate an action sent from i to j. The diagonal elements
$y_{ij}$
would indicate an action sent from i to j. The diagonal elements $y_{ii}$
are typically undefined, indicating that actors do not interact with themselves. Although we will introduce time later (with
$y_{ii}$
are typically undefined, indicating that actors do not interact with themselves. Although we will introduce time later (with $t=1,\ldots ,T$
), this figure illustrates a single snapshot of interactions at one point in time.
$t=1,\ldots ,T$
), this figure illustrates a single snapshot of interactions at one point in time.
Figure 1 captures interactions between actors at a single point in time. However, interactions are often observed over a series of time points. To represent longitudinal network data, we stack these adjacency matrices into an array, as shown in Figure 2. Specifically, let $Y = \{Y_t : t = 1, \ldots , T\}$
be a time series of relational data, where T represents the number of time points. The resulting array has dimensions
$Y = \{Y_t : t = 1, \ldots , T\}$
be a time series of relational data, where T represents the number of time points. The resulting array has dimensions $n \times n \times T$
. The bilinear autoregression model is designed to estimate dependencies in such structures by regressing the network at one time point on its lag. The relationship between these time points is captured by a pair of matrices that reflect sender and receiver dependence patterns for each dyad.
$n \times n \times T$
. The bilinear autoregression model is designed to estimate dependencies in such structures by regressing the network at one time point on its lag. The relationship between these time points is captured by a pair of matrices that reflect sender and receiver dependence patterns for each dyad.
A generalized bilinear autoregression model for Y is given by
 $$ \begin{align*} E [ y_{i,j,t} ] &= g( \mu_{i,j,t} ), \\ \{ \mu_{i,j,t} \} &= M_t = A X_t B^{\top}, \\ \{ \mu_{i,j,t} \} & = a_i^{\top} X_{t} b_j, \end{align*} $$
where $x_{i,j,t}$
is a function of the lagged outcome
$x_{i,j,t}$
is a function of the lagged outcome $y_{i,j,t-1}$
. For instance, we might define
$y_{i,j,t-1}$
. For instance, we might define $\tilde {x}_{i,j,t} = \log (y_{i,j,t-1} + 1)$
, indicating that each dyad’s interaction at time
$\tilde {x}_{i,j,t} = \log (y_{i,j,t-1} + 1)$
, indicating that each dyad’s interaction at time $t-1$
helps predict its behavior at time t.
$t-1$
helps predict its behavior at time t.
In the application, we explore an example involving count data, where Y is a time series of matrices defining count-based events between actors. For instance, we model $ y_{i,j,t} \sim \text {Poisson}(e^{\mu _{i,j,t}})$
, with
$ y_{i,j,t} \sim \text {Poisson}(e^{\mu _{i,j,t}})$
, with $ \tilde {x}_{i,j,t} = \log (y_{i,j,t-1} + 1)$
. This framework is extendable to other distributions, as it is based on a generalized bilinear model. The matrices A and B are
$ \tilde {x}_{i,j,t} = \log (y_{i,j,t-1} + 1)$
. This framework is extendable to other distributions, as it is based on a generalized bilinear model. The matrices A and B are $n \times n$
“influence parameters.” For any pair of actors
$n \times n$
“influence parameters.” For any pair of actors $(i,i')$
, the element
$(i,i')$
, the element $a_{ii'}$
in A captures how predictive the actions of country
$a_{ii'}$
in A captures how predictive the actions of country $i'$
at time
$i'$
at time $t-1$
are of the actions of country i at time t.
$t-1$
are of the actions of country i at time t. $b_{jj'}$
in B captures how predictive the actions directed at country
$b_{jj'}$
in B captures how predictive the actions directed at country $j'$
at time
$j'$
at time $t-1$
are of the actions directed toward country j at time t.
$t-1$
are of the actions directed toward country j at time t.
For example, in a bilinear autoregression model on conflict involving the United Kingdom (GBR) and the United States of America (USA), if $ a_{\text {GBR}, \text {USA}} $
is greater than zero, it implies that countries with which the USA initiated or continued a conflict in period
$ a_{\text {GBR}, \text {USA}} $
is greater than zero, it implies that countries with which the USA initiated or continued a conflict in period $t-1$
are likely to also face conflict from GBR in period t. This suggests that GBR’s future actions are influenced by the USA, or more concretely, the USA’s actions are predictive of GBR’s.
$t-1$
are likely to also face conflict from GBR in period t. This suggests that GBR’s future actions are influenced by the USA, or more concretely, the USA’s actions are predictive of GBR’s.
While the bilinear autoregression model provides a robust framework for capturing dependence patterns within network data, it falls short in its ability to explain the underlying mechanisms driving these influence patterns. Specifically, the model does not incorporate exogenous factors that may account for why certain actors exert influence within the network, limiting its interpretability and theoretical grounding. The SIR model, introduced in the next section, addresses this gap by incorporating exogenous covariates, offering a more detailed and interpretable understanding of what drives the influence parameters, a and b, within the network. This innovation not only enhances the explanatory power of the model but also enables greather theoretical insight into the dynamics of network interactions.
2.2 SIR
The SIR model explains influence in terms of covariates by specifying a linear regression for the influence parameters $a_{ii'}$
and
$a_{ii'}$
and $b_{jj'}$
. Specifically, to determine which characteristics of actor i or
$b_{jj'}$
. Specifically, to determine which characteristics of actor i or $i'$
are associated with the influence parameter
$i'$
are associated with the influence parameter $a_{ii'}$
, we write
$a_{ii'}$
, we write
 $$\begin{align*}a_{ii'} = \alpha^{\top} w_{ii'} \quad \text{and} \quad b_{jj'} = \beta^{\top} w_{jj'}, \end{align*}$$
where $w_{ii'}$
and
$w_{ii'}$
and $w_{jj'}$
are vectors of nodal and dyadic covariates describing the relationship between actors i and
$w_{jj'}$
are vectors of nodal and dyadic covariates describing the relationship between actors i and $i'$
, and between j and
$i'$
, and between j and $j'$
, respectively. The parameter vectors
$j'$
, respectively. The parameter vectors $\alpha $
and
$\alpha $
and $\beta $
then capture how each covariate contributes to sender- or receiver-level influence. In our application below, these covariates vary over time, so the model extends naturally to
$\beta $
then capture how each covariate contributes to sender- or receiver-level influence. In our application below, these covariates vary over time, so the model extends naturally to
 $$\begin{align*}a_{ii',t} = \alpha^{\top} w_{ii',t} \quad \text{and} \quad b_{jj',t} = \beta^{\top} w_{jj',t}, \end{align*}$$
allowing exogenous attributes to change at each time point and thus shape evolving influence dynamics.
The network autoregression model can be expressed as:
 $$ \begin{align*} \mu_{i,j,t} &= \sum_{i'=1}^{n} \sum_{j'=1}^{n} a_{i,i',t} \, x_{i',j',t} \, b_{j,j',t} \;=\; \sum_{i'=1}^{n} \sum_{j'=1}^{n} \alpha^{\top} w_{i,i',t} \, x_{i',j',t} \, w_{j,j',t}^{\top} \beta \\ &= \alpha^{\top} \biggl(\sum_{i'=1}^{n} \sum_{j'=1}^{n} x_{i',j',t}\, w_{i,i',t} \, w_{j,j',t}^{\top} \biggr) \,\beta \;=\; \alpha^{\top} \tilde{X}_{i,j,t}\,\beta. \end{align*} $$
Typically, $y_{i,j,t}$
also has covariates. For example, we might want to condition the estimation of the parameters on a lagged version of the dependent variable,
$y_{i,j,t}$
also has covariates. For example, we might want to condition the estimation of the parameters on a lagged version of the dependent variable, $y_{i,j,t-1}$
, a measure of reciprocity,
$y_{i,j,t-1}$
, a measure of reciprocity, $y_{j,i,t-1}$
, and other exogenous variables. In the case of estimating a model on material conflict between a pair of countries, this might include other exogenous aspects such as the geographical distance between a pair of countries. These additional exogeneous parameters can be accommodated with a model of the form:
$y_{j,i,t-1}$
, and other exogenous variables. In the case of estimating a model on material conflict between a pair of countries, this might include other exogenous aspects such as the geographical distance between a pair of countries. These additional exogeneous parameters can be accommodated with a model of the form:
 $$ \begin{align*} \mu_{i,j,t} = \theta^{\top} z_{i,j,t} + \alpha^{\top} \tilde{X}_{ijt} \beta, \end{align*} $$
where $z_{i,j,t}$
is a vector of exogenous covariates (e.g., distance or alliance status) associated with dyad
$z_{i,j,t}$
is a vector of exogenous covariates (e.g., distance or alliance status) associated with dyad $(i,j)$
at time t, representing parameters that may have a direct effect on the dependent variable. The model presented here is a type of low-rank matrix regression, where
$(i,j)$
at time t, representing parameters that may have a direct effect on the dependent variable. The model presented here is a type of low-rank matrix regression, where $y_{ij,t}$
is regressed on
$y_{ij,t}$
is regressed on $X_{ij,t}$
, which typically encodes relational-level predictors or prior network interactions relevant to dyad
$X_{ij,t}$
, which typically encodes relational-level predictors or prior network interactions relevant to dyad $(i,j)$
at time t. An unconstrained (linear) regression would be expressed as
$(i,j)$
at time t. An unconstrained (linear) regression would be expressed as
 $$\begin{align*}\mu_{ij,t} = \theta^{\top} z_{ij,t} + \langle C, X_{ij,t} \rangle, \end{align*}$$
where C is an arbitrary $p\times p$
matrix of regression coefficients to be estimated. In contrast, the regression specified above restricts C to be rank one, expressible as
$p\times p$
matrix of regression coefficients to be estimated. In contrast, the regression specified above restricts C to be rank one, expressible as $C=\alpha \beta ^{\top }$
. This follows from the identity
$C=\alpha \beta ^{\top }$
. This follows from the identity $\langle \alpha \beta ^{\top }, X_{ij,t} \rangle = \alpha ^{\top } X_{ij,t} \beta $
. Low-rank matrix regression models of this form have been considered by Li, Kim, and Altman (Reference Li, Kim and Altman2010) and Zhou, Li, and Zhu (Reference Zhou, Li and Zhu2013).
$\langle \alpha \beta ^{\top }, X_{ij,t} \rangle = \alpha ^{\top } X_{ij,t} \beta $
. Low-rank matrix regression models of this form have been considered by Li, Kim, and Altman (Reference Li, Kim and Altman2010) and Zhou, Li, and Zhu (Reference Zhou, Li and Zhu2013).
2.3 Estimation
The estimation of the parameters $\{\theta , \alpha , \beta \}$
in the bilinear network autoregression model is challenging due to the bilinear nature of the model. To address this, we employ an iterative block coordinate descent method, which alternately optimizes the parameters by treating one set of parameters as fixed while optimizing over the others. Specifically, the estimation process capitalizes on the fact that for fixed
$\{\theta , \alpha , \beta \}$
in the bilinear network autoregression model is challenging due to the bilinear nature of the model. To address this, we employ an iterative block coordinate descent method, which alternately optimizes the parameters by treating one set of parameters as fixed while optimizing over the others. Specifically, the estimation process capitalizes on the fact that for fixed $\beta $
, the model is linear in
$\beta $
, the model is linear in $\theta $
and
$\theta $
and $\alpha $
, and for fixed
$\alpha $
, and for fixed $\alpha $
, it is linear in
$\alpha $
, it is linear in $\theta $
and
$\theta $
and $\beta $
. The conditional likelihood function for each of these cases can thus be optimized using standard techniques for generalized linear models (GLMs), specifically through iterative weighted least squares (IWLS).
$\beta $
. The conditional likelihood function for each of these cases can thus be optimized using standard techniques for generalized linear models (GLMs), specifically through iterative weighted least squares (IWLS).
The model can be expressed as follows:
 $$ \begin{align*} \mu_{i,j,t} & = ( \theta^{\top} \ \alpha^{\top} ) \left ( \begin{array}{c} z_{i,j,t} \\ \tilde{X}_{ijt} \beta \end{array} \right ) \\ &= ( \theta^{\top} \ \beta^{\top} ) \left ( \begin{array}{c} z_{i,j,t} \\ \tilde{X}_{ijt}^{\top} \alpha \end{array} \right ) \end{align*} $$
where $\mu _{i,j,t}$
represents the expected value of the interaction between actors i and j at time t,
$\mu _{i,j,t}$
represents the expected value of the interaction between actors i and j at time t, $z_{i,j,t}$
denotes the vector of covariates associated with the dyad
$z_{i,j,t}$
denotes the vector of covariates associated with the dyad $(i, j)$
at time t, and
$(i, j)$
at time t, and $\tilde {X}_{ijt}$
is the matrix of explanatory variables.
$\tilde {X}_{ijt}$
is the matrix of explanatory variables.
Given this setup, the parameters $\theta $
,
$\theta $
, $\alpha $
, and
$\alpha $
, and $\beta $
are estimated through the following iterative block coordinate descent procedure:
$\beta $
are estimated through the following iterative block coordinate descent procedure:
-
(1) Initialize: Start with an initial guess for $\beta $
.
$\beta $
. -
(2) Iterate:
-
(a) Optimize
$\theta $
and
$\alpha $
: With
$\beta $
fixed, estimate
$\theta $
and
$\alpha $
by maximizing the conditional log-likelihood function using IWLS. This is equivalent to fitting a GLM with the response variable y regressed on the design matrix
$\tilde {X}$
, which is constructed by concatenating
$z_{ij,t}$
and
$X_{ij,t} \beta $
for each dyad
$(i, j)$
and time t. -
(b) Optimize
$\theta $
and
$\beta $
: With
$\alpha $
fixed, estimate
$\theta $
and
$\beta $
by maximizing the conditional log-likelihood function using IWLS. This step is analogous to step (a) but with the design matrix
$\tilde {X}$
constructed by concatenating
$z_{ij,t}$
and
$X_{ij,t}^{\top } \alpha $
.
-
-
(3) Convergence: Repeat steps (a) and (b) until the parameters converge, i.e., until the changes in the parameter estimates between iterations fall below a specified tolerance level.


The iterative process leverages the fact that for each subproblem, the estimation reduces to a series of low-dimensional GLM optimizations. By solving these smaller problems iteratively, the overall estimation problem, which is bilinear and thus non-trivial, becomes manageable.
To implement the above steps, consider the following detailed process for step 1 (optimizing $\theta $
and
$\theta $
and $\alpha $
):
$\alpha $
):
-
(1) Construct the Design Matrix:
-
(a) Let
$\tilde {x}_{ij,t}$
be a vector of length
$p+q$
obtained by concatenating
$z_{ij,t}$
and
$X_{ij,t} \beta $
. Here, p is the length of the vector
$w_{ii'}$
, and q is the length of
$z_{ij,t}$
. -
(b) Construct the design matrix
$\tilde {X}$
with dimensions
$n \times (n-1) \times T$
by
$p+q$
, where each row corresponds to a specific dyad
$(i, j)$
at time t and is equal to
$\tilde {x}_{ij,t}$
.
-
-
(2) Create the Response Vector:
-
(a) Let y be a vector of length
$n \times (n-1) \times T$
consisting of the entries of
$Y = \{ Y_1, \ldots , Y_T \}$
, ordered to correspond with the rows of
$\tilde {X}$
.
-
-
(3) Perform Poisson Regression:
-
(a) Obtain the MLEs for the Poisson regression of y on
$\tilde {X}$
, which yields the conditional estimates of
$\theta $
and
$\alpha $
.
-
-
(4) Repeat for
$\theta $
and
$\beta $
:-
(a) In step 2 of the iterative algorithm, repeat the process by constructing the design matrix
$\tilde {X}$
with
$X_{ij,t}^{\top } \alpha $
replacing
$X_{ij,t} \beta $
in step 1(a).
-


The block coordinate descent method is particularly suited to this estimation problem because it effectively decomposes a high-dimensional optimization problem into more manageable subproblems. Each iteration refines the parameter estimates by focusing on a lower-dimensional subset of the parameters, thereby reducing the complexity of the problem.
Convergence is assessed by monitoring the change in parameter estimates across iterations. The process is typically stopped when the relative change in the log-likelihood or the parameter estimates between successive iterations falls below a predetermined threshold.Footnote 2
The iterative nature of the estimation process ensures that the resulting parameter estimates are as close as possible to the true maximum likelihood estimates, given the bilinear structure of the model. This method provides a robust and efficient means of estimating the parameters in complex network models where direct optimization would be infeasible.
2.4 Inference
After estimating the parameters of the SIR model, we assess the precision of these estimates by computing the standard errors. These standard errors are derived from the variance–covariance matrix, which is obtained from the inverse of the Hessian matrix of the log-likelihood function. Computing the standard errors, however, requires a consideration of the identifiability of the multiplicative parameters $ \alpha $
and
$ \alpha $
and $ \beta $
.
$ \beta $
.
The log-likelihood function for the SIR model, assuming a Poisson distribution for the count data, is given by
 $$\begin{align*}\ell(\theta, \alpha, \beta) = \sum_{i \neq j} \left( y_{ij,t} \log(\mu_{ij,t}) - \mu_{ij,t} \right), \end{align*}$$
where $ \mu _{ij,t} = \exp (\eta _{ij,t}) $
and
$ \mu _{ij,t} = \exp (\eta _{ij,t}) $
and $ \eta _{ij,t} = Z_{ij,t}^\top \theta + \alpha ^\top X_{ij,t} \beta $
represents the linear predictor incorporating both the fixed effects
$ \eta _{ij,t} = Z_{ij,t}^\top \theta + \alpha ^\top X_{ij,t} \beta $
represents the linear predictor incorporating both the fixed effects $Z_{ij,t}$
and the multiplicative terms involving the influence parameters
$Z_{ij,t}$
and the multiplicative terms involving the influence parameters $\alpha $
and
$\alpha $
and $\beta $
.
$\beta $
.
The parameters $ \alpha $
and
$ \alpha $
and $ \beta $
are not inherently identifiable because the term
$ \beta $
are not inherently identifiable because the term $ \alpha ^\top X \beta $
is equivalent to
$ \alpha ^\top X \beta $
is equivalent to $ \left (\frac {\alpha }{c}\right )^\top X \left (c \beta \right ) $
for any scalar
$ \left (\frac {\alpha }{c}\right )^\top X \left (c \beta \right ) $
for any scalar $ c $
. To obtain meaningful derivative-based standard errors, we must first establish an identifiable parameterization of the model. This can be achieved by imposing a scale restriction on either
$ c $
. To obtain meaningful derivative-based standard errors, we must first establish an identifiable parameterization of the model. This can be achieved by imposing a scale restriction on either $ \alpha $
or
$ \alpha $
or $ \beta $
, or by fixing one element of either vector. The identifiable parameterization employed here restricts the first element of
$ \beta $
, or by fixing one element of either vector. The identifiable parameterization employed here restricts the first element of $ \alpha $
to be one, ensuring that the model parameters are uniquely determined.
$ \alpha $
to be one, ensuring that the model parameters are uniquely determined.
The Hessian matrix $ H(\theta , \alpha , \beta ) $
is composed of the second-order partial derivatives of the log-likelihood function with respect to the parameters
$ H(\theta , \alpha , \beta ) $
is composed of the second-order partial derivatives of the log-likelihood function with respect to the parameters $ \theta $
,
$ \theta $
, $ \alpha $
, and
$ \alpha $
, and $ \beta $
, considering the identifiable parameterization:
$ \beta $
, considering the identifiable parameterization:
 $$\begin{align*}H(\theta, \alpha, \beta) = -\frac{\partial^2 \ell(\theta, \alpha, \beta)}{\partial \psi^2}, \end{align*}$$
where $\psi = (\theta , \alpha _{-1}, \beta )$
represents the identifiable parameter vector, excluding the fixed element of
$\psi = (\theta , \alpha _{-1}, \beta )$
represents the identifiable parameter vector, excluding the fixed element of $\alpha $
. For the identifiable parameterization, the Hessian matrix specifically consists of:
$\alpha $
. For the identifiable parameterization, the Hessian matrix specifically consists of:
 $$\begin{align*}H(\theta, \alpha, \beta) = \begin{pmatrix} H_{\theta \theta} & H_{\theta \alpha_{-1}} & H_{\theta \beta} \\ H_{\alpha_{-1} \theta} & H_{\alpha_{-1} \alpha_{-1}} & H_{\alpha_{-1} \beta} \\ H_{\beta \theta} & H_{\beta \alpha_{-1}} & H_{\beta \beta} \end{pmatrix}, \end{align*}$$
where each block is defined by the second derivatives:
 $$\begin{align*}H_{\theta_k \theta_l} = -\sum_{i \neq j} \left( \mu_{ij,t} Z_{ij,k} Z_{ij,l} \right), \end{align*}$$
 $$\begin{align*}H_{\alpha_{ii'} \alpha_{ii"}} = -\sum_{i \neq j} \left( \mu_{ij,t} X_{i'j,t-1} \beta_{jj'} X_{i"j,t-1} \beta_{jj'} \right), \end{align*}$$
 $$\begin{align*}H_{\beta_{jj'} \beta_{jj"}} = -\sum_{i \neq j} \left( \mu_{ij,t} \alpha_{ii'} X_{i'j,t-1} \alpha_{ii'} X_{i'j",t-1} \right). \end{align*}$$
The mixed partial derivatives are
 $$\begin{align*}H_{\theta_k \alpha_{ii'}} = -\sum_{i \neq j} \left( \mu_{ij,t} Z_{ij,k} X_{i'j,t-1} \beta_{jj'} \right), \end{align*}$$
 $$\begin{align*}H_{\theta_k \beta_{jj'}} = -\sum_{i \neq j} \left( \mu_{ij,t} Z_{ij,k} \alpha_{ii'} X_{i'j,t-1} \right), \end{align*}$$
 $$\begin{align*}H_{\alpha_{ii'} \beta_{jj'}} = -\sum_{i \neq j} \left( \mu_{ij,t} X_{i'j,t-1} X_{i'j,t-1} \right). \end{align*}$$
These expressions involve the expected counts $\mu _{ij,t} = \exp (\eta _{ij,t})$
, which depend on the current estimates of
$\mu _{ij,t} = \exp (\eta _{ij,t})$
, which depend on the current estimates of $\theta $
,
$\theta $
, $\alpha $
, and
$\alpha $
, and $\beta $
, and the design matrices Z and X.
$\beta $
, and the design matrices Z and X.
Given the identifiable parameterization, the standard errors for the parameters are derived from the inverse of the Hessian matrix:
 $$\begin{align*}\text{Cov}(\hat{\theta}, \hat{\alpha}, \hat{\beta}) = -H^{-1}(\hat{\theta}, \hat{\alpha}, \hat{\beta}), \end{align*}$$
where the standard errors are the square roots of the diagonal elements of this variance–covariance matrix:
 $$\begin{align*}\text{SE}(\hat{\theta}_k) = \sqrt{ \left[ \text{Cov}(\hat{\theta}, \hat{\alpha}, \hat{\beta}) \right]_{kk} }.\end{align*}$$
To obtain model-robust standard errors that are less sensitive to model misspecification, we employ a sandwich variance estimate:
 $$\begin{align*}\widehat{\text{Var}}(\hat{\psi}) = H^{-1} S H^{-1}, \end{align*}$$
where S is the empirical information matrix, computed as
 $$\begin{align*}S = \sum_{i,j,t} \left( y_{i,j,t} - \mu_{i,j,t} \right) \dot{L}_{ij,t} \dot{L}_{ij,t}^\top, \end{align*}$$
and $ \dot {L}_{ij,t} $
denotes the gradient (derivative) of the log-likelihood with respect to the parameters for a single observation
$ \dot {L}_{ij,t} $
denotes the gradient (derivative) of the log-likelihood with respect to the parameters for a single observation $ y_{ij,t} $
. The robust standard errors are then given by
$ y_{ij,t} $
. The robust standard errors are then given by
 $$\begin{align*}\text{Robust SE}(\hat{\psi}_k) = \sqrt{ \left[ \widehat{\text{Var}}(\hat{\psi}) \right]_{kk} }. \end{align*}$$
This robust variance–covariance matrix accounts for the variability in the score functions across observations, providing standard errors that are valid under a broader set of conditions.
Approximate standard errors and confidence intervals for the parameters are obtained from the derivatives of the log-likelihood function at the MLE. The asymptotic validity of these standard errors relies upon the assumption that the model is correctly specified. However, by using robust standard errors derived from the sandwich estimator, we ensure that the inferences drawn from the model are reliable even in the presence of potential model violations. In the application that follows in the next section, we utilize model-robust standard errors.
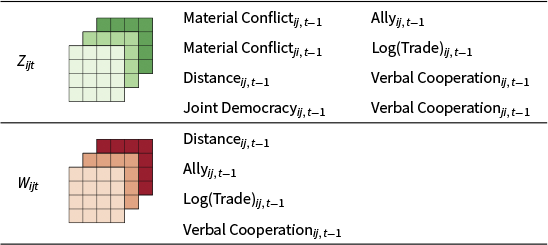
Figure 3 provides a visual summary of this model. The array in the far left represents the network being modeled, the design array in green represents explanatory variables used to directly model linkages between dyads, and the $\theta $
vector includes the estimates of the effect those variables have on the network. To capture dependence patterns, a logged and lagged version of dependent variable are included, along with a design array containing a set of influence covariates, W;
$\theta $
vector includes the estimates of the effect those variables have on the network. To capture dependence patterns, a logged and lagged version of dependent variable are included, along with a design array containing a set of influence covariates, W; $\alpha $
and
$\alpha $
and $\beta $
are vectors that capture parameter estimates for the effects of those influence covariates. By framing influence in a bilinear regression structure, SIR moves beyond the “black box” of simply noting that actors who resemble one another tend to form ties, and instead estimates how prior dyadic interactions (sender- and receiver-level) affect current interactions. A benefit of this framework is that once estimated, linear combinations of the influence regression parameters permit visualizing the resulting sender and receiver dependence patterns in the network.
$\beta $
are vectors that capture parameter estimates for the effects of those influence covariates. By framing influence in a bilinear regression structure, SIR moves beyond the “black box” of simply noting that actors who resemble one another tend to form ties, and instead estimates how prior dyadic interactions (sender- and receiver-level) affect current interactions. A benefit of this framework is that once estimated, linear combinations of the influence regression parameters permit visualizing the resulting sender and receiver dependence patterns in the network.
Visual summary of SIR model.

3 Empirical Application
3.1 ICEWS Material Conflict
A number of projects have arisen seeking to create large data sets of dyadic events through the automatic extraction of information from on-line news archives. This has made it empirically easier to study interactions among countries, as well as among actors such as NGOs within countries.Footnote 3
The two most well-known developments include the ICEWS event data project (Boschee et al. Reference Boschee, Lautenschlager, O’Brien, Shellman, Starz and Ward2015a) and the Phoenix pipeline (OEDA 2016). For the purposes of this project, we focus on utilizing the ICEWS database as it extends back farther in time. ICEWS draws from over 300 different international and national focused publishers (Boschee et al. Reference Boschee, Lautenschlager, O’Brien, Shellman, Starz and Ward2015b). The ICEWS event data are based on a continuous monitoring of over 250 news sources and other open-source material covering 177 countries worldwide. ICEWS consists of several components, including a database of over 38 million multilingual news stories going back to 1990 and present to last week. The ICEWS data along with extensive documentation have been made publicly available (with a one-year embargo) on dataverse.org (Boschee et al. Reference Boschee, Lautenschlager, O’Brien, Shellman, Starz and Ward2015a; Lautenschlager, Shellman, and Ward Reference Lautenschlager, Shellman and Ward2015). To classify news stories into socio-political topics, ICEWS relies on an augmented and expanded version of the CAMEO coding scheme (Schrodt, Gerner, and Yilmaz Reference Schrodt, Gerner, Yilmaz, Bercovitch and Gartner2009). The dictionaries, aggregations, ground truth data, and actor and verb dictionaries are publicly available with a one-year lag at the ICEWS data repository https://dataverse.harvard.edu/dataverse/icews. In addition, the event coder has been made available publicly by the Office of the Director of National Intelligence.Footnote 4 This event coder, known as ACCENT, searches for the following information: a sender, a receiver, an action type, and a time stamp. The set of action types covered include activities between dyads, such as “Occupy territory,” “Use conventional force,” and “Impose embargo, boycott, or sanctions.” Then, the ontology provides rules through which the parsed story is coded. An example of a coded news story fitting this last category is:
“President Bill Clinton has imposed sanctions on the Taliban religious faction that controls Afghanistan for its support of suspected terrorist Osama bin Laden, the White House said Tuesday.”
In this example, the actor designated as sending the action is the United States and the actor receiving it is Afghanistan. Dyadic measurements such as these are available for 249 countries, and the dataset is updated regularly. Currently, data up until March 2016 has been made publicly available on the ICEWS dataverse.
Our sample for this analysis focuses on monthly level interactions between countries in the international system from 2005 to 2012.Footnote 5 To measure conflict from this database, we focus on what is often referred to as the “material conflict” variable. This variable is taken from the “quad variable” framework developed by Duval and Thompson (Reference Duval and Thompson1980). Schrodt and Yonamine (Reference Schrodt and Yonamine2013) defines the type of events that get drawn into this category as those involving, “Physical acts of a conflictual nature, including armed attacks, destruction of property, assassination, etc.”.
Figure 4 visualizes the material conflict variable as a network, specifically, we provide snapshots of events between dyads along this relational dimension in January 2005 and December 2012. The size of the nodes corresponds to how active countries are in the network, and each node is colored by its geographic position. An edge between two nodes designates that at least one material conflict event has taken place between that dyad, and arrows indicate the sender and receiver. Thicker edges indicate a greater count of material conflict events between a dyad.
Network depiction of ICEWS Material Conflict events for January 2005 (top) and December 2012 (bottom).

In both snapshots, the United States is highly involved in conflict events occurring in the system both in 2005 and 2012. Additionally, other major powers, such as Russia and the Great Britain, are also frequently involved. Some notable changes are visible in the network. While in 2005 Iraq was highly involved in material conflict events by 2012 Syria became more active. Last, there is a significant amount of clustering by geography in this network. Conflict involving Latin American countries is relatively infrequent but when it does occur, it seems to primarily involve countries within the region.
3.2 Parameters With Direct Effect
We first parameterize the model by identifying variables that we hypothesize have a direct impact on material conflict patterns between countries. There are a number of the standard explanations provided in the conflict literature. Inertia and reprocity top the list. Conflict in period t is affected by what occurred previously in period $t-1$
. This is autoregressive dependence. The expectation is that a dyad engaged in conflict in the previous period is more likely to be engaged in conflict in the next.
$t-1$
. This is autoregressive dependence. The expectation is that a dyad engaged in conflict in the previous period is more likely to be engaged in conflict in the next.
A lagged reciprocity parameter embodies the common argument that if country j receives conflict from i in period t, that in period $t+1$
j may retaliate by sending conflict to i. The argument that reciprocity is likely to occur in conflict networks is certainly not novel, and has its roots in well known theories involving cooperation and conflict between states (Choucri and North Reference Choucri and North1972; Goldstein Reference Goldstein1992; Richardson Reference Richardson1960).
$t+1$
j may retaliate by sending conflict to i. The argument that reciprocity is likely to occur in conflict networks is certainly not novel, and has its roots in well known theories involving cooperation and conflict between states (Choucri and North Reference Choucri and North1972; Goldstein Reference Goldstein1992; Richardson Reference Richardson1960).
A number of exogenous explanations have often been used to explain conflicts between dyads. One of the most common relates to the role of geography. Apart from conflict involving major powers, conflict between countries that are geographically proximate is typical (Bremer Reference Bremer1992; Carter and Goemans Reference Carter and Goemans2011; Diehl and Goertz Reference Diehl and Goertz2000). Figure 4 demonstrates evidence of regional conflict patterns, as indicated by the clustering of similarly colored nodes, which represent countries within the same geographic region. This clustering suggests that conflicts are more likely to occur between countries in the same region. We use the minimum, logged distance between the dyads to operationalize this explanation.Footnote 6
One of the most well-developed arguments linking conflict between dyads to domestic institutions involves the idea of the democratic peace. The specific vein of this argument that has found the most support is the idea that democracies are unlikely to go to war with one another (Maoz and Abdolali Reference Maoz and Abdolali1989; Russett and Oneal Reference Russett and Oneal2001; Small and David Singer Reference Small and David Singer1976). Arguments for why democracies may have more peaceful relations between themselves range from how they share certain norms that make them less likely to engage in conflict to others hypothesizing that democratic leaders are better able to demonstrate resolve thus reducing conflict resulting from incomplete information (Fearon Reference Fearon1995; Maoz and Russett Reference Maoz and Russett1993). To operationalize this argument, we construct a binary indicator that is one when both countries in the dyad are democratic.Footnote 7
We also control for whether or not a pair of countries are allied to one another using data from the Correlates of War (Gibler and Sarkees Reference Gibler and Sarkees2004).Footnote 8 Typically, one would expect that states allied to one another are less likely to engage in conflict. Another common control in the conflict literature is the level of trade between a pair of countries. We estimate trade flows between countries using the International Monetary Fund (IMF) Direction of Trade Statistics (International Monetary Fund 2012). Incorporating the level of trade between countries speaks to a long debate on the role that economic interdependencies may play in mitigating the risk of conflict between states (Barbieri Reference Barbieri1996; Gartzke, Li, and Boehmer Reference Gartzke, Li and Boehmer2001).Footnote 9
The last set of measures we use to predict dyadic conflict are derived from another ICEWS quad variable. Verbal cooperation counts the occurrence of statements expressing a desire to cooperate from one country to another.Footnote 10 We include a lagged and reciprocal version of this variable to our specification. This monthly level measure of cooperation between states provides us with a thermometer measure of the relations between states that is measured at a low level of temporal aggregation.
3.3 Parameters Defining Influence Patterns
We next add covariates to the model to explain the influence patterns observed in the network. The SIR model introduces the ability to explain these patterns using an underlying regression model, which is jointly estimated with the parameters modeling $y_{ij}$
through the iterative procedure described earlier. Using the SIR model, we can answer the following types of questions:
$y_{ij}$
through the iterative procedure described earlier. Using the SIR model, we can answer the following types of questions:
-
• Do the actions of one country at time
$t-1$
influence the actions directed toward another country at time t within the network, as reflected in the influence parameters
$a_{ii'}$
and
$b_{jj'}$
? -
• Which factors explain the network effects embedded in the influence parameters
$a_{ii'}$
and
$b_{jj'}$
, determining the impact of one country’s actions at time
$t-1$
on the subsequent actions toward another country at time t?


The first covariate added to the influence specification is simply a control for the distance between countries.Footnote 11 A negative effect for the distance parameter in the case of sender influence would indicate that countries are likely to send conflictual actions to the same countries that their neighbors are sending conflictual actions too. In the case of receiver influence, a negative effect would indicate that countries are likely to be targeted by the same set of countries that their neighbors are receiving conflictual interactions from.
An argument that has received continuing attention in the political science literature is the role that alliances play in either mitigating or exacerbating the level of conflict in the international system. Some have argued that in the case of a conflict, a country’s allies will join in to honor their commitments thus increasing the risks for a multiparty interstate conflict (Leeds Reference Leeds2003; Snyder Reference Snyder1984; Vasquez and Rundlett Reference Vasquez and Rundlett2016). We would find evidence for this argument if the ally parameter in the case of sender influence was positive, as that would indicate that countries are more likely to initiate or increase the level of conflict with countries that their allies are in conflict with.
The next covariate we consider is the volume of trade between countries. Trade relationships are often seen as a stabilizing factor in international relations, under the premise that economic interdependence reduces the likelihood of conflict by raising the costs of disruption (Keohane and Nye Reference Keohane and Nye1977; Oneal and Russett Reference Oneal and Russett1999). In the context of sender influence, a negative effect for the trade parameter would suggest that countries are less likely to initiate conflict with the same targets as their trading partners, supporting the idea that trade can act as a deterrent to conflict. Conversely, in the case of receiver influence, a positive effect would indicate that countries receiving conflict from others may also be the targets of those same countries’ trading partners, potentially due to tensions arising from competitive trade dynamics.
The final covariate we examine is the level of verbal cooperation between countries, as indicated by diplomatic communications or public statements of support. Verbal cooperation can signal strong diplomatic ties or shared interests, potentially influencing patterns of conflict and cooperation in the network (Dorussen and Ward Reference Dorussen and Ward2008). In the case of sender influence, a positive effect for the verbal cooperation parameter would imply that countries are more likely to align their conflictual actions with those of countries with whom they have a high degree of verbal cooperation, possibly as a show of solidarity or shared strategy. For receiver influence, a positive effect would suggest that countries facing conflict from one state may also find themselves targeted by that state’s verbal allies, indicating a broader alignment in the international system.
Table 1 summarizes each of the covariates used to estimate the SIR on the material conflict variable from ICEWS.
Model specification summary for SIR.

Note: Top row shows covariates used to estimate direct effects and bottom sender and receiver influence.
3.4 Parameter Estimates
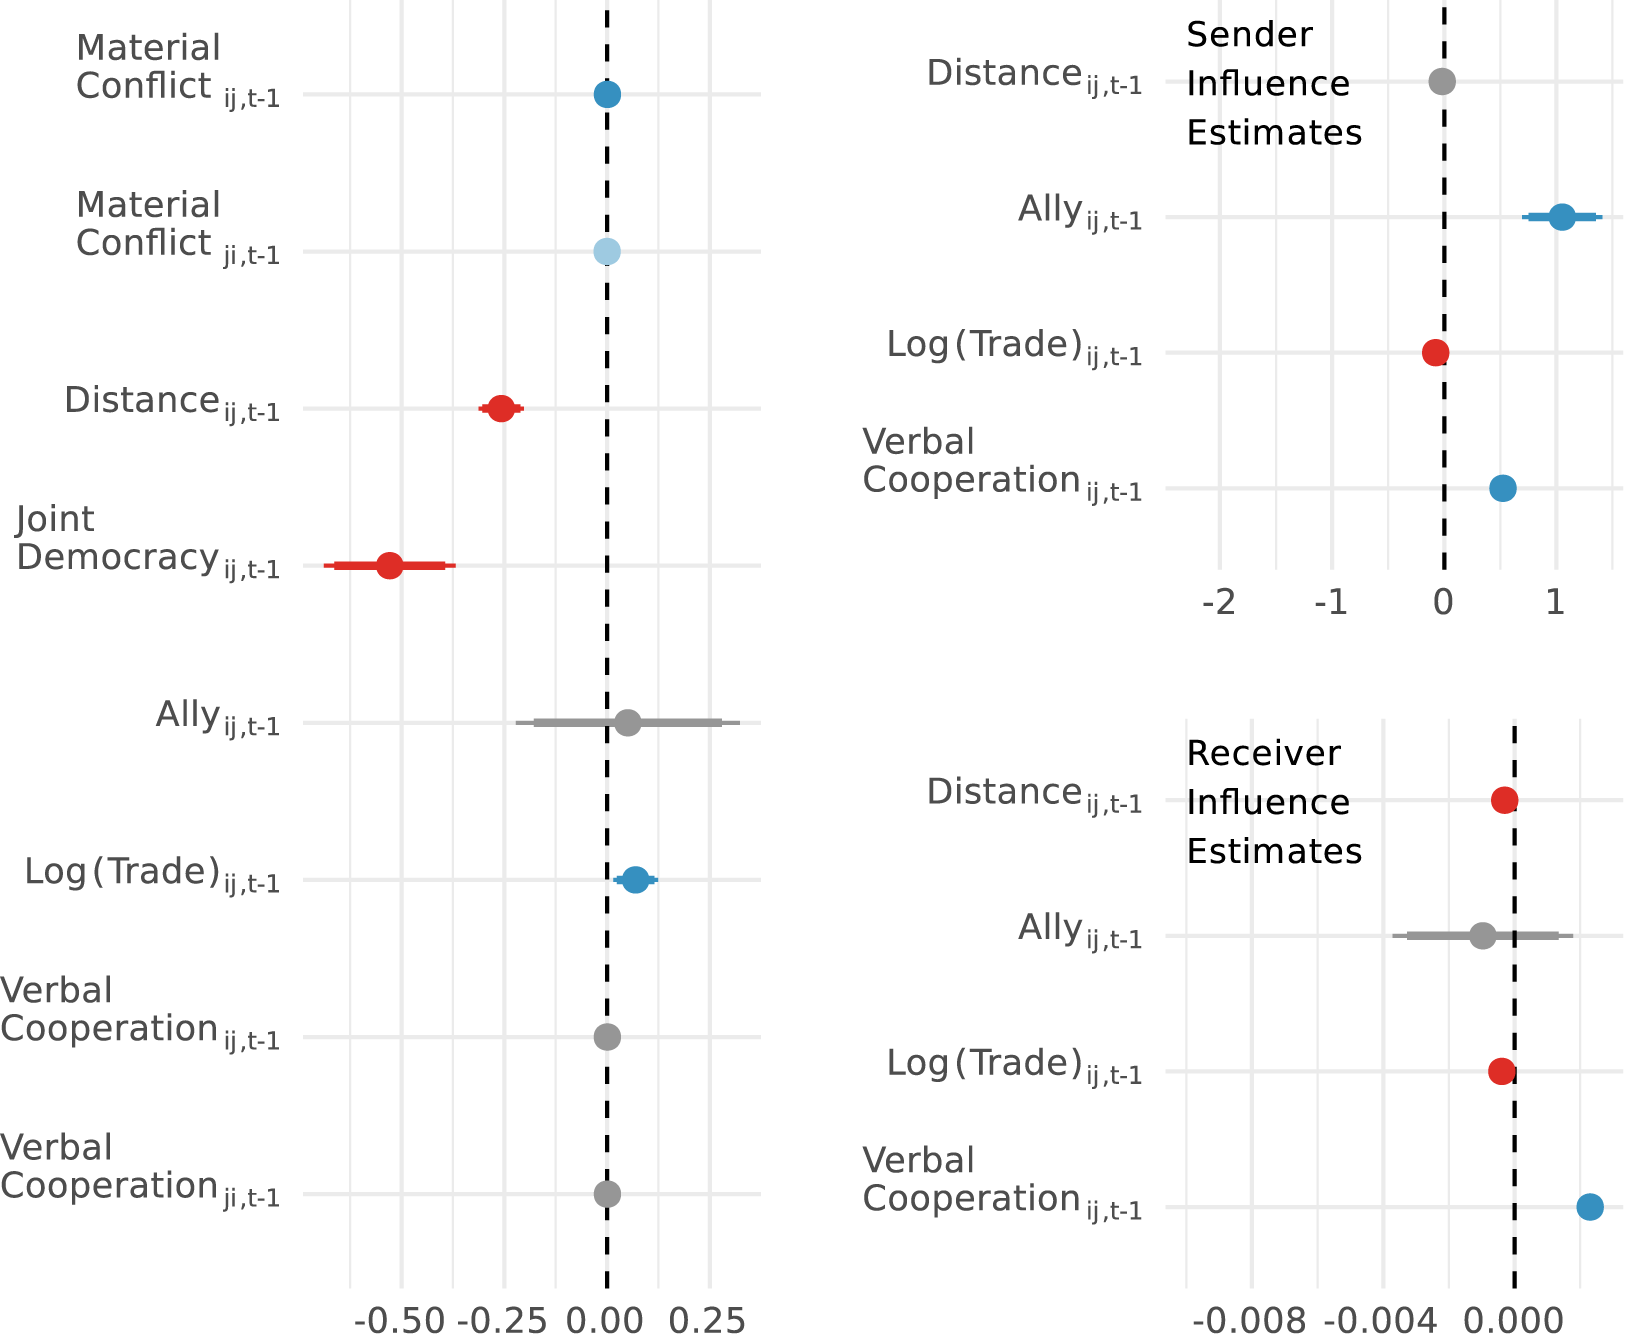
Figure 5 depicts the parameter estimates using a set of coefficient plots.Footnote 12 On the left, we summarize the estimates of the direct effect parameters. As expected, greater levels of conflict between a dyad in the last period are associated with greater levels of conflict in the present. This speaks to a finding common in the conflict literature regarding the persistence of conflicts between dyads (Brandt et al. Reference Brandt, Williams, Fordham and Pollins2000). We also find evidence that countries retaliate to conflict aggressively, though this effect is imprecisely measured. In terms of our exogenous parameters, the level of conflict between a dyad is negatively associated with the distance between them, a finding that aligns well with the extant literature.
Left-most plot shows results for the direct effect parameters and the top-right plot represents results for the sender influence, and bottom-right receiver influence parameters. Points in each of the plots represent the average effect for the parameter and the width the 90% and 95% confidence intervals. Dark shades of blue and red indicate that the parameter is significant at a 95% confidence interval and lighter shades a 90% confidence interval. Parameters that are not significant are shaded in gray.

Additionally, as is typical in the extant literature, we find that jointly democratic dyads are unlikely to engage in conflict with one another. Specifically, a coefficient of −0.53 here indicates that, holding other variables constant, dyads composed of two democracies experience about a 41% lower expected level of conflict compared to dyads that are not jointly democractic.Footnote 13 Surprisingly, however, the level of trade between countries is positively associated with the level of conflict. The divergence of this finding with some of the extant literature may be a result of a variety of factors, such as our use of a measure of conflict that has much greater variance than the militarized interstate disputes measurement from the Correlates of War dataset. At the same time, the effect is relatively small: moving from 0 to 16.49 units of logged trade (the interquartile range) increases predicted conflict by only about 22%.Footnote 14
The right-most plots focuses on sender (top) and receiver (bottom) influence patterns. Notably, the alliance sender influence parameter has a positive effect, indicating that countries tend to initiate greater levels of conflict with countries that their allies were fighting in the previous period. This finding is in line with arguments in the extant literature about the role that alliance relationships may play in leading to more conflict in the international system (Leeds Reference Leeds2005; Siverson and King Reference Siverson and King1980).
Additionally, countries are likely to send conflict to those with whom their verbal cooperation partners are initiating or increasing conflict with. This finding is interesting as it highlights that countries making cooperative statements regarding a particular country i, actually go beyond those statements in later periods to supporting i by initiating conflict with those that i was in conflict with. Trade flows, on the other hand, are associated with having a negative effect, implying that countries are not likely, and in fact somewhat unlikely, to follow their trading partners into conflict.
Receiver influence patterns are similarly determined. Trade flows and verbal cooperation have similar effects, though the interpretation here for trade is that countries are unlikely to be targeted by those that target their trading partners. Interestingly, the distance effect on the receiver influence side is more precisely measured, implying that geographically proximate countries are more likely to receive conflict from a similar set of countries.
3.5 Visualizing Dependence Patterns
Based on the sender and receiver influence parameter estimates, Figure 6 provides a visual summary of the type of dependence patterns that are implied in the context of the material conflict model estimated in the previous section.
Network visualization of influence patterns as estimated by the SIR model for June 2007. Nodes are colored by their relative geographic position and are sized by the number of influence relationships that they receive and send.

The linear combination of our influence parameter estimates ( $\alpha $
), and the design array containing sender influence variables (
$\alpha $
), and the design array containing sender influence variables ( $w_{ijt}$
) are used to visualize the sender dependence patterns between a pair of countries (
$w_{ijt}$
) are used to visualize the sender dependence patterns between a pair of countries ( $a_{ijt}$
):
$a_{ijt}$
): $a_{ijt} = \alpha ^{\top } w_{ijt}$
. The resulting sender and receiver dependence pattern are shown in Figure 6 for June 2007.Footnote 15 For the visualization on the left [right], edges between countries indicate that greater likelihood to send [receive] conflictual events to [from] the same countries. Countries are colored by their relative geographic position and node size corresponds to the number of influence relationships the country shares.
$a_{ijt} = \alpha ^{\top } w_{ijt}$
. The resulting sender and receiver dependence pattern are shown in Figure 6 for June 2007.Footnote 15 For the visualization on the left [right], edges between countries indicate that greater likelihood to send [receive] conflictual events to [from] the same countries. Countries are colored by their relative geographic position and node size corresponds to the number of influence relationships the country shares.
Since these dependence patterns are estimated directly from the model results that are presented in Figure 5, the patterns implied by that model are manifest in these visualizations. One of the more notable findings from the sender influence model is the role that alliance relationships play, and this effect is striking. For example, the USA shares sender influence ties with a number of Western European countries, such as Germany and the United Kingdom, the USA also is more likely to send conflict to actors that Australia, South Korea, and Japan have engaged in material conflict with, and many of these countries are likely to do the same.
A predictor of receiver influence patterns is the distance between countries. Countries are more likely to be targeted by the same set of countries as their neighbors. This pattern manifests itself in the bottom visualization of Figure 6, where we find clumps of countries, such as Iraq, Lebanon, and Jordan, clustering together.
3.6 Performance Comparison
A common and important argument for employing a network-based approach is that it aids in better accounting for the data generating process underlying relational data structures. Thus, in this case, the network approach should actually better predict conflict in an out-of sample test.Footnote 16 To put the performance of this model in context, we compare it to a standard GLM that does not account for dependence patterns in the network, but is similarly parameterized. Additionally, given the recent interest in machine learning methods as tools for prediction within the social sciences, we compare the performance against a generalized boosted model (GBM).
Boosting methods have become a popular approach in the machine learning to ensemble over decision tree models in a sequential manner. At each iteration, a new model is trained with respect to the error of the ensemble at that point. Friedman (Reference Friedman2001) greatly extended the learning procedure underlying boosting algorithms, by modifying the approach to choose new models at every iteration so that they would be maximally correlated with the negative gradient of some loss function relevant to the ensemble. In the case of a squared-error loss function, this would correspond to sequentially fitting the residuals. We use a generalized version of this model developed by Ridgeway (Reference Ridgeway2012) that extends this framework to the estimation of a variety of distribution types—in our case, a Poisson regression model. In general, these types of models have been shown to give substantial predictive advantage over alternative methods, such as GLM, and should provide a useful point of comparison.Footnote 17
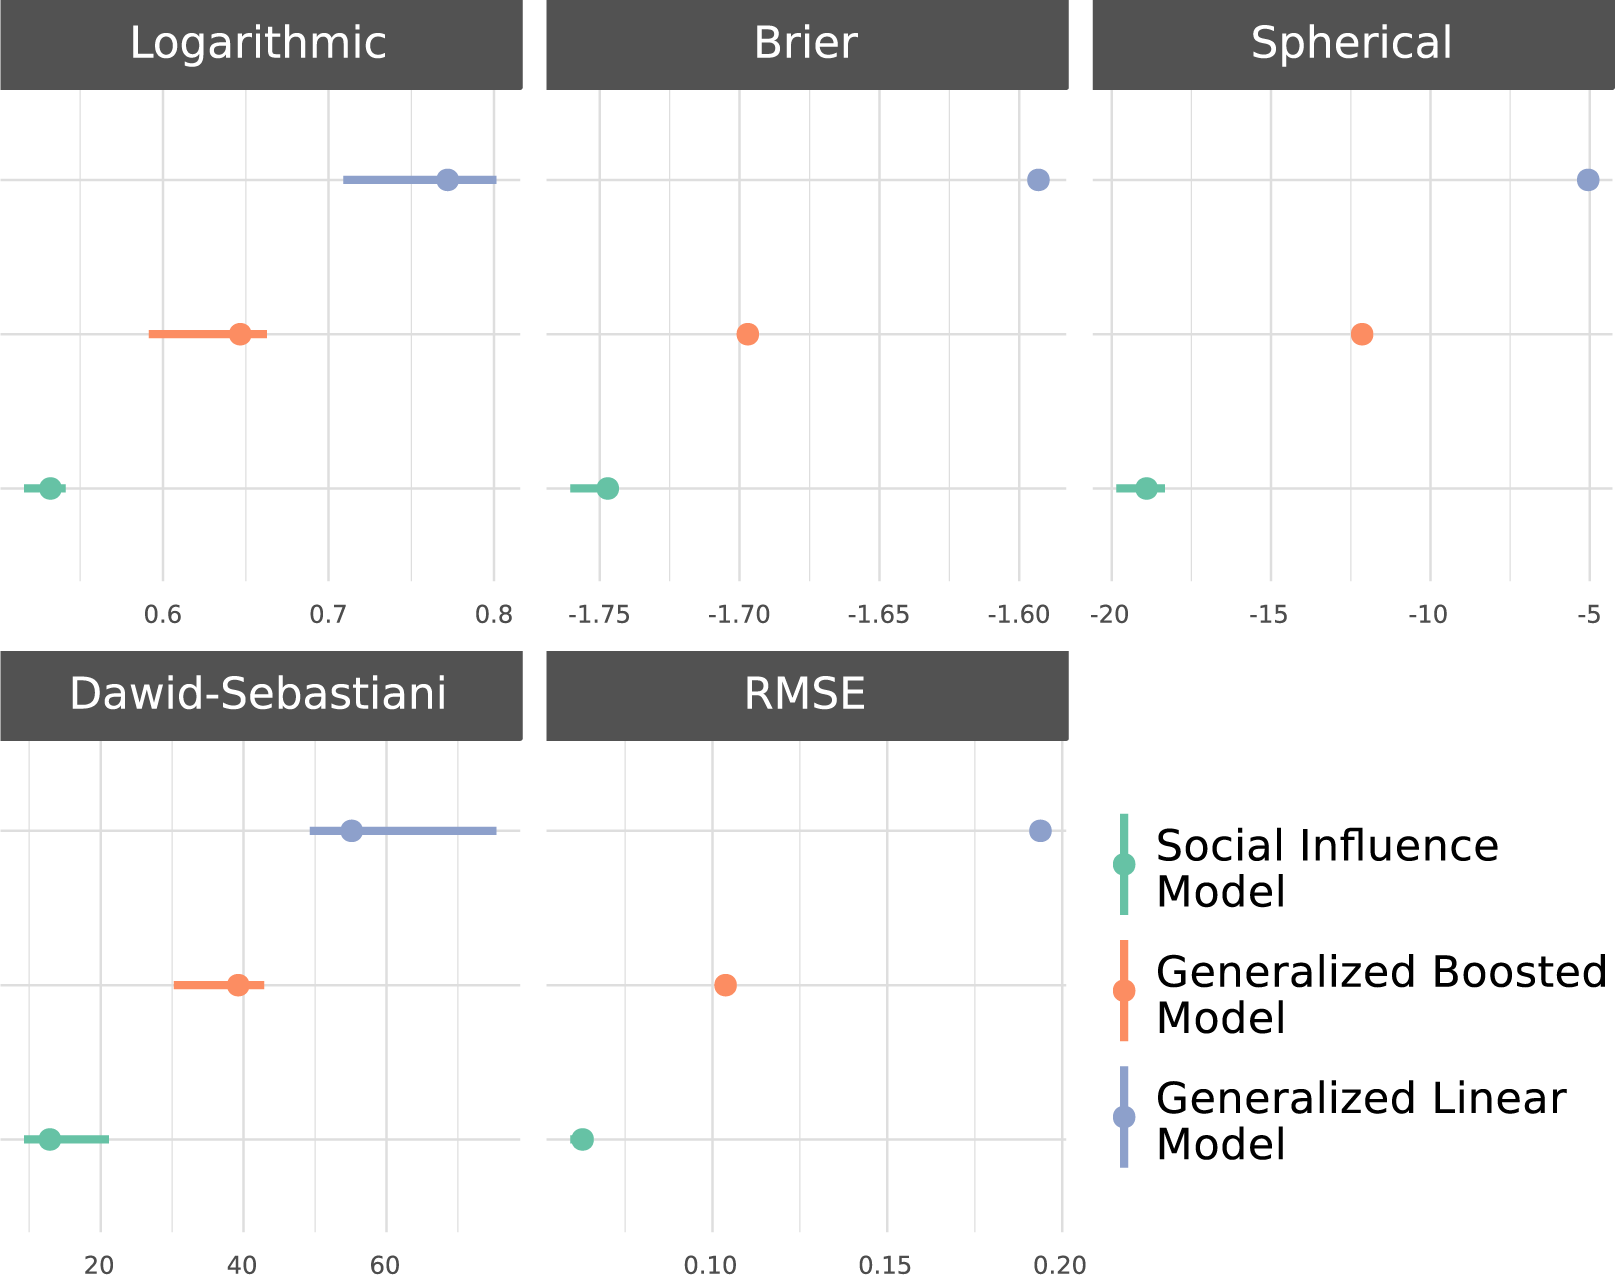
Performance comparison based on randomly excluding time slices from the material conflict array. Colors designate the different models, and the average score across the 10-fold cross validation is designated by a circle and the range by a horizontal line.

To compare these approaches, we first utilize a cross-validation procedure. This involves first randomly dividing T time points in our relational array into $k=10$
sets and within each set we set randomly exclude five time slices from our material conflict array. We then run our models and predict the five missing slices from the estimated parameters. Proper scoring rules are used to compare predictions. Scoring rules evaluate forecasts through the assignment of a numerical score based on the predictive distribution and on the actual value of the dependent variable. Czado, Gneiting, and Held (Reference Czado, Gneiting and Held2009) discuss a number of such rules that can be used for count data: Brier, Dawid-Sebastiani, Logarithmic, and Spherical scores.Footnote 18 For each of these rules, lower values on the metric indicate better performance.
$k=10$
sets and within each set we set randomly exclude five time slices from our material conflict array. We then run our models and predict the five missing slices from the estimated parameters. Proper scoring rules are used to compare predictions. Scoring rules evaluate forecasts through the assignment of a numerical score based on the predictive distribution and on the actual value of the dependent variable. Czado, Gneiting, and Held (Reference Czado, Gneiting and Held2009) discuss a number of such rules that can be used for count data: Brier, Dawid-Sebastiani, Logarithmic, and Spherical scores.Footnote 18 For each of these rules, lower values on the metric indicate better performance.
Figure 7 illustrates differences in the performance between the social influence model, GLM, and GBM across the scoring rules mentioned above and a more standard metric, the RMSE. In the case of each of these metrics, we find GLM performs the worst and that the social influence model performs the best.
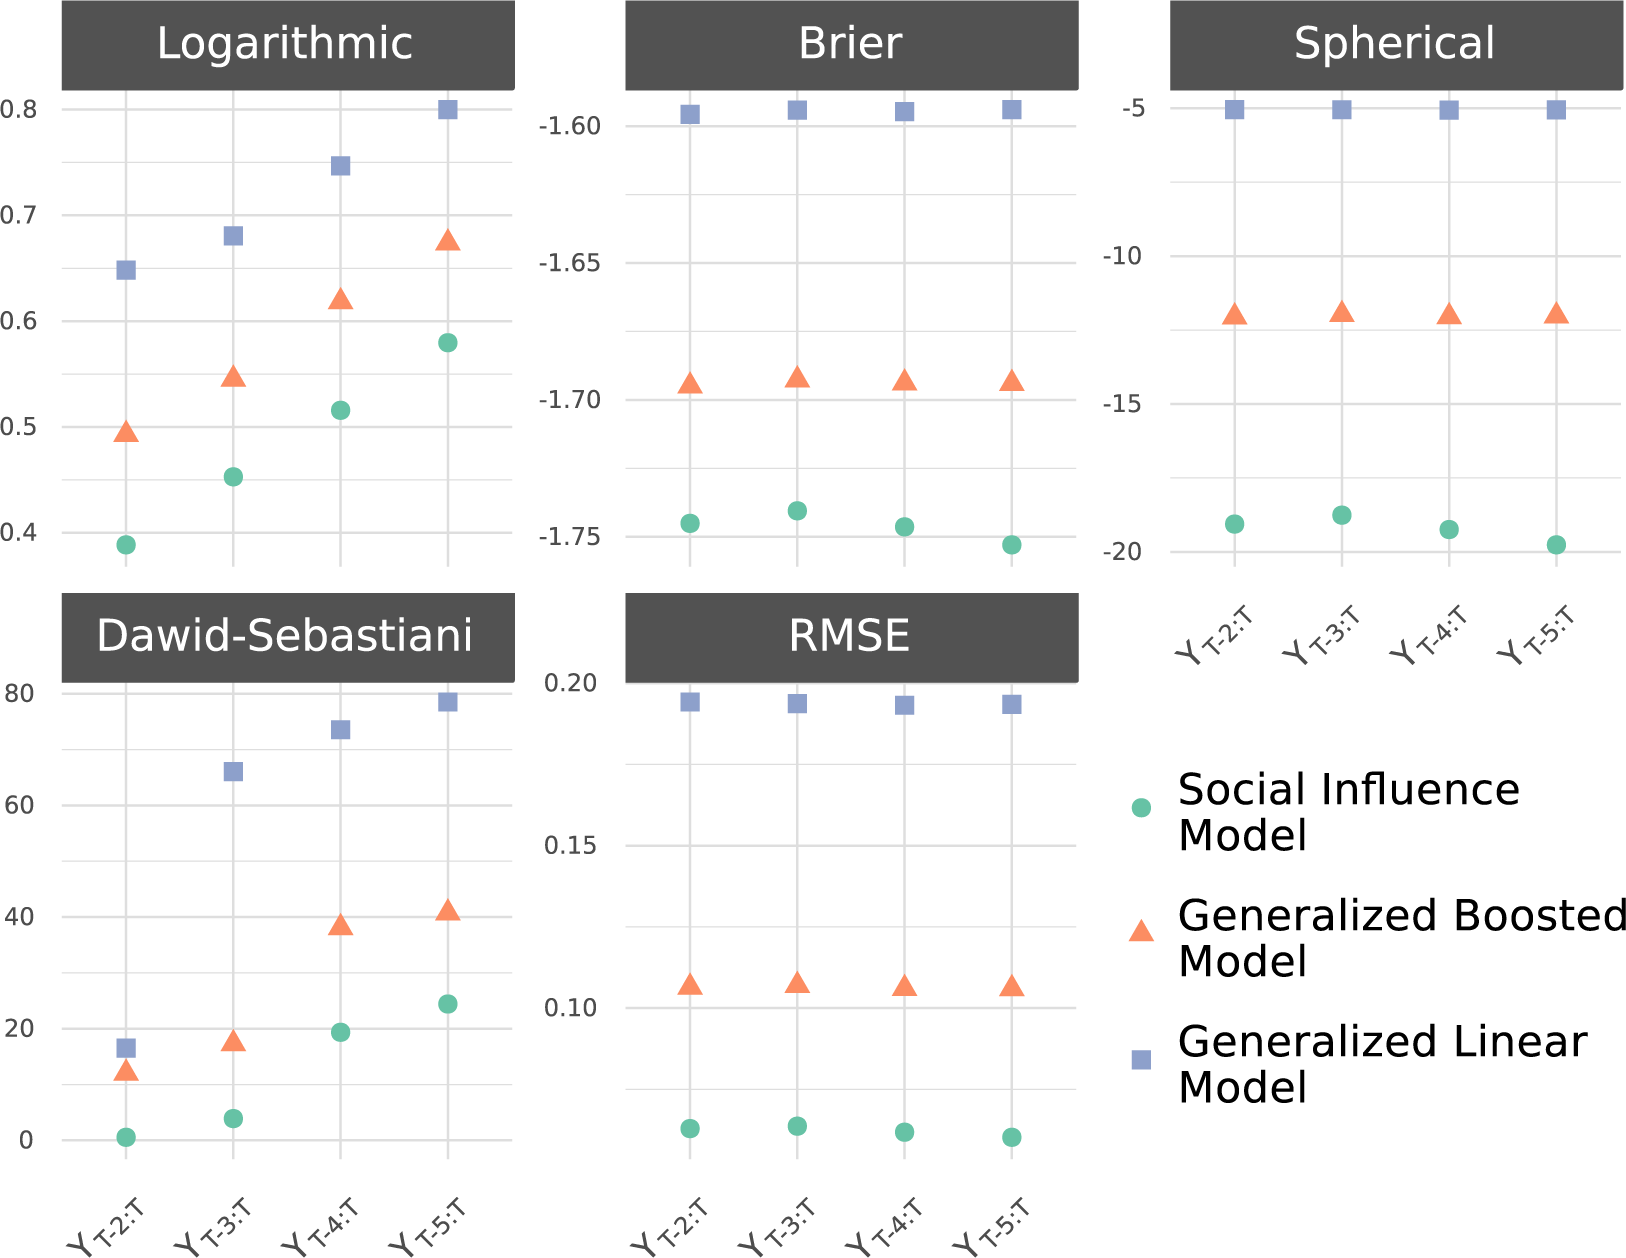
We also assess the predictive accuracy of our models in a forecasting context. We perform such an exercise as well by dividing up our sample into a training and test set, where the test set corresponds to the last x periods in the data that we have available. We vary x from 2 to 5. For instance, when $x=5$
we are leaving the last five years of data for validation. Results for this analysis are shown in Figure 8 and there again we find that the social influence model has better out of sample predictive performance than the alternatives we test here.
$x=5$
we are leaving the last five years of data for validation. Results for this analysis are shown in Figure 8 and there again we find that the social influence model has better out of sample predictive performance than the alternatives we test here.
Performance comparison based on randomly excluding the last two to five periods of the material conflict array. Colors and shapes designate the different models, and the score when excluding x number of periods is shown.

4 Conclusion
In this paper, we introduced the SIR model, which represents an important extension of the bilinear network autoregression framework, designed to more effectively capture and explain influence dynamics within networks. The SIR model addresses a key limitation of existing models by incorporating exogenous covariates into the estimation process, allowing us to directly model and interpret the factors driving influence within a network. This approach not only enhances the explanatory power of the model but also provides a more rigorous and theoretically grounded framework for understanding complex relational data. A key contribution of our work is the development of a more efficient estimation scheme for the SIR model. Using an iterative block coordinate descent method, we enhance the model’s computational feasibility, especially for large-scale networks.
The application of the SIR model to the study of material conflict between countries provided several important insights that underscore the model’s practical utility. By incorporating covariates, such as geographic proximity, alliances, trade, and verbal cooperation, the SIR model revealed nuanced patterns of influence within the international conflict network. For example, the model identified that countries tend to initiate conflicts against the same targets as their allies, a finding that aligns with established theories in international relations about the role of alliances in escalating conflicts. Additionally, the negative influence of trade flows on conflict initiation suggested that countries are less likely to follow their trading partners into conflict, highlighting the stabilizing effect of economic interdependence. Verbal cooperation was shown to have a reinforcing effect, where countries that publicly support each other are more likely to align their conflictual actions. These findings not only validate the robustness of the SIR model but also demonstrate its ability to generate new theoretical and empirical insights into the dynamics of international conflict, providing a clearer understanding of the factors driving influence within complex networks.
Looking forward, the SIR model opens up numerous avenues for future research, both in terms of its applications and methodological developments. The model’s flexibility allows it to be adapted to various network contexts beyond international conflict. Methodologically, there are several promising directions for refinement and extension. One area for development is the further optimization of the block coordinate descent method, particularly for handling even larger and more complex networks. This could involve parallelizing the estimation process or incorporating advanced optimization techniques, such as stochastic gradient descent to improve scalability and convergence speed.
Acknowledgments
We acknowledge the invaluable contributions of our late coauthor, Michael D. Ward, who played a crucial role in the early drafts of this paper. His insights and mentorship were instrumental in shaping the direction of this work.
Funding Statement
This work was supported by the National Science Foundation [Award 2017180 to S.M., Award 1505136 to P.H.].
Data Availability Statement
Replication code for this article is available at Minhas and Hoff (Reference Minhas and Hoff2025). A preservation copy of the same code and data can also be accessed via Dataverse at https://doi.org/10.7910/DVN/VTFDX6.
Author Contributions
All authors contributed to the mathematical analysis, statistical simulations, and empirical statistical analyses.
Competing Interests
The authors declare no competing interests.
Ethical Standards
The authors affirm that this research did not involve human subjects.
Supplementary Material
For supplementary material accompanying this paper, please visit https://doi.org/10.1017/pan.2025.10013.


 Open access