

Schizophrenia is a severe psychiatric disorder with high heritability estimatesReference Lichtenstein, Yip, Bjork, Pawitan, Cannon and Sullivan1,Reference Sullivan, Kendler and Neale2 and polygenic inheritance.3 Despite the identification of common genetic variants through large genome-wide association studies (GWAS), little is known about the relation between DNA variants, gene expression and the clinical manifestations of the disorder. We have previously demonstrated that expression levels of candidate genes identified through GWAS, such as NOTCH4, TCF4 and ANK3, are significantly altered in schizophrenia and bipolar disorder,Reference Dieset, Djurovic, Tesli, Hope, Mattingsdal and Michelsen4–Reference Wirgenes, Tesli, Inderhaug, Athanasiu, Agartz and Melle6 thus providing evidence that mRNA levels in blood might be a useful marker for further exploration of underlying disease mechanisms. Among the most consistently reported schizophrenia risk genetic variants are single nucleotide polymorphisms (SNPs) in vaccinia-related kinase 2 (VRK2).3,Reference Li, Wang, Zheng, Ikeda, Iwata and Luo7,Reference Steinberg, de Jong, Irish Schizophrenia Genomics, Andreassen, Werge and Borglum8 Although one family study implicated a rare VRK2 variant in bipolar disorder,Reference Kerner, Rao, Christensen, Dandekar, Yourshaw and Nelson9 stronger associations have been found in schizophrenia.3,10 The VRK2 gene (chromosome 2p16) encodes a protein in the VRK family of serine/threonine protein kinases, first identified in highly proliferative cells, such as testis, thymus and fetal liver,Reference Nezu, Oku, Jones and Shimane11 and later shown to be expressed in human brain, through all stages of life (http://braincloud.jhmi.edu/). The VRK2 protein has been found to be involved in signaling pathways regulating apoptosis, tumor cell growthReference Monsalve, Merced, Fernandez, Blanco, Vazquez-Cedeira and Lazo12 and the immune response,Reference Blanco, Sanz-Garcia, Santos and Lazo13 and could be relevant for neurological diseases.Reference Sanz-Garcia, Vazquez-Cedeira, Kellerman, Renbaum, Levy-Lahad and Lazo14 In particular, variants in VRK2 have been associated with epilepsy.Reference Helbig and Lowenstein15 These findings are of interest in the light of the associations found between immune-related genes in the major histocompatibility complex region at chromosome 6 and schizophrenia,3 and the polygenic overlap between schizophrenia and neurological disorders.Reference Andreassen, Harbo, Wang, Thompson, Schork and Mattingsdal16 However, the relation between identified VRK2 schizophrenia risk SNPs, VRK2 mRNA level and the clinical phenotype remains to be elucidated. One study reported altered VRK2 expression in blood cells of patients with schizophrenia (n = 20) compared with healthy controls (n = 18), but the result was only trend significant and no expression quantitative trait loci (eQTL) were identified.Reference Li, Wang, Zheng, Ikeda, Iwata and Luo7
We aimed to identify any abnormal VRK2 mRNA blood levels in schizophrenia compared with healthy controls. Further, we wanted to determine potential diagnostic specificity by comparing schizophrenia with psychosis not otherwise specified (PNOS) and bipolar disorder, as PNOS can be regarded as a less severe schizophrenia spectrum disorderReference Kendler and Walsh17,Reference Tesli, Espeseth, Bettella, Mattingsdal, Aas and Melle18 and bipolar disorder shares clinical features and genetic risk with schizophrenia.Reference Tesli, Espeseth, Bettella, Mattingsdal, Aas and Melle18–20 Additionally, we performed association analyses between SNPs in the VRK2 region and mRNA level, to identify cis-acting eQTLs.
Method
Sample characteristics
Our sample consisted of 652 individuals, organised into the diagnostic categories schizophrenia, bipolar disorder, PNOS and healthy controls. The schizophrenia category (n = 201) (SZ group) included the subcategories schizophrenia (n = 158), schizophreni-form disorder (n = 17) and schizoaffective disorder (n = 26). The bipolar disorder category (n = 167) (BD group) included bipolar disorder type 1 (n = 103), bipolar disorder type 2 (n = 51) and bipolar disorder not otherwise specified (BDNOS) (n = 13). The PNOS category included 61 individuals, and 223 participants were included in the healthy control category (CTR group). The patients were diagnosed according to the Structured Clinical Interview for DSM-III-R (SCIDReference Spitzer, Williams, Gibbon and First21). Overall, 78 patients (75.7%) with bipolar disorder type 1, 11 patients (21.6%) with bipolar disorder type 2 and 8 patients (61.5%) with BDNOS had experienced at least one Structural Clinical Interview for DSM-III-R SCID-verified psychotic episode. Healthy controls were randomly recruited from the same catchment area as the patients, and underwent an interview where demographic and clinical information was obtained. Our sample consisted of White Northern European participants (mainly Norwegians). We have previously demonstrated our sample to be genetically homogeneous, based on linkage clustering as well as self-reports on ancestry.Reference Wirgenes, Tesli, Inderhaug, Athanasiu, Agartz and Melle6,Reference Athanasiu, Mattingsdal, Kahler, Brown, Gustafsson and Agartz22,Reference Djurovic, Gustafsson, Mattingsdal, Athanasiu, Bjella and Tesli23 Clinical evaluation of the patients and healthy controls participating in this study is described in detail in previous reports.Reference Wirgenes, Tesli, Inderhaug, Athanasiu, Agartz and Melle6 Demographical data are shown in Table 1.
Demographics and clinical characteristics

| ANOVA/χ2 analysis | |||||||
|---|---|---|---|---|---|---|---|
| SZ group (n = 201) | BD groupa (n = 167) | PNOS group (n = 61) | CTR group (n = 223) | F/χ2 | P | Post-hoc | |
| Female, % | 38.3 | 62.9 | 39.3 | 44.8 | χ2 = 24.8 | < 0.001 | – |
| Age, years: mean (s.d.) | 30.9 (9.6) | 34.3 (11.5) | 32.8 (10.3) | 33.1 (9.3) | F = 3.3 | 0.020 | (BD > SZ) |
| Age at onset, years: mean (s.d.) | 23.3 (8.3) | 23.6 (10.1) | 27.2 (10.2) | – | F = 3.8 | 0.022 | (PNOS > BD,SZ) |
| GAF symptom, mean (s.d.) | 40.8 (11.0) | 55.7 (11.3) | 50.0 (14.1) | – | F = −72.0 | < 0.001 | (BD > PNOS > SZ) |
| GAF function, mean (s.d.) | 41.9 (9.9) | 53.2 (12.4) | 52.6 (14.9) | – | F = −44.3 | < 0.001 | (BD,PNOS > SZ) |
| PANSS positive, mean (s.d.) | 15.6 (5.4) | 10.0 (3.6) | 12.7 (4.1) | – | F = 63.6 | < 0.001 | (SZ > PNOS > BD) |
| PANSS negative, mean (s.d.) | 16.1 (6.2) | 10.5 (3.7) | 11.7 (5.1) | – | F = 51.0 | < 0.001 | (SZ > PNOS,BD) |
| PANSS total, mean (s.d.) | 65.0 (16.8) | 46.4 (10.9) | 53.7 (14.5) | – | F = 71.6 | < 0.001 | (SZ > PNOS > BD) |
| IDS, mean (s.d.) | 17.5 (11.9) | 17.4 (12.8) | 15.2 (11.4) | – | – | – | – |
| YMRS, mean (s.d.) | 6.1 (5.1) | 3.0 (4.0) | 4.0 (4.1) | – | F = 19.1 | < 0.001 | (SZ > PNOS,BD) |
| Nicotine,b % | 57.9 | 58.8 | 54.4 | – | – | – | – |
| AUDIT,c mean (s.d.) | 6.4 (6.6) | 7.7 (6.3) | 8.2 (7.9) | 5.4 (3.0) | F = 5.1 | 0.002 | (PNOS,BD > SZ,CTR) |
| DUDIT,d mean (s.d) | 2.5 (5.9) | 2.5 (6.3) | 4.7 (8.0) | 0.2 (0.8) | F = 11.0 | < 0.001 | (PNOS,SZ,BD > CTR) |
| Medication status, % | |||||||
| Medicated | 90.7 | 83.9 | 78.9 | – | F = 3.2 | 0.040 | – |
| Antipsychotics | 77.1 | 49.7 | 67.2 | – | F = 16.2 | < 0.001 | (SZ,PNOS > BD) |
| Lithium | 2.5 | 14.4 | 0.0 | – | F = 13.5 | < 0.001 | (BD > SZ,PNOS) |
| Anticonvulsants | 17.4 | 42.5 | 9.8 | – | F = 21.6 | < 0.001 | (BD > SZ,PNOS) |
| Antidepressants | 25.4 | 38.3 | 34.4 | – | F = 3.7 | 0.026 | (BD > SZ) |
| Hypnotics | 14.4 | 12.0 | 4.9 | – | – | – | – |
| Psychostimulants | 0.0 | 1.2 | 1.6 | – | – | – | – |
SZ, schizophrenia; BD, bipolar disorder; PNOS, psychotic disorder not otherwise specified; CTR, healthy controls; PANSS, Positive and Negative Syndrome Scale;Reference Kay, Fiszbein and Opler29 IDS, Inventory of Depressive Symptomatology;Reference Rush, Gullian, Basco, Jarrett and Trivedi30 GAF, Global Assessment of Functioning;Reference Endicott, Spitzer, Fleiss and Cohen31 YMRS, Young Mania Rating Scale;Reference Young, Biggs, Ziegler and Meyer32 AUDIT, Alcohol Use Disorders Identification Test; DUDIT, Drug Use Disorders Identification Test.
a. n = 103 bipolar disorder type I (61.7%); n = 51 bipolar disorder type II (30.6%) and n = 13 bipolar disorder not otherwise specified (7.8%).
b. Daily use of nicotine.
c. Past 12 months, problematic use defined as score ⩾8 in males and ⩾7 in females.
d. Past 12 months, problematic use defined as score ⩾6 in males.
The Norwegian Scientific Ethical Committees and the Norwegian Data Protection Agency approved the study. All participants have given written informed consent prior to inclusion into the project.
RNA measurement
Blood samples were collected using Tempus Blood RNA Tubes (Life Technologies Corporation, Carlsbad, California, USA). Total RNA was extracted with ABI PRISM 6100 Nucleic Acid PrepStation (Life Technologies Corporation, Carlsbad, California, USA) and TEMPUS 12-port RNA Isolation Kit according to the manufacturer's protocol. High-Capacity cDNA Reverse Transcription Kit (Life Technologies Corporation, Carlsbad, California, USA) was used for reverse transcription of 1 μg RNA. Quantitative reverse transcriptase polymerase chain reaction was performed on ABI PRISM 7900HT Sequence Detection System by using TaqMan Gene Expression Assays (VRK2: Hs00241738_m1; Life Technologies Corporation, Carlsbad, California, USA) and the gene ACTB (Hs99999903_m1; Life Technologies Corporation, Carlsbad, California, USA) was used as endogenous control. We analysed the expression stability of 16 endogenous control genes in 16 samples (4 healthy controls, 4 bipolar disorder, 4 schizophrenia and 4 PNOS) using the geNorm method.Reference Hellemans, Mortier, De Paepe, Speleman and Vandesompele24 We found that all tested endogenous controls to be below the recommend M-value cutoff of 0.5 and ACTB is one of the most stable of these (see Fig. DS1 in the online supplement). The instruction protocol from the manufacturer was strictly followed. The results were processed in RQ Manager 1.2.1. VRK2 mRNA ÄCt (cycling threshold) in each individual was calibrated against mean VRK2 mRNA ΔCt in the CTR group. The following formula was used for statistical analyses in this report: 2(−ΔΔCt), as described previously.Reference Wirgenes, Tesli, Inderhaug, Athanasiu, Agartz and Melle6
Genotyping and SNP selection
The sample was genotyped at Expression Analysis (Durham, North Carolina, USA) using the Affymetrix Genome-Wide Human SNP array 6.0 (Affymetrix, Santa Clara, California, USA). Quality control was performed using PLINK (version 1.07; http://pngu.mgh.harvard.edu/purcell/plink/).Reference Purcell, Neale, Todd-Brown, Thomas, Ferreira and Bender25 Overall, significant plate-specific markers were set to missing (in that plate). One of two duplicates, one of two relatives (identity by descent >0.1875), samples with a reported gender differing from that determined by X chromosome marker homozygosity, mixup-samples (as calculated by pairwise genome-wide identity by state), samples with non-European ancestry (as calculated with HapMap3 (Wellcome Trust Sanger Institute, Cambridge, UK) and multidimensional scaling) and samples with individual genotyping below 95%, were excluded. SNPs were excluded if they had minor allele frequency <1%, low yield (<95%) or deviated from Hardy–Weinberg equilibrium (P<0.001).
MACH imputed data
Candidate SNPs were imputed with MACHReference Li, Willer, Ding, Scheet and Abecasis26 using the European samples available in the Phase I release of the 1000 Genomes Project (www.sph.umich.edu/csg/abecasis/MACH/download/1000G-PhaseI-Interim.html) after the quality control described above. In addition, all SNPs not present in the 1000 Genomes reference, as well as all SNPs where strand alignment was ambiguous (A/T and G/C SNPs), were removed from the sample data-sets. Imputations were carried out in a three-stage process using the ChunkChromosome (http://genome.sph.umich.edu/wiki/ChunkChromosome), MACH (www.sph.umich.edu/csg/abecasis/MaCH/download/) and minimac programs (http://genome.sph.umich.edu/wiki/Minimac). First, the data-sets were broken into 2500 SNP pieces, with 500 SNP overlap using ChunkChromosome. Second, each piece was phased using MACH (40 rounds, 400 states). Third, each phased piece was imputed to the 1000 Genomes European reference panel using minimac (20 rounds, 400 states). Minimac provides an estimated r 2 score that provides a quality metric for each imputed SNP. All SNPs with r 2<0.5 were excluded from further analysis leaving 9 584 802 SNPs. 1566 imputed VRK2 SNPs based on UCSC (hg 19) Chr2: 57,900–58,600 were extracted for inclusion in the current analyses. This region was selected to cover all risk SNPs from the Psychiatric Genomics Consortium schizophrenia case–control study3 in and around the VRK2 gene (based on summary statistics from www.broadinstitute.org/mpg/ricopili/).
Statistical analyses
VRK2 mRNA across diagnostic categories
Using IBM's SPSS software package for Windows, version 21, differences in VRK2 mRNA levels between the diagnostic categories (bipolar disorder, schizophrenia, PNOS and healthy controls) were investigated with an ANOVA model, followed by pairwise comparisons adjusted with the Tukey method. Seven individuals were removed owing to deviant VRK2 mRNA levels defined as 3 standard deviations from the mean. Post-hoc analyses were performed with age, gender, alcohol use (Alcohol Use Disorders Identification Test, AUDIT)Reference Bohn, Babor and Kranzler27 and illegal drug use (Drug Use Disorders Identification Test, DUDIT)Reference Berman, Bergman, Palmstierna and Schlyter28 as covariates in an ANCOVA model in the total sample. Additionally, medication status (dichotomised because of non-normal distribution) for antipsychotics, antidepressants, anticonvulsants, lithium, hypnotics and psychostimulants were regressed against VRK2 mRNA level within the patients in a multiple hierarchical regression model with diagnostic category, gender and age as covariates. The same procedure was undertaken for daily use of nicotine (yes/no), as this information was not available in the CTR group. Effect sizes (Nagelkerke R 2) for the significant differences in mRNA level for pairwise comparisons between the BD, SZ, PNOS and CTR groups were estimated with logistic regressions. To assess the consistency of the findings, ANOVA analyses were undertaken in the diagnostic subcategories, as well as in males and females separately for the main diagnostic categories. Additionally, potential difference in VRK2 mRNA level between bipolar disorder with psychotic symptoms and bipolar disorder without psychotic symptoms was assessed with a t-test.
Genetic associations with VRK2 mRNA levels
Association analyses between 1566 imputed VRK2 SNPs and mRNA levels were performed with a linear regression model in PLINK (version 1.07; http://pngu.mgh.harvard.edu/purcell/plink/).Reference Purcell, Neale, Todd-Brown, Thomas, Ferreira and Bender25 These analyses were conducted in the total sample and in the BD, SZ, PNOS and CTR groups separately, with gender and age as covariates, as well as diagnostic category in the total sample. Gene-wide significance threshold for association between 1566 VRK2 SNPs and VRK2 mRNA was computed with the aid of matSpDReference Li and Ji33 taking into account the SNP correlations reflected by the sample's linkage disequilibrium structure in the region of interest. The effective number (n = 174) of independent tests was computed using Li's procedure. Total sample size for these analyses after quality control procedures was 575 (schizophrenia, n = 169; bipolar disorder, n = 146; PNOS, n = 50; healthy controls, n = 210).
Results
VRK2 mRNA levels across diagnostic categories
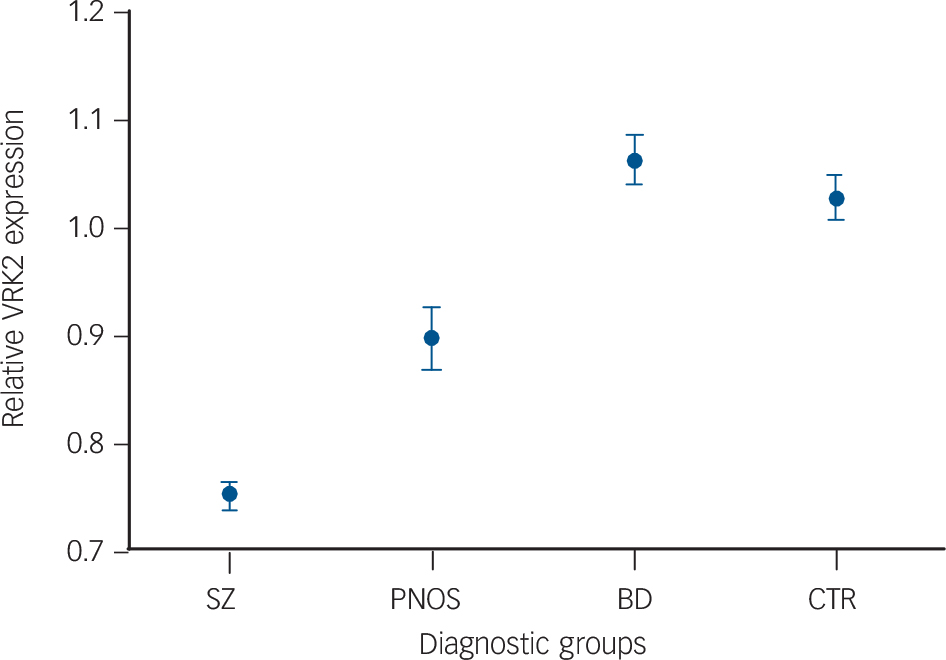
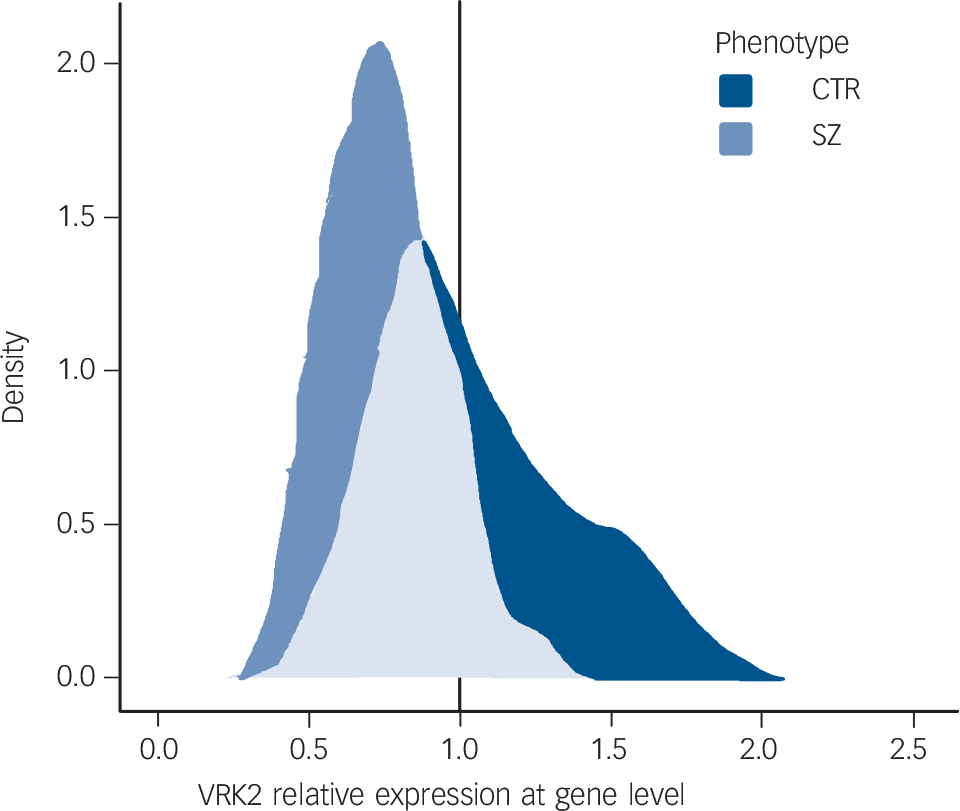
VRK2 mRNA levels differ significantly between the SZ, BD, PNOS and CTR groups (ANOVA, F = 53.6, d.f. = 3, 648, P = 5.8×10⁻³¹) (Fig. 1 and Table 2). Pairwise comparisons reveal significantly lower VRK2 mRNA levels in the SZ group than the CTR (P<10−12, Nagelkerke R 2 = 0.30), BD (P<10−12, Nagelkerke R 2 = 0.42) and PNOS groups (P = 0.0011, Nagelkerke R 2 = 0.13), and significantly lower levels in PNOS than healthy controls (P = 0.0042, Nagelkerke R 2 = 0.051) and bipolar disorder (P = 0.00026, Nagelkerke R 2 = 0.11). Results from the post-hoc analyses (ANCOVA) remain largely unchanged after controlling for gender, age, alcohol and drug use (online Table DS1). There are no significant effects of antipsychotics, anticonvulsants, lithium, hypnotics or psychostimulants on VRK2 mRNA level within the patients. Antidepressants are associated with lower VRK2 mRNA levels (P = 0.007), but this cannot explain the effect of diagnostic category on VRK2 mRNA level, as more patients with bipolar disorder than those with schizophrenia used antidepressants (Table 1). Smoking status does not influence VRK2 mRNA levels within the patients. ANOVA analyses show a consistent pattern for the diagnostic subcategories compared with the main categories (online Fig. DS1 and Table DS2). Further, the results remain largely the same when analysed in males and females separately (online Table DS3). There were no significant differences in VRK2 mRNA level between bipolar disorder with psychotic symptoms and bipolar disorder without psychotic symptoms. In addition to significant differences in mean expression level between the diagnostic categories, the range of the distributions are only partially overlapping (Fig. 2), with no individuals with schizophrenia with relative expression value above 1.3, whereas 45 healthy controls (20.2%) and 25 patients with bipolar disorder (15.0%) have such expression levels. Moreover, only 18 individuals with schizophrenia have an expression value above 1.0 (9.0%), whereas 96 individuals with bipolar disorder (57.5%) and 99 healthy controls (44.4%) have a value above 1.0 (online Fig. DS3).
VRK2 mRNA expression levels (mean value one standard error) according to diagnostic category.
VRK2 mRNA levels are significantly lower in schizophrenia (SZ) than healthy controls (CTR) (P<10−12), bipolar disorder (BD) (P<10−12) and psychosis not otherwise specified (PNOS) (P = 0.0011), and significantly lower in PNOS than CTR (P = 0.0042) and BD (P = 0.00026).

Density plot for VRK2 expression in schizophrenia and healthy controls.
Smooth density estimate computed with 1d kernelReference Wickham35 using relative expression levels of VRK2 for the following diagnostic categories: schizophrenia (SZ) (n = 201) and healthy controls (CTR) (n = 223).

Results from ANOVA pairwise comparisons of VRK2 mRNA level across diagnostic categoriesa

| 95% confidence Interval | |||||
|---|---|---|---|---|---|
| Diagnostic category | Mean difference | s.e. | P | Lower limit | Upper limit |
| CTR | |||||
| SZ | 0.28 | 0.026 | < 10−12 | 0.21 | 0.34 |
| BD | −0.034 | 0.027 | 0.60 | −0.10 | 0.036 |
| PNOS | 0.13 | 0.038 | 0.0042 | 0.031 | 0.23 |
| SZ | |||||
| CTR | −0.28 | 0.026 | < 10−12 | −0.34 | −0.21 |
| BD | −0.31 | 0.028 | < 10−12 | −0.38 | −0.24 |
| PNOS | −0.15 | 0.034 | 0.0011 | −0.25 | −0.045 |
| BD | |||||
| CTR | 0.034 | 0.027 | 0.60 | −0.036 | 0.10 |
| SZ | 0.31 | 0.028 | < 10−12 | 0.24 | 0.38 |
| PNOS | 0.16 | 0.040 | 0.00026 | 0.061 | 0.27 |
| PNOS | |||||
| CTR | −0.13 | 0.038 | 0.0042 | −0.23 | −0.031 |
| SZ | 0.15 | 0.039 | 0.0011 | 0.045 | 0.25 |
| BD | −0.16 | 0.040 | 0.00026 | −0.27 | −0.061 |
SZ, schizophrenia; BD, bipolar disorder; PNOS, psychotic disorder not otherwise specified; CTR, healthy controls.
a. Correction pairwise comparison = Tukey.
Genetic associations with VRK2 mRNA levels
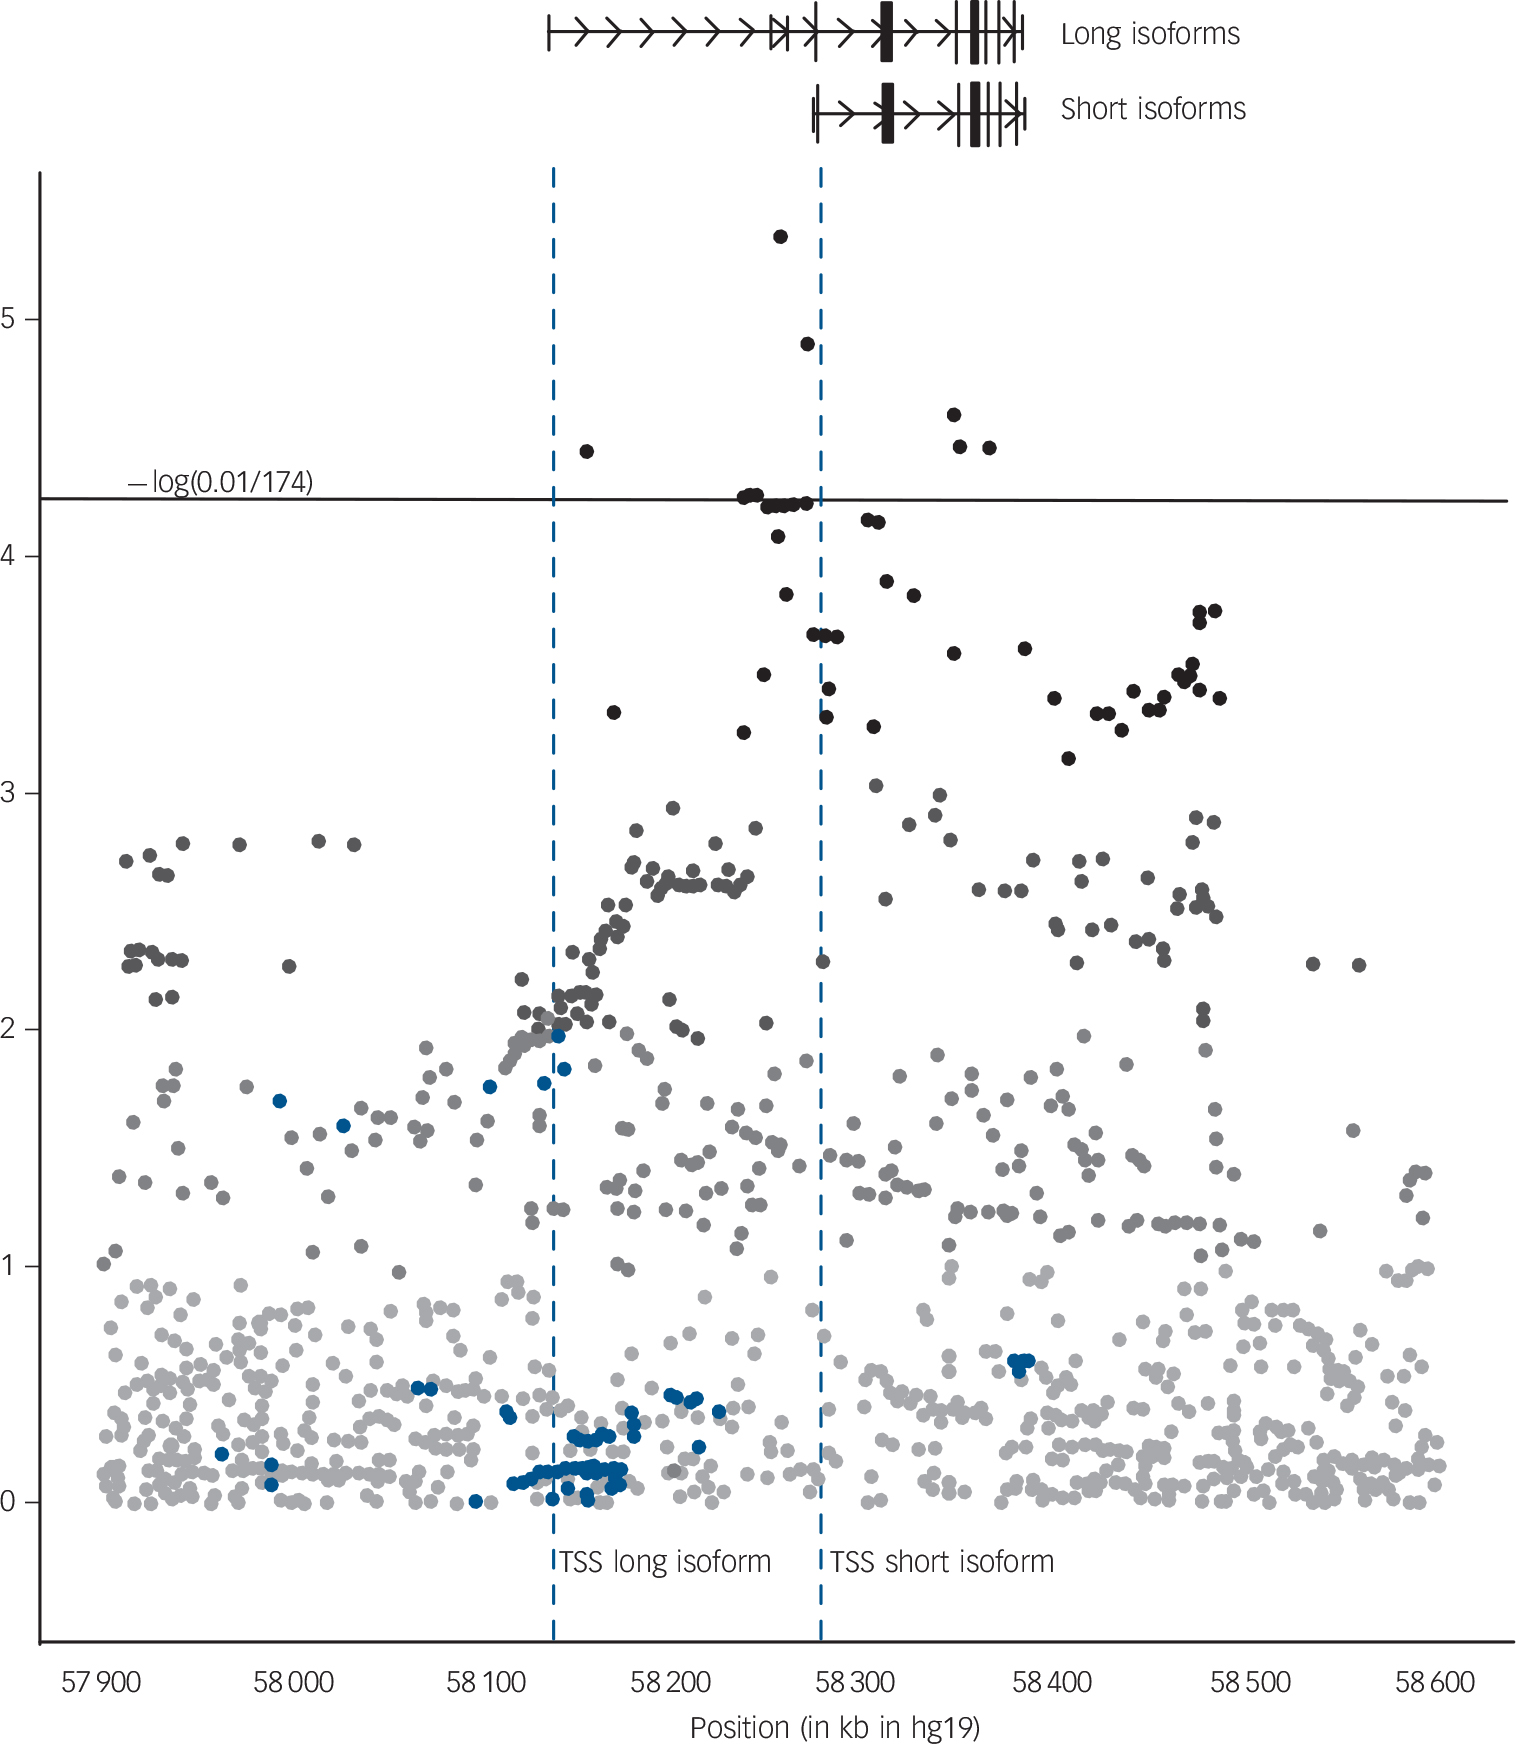
VRK2 SNPs in close proximity to the transcription start site of the short isoforms of the VRK2 gene are significantly associated with VRK2 mRNA levels in the total sample, with weaker effects in the BD, SZ, PNOS and CTR groups separately (online Table DS4 and Fig. 3). A distinct cluster of highly associated SNPs is located in the 25 kb immediately to the 5’ of the transcription start site which is slightly closer to the transcription start site than the tag SNP (rs2312147) previously identified as significantly associated with clinical phenotype.Reference Steinberg, de Jong, Irish Schizophrenia Genomics, Andreassen, Werge and Borglum8 Another region close to the VRK2 gene harboring three significant tag SNPs (at approximately chr2:57.9–58.0Mb), which has been previously reported,3 does not appear to be an eQTL.
VRK2 expression quantitative loci.
VRK2 expression quantitative loci identified in the total sample (n = 652), using a linear regression model with gender, age and diagnostic category as covariates. Blue dots: VRK2 single nucleotide polymorphisms (SNPs) included in our expression model which are genome-wide significant in the latest Psychiatric Genomics Consortium schizophrenia case–control study (PGC_SCZ52_may13) (www.broadinstitute.org/mpg/ricopili/) at significance level 5.0×10⁻⁸. Horizontal line: gene-wide significance threshold for association between 1566 VRK2 SNPs and VRK2 mRNA. This threshold was computed with the aid of matSpDReference Li and Ji33 taking into account the SNP correlations reflected by sample's LD-structure in the region of interest. The effective number (n = 174) of independent tests was computed using Li's procedure. TSS, transcription start site.

Discussion
The main finding of the present study was a clear reduction in VRK2 mRNA levels in the SZ group compared with the CTR group. The gene expression levels in bipolar disorder were comparable to those in the CTR group, with the PNOS group intermediate between the SZ and BD/CTR groups. These findings are in accordance with results from recent GWAS, where VRK2 SNPs have been more strongly associated with schizophrenia than with bipolar disorder.3,10 The finding of diagnostic specificity for reduced VRK2 mRNA levels in schizophrenia is interesting in light of recent evidence for genetic risk variants in the major histocompatibility complex region specific to schizophrenia and apparently not implicated in bipolar disorder.Reference Bergen, O'Dushlaine, Ripke, Lee, Ruderfer and Akterin34 The polygenic overlap in the major histocompatibility complex region between schizophrenia and neurological disorders also seems specific to schizophrenia and not bipolar disorder.Reference Andreassen, Harbo, Wang, Thompson, Schork and Mattingsdal16 The intermediate gene expression levels in PNOS between the SZ and CTR groups is in line with clinical observations, as PNOS is a less severe form of psychosis than schizophrenia.
Intriguingly, VRK2 variants have been associated with epilepsy,36 and the encoded protein VRK2 has been found to be important for regulation of cell growth and inflammatory responses.Reference Sanz-Garcia, Vazquez-Cedeira, Kellerman, Renbaum, Levy-Lahad and Lazo14 More specifically, there is evidence that high VRK2 levels confer protection against apoptosis,Reference Monsalve, Merced, Fernandez, Blanco, Vazquez-Cedeira and Lazo12 and that VRK2 reduces the transcriptional response to interleukin-1b,Reference Blanco, Sanz-Garcia, Santos and Lazo13 a cytokine involved in inflammatory activity. Thus, one could speculate that reduced VRK2 levels might increase already elevated inflammatory response, in addition to inducing apoptosis, thereby inhibiting normal neurodevelopment during early stages of life, which has been suggested as an underlying mechanism in schizophrenia.Reference Altamura, Pozzoli, Fiorentini and Dell'osso37 This hypothesis is in accordance with findings of higher levels of inflammatory markers,Reference Hope, Ueland, Steen, Dieset, Lorentzen and Berg38 brain volume reductionsReference Rimol, Hartberg, Nesvag, Fennema-Notestine, Hagler and Pung39 and neurocognitive impairment in schizophrenia.Reference Simonsen, Sundet, Vaskinn, Birkenaes, Engh and Faerden40 Further, the VRK2 risk allele in rs2312147 has been associated with reduced total brain volume and white matter volume in healthy individuals.Reference Li, Wang, Zheng, Ikeda, Iwata and Luo7 The lack of association between antipsychotic medication and VRK2 mRNA levels in the current study further strengthens an argument for the role of VRK2 in the neurodevelopmental hypothesis.
The extent to which gene expression in blood can act as a proxy for brain expression remains unclear,Reference Sullivan, Fan and Perou41 however the use of blood RNA is a practical necessity if one wishes to study gene expression in a large number of individuals with psychiatric disorder and controls. Since we lack sufficient information on the nature of the blood–brain gene expression correlation, we cannot claim that what we observe in blood is an accurate reflection of expression in the brain. However, this does not detract from the fact that blood-based gene expression levels may be useful in diagnosis.Reference Takahashi, Hayashi, Watanabe, Sawamura, Fukui and Watanabe42 Gene expression in blood has been found to share significant similarities with multiple central nervous system tissues, and correlation between transcripts present in both whole blood and nervous system has been estimated to be around 0.5.Reference Sullivan, Fan and Perou41 Further, peripheral blood was recently validated as a valuable source of information for estimation of heritability through gene expression as well as identification of eQTLs in a large twin study.Reference Wright, Sullivan, Brooks, Zou, Sun and Xia43
VRK2 has nine transcripts in the RefSeq database, but these divide into two broad groups: the long isoforms with a transcription start site at approximately 58 134 kbp and the short forms with a transcription start site at approximately 58 273 kbp. The expression profile of VRK2 is very similar in brain and blood, with the short form being the dominantly expressed form in both tissues. The long form is also expressed in both these tissues, but at very low levels (online Fig. DS4).
The probe used for measuring VRK2 expression in this study was chosen so as to produce an aggregate measure of expression over all RefSeq transcripts. Since we know that the short form is the most abundantly expressed, it is not surprising to observe in our data a cluster of significant SNPs near the transcription start site of the short isoforms. However, the significant SNPs from the latest Psychiatric Genomics Consortium schizophrenia study3 form a large cluster around the transcription start site of the longer form (Fig. 3). This suggests that it is one of the long isoforms of VRK2 that is involved in the aetiology of schizophrenia rather than one of the short isoforms. Future studies should aim to conclusively identify the exact transcript of VRK2 involved as well as confirm that the significant differences observed at the mRNA level are also present at the protein level.
In conclusion, our results give further support to the relevance of the VRK2 gene in schizophrenia susceptibility, and suggest that reduced gene expression might be involved in the underlying disorder mechanisms, potentially related to dysregulation of the immune system and impaired neurodevelopment. Moreover, we observed diagnostic specificity for schizophrenia (30% explained variance v. healthy controls), with a distribution range which differs substantially from that of bipolar disorder and healthy controls (Fig. 2 and Fig. DS3). Such differences in the distributions encourage further studies to test the possibility of using VRK2 as a biomarker for schizophrenia.
Acknowledgements
We thank all study participants for their involvement in the study, and the health professionals who facilitated our work. We also thank Thomas D. Bjella for assistance with the database. The work was supported by the Research Council of Norway, the South-East Norway Regional Health Authority and KG Jebsen Foundation.


eLetters
No eLetters have been published for this article.