

1 Introduction
Most judgments and decisions are relative – they involve comparing two or more items on two or more dimensions (e.g., Reference Mussweiler and EpstudeMussweiler & Epstude, 2009; Reference Stewart, Chater and BrownStewart, Brown & Chater, 2006). Correspondingly, the ways in which people construe and communicate relative magnitude is a fundamental issue in decision-making research. English speakers have a choice about how to describe the ordinal relation between a pair of items: they may use a “smaller” comparative (e.g., “one item is smaller/less/lower/shorter/fewer… than the other”) or a “larger” comparative (e.g., “one item is larger/more/higher/taller/longer…than the other”). Both types of word can be used to describe exactly the same pair of items, but the decision to use “smaller” or “larger” matters because it changes the way the options are represented and evaluated. In particular, “larger” comparatives are thought to stored in a simpler, more accessible form than “smaller” comparatives, with consequences for reasoning and preference (e.g., Reference AllanAllan, 1986; Reference ClarkClark, 1969); for example, recent work in social psychology has found that people prefer, and are more likely to agree with, messages that describe a relation with “more” rather than “less” (for example, “Men go to the cinema less often than women do” was judged less likely to be true than “Women go to the cinema more often than men do”; Reference Hoorens and BrückmullerHoorens & Brückmuller, 2015). In addition, “larger” comparatives are not lexically marked: they are applicable across the whole magnitude range and convey no information about the absolute sizes of the compared items. In contrast, the use of a “smaller” comparative implies that the compared items are both low-magnitude (e.g., Reference ClarkClark, 1969; Holyoak & Mah, 1981; Reference RusieckiRusiecki, 1985). For example, an average-sized woman is judged to be heavier if she has been compared with another woman using the word “fatter” than if she is compared with the word “thinner” (Reference ChoplinChoplin, 2010).
Most work in this area has focused on how people’s judgments and decisions are shaped by the use of a particular comparative, but recent research has turned to the question of how people select these adjectives when describing the relation between two items. To investigate this, Reference Matthews and DylmanMatthews and Dylman (2014) presented pairs of items differing on a wide variety of dimensions (e.g., price, probability, delay, area, height, length) and probed their comparative language. In a language production task, participants completed sentences of the form “One X is _____ than the other” (e.g., participants were presented with “A 2-week delay” and “A 6-month delay” and completed the sentence: “One delay is _____ than the other” using whatever word naturally came to mind); in a language choice task, participants were asked to select which of two adjectives they thought best described the relation between two values (e.g., “longer” vs “shorter”). Across multiple studies and conditions, there was a pronounced “higher use of larger comparatives” (HULC) effect – people tended to produce or choose “larger” comparatives more than “smaller” ones. In addition, this effect was modulated by the spatio-temporal structure of the items. For example, in the production task, a small-large spatial arrangement of the items led to a weaker HULC effect (i.e., an increase in the tendency to write, for example, “One square is smaller than the other” relative to that seen with a large-small layout). More recently, Reference SkylarkSkylark (2018) replicated this effect and also found that message-receivers use the choice of comparative adjective to infer the spatial arrangement of the original items (e.g., “John is taller than Jake” leads to the inference that John was on the left).
The robust tendency to use “larger” comparatives, combined with the consequences of this choice for people’s preferences and inferences, leads to the question: Do people differ in their use of “smaller” and “larger” comparatives? That is, are there systematic individual differences in the HULC effect?
The present paper provides a first exploration of this issue. In a series of studies, we had people complete self-report questionnaires to probe traits and states that we thought might be associated with the tendency to choose smaller vs larger comparatives; we probed the latter using the same kinds of language production choice tasks as Reference Matthews and DylmanMatthews and Dylman (2014) and Reference SkylarkSkylark (2018). Previous research examining individual differences in language use has focussed on freely-produced text (e.g., by examining people’s blog posts or conversations; Reference Mehl, Gosling and PennebakerMehl, Gosling & Pennebaker, 2006; Reference YarkoniYarkoni, 2010). The current work is different in that it controls the reality that the language user is seeking to communicate. That is, each person is presented with the same pairs of objects rather than describing their activities, thoughts, or feelings. In this way we are able to examine whether demographic, affective, and personality variables reliably predict the way that people construe and describe a given magnitude relation.
We selected a range of traits that are routinely found to affect language use and decision-making, but we were generally open-minded about whether and how these variables might be associated with the HULC effect. Although some traits were explored in every study, others were only measured in a subset. Specifically, we investigated:
Demographic variables.
We asked all our participants their gender and their age.
Emotion and outlook.
Some of our participants completed measures that probed their depressiveness, dispositional optimism, and positive and negative affect. The items whose magnitudes our participants had to describe were usually neutral (e.g., two squares of differing area), so any correlation between language use and mood would most likely reflect habitual patterns of construal and communication rather than a response to the affective value of the items themselves. We had some expectation that more optimistic people and those experiencing more positive emotional states would be more likely to use “larger” comparatives, on the basis that “more than” statements are viewed more positively than “less than” statements (Reference Hoorens and BrückmullerHoorens & Brückmuller, 2015) and because, in choice tasks involving neutral items, “bigger is better” (Reference Silvera, Josephs and GieslerSilvera, Josephs & Giesler, 2002), suggesting that people with low mood might focus on the “worse” (i.e., smaller) member of an object pair.
Personality traits.
All of our participants completed a measure of the “Big Five” personality traits: extraversion, openness to experience, stability (the inverse of neuroticism), conscientiousness, and agreeableness (e.g., Reference Gosling, Rentfrow and SwannGosling, Rentfrow & Swann, 2003; Reference John, Srivastava, Pervin and JohnJohn & Srivastava, 1999). When analysing free text such as diary entries, these traits correlate with language use in ways that one would expect from the definition of the traits (e.g., people high in extraversion are especially likely to use the words “drinks” and “dancing”; Reference YarkoniYarkoni, 2010). It is harder to formulate strong hypotheses for the current situation, where the to-be-described objects are neutral and externally-determined, but we had some expectation that extraversion and stability would both be associated with an increased tendency to use “larger” comparatives, on the basis that these traits entail an expansive, positive world-view (the same might also be true of openness to experience), whereas introversion and neuroticism, like low mood and pessimism, may entail a focus on smallness and loss. We note, though, that one can also hypothesize different patterns (for example, neuroticism might entail frequent upward comparisons with others, such as “they earn more than I do”, leading to a habitual tendency to use “larger” comparatives).
In what follows, we report 4 experiments that provide a first investigation of individual differences in the language of magnitude comparison. Our approach was exploratory and evolving, with different studies using different measures and tasks. We primarily focus on combined analyses in which the data from all 4 studies are combined, to give a clearer overall sense of effect sizes and associated uncertainties.
2 Methods
We conducted 4 studies in which participants completed self-report questionnaires and a language task that probed their use of comparative adjectives.
2.1 Participants
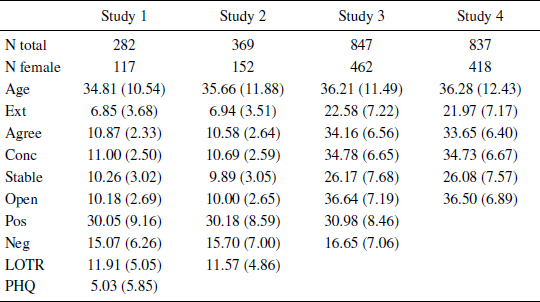
All studies were conducted on-line using participants from Amazon Mechanical Turk (http://www.mturk.com) with the inclusion criteria that participants had to: be at least 18 years old; report English as first language (“mother tongue”); complete the task; have an ip address that had not already been recorded in that study or a previous one in the series (to help ensure independent samples; e.g., Reference Matthews, Gheorghiu and CallanMatthews, Gheorghiu & Callan, 2016); not report problems seeing the study images; and not report prior participation (Studies 3 and 4). Final sample sizes and demographic information are shown in Table 1; 2 additional participants were excluded from Study 3 because all of their responses were unclassifiable (see below).
The samples sizes for Studies 1–4 gave 80% power to detect zero-order correlations of r = .17, .15, .10, and .10, and 95% power to detect effects of .21, .19., .12 and .12 respectively (i.e., the studies were powered to detect small effects). The sample size increased across studies as the size of the effects under investigation became apparent.
2.2 Design, materials, and procedure
Participants completed two tasks, one involving questionnaires and the other requiring them to choose the word that best describes the relationship between two items. The order of the two tasks was randomized, and within the questionnaire task the order of the questionnaires was randomized. After completing these tasks, participants in Studies 1 and 2 were asked whether English was their first language, whether they had problems seeing any of the images, and for their gender and age; in Studies 3 and 4 the question about first language was asked at the start of the survey and participants who answered “No” were redirected away from the study; at the end, participants were asked whether they had problems viewing the images, whether they had undertaken the survey previously, and for their gender (male or female) and age (indicated with a slider, from 0 to 100).
2.2.1 Questionnaire measures
We used the following questionnaires to measure individual difference variables (no additional measures were administered).
In Studies 1 and 2, we measured the Big Five personality traits with the Ten Item Personality Inventory (TIPI; Reference Gosling, Rentfrow and SwannGosling et al., 2003). Participants were told: “Here are a number of personality traits that may or may not apply to you. Please select the extent to which you agree or disagree with that statement. You should rate the extent to which the pair of traits applies to you, even if one characteristic applies more strongly than the other.” The TIPI comprises 10 statements, one positively and one negatively coded for each dimension (e.g., for extraversion: “I see myself as extraverted, enthusiastic”; and “I see myself as reserved, quiet”; participants rated their agreement on a 7-point scale (Disagree strongly; Disagree moderately; Disagree a little; Neither agree nor disagree; Agree a little; Agree moderately; Agree strongly (coded 0–6). For Study 2, we replaced Disagree/Agree a little with Disagree/Agree slightly, and removed the phrase “even if one characteristic applies more strongly than the other” from the instructions, in order to minimize the possibility of this influencing responses in the language task.
In Studies 3 and 4, we measured the Big Five with the Big Five Inventory (BFI; Reference John, Srivastava, Pervin and JohnJohn & Srivastava, 1999). The BFI is more comprehensive and time-consuming than the TIPI but has higher reliability; participants rate their agreement with 44 items (some reverse-coded) on a 5-point scale (Disagree strongly; Disagree a little; Neither agree nor disagree; Agree a little; Agree strongly; coded 1–5). For consistency between studies, we inverted the coding of the BFI neuroticism scale so that higher scores indicated higher stability, as for the TIPI.
In Studies 1, 2, and 3 we measured affect with the Positive and Negative Affect Schedule (PANAS; Reference Watson, Clark and TellegenWatson, Clark & Tellegen, 1988), which asks people to indicate the extent to which people have experienced different feelings (e.g., interested, distressed, hostile) over a given time period (we used “the past week”); it taps positive and negative affect as distinct but correlated dimensions. The response options were: Very slightly or not at all; A little; Moderately; Quite a bit; Extremely; coded 1–5. A little was replaced with Slightly in Study 2.)
In Studies 1 and 2 we measured optimism with the Life Orientation Test-Revised (LOT-R; Reference Scheier, Carver and BridgesScheier, Carver & Bridges, 1994). It comprises 10 items (e.g., “In uncertain times, I usually expect the best”) of which 4 are fillers and two are reverse-coded; participants respond on a 5-point scale (Strongly disagree; Disagree; Neutral; Agree; Strongly agree; coded 0 to 4). We noticed after Study 1 that one item of the LOT-R includes the word “more” (“Overall, I expect more good things to happen to me than bad”); this item was therefore omitted from analysis and excised from the LOT-R in Study 2.
In Study 1, we measured depressive symptoms with the Patient Health Questionnaire-9 (PHQ-9; Reference Kroenke, Spitzer and WilliamsKroenke, Spitzer & Williams, 2001), which asks people to report the frequency with which they have experienced 9 symptoms such as “feeling down, depressed, or hopeless” over the past 2 weeks, with response options “Not at all”, “Several days”, “More than half the days”, and “Nearly every day” (coded 0-3). Because one of these options includes the comparative adjective “more”, this questionnaire was dropped after Study 1. The PHQ asks people who indicated any non-zero frequency of problems to indicate how difficult this had made their life; we did not include this question.
2.2.2 Language tasks
We used two language tasks employed by Reference Matthews and DylmanMatthews and Dylman (2014) and Reference SkylarkSkylark (2018). These tasks both provide an indication of people’s tendency to use “larger” comparatives; we used both to test the generality and robustness of our findings.
Both tasks presented participants with 9 pairs of items, each differing on a particular dimension (e.g., probability, monetary amount, area, length). As in previous work, we presented each participant with just one pair of items for each dimension in an effort to minimize carryover effects. For each dimension, participants were asked to indicate the comparative adjective that they would use to describe the relation between the items. Studies 1 and 2 used stimuli from Studies 2a and 4a of Reference Matthews and DylmanMatthews and Dylman (2014) (referred to here as “Set 1”); Studies 3 and 4 used stimuli from Studies 4a, 4b, and 4c of that paper, plus an additional pair (two aeroplanes differing in altitude) (referred to as “Set 2”). Sets 1 and 2 both probed the same 9 dimensions but used different stimulus magnitudes (see Table 2; the stimuli are provided as supplementary materials). Participants were presented with all 9 pairs in random order; the left-right layout of the items in each pair (i.e., whether the smaller member was on the left or the right) was also randomized.
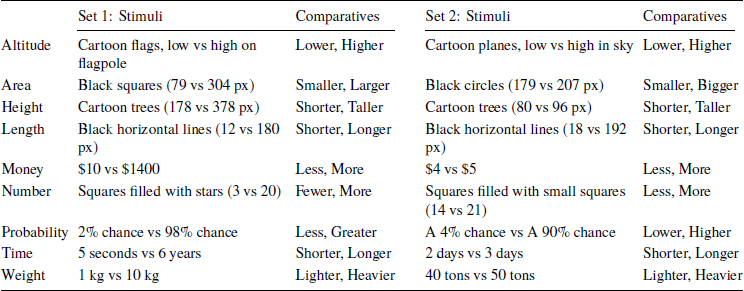
Note: px = pixels.
In the Production Task (Study 3), participants were presented with each pair of objects and asked to complete sentences of the form “One X is _____ than the other” (e.g., “One probability is _____ than the other”), using whatever word they found natural (“In the space below, type the word that you would naturally use to fill the gap in this sentence”). The free-text responses were coded as “smaller”, “larger”, or “unclassifiable” by two independent coders, with disputes (0.4%) resolved by a third coder. Unclassifiable responses (3.8% percent) were excluded from analysis.
In the Choice Task (Studies 1, 2, and 4), participants were again presented with 9 pairs of items but this time they were asked to choose which of two words best described the relation between them (e.g., “Compare these two amounts of money. Which word best describes the relationship between them?”) The response options corresponded to the modal “Smaller” and modal “Larger” adjectives of participants in the Production Task. For Studies 1 and 2, these modal responses were based on the responses of participants in Reference Matthews and DylmanMatthews and Dylman (2014); in Study 4, they were based on the responses of participants in the present Study 3. The two response options were positioned one above the other with random allocation to position.
3 Results
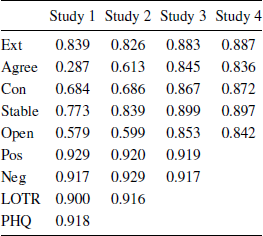
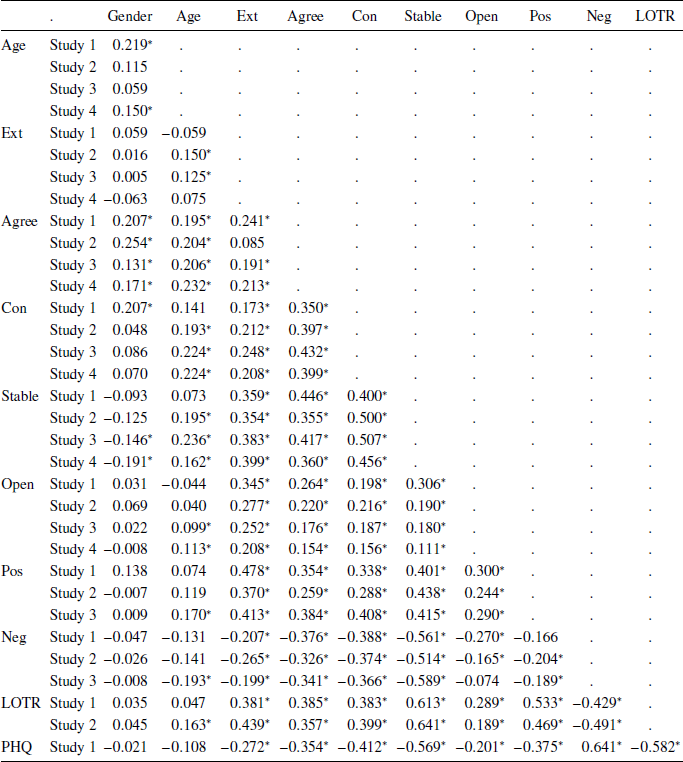
The questionnaire measures generally showed good reliability (see Appendix Table A1); as in previous work, the Cronbach’s alpha values are relatively low for the TIPI, reflecting the brevity of this measure and the fact that the 2 items for each trait are intended to measure distinct facets of the construct. The correlations between variables were typically low to moderate (Appendix Table A2).
We examined the consistency of “larger” responses by focusing on the tetrachoric correlation matrix (which treats each binary response as a manifestation of a continuous tendency). Exploratory factor analysis with maximum likelihood fitting generated scree plots that indicated a clear drop after one factor with all subsequent eigenvalues less than 1. Using the tetrachoric correlations to compute Cronbach’s alpha (Reference Gadermann, Guhn and ZumboGadermann, Guhn & Zumbo, 2012) yielded values of .76, .76, .77, and .68 for Studies 1-4. We also used the ci.reliability function of the MBESS package for R (Reference KelleyKelley, 2018) to compute categorical omega (Reference Kelley and PornprasertmanitKelley & Pornprasertmanit, 2016), which relaxes the assumptions of Cronbach’s alpha and incorporates the possibility of sub-dimensions within a scale to indicate the proportion of variance in responses across items that is attributable to a common latent variable: the values were .63, .64, .59, and .55 for Studies 1–4, respectively. Taken together, these results provide some reassurance that our participants’ “smaller/larger” responses tap a common trait, although the question is not fully resolved (see below for further discussion).
3.1 The HULC effect
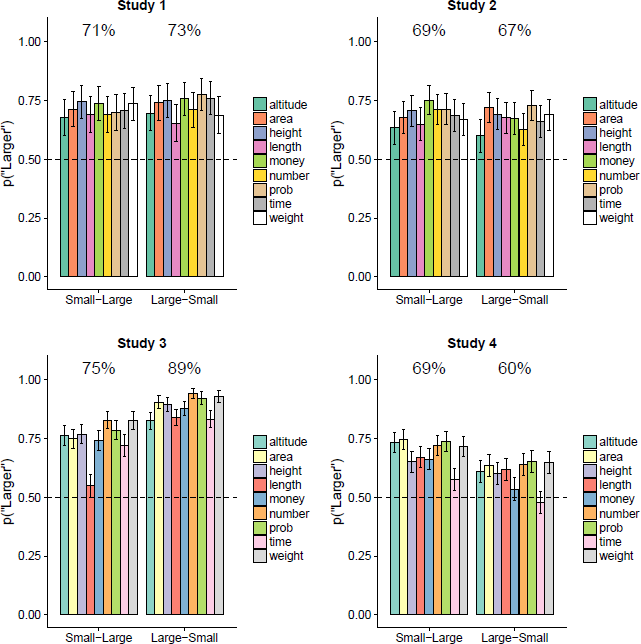
Figure 1 shows the proportion of “larger” responses for each stimulus pair in each study, with the data organized according to whether the smaller item was on the left or the right. There is a robust tendency to favour “larger” comparatives – that is, the bars are above 50%, replicating the HULC effect.
Results of Studies 1 to 4. Each panel shows the proportion of “larger” responses for each magnitude dimension. The colouring of the bars reflects the stimulus set (Set 1 for Studies 1 and 2; Set 2 for Studies 3 and 4). The data are organized according to whether the smaller item in the pair was on the left (Small-Large) or the right (Large-Small); the percentages at the top of each plot show the overall proportions across the 9 dimensions. Error bars indicate 95% confidence intervals.
To probe the effects of spatial layout, we ran mixed effects logistic regression analyses in which response (with “smaller” comparatives coded 0 and “larger” comparatives coded 1) predicted by spatial layout (with small-large coded −1 and large-small coded +1). We included random effects of participant (random intercept and random slope for spatial layout) and stimulus pair (random intercept and random slope for spatial layout); random effects were uncorrelated (see e.g., Reference Barr, Levy, Scheepers and TilyBarr, Levy, Scheepers & Tily, 2013; our models were fitted using the lme4 package for R, Reference Bates, Mächler, Bolker and WalkerBates, Mächler, Bolker & Walker, 2015). (We also fit these models without the by-participant random slopes, which changed the absolute magnitudes of the regression coefficients but made no difference to the pattern of significant effects.)
As one would expect from Figure 1, all four studies had a intercept terms that were well above 0 (i.e., “larger” responses were more common than “smaller” responses); for Study 1, B = 1.473 with 95% confidence interval [1.265, 1.680]; Study 2, B = 1.191, [1..03, 1.379]; Study 3, B = 2.433, [2.170, 2.695]; Study 4, B = 1.144, [0.871, 1.417]; all p < .001.
In Study 3, which used the language production task, participants were more likely to use “larger” comparatives when the large item was on the left, B = 0.713, [0.526, 0.889], p < .001. This mimics the results with production tasks reported by Reference Matthews and DylmanMatthews and Dylman (2014) and Reference SkylarkSkylark (2018), and is consistent with a location-matching effect. That is, when producing sentences such as “One square is _____ than the other”, people tend to map the spatial locations of the objects onto the spatial locations of their linguistic labels (i.e., if the small square is on the left, then it is the “One square”; if the small item is on the right then it is “the other”.) Matthews and Dylman found no effect of spatial layout in the choice task, which accords with the location-matching account (when people just have to “choose the word that describes the relation between these objects”, there is no spatial sentence structure to map on to the object layout). The choice task used in the present Studies 1 and 2 similarly found no effect of spatial layout on the HULC effect, B Study 1 = 0.060, [−0.140, 0.260], p = .556; B Study 2 = −0.049, [−0.223, 0.126], p = .584. However, in Study 4 participants were less likely to choose “smaller” comparatives when the small item was on the right B = −0.400, [−0.574, −0.226], p < .001. The reason for this is unclear.
3.2 Individual differences in comparative language
Our main focus is on the exploration of individual differences in the HULC effect. For each putative predictor trait, we ran a separate mixed-effects logistic regression analysis with random intercepts for participants and random intercepts and slopes for stimuli. All predictors were standardized prior to analysis (that is, for each trait we computed the mean and SD of the participants in a given experiment and used these to z-score each participant’s score on that dimension); correspondingly, the regression coefficients indicate the effect on the log odds of a “larger” response of being one standard deviation above the mean of the other participants in that experiment.
To get a better overall estimate of effect sizes, we also combined all of the data for a given predictor in a single regression analysis (using the same standardized predictor values as in the individual study analyses). This pooled analysis had the same random effects structure as before but with the addition of random intercepts and slopes for Study, thereby allowing for random variation across studies both in the overall tendency to use “larger” comparatives and in the effect of participant traits on this tendency.
To check the robustness of our results and provide a more intuitive sense of the effect sizes, we also conducted simpler correlation analyses: for each participant, we calculated the proportion of their responses that used “larger” comparatives and correlated these proportions with each of the predictor traits.Footnote 1 We also combined the individual correlation coefficients in with random-effects meta-analysis using the metafor package for R (Reference ViechtbauerViechtbauer, 2010), using the correction for slight negative bias in the correlation coefficient (option “UCOR” in metafor’s escalc function).
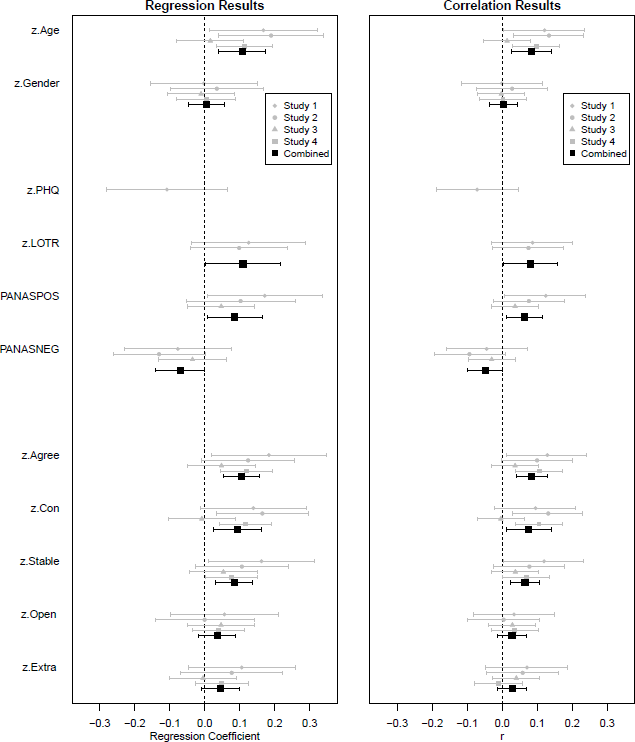
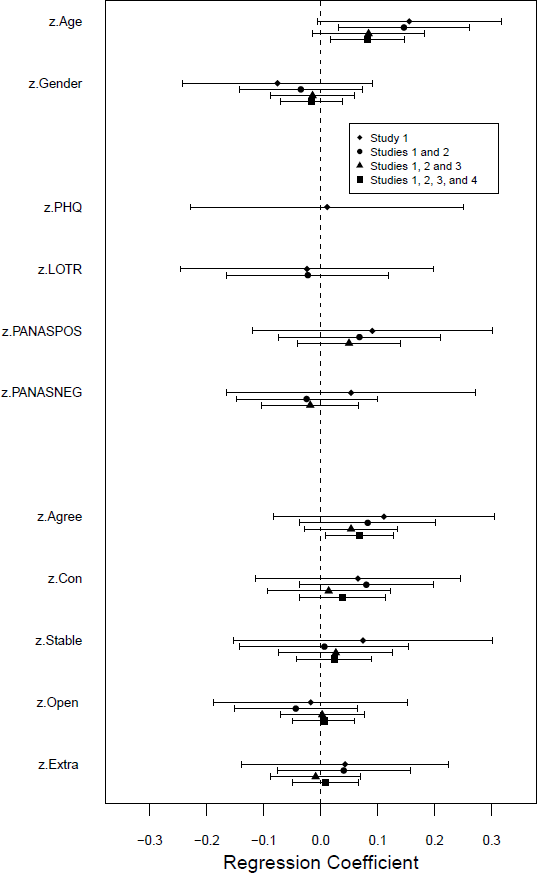
The results of both types of analysis – mixed effects regression and correlation analysis – are shown in Figure 2. (The numerical values are provided in the supplementary materials.)
Associations between traits and language use. The left panel shows the coefficients from the mixed effects logistic regression analyses. The right panel shows the correlation coefficients. Error bars indicate 95% confidence intervals.
3.2.1 Demographic variables
None of the studies found a meaningful association between gender and language use. In contrast, there was a reasonably consistent association between language and age, with older participants being more likely to use “larger” comparatives.
3.2.2 Emotion and outlook
Only Study 1 used the PHQ, but the results indicate little evidence of an association between depressive symptoms and comparative language (although of course we can have less confidence in the estimated size of this effect because of the relative scarcity of data).
In contrast, there is some evidence that optimism and positive and negative affect show weak but consistent associations with the tendency to choose “larger” adjectives. Specifically, the combined analyses suggest that people who are more optimistic and experiencing more positive affect are more likely to say “larger”. There is also some indication that those experiencing negative affect are more likely to say “smaller”, although the confidence intervals for this effect stray very close to zero in the regression and just cross the zero line in the correlational analysis.
3.2.3 Personality
The combined regression analysis and meta-analysis indicate that Agreeableness, Conscientiousness, and Stability all exhibit weak positive associations with the HULC effect, although the effect is not reliable in all studies. In contrast, none of the studies reveal a non-zero association between language use and extraversion or openness, and the combined analyses urge the same conclusion. (Of course, this does not establish that the association is significantly stronger for the former traits than for the latter.)
3.3 Fixed effects of study
Caution is needed when mixed effects models have relatively few higher-level units, as in our pooled analyses. Our approach was based on the advice of Reference Gelman and HillGelman and Hill (2007) who note that there is no requirement for a particular number of groups and that, while low group-numbers can mean that multilevel modelling offers little advantage, it will work at least as well as classical regression and is sometimes advantageous; nonetheless, some researchers may be uneasy about our approach. Likewise, although the BFI and TIPI purport to measure the same 5 constructs (see Reference Gosling, Rentfrow and SwannGosling et al., 2003, and Reference John, Srivastava, Pervin and JohnJohn & Srivastava, 1999, for details and evidence), one may argue that they should not be combined in a pooled analysis.
We therefore ran two additional analyses in which we only combined the data form studies that used the same personality scale (i.e., one analysis for Studies 1 and 2, and another for Studies 3 and 4). In these analyses we treated study as a fixed effect and predicted response from trait, study, and their interaction (trait and study were both standardized prior to computing the interaction term; the random effects were the same as for the individual study analyses, with the addition of by-stimulus random slopes for the study and interaction effects). The analysis of Studies 1 and 2 produced the same pattern of confidence intervals as the analysis across all four studies (i.e., positive effects of age, positive affect, optimism, agreeableness, conscientiousness, and stability, and a negative effect of negative affect). In addition, participants were overall more likely response “larger” in Study 1. The analysis of Studies 3 and 4 also produced results that mirrored the main analysis except that the confidence intervals for conscientiousness just included zero (B = 0.055, CI = [−0.004, 0.115]); this was qualified by a weak interaction between conscientiousness and study, B = 0.063, CI = [0.004, 0.123], reflecting the positive effect in Study 4 and the miniscule effect in Study 3 (full results of these analyses are provided in the supplementary materials.
In short, the results of our main analysis are reasonably robust to alternative analytic approaches.
3.4 Controlling for other predictors
As an additional analysis, we re-ran our mixed effects logistic regression analyses but including all predictors simultaneously, with a view to identifying effects that persist after controlling for other traits. Because the studies employed different subsets of the predictors, we ran four separate analyses: one that used only the data from Study 1 (this analysis incorporates all measured predictors but only uses 12% of the total participants); once using data from Studies 1 and 2 (incorporates all predictors excluding the PHQ and uses 28% of the total participants); once using the data from Studies 1, 2, and 3 (all predictors excluding the PHQ and LOT-R; uses 64% of the participants); and once using the data from all studies (uses all available data but only includes age, gender and the Big-5 traits as predictors). The approach to random effects was the same as in the single-predictor analyses.
The results are plotted in Figure 3. Most of the associations between individual difference measures and language use have failed to survive the effects of controlling for other variables. In particular, when the data from all studies are combined only Age and Agreeableness have confidence intervals that exclude zero – and this analysis does not control for depression, optimism, or affect. The pattern of results was the same when the spatial layout of the objects was included as a predictor.
Coefficients for each predictor after controlling for other predictors. Pooling across a larger number of studies increases the sample size but reduces the set of predictors that are controlled for; see text for details. Error bars indicate 95% confidence intervals.
These results might reflect overfitting and/or the correlations between the predictors (although the latter are relatively modest; see Table A2), and it is hard to draw straightforward conclusions from these analyses because the regressions that incorporate the most data control for the fewest variables. Nonetheless, they add to the impression that there are, at best, only very weak associations between the individual difference variables measured here and people’s tendency to use “smaller” or “larger” comparative adjectives, with Age and Agreeableness as two variables that might make independent contributions to the explanation of language use.
3.5 Confidence, sensitivity, and evidence
It is worth exploring the evidential status of our findings, especially given the difficulties of interpreting “null” results such as those found for several of the traits we examined.
For the kind of initial, partly-exploratory work described here, our preference is to focus on point estimates and confidence intervals. As shown in Figure 2, these point estimates are consistently small, similar across studies, and bordered by fairly narrow confidence intervals (especially in the meta-analyses). Nonetheless, it is instructive to scrutinize the power of our studies to detect effects of interest. In our view, for exploratory work a false-positive rate of about 5% (i.e., α = .05) is reasonable and was the basis for the confidence intervals used here. Psychology researchers conventionally regard bivariate correlations that account for less than 4% of the variance (i.e., r = .2) as “small”. We think that, when investigating individual differences in language use, it would be worth detecting effects smaller than this, but that an effect of less than r = .141 (i.e., 2% of variance explained) is unlikely to be of much theoretical or practical significance as the basis for future work. In our Studies 1–4, the power to detect such a minimally-interesting effect was approximately 66%, 78%, 99%, and 98% respectively; a rough estimate for the meta-analysis (based on the power for a bivariate correlation with a sample size equal to the pooled sample) indicates power of more than 99.9% (that is, the probability of missing an effect of interest that actually exists was less than 1 in a thousand). Even if the threshold for an effect of interest is lowered to 0.1 (1% of variance explained), the probability of a false negative in the pooled analysis is approximately two in a thousand.
One feature of our presentation is that we have not attempted to correct for multiple testing. (Indeed, our confidence intervals and associated p-values are somewhat ill-defined because, for example, we were not able to precisely pre-specify our sample sizes, and did not have a rigid plan to conduct a certain number of studies; see Reference KruschkeKruschke, 2010, for a discussion of the philosophical and practical difficulties of ever fully addressing such concerns.) Our approach has been to examine each point estimate in turn, but of course the number of traits and studies means that the paper-wise Type 1 error rate is inflated. It is not obvious how best to control this, but one simple strategy would be to adopt a more conservative criterion for “significance” (i.e., to compute wider confidence intervals) by setting alpha = .005; this threshold has been proposed by Reference BenjaminBenjamin et al. (2018) and, in our case, roughly corresponds to a Bonferroni correction across the 11 traits examined in our meta-analyses. Taking this approach, in the pooled logistic regression analysis only the effects of age, agreeableness, and stability have CIs that exclude zero (B age = 0.107, CI = [0.011, 0.203]; B agree = 0.106, CI = [0.033, 0.178]; B stable = 0.085, [CI = 0.009, 0.161]; the same holds for the meta-analysis of correlation coefficients). Using this more stringent criterion for “significance”, the power of our studies to detect r = .141 was still estimated to be more than 99.9% for the pooled analysis (with values of approximately 33%, 47%, 91%, and 90% for Studies 1–4 respectively).
An alternative approach involves the computation of Bayes Factors, which quantify the evidence for an alternative hypothesis (that the effect of interest is drawn from a distribution of possible effect-sizes) against the null hypothesis of zero effect. The merits of this approach are contested (e.g., Reference KruschkeKruschke, 2010; Reference MatthewsMatthews, 2011; Reference Wagenmakers, Love, Marsman, Jamil, Ly, Verhagen and MoreyWagenmakers et al., 2018) and, for exploratory work, our preference is to focus on point estimates rather than this kind of hypothesis testing, but for the sake of completion we have computed Bayes Factors for the bivariate correlations for each study, using the default prior employed the BayesFactor package for R (Reference Morey and RouderMorey & Rouder, 2018). These are shown in Table 3; cases where the data favour the alternative are prefaced “a”; those where they favour the null are prefaced “n” and depict the reciprocal of the Bayes Factor in favour of the alternative (i.e., all cells indicate the strength of evidence in favour of the hypothesis that is favoured in that cell). Although some of the Bayes Factors indicate relatively inconclusive evidence, there are many instances where they suggest quite strong evidence: for Gender, Extraversion, Openness and Negative Affect, the evidence typically favours the null by a factor of 5 or more. Likewise, although some of the non-zero effects in Studies 1 and 2 (where the sample sizes were small) have inconclusive Bayes Factors, in Study 4 (where the samples are larger and the confidence intervals are tighter) the data favour the alternative hypothesis by factors of 5 or more for age, conscientiousness, and agreeableness. Computing the Bayes factors with a more diffuse uniform prior on the correlation coefficient rho (Reference Wagenmakers, Love, Marsman, Jamil, Ly, Verhagen and MoreyWagenmakers et al, 2018) led to similar results, except for a shift towards stronger evidence for the null/weaker evidence for the alternative; similarly, re-running the analysis using Kendall’s non-parametric correlation with the default prior suggested by van Doorn, Ly, Marsman & Wagenmakers (in press) led to Bayes Factors similar to those in Table 3 (see supplementary materials).
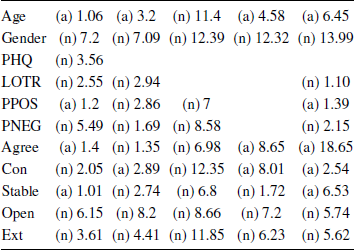
Note: Values indicate the factor by which the data favour the null (n) or alternative (a) hypothesis.
The Bayes Factors for Studies 1–4 show notable variability across studies (the only consistent findings favour the null). To get a clearer sense of the overall evidence, we conducted a Bayesian model-averaged meta-analysis (Reference Gronau, Van Erp, Heck, Cesario, Jonas and WagenmakersGronau, Van Erp, Heck, Cesario, Jonas & Wagenmakers, 2017) using the metaBMA package for R (Reference Heck, Gronau and WagenmakersHeck, Gronau & Wagenmakers, 2017); we used the Fisher’s r-to-z transformed correlation coefficients and the metaBMA function with the function’s default priors, except that we changed the prior distribution for the mean effect from a half-normal to a normal, reflecting the fact that we had no particular directional hypotheses. The results are shown in the rightmost column of Table 3 (the medians of the posterior distributions and their 95% highest posterior densities are provided in the supplementary materials). The meta-analytic Bayes Factors indicate reasonably strong evidence for effects of age, agreeableness and emotional stability (BFs 6-18 in favour of the alternative); there is also moderate evidence for no effect of extraversion and openness (BFs of approximately 6 in favour of the null). For optimism, positive and negative affect, and conscientious, the data are not very informative. These results therefore tell much the same story as our main analysis, but emphasize that those effects with confidence intervals that just include or come close to zero, we need more data before we can form strong beliefs about the presence or absence of an effect.
4 Discussion
We replicated the HULC effect (Reference Matthews and DylmanMatthews & Dylman, 2014): English speakers were more likely to describe the ordinal relation between two objects as “larger” (or “higher”, “longer”, “more” etc) than as “smaller” (or “lower”, “shorter”, “less”…). More importantly, we provide initial evidence regarding individual differences in this tendency.
The over-riding message from our data is that the traits we examined account for little of the variation in language use: less than 1% of the variance in the proportion of “larger” responses was accounted for by any one of the variables we examined. This might be a consequence of the reliability of our measures. In particular, the TIPI uses only two questions per Big-5 dimension and, because these questions are intended to tap distinct facets of each trait, they are by design not very highly correlated (Reference Gosling, Rentfrow and SwannGosling et al., 2003). The low reliability and the fact that the TIPI does not accommodate the breadth of facets that are likely to make up each of the Big 5 limit its potential to predict language use. We are reassured by the fact that the results of Studies 1 and 2 (which used the TIPI) are very similar to those of Study 4 (which used the much more comprehensive BFI), although an even more wide-ranging scale such as the 240-item NEO-PI-R (Reference Costa and McCraeCosta & McRae, 1992) might yield stronger or different effects.
A potentially more serious concern regards the consistency of comparative language use itself. In order to dimension to reduce carry-over effects and retain an element of naturalism, we presented each person with a single item pair from each magnitude. However, this limits our ability to test the consistency and variability of people’s responding within and across items and magnitude dimensions. A possible explanation for the weak relations to individual difference measures is therefore that there may not be much consistent variability between individuals in their preference for “larger” comparatives. Our analyses provide some reassurance against this in that the alpha values based on tetrachoric correlations are reasonably high, although the alternative hierarchical-omega results are more ambivalent. Investigation of the stability and individual variation in language use is therefore an important topic for future work. Likewise, our results are currently limited to (American) English; the HULC effect, and its relationship to individual differences measures, might well vary across languages and cultures.
From a practical point of view, the weak effects are reassuring because large systematic differences in people’s use of comparatives would likely imply systematic differences in the extent to which their statements are perceived as true (Reference Hoorens and BrückmullerHoorens & Bruckmüller, 2015) and in the absolute magnitudes that people infer from their description (e.g., Reference ChoplinChoplin, 2010) – with corresponding implications for decision-making. As a crude illustration, consider the consequences if extraverted and introverted clinicians differed greatly in their tendency to assert that “Life expectancy for Treatment A is longer than for Treatment B” rather than “Life expectancy for Treatment B is shorter than for Treatment A”.
Nonetheless, it is worth considering the basis for the small effects that we did find.
Emotion and outlook.
We found some evidence that people experiencing more positive affect and with a more optimistic outlook are slightly more likely to choose “larger” comparatives, although the extent to which these effects are independent of other traits – particularly age – is unclear. The direction of this association makes sense given the evidence that comparative sentences that use “more” rather than “less” are viewed more positively (e.g., as more “beautiful”, or “fun”; Reference Hoorens and BrückmullerHoorens & Bruckmüller, 2015). An additional speculation might be that low mood engenders deeper reflection, thereby weakening the tendency to make the more accessible, “larger” response in favour of the more effortful “smaller” one (e.g., Reference Bodenhausen, Gabriel and LinebergrBodenhausen, Gabriel & Lineberger, 2000).
Personality.
Some researchers argue that the Big Five personality dimensions cluster into two super-ordinate traits, with agreeableness/conscientiousness/emotional stability forming one dimension and extraversion/openness to experience forming the other. Reference DigmanDigman (1997) labelled these higher-level variables alpha and beta, respectively, and proposed that alpha represents socialization/communion whereas beta taps agency/self-assertion. A related proposal from Reference DeYoung, Peterson and HigginsDeYoung, Peterson, and Higgins (2002) labels these factors “stability” and “plasticity”, and posits that these are respectively positively and negatively associated with social conformity.
Our findings can be mapped onto this putative two-factor structure: the alpha traits were positively associated with a tendency to use “larger” comparatives whereas the beta traits were not. One explanation is that, because “larger” comparatives are the default (Reference ClarkClark, 1969; Reference Matthews and DylmanMatthews & Dylman, 2014), people with a greater tendency to social conformity (i.e., those with higher alpha scores) will be more likely to follow this convention than those with a more individualistic streak. Notably, when all Big Five traits were entered as predictors together, only the effect of agreeableness remained above zero.
The two-factor conception of the Big Five has been disputed (e.g., Reference Ashton, Lee, Goldberg and de VriesAshton, Lee, Goldberg & de Vries, 2009), and our studies were not designed to address this model or to test whether the putative superordinate factors exert different effects on language use. Indeed, although the confidence intervals for the putative beta traits cross zero, their estimated effects are in the same direction as the other traits, perhaps consistent with a single general factor (e.g., Reference MusekMusek, 2007; but see Reference MuncerMuncer, 2011). Correspondingly, our suggestions about the possible basis for our findings are very tentative, and could be tested in future by the inclusion of a direct test of social conformity or socially-desirable responding (e.g., Reference StöberStöber, 2001).
Demographic variables.
We found no evidence that gender is associated with people’s choice of comparative. However, age was associated with a stronger tendency to select a “larger” comparative in the Choice Task, an effect which persisted after controlling for mood and personality traits. We again interpret this result in terms of social convention and conformity: older people typically score higher on measures of social desirability (e.g., Vigil-ColetReference Vigil-Colet, Morales-Vives and Lorenzo-Seva, Morales-Vives & Lorenzo-Seva, 2013) so, akin to the discussion of personality traits above, we would expect a more pronounced tendency to adopt the modal, conventional comparative when communicating relative magnitude.
5 Conclusions
The decision to say “A is larger than B” rather than “B is smaller than A” depends on several features of the compared items, including their absolute magnitude, spatial layout, and order of appearance. In contrast, the selection of a comparative adjective is only weakly related to key individual-difference measures: broadly speaking, whether a person says “smaller” or “larger” is independent of key demographic and dispositional traits. To the extent that their are individual differences in the language of comparison, these might substantially reflect differences in the tendency to use the most widespread, socially-conventional term, a possibility that can straightforwardly be investigated in future.
Appendix
Note:
* indicates 95% confidence interval excludes zero.


 Open access