


1. Introduction
Meltwater on ice surfaces can collect in depressions and form supraglacial channels (i.e. rivers and streams) which erode the ice thermally as they flow down-slope (Pitcher and Smith, Reference Pitcher and Smith2019). Supraglacial channels typically deliver meltwater into lakes, moulins, surface crevasses, fractures or directly off the ice margin. Additionally, channels are often interconnected with lakes, forming complex networks that transport meltwater across ice sheet and ice shelf surfaces (Yang and Smith, Reference Yang and Smith2012; Smith and others, Reference Smith2015; Yang and others, Reference Yang, Smith, Fettweis, Gleason, Lu and M2019a; Lu and others, Reference Lu, Yang, Lu, Gleason, Smith and Li2020a). Recent advances in remote sensing technologies, especially satellite observations, have dramatically improved our understanding of supraglacial hydrology. In particular, surface meltwater on ice sheets has been shown to be extensive (Smith and others, Reference Smith2015; Kingslake and others, Reference Kingslake, Ely, Das and Bell2017; Stokes and others, Reference Stokes, Sanderson, Miles, Jamieson and Leeson2019; Arthur and others, Reference Arthur, Stokes, Jamieson, Carr and Leeson2020a; Yang and others, Reference Yang2021; Dell and others, Reference Dell, Willis, Arnold, Banwell and de Roda Husman2024), and recent observations suggest that meltwater drainage systems on ice shelves have been forming regularly for at least several decades (Kingslake and others, Reference Kingslake, Ely, Das and Bell2017; Banwell and others, Reference Banwell, Willis, Stevens, Dell and MacAyeal2024). Therefore, the significance of hydrological processes on Greenland and Antarctic ice sheets continues to grow (Cooley and others, Reference Cooley, Smith, Stepan and Mascaro2017; Flowers, Reference Flowers2018; Hanna and others, Reference Hanna2024).
Although operating as interlinked drainage networks, supraglacial lakes and channels are often investigated as independent features, and most studies have typically focused on supraglacial lakes (Langley and others, Reference Langley, Leeson, Stokes and Jamieson2016; Stokes and others, Reference Stokes, Sanderson, Miles, Jamieson and Leeson2019; Arthur and others, Reference Arthur, Stokes, Jamieson, Carr and Leeson2020b, Reference Arthur, Stokes, Jamieson, Rachel Carr, Leeson and Verjans2022). Only a few studies have investigated the supraglacial channels that connect lakes and the distribution and connectivity of larger scale channel networks (Lenaerts and others, Reference Lenaerts2017; Tuckett and others, Reference Tuckett2019; Yang and others, Reference Yang2019b; Lu and others, Reference Lu2020b). Supraglacial channels on ice sheets are mechanistically distinct from terrestrial rivers because they typically contain negligible amounts of sediment (Pitcher and Smith, Reference Pitcher and Smith2019). The formation and evolution of supraglacial channels are instead influenced by thermal erosion and glacier flow, which generate a dynamic topographic control on their size and shape (e.g. Knighton, Reference Knighton1985; Karlstrom and Yang, Reference Karlstrom and Yang2016). The topography of the ice surface is an important influence on the type of supraglacial drainage pattern, which may include the influence of ice surface roughness and longitudinal surface flow structures (e.g. flow-stripes) (Holt and others, Reference Holt, Glasser and Quincey2013; Rippin and others, Reference Rippin, Pomfret and King2015). Despite some obvious differences, there are also similarities with their terrestrial counterparts. For example, like rivers, supraglacial channels exhibit meandering and bifurcate (Karlstrom and others, Reference Karlstrom, Gajjar and Manga2013; Yang and others, Reference Yang2016).
The spatial and temporal evolution of supraglacial channels can be quantified using various fluvial metrics (e.g. stream order, bifurcation ratio, sinuosity), which also help to further explore the influence of channels on ice shelf stability. For example, channels with large dimensions (i.e. width and depth) can transport larger volumes of meltwater across longer distances, and channel networks with high stream order exhibit greater complexity and size. Therefore, an analysis of stream order and drainage density provides insights into how meltwater is delivered; whether it is dispersed across numerous narrower, lower-order channels or concentrated in larger, higher-order channels that capture meltwater from a larger area. This, in turn, governs the location and volume of surface water delivered to crevasses or moulins, possibly triggering or enlarging ice fractures on ice shelves, known as hydrofracturing (Banwell and others, Reference Banwell, Caballero, Arnold, Glasser, Mac Cathles and Macayeal2014; MacAyeal and others, Reference MacAyeal, Sergienko and Banwell2015; Dunmire and others, Reference Dunmire2020). Additionally, the meander cutoffs on ice surfaces may indicate substantial dynamics within supraglacial channels (Rippin and others, Reference Rippin, Pomfret and King2015). For instance, Karlstrom and others (Reference Karlstrom, Gajjar and Manga2013) modelled the meander evolution in supraglacial channels, attributing the process to channel curvature-induced instability that enhances melting at the outside of bends. They suggested that while some supraglacial channels are likely reused from year to year, supraglacial drainage reorganizes annually, transitioning from initial channel formation to large-scale structures as surface melting fluctuates. Rippin and others (Reference Rippin, Pomfret and King2015) provided observational evidence of prominent meanders in the supraglacial channels of Midtre Lovénbreen, Svalbard, through high-resolution imagery. Their findings not only support Karlstrom and others (Reference Karlstrom, Gajjar and Manga2013) theory but also reveal a micro-channel network (ranging from a few to several tens of centimetres in width) shaped by structural features within the glacier. Yang and others (Reference Yang2016) mapped supraglacial channel networks on the southwest Greenland Ice Sheet (GrIS) using WorldView-1/2 satellite imagery. They assigned stream orders to supraglacial channel networks and found that meltwater travels significant distances (>10 km) across the ice surface before being captured by a moulin or reaching the margin of the ice sheet, which results in the formation of an efficient or ‘organized’ (i.e. high-order) network. Their results also indicated that supraglacial channel networks on the GrIS tend to be more fragmented at lower elevations with faster ice flow velocities. This is likely due to the development of more moulins and crevasses, meaning that the meltwater is more likely to drain into the low-elevation areas and thus appear as a more ‘disorganized’ (i.e. low-order) networks.
Comprehending how meltwater flows across ice shelves is important because there are several possible mechanisms that connect surface melting to ice shelf stability. Thus, understanding the role of supraglacial channels in redistributing meltwater is potentially significant for predictions of future mass loss from ice sheets. Channels delivering meltwater produced elsewhere supplement locally generated meltwater, meaning that supraglacial lakes on ice shelves could grow larger than limits imposed by local melting, and extra water can be supplied into crevassed regions (Bell and others, Reference Bell, Banwell, Trusel and Kingslake2018; Leeson and others, Reference Leeson, Forster, Rice, Gourmelen and Van Wessem2020). In addition, it is also crucial to know the extent to which channels transport meltwater directly off the ice sheet, rather than percolating into the snow-firn and refreezing, which has profound implications for surface mass balance (Dell and others, Reference Dell, Willis, Arnold, Banwell and de Roda Husman2024). Furthermore, surface meltwater is expected to be more extensive in Antarctica under future climate warming (Bell and others, Reference Bell2017; Cooley and others, Reference Cooley, Smith, Stepan and Mascaro2017; Van Wessem and others, Reference Van Wessem, Van Den Broeke, Wouters and Lhermitte2023). Indeed, DeConto and Pollard (Reference DeConto and Pollard2016) added the effects of meltwater hydrofracturing on Antarctic ice shelves to their ice sheet model and found that surface meltwater could induce widespread hydrofracturing on ice shelves during the early 21st century, which may significantly increase the contribution of the Antarctic ice sheet to sea-level rise. As a result, understanding the behaviour and distribution of supraglacial channel networks is crucial for understanding the dynamics of ice sheets and the stability of ice shelves. However, there is a lack of comprehensive information regarding the broad-scale fluvial morphometry and connectivity of these drainage systems (e.g. stream order, sinuosity, drainage patterns, etc.) and the underlying controls on these processes. As a consequence, the extent to which channelized drainage might efficiently remove surface meltwater from ice shelves or simply re-distribute water across the surface before refreezing is largely unknown. Here, we map large (>30 m wide) supraglacial channel networks on five ice shelves in Antarctica using Landsat-8 imagery during the peak of the melt season in 2020 and 2022. To comprehensively describe the morphometry of the supraglacial channel networks, we quantify the key fluvial metrics (i.e. number, length, width, depth, sinuosity, bifurcation ratio, orientation, slopes and drainage density) and compare the drainage patterns observed on each ice shelf. We also present an analysis of the controls responsible for the distribution of supraglacial channel networks by extracting information from the Reference Elevation Model of Antarctica (REMA) data and ice flow velocity data (Shen and others, Reference Shen, Wang, Shum and Jiang2021), with a particular focus on surface topography and structural glaciology.
2. Study sites
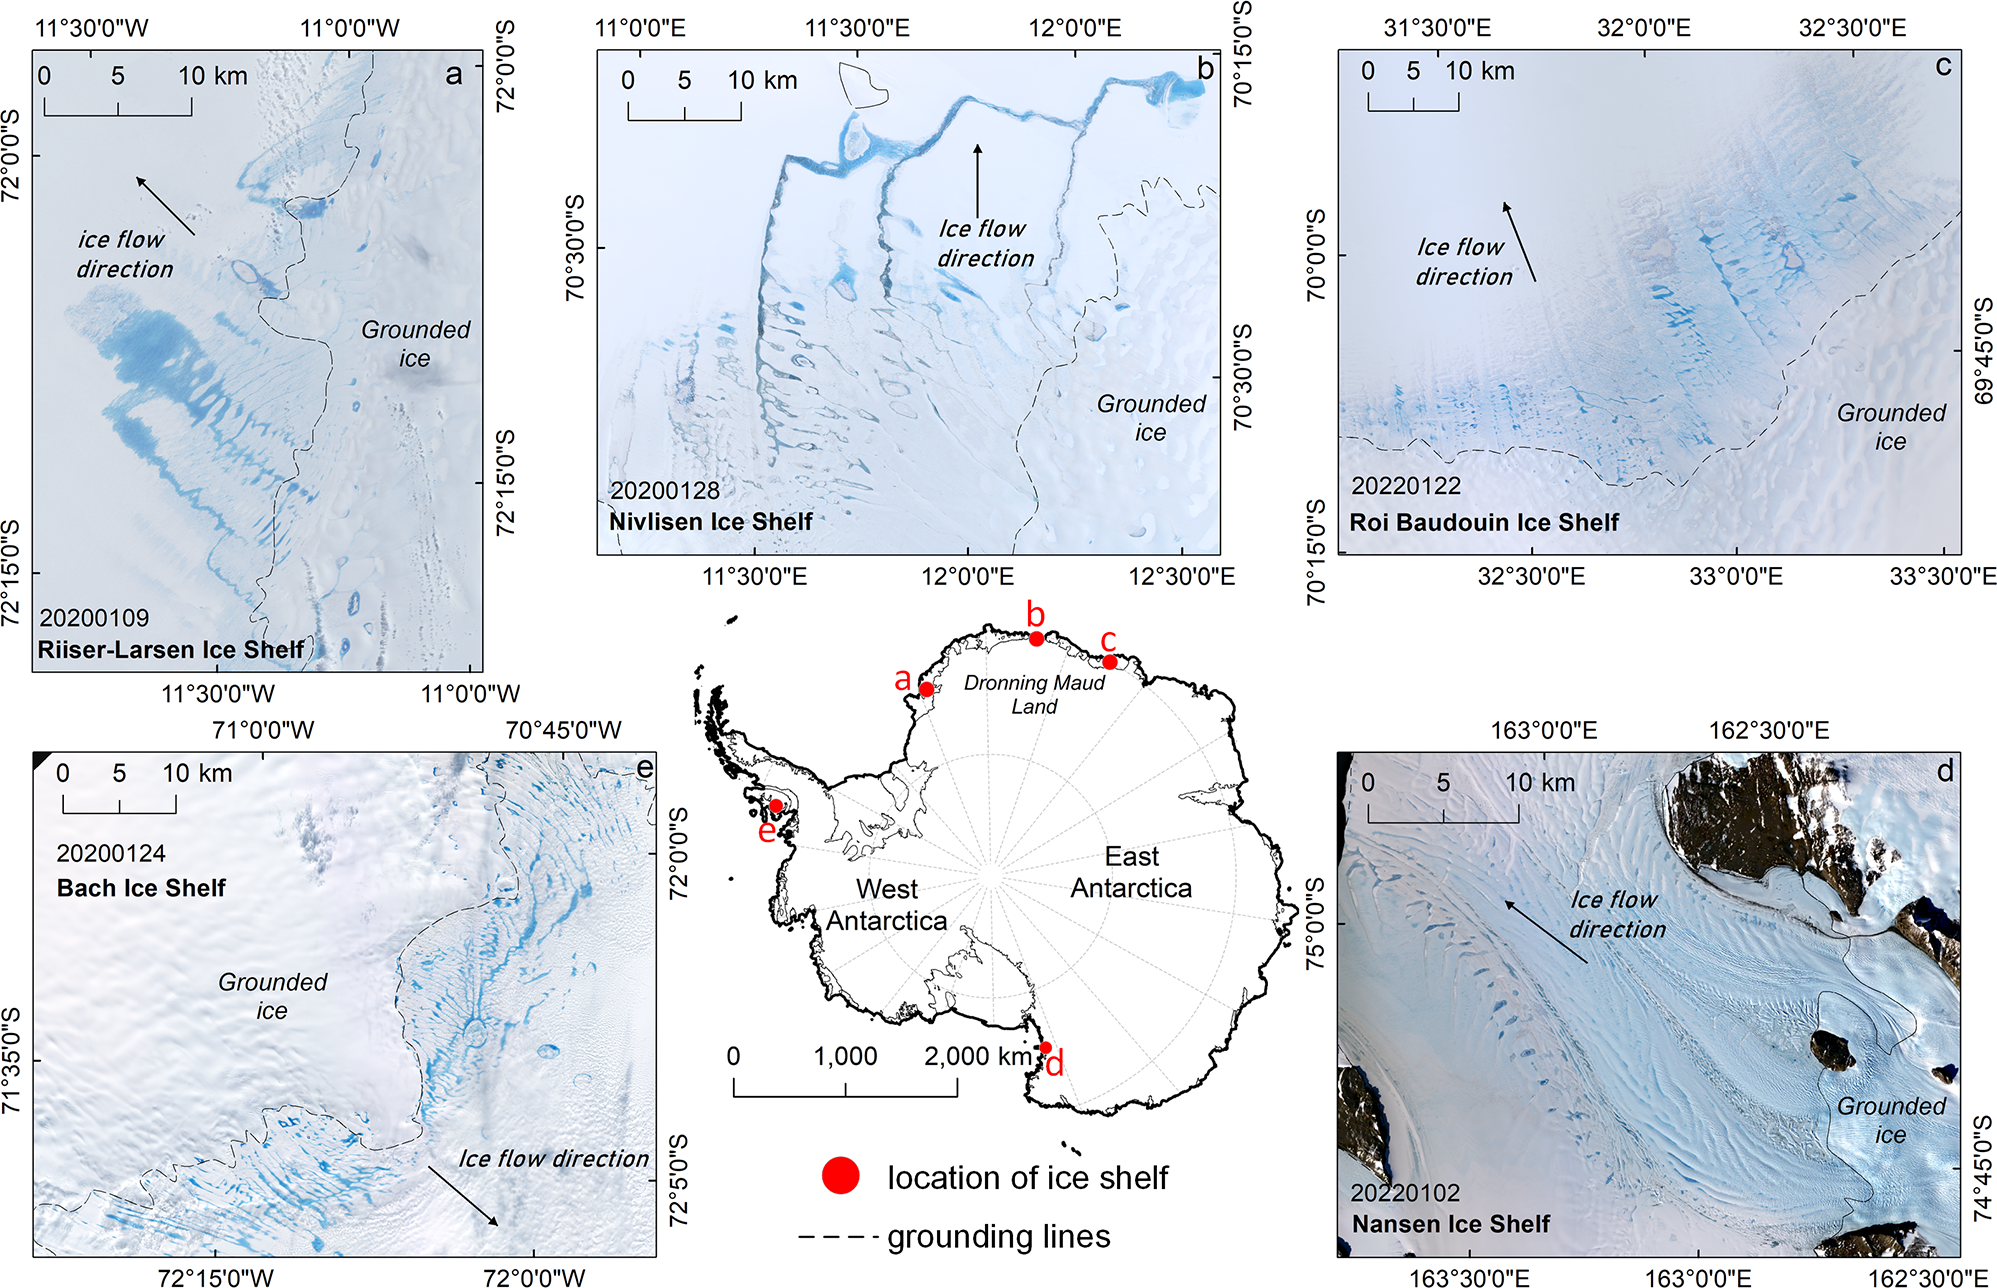
The five ice shelves investigated in this study are the Riiser-Larsen, Nivlisen, Roi Baudouin, Nansen and Bach ice shelves (Fig. 1 and Table 1). They were selected because they have widespread supraglacial lakes and channels, with channels displaying a range of drainage characteristics under different glaciological and climatic conditions (Kingslake and others, Reference Kingslake, Ng and Sole2015; Dirscherl and others, Reference Dirscherl, Dietz and Kuenzer2021; Arthur and others, Reference Arthur, Stokes, Jamieson, Rachel Carr, Leeson and Verjans2022; Corr and others, Reference Corr, Leeson, Mcmillan, Zhang and Barnes2022; Dell and others, Reference Dell2022).
Examples of supraglacial lakes and channels on selected Antarctic ice shelves: (a) Riiser-Larsen, (b) Nivlisen, (c) Roi Baudouin, (d) Nansen and (e) Bach using Landsat-8 true colour composites. The Antarctic coastline data (including the grounding line) were downloaded from the UK Polar Data Centre (Gerrish and others, Reference Gerrish, Fretwell and Cooper2020).
Key characteristics of the studied Antarctic ice shelves
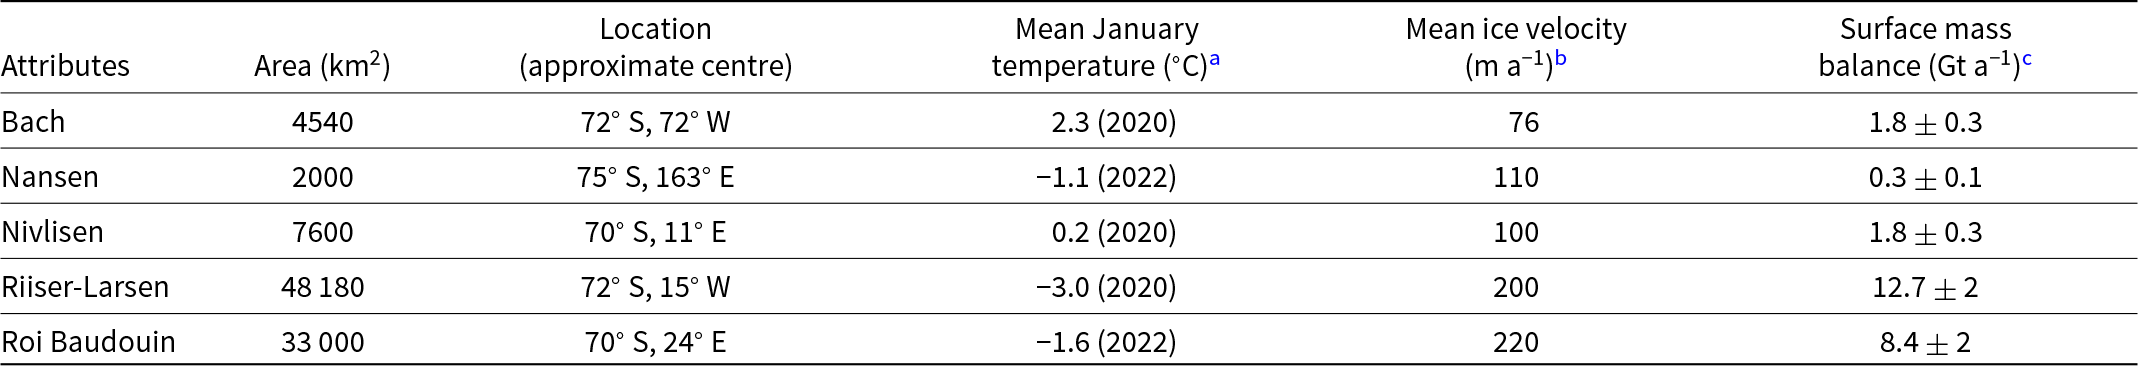
a Mean January temperature datasets were obtained from the British Antarctic Survey (https://legacy.bas.ac.uk/met/READER/).
b The mean ice velocity data were extracted from Shen and others (Reference Shen, Wang, Shum and Jiang2021).
c Surface mass balance data were taken from Rignot and others (Reference Rignot, Jacobs, Mouginot and Scheuchl2013).
Three of the studied ice shelves (Riiser-Larsen, Nivlisen and Roi Baudouin) are all located in Dronning Maud Land, East Antarctica. The Riiser-Larsen Ice Shelf (72° S, 15° W: Fig. 1a) covers ∼48 180 km2 and extends ∼400 km between Cape Norvegia and Lyddan Island (Dirscherl and others, Reference Dirscherl, Dietz and Kuenzer2021). The Nivlisen Ice Shelf (70° S, 11° E: Fig. 1b) is 123 km wide and 92 km long, occupying a total area of ∼7600 km2. The ice thickness of Nivlisen Ice Shelf ranges between 150 m and 700 m in the southeast, and it has an average ice shelf flow speed of ca. 100 m a−1. The Roi Baudouin Ice Shelf (70° S, 24° E: Fig. 1c) in eastern Dronning Maud Land has an area of ∼33 000 km2 and is separated by the Derwael Ice Rise into its western and eastern parts (Eisermann and others, Reference Eisermann, Eagles, Ruppel, Läufer and Jokat2021). It extends along the coastline in a southwest-northeast direction for about 350 km, with a width of about 50–100 km. Supraglacial channels have been previously studied on the Roi Baudoin Ice Shelf (Lenaerts and others, Reference Lenaerts2017), where a lake drainage event has also been observed (Dunmire and others, Reference Dunmire2020). Trusel and others (Reference Trusel, Frey, Das, Munneke and Van Den Broeke2013) estimated continent-wide surface meltwater production over Antarctica by using radar backscatter. Their results showed that Roi Baudouin exhibited the highest surface meltwater flux rates (i.e. about 120 mm w·e·a−1), followed by Nivlisen at around 80 mm w·e·a−1 and Riiser Larsen at approximately 70 mm w·e·a−1. By selecting these three ice shelves for analysis, this study aims to observe whether channel networks on their surfaces have differing extents and drainage patterns despite experiencing similar climatic conditions. Alternatively, any observed differences in supraglacial lakes and channels may be more clearly attributed to variations in local factors, such as topography and glaciological structure.
The Nansen Ice Shelf (70° S, 11° E: Fig. 1d) is located along the edge of the Ross Sea, covering an area of 1800 km2 in Victoria Land. Its thickness ranges from 1000 m at the grounding line of Priestley Glacier to 120 m at the ice shelf terminus. Unlike surface drainage networks that retain meltwater on most ice shelves, it has been suggested that a major supraglacial river on the Nansen Ice Shelf can export a significant component of the annual surface melt (around 0.04–0.56 km3 in each melt season) off the ice margin directly via a 130 m-wide seasonal waterfall (Bell and others, Reference Bell2017). Indeed, Bell and others (Reference Bell2017) noted that the export of meltwater by drainage networks may potentially stabilize the ice shelf through reducing the stored surface water, which is contrary to the view that channels delivering water may accelerate ice shelf collapse. The Bach Ice Shelf (72°S,72°W: Fig. 1e) has an area of ~4,540 km2 and a maximum thickness of 821 m and its mean ice flow velocity is comparatively low with a maximum of only 76 m a-1. Significant coverage of supraglacial lakes (around 110 km2) and surface drainage systems on Bach Ice Shelf have been observed from Sentinel-2 imagery by Dirscherl and others (Reference Dirscherl, Dietz and Kuenzer2021). They found that the extent of lakes with high annual recurrence are sensitive to the air temperature, but their study did not analyse supraglacial channels.
3. Data and methods
3.1. Remotely sensed data
Landsat-8 Operational Land Imager (OLI) imagery, with a spatial resolution of 30 m, is frequently used to map supraglacial features such as channels and lakes (Lampkin and VanderBerg, Reference Lampkin and VanderBerg2014; Yang and Smith, Reference Yang and Smith2016; Bell and others, Reference Bell2017; Kingslake and others, Reference Kingslake, Ely, Das and Bell2017; Tuckett and others, Reference Tuckett2021; Dell and others, Reference Dell, Willis, Arnold, Banwell and de Roda Husman2024). Landsat-8 Level 2 datasets were accessed from the Earth Explorer website (http://earthexplorer.usgs.gov/). These datasets are atmospherically corrected, so additional processing to mitigate atmospheric effects is not required. The focus of the study is to investigate the controls on the drainage patterns of supraglacial channel networks around the peak of the melt season, rather than temporal evolution. Therefore, for each location, Landsat-8 images were selected on one date in either January 2020 or January 2022 (Table 2), as both the meltwater volume and extent of channel networks are considered to be closest to the their peak during this time of year (Nicolas and others, Reference Nicolas2017; Stokes and others, Reference Stokes, Sanderson, Miles, Jamieson and Leeson2019; Arthur and others, Reference Arthur, Stokes, Jamieson, Rachel Carr, Leeson and Verjans2022), making it easier to compare their characteristics on different ice shelves. We also inspected imagery in December and February and noted that drainage systems were fewer than in January. We then selected individual images on the basis of those with the most surface water within the month of January so that channels and lakes could be consistently mapped. Satellite imagery was captured in low cloud cover (below the ≤30% threshold) conditions.
Landsat-8 OLI images and DEM information
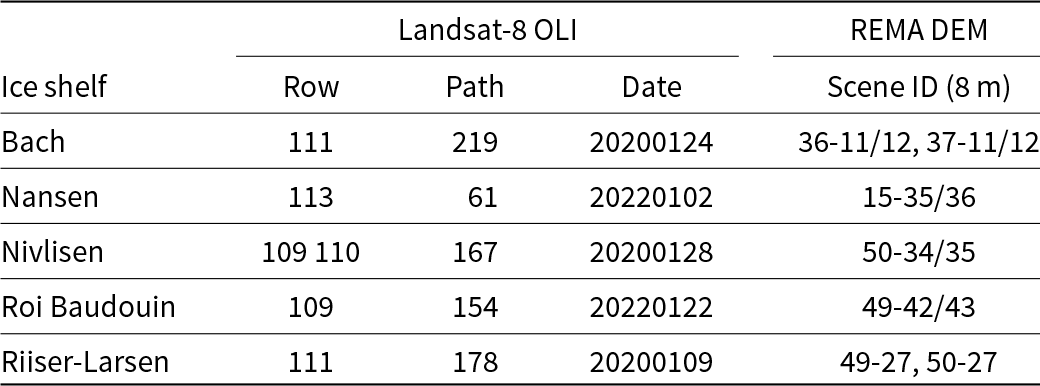
This study used the 8 m resolution REMA mosaic (version 1) digital elevation model (DEM) data to obtain the surface elevation of the ice shelves and the catchments of the supraglacial channel networks. REMA is generated from high-resolution optical satellite imagery acquired between 2011 and 2017 (Howat and others, Reference Howat, Porter, Smith, Noh and Morin2019) and was downloaded from the U.S. Polar Geospatial Centre (https://www.pgc.umn.edu/data/rema/). Given that the regional ice surface elevations are unlikely to have changed significantly at selected sites during the period of study (Hogg and others, Reference Hogg, Gilbert, Shepherd, Muir and McMillan2021), and that surface depressions have been observed to remain spatially fixed over yearly timescales, temporal non-coincidence should not have a significant influence on our results (Karlstrom and Yang, Reference Karlstrom and Yang2016).
3.2. Automated mapping of supraglacial channels and lakes
Each Landsat-8 Level 2 image was clipped to cover the areal extent of each ice shelf and projected to the Antarctic Polar Stereographic projection, referenced to the WGS84 horizontal datum (EPSG:3031) which corresponds with REMA. The Normalized Difference Water Index adapted for ice (NDWIice) is commonly used in glacial environments to extract water features from satellite imagery (Moussavi and others, Reference Moussavi2016; Yang and others, Reference Yang2019b; Moussavi, Reference Moussavi2020; Arthur and others, Reference Arthur, Stokes, Jamieson, Carr and Leeson2020b; Corr and others, Reference Corr, Leeson, Mcmillan, Zhang and Barnes2022) and uses the Blue and Red Bands of optical Landsat-8 imagery (see Eqn (1)):
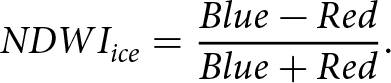 \begin{equation}NDW{I_{ice}} = \frac{{Blue - Red}}{{Blue + Red}}.\end{equation}
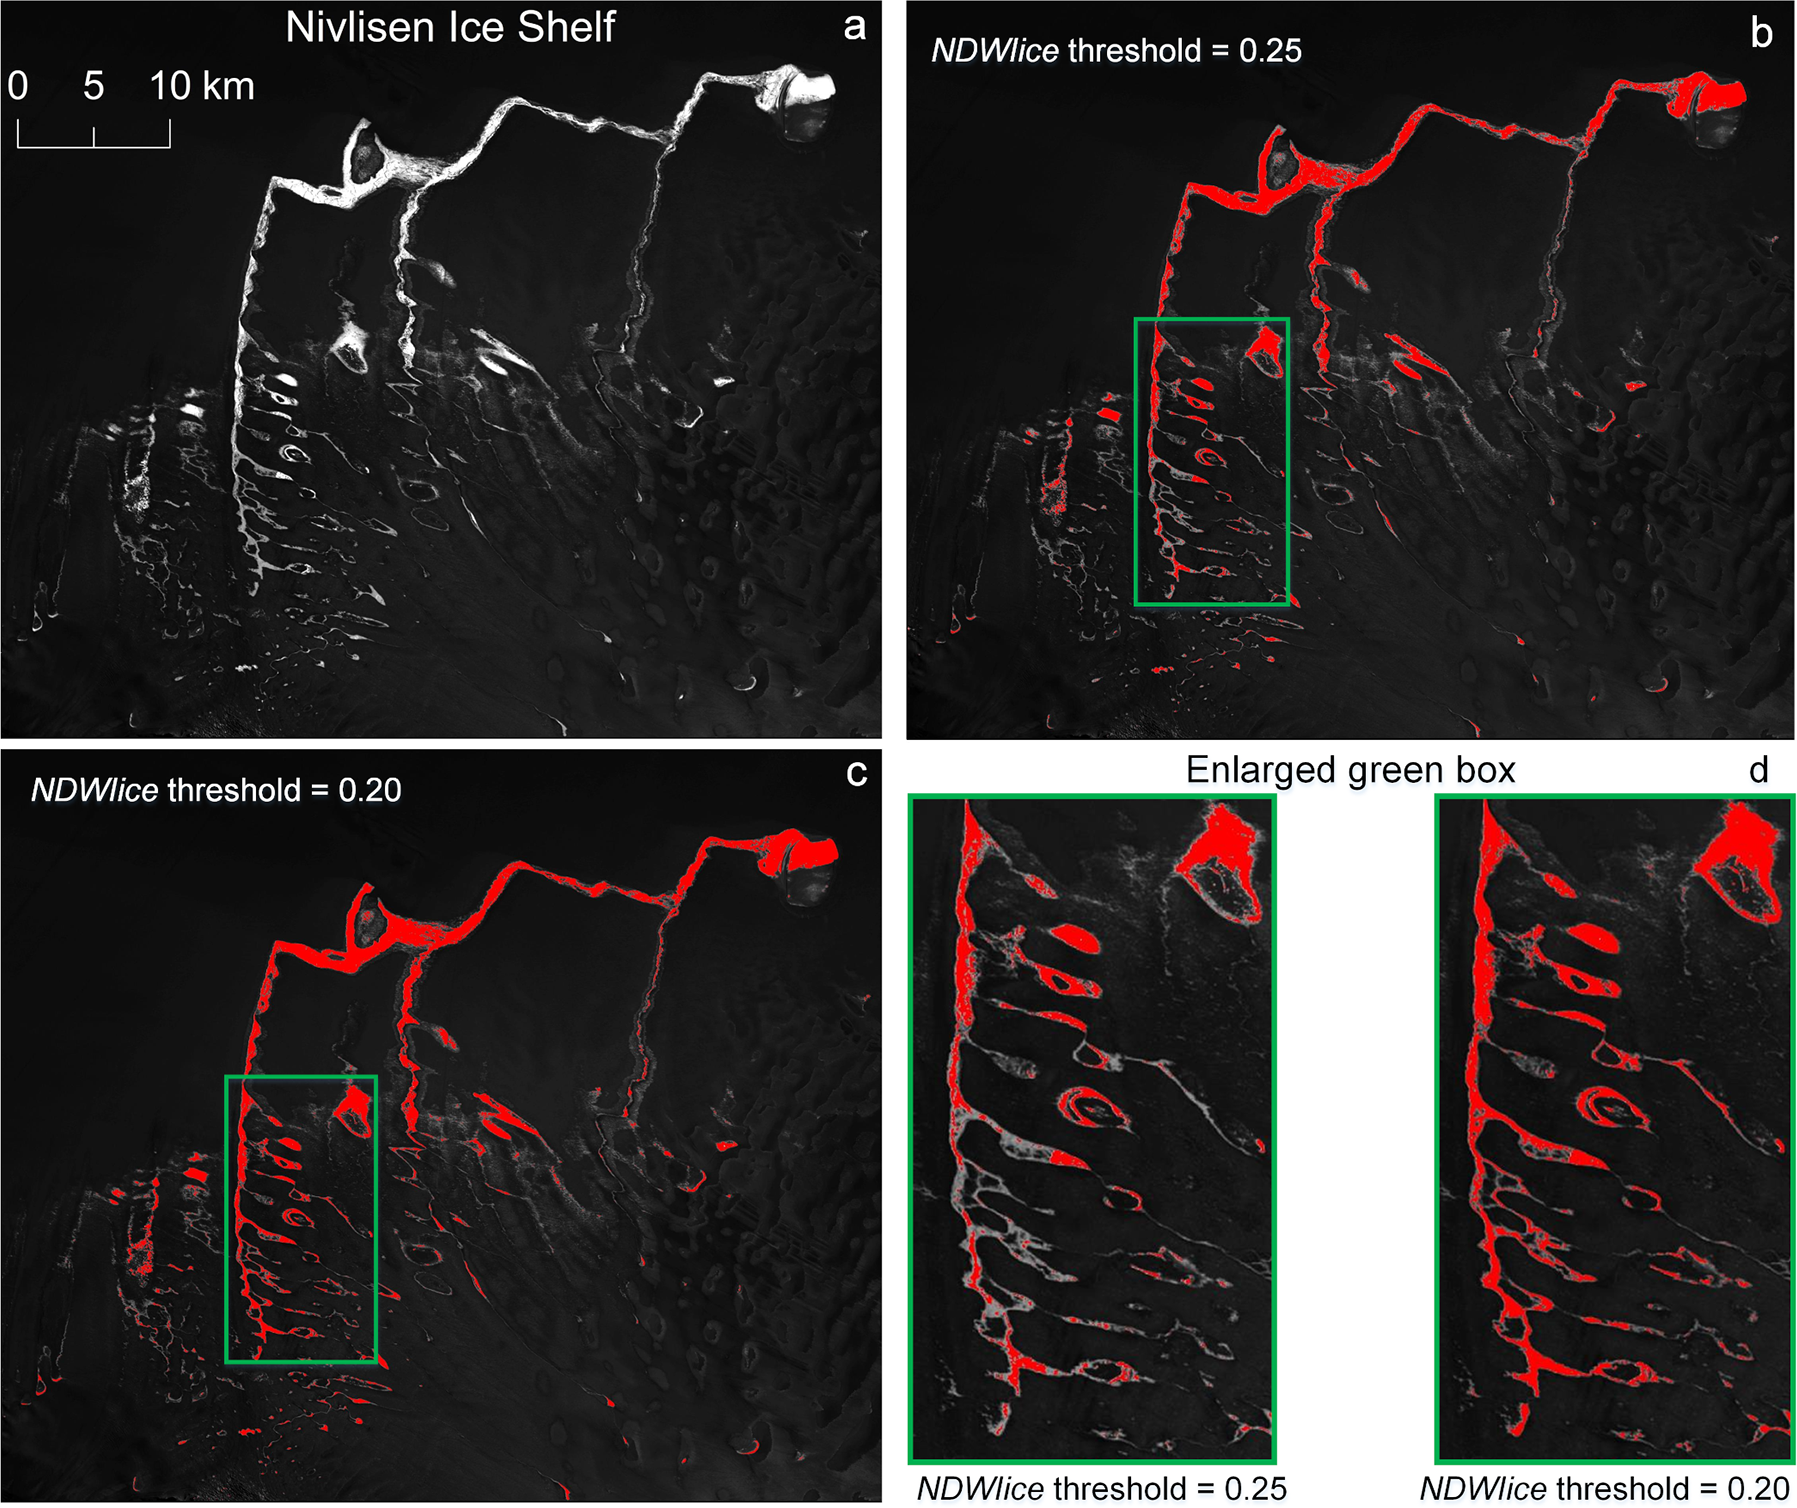
NDWIice can detect surface water accurately, especially for areas containing slush and blue ice (Dell and others, Reference Dell2022; Dell and others, Reference Dell, Willis, Arnold, Banwell and de Roda Husman2024). Thresholds were set for each NDWIice image of each ice shelf to discriminate between water and non-water features. An NDWIice threshold of 0.25 has been widely used in previous studies (Williamson and others, Reference Williamson, Arnold, Banwell and Willis2017; Banwell and others, Reference Banwell, Willis, Macdonald, Goodsell and MacAyeal2019; Dell and others, Reference Dell2020; Arthur and others, Reference Arthur, Stokes, Jamieson, Carr and Leeson2020b) which can better distinguish liquid water from slush and other non-water features. However, a threshold of 0.25 did not appear to identify all the liquid surface water on our studied ice shelves (Fig. 2b). Therefore, we decreased the threshold value in 0.01 intervals and observed the resulting binary water mask to determine the threshold that most closely matched the water visible on a true colour composite. As a result, an NDWIice threshold of 0.2 was applied to all ice shelves in subsequent analyses.
Binary water mask from different NDWIice thresholds of Nivlisen Ice Shelf: (a) NDWIice image generated from Landsat-8 imagery; (b) 0.25 threshold value; (c) 0.20 threshold value; (d) comparison of detail identified using different thresholds (green box in c). The red polygons are the detected surface meltwater.
Although the majority of supraglacial lakes and channels were identified in the preliminary extraction mask, some water pixels were still ignored because of the low contrast between narrow (width <2 pixels, i.e. less than 60 m) flowing tributaries and the surrounding ice surface (Cooley and others, Reference Cooley, Smith, Stepan and Mascaro2017; Feng and others, Reference Feng, Gleason, Yang and Pavelsky2019; Lu and others, Reference Lu, Yang, Lu, Gleason, Smith and Li2020a). Therefore, this study employed an automatic enhancement mapping approach proposed by Yang and others (Reference Yang, Li, Liu, Cheng, Huang and Chen2015) to improve the detection and continuity of supraglacial channels. This method aims to increase the contrast between linear or curvilinear features and the image background in three steps. Firstly, a band-pass filter ramped between 1/1000 m−1 and 1/50 m−1 was applied to de-noise the NDWIice image based on the recommendations from Yang and others (Reference Yang2019b), which removes components smaller than 50 m (i.e. high-frequency noise and fine details) and larger than 1000 m (large-scale background variations). Secondly, a Gabor filter (3 × 3 moving window), a linear filter used for edge detection in image processing, was applied to highlight the cross sections of channels. Thirdly, a morphological operator called parsimonious path opening (PPO) was applied to enhance the connectivity of supraglacial channels longer than 20 pixels (i.e. 600 m). To simplify the procedure and enhance processing speed, particularly for threshold binarization following the PPO operator, the image was normalized to the range of 0–255 and converted to 8-bit unsigned integers. Finally, a global threshold (i.e. between 0 and 255, the range of the 8-bit binary image) was automatically determined based on the resulting image histogram to generate a refined binary channel mask (Yang and others, Reference Yang, Li, Liu, Cheng, Huang and Chen2015; Lu and others, Reference Lu2021). Following this enhancement process, tributary channels on the ice surface were better identified from the image background. Finally, these two masks (i.e. one from the NDWIice threshold to represent the lakes and wide channels [i.e. width >2 pixels] and one from enhancement process to highlight and extract the water pixels for thin and shallow channels) are merged to produce the final water extraction result (Fig. 3). Channels narrower than the resolution of Landsat-8 imagery (i.e. 30 m) may not be included in the mapping result, which limits the analysis of the morphology to only the larger channels. However, as this study aims at relative comparisons of the drainage networks across different ice shelves, the sizeable channels extracted in this study are sufficient for conducting a meaningful analysis of the primary drainage routes (Dell and others, Reference Dell2020; Yang and others, Reference Yang2021).
Supraglacial channels and lakes extracted on each studied ice shelf. The blue polygons represent the surface water this study extracted across the studied ice shelves. Underlying images are REMA DEM data (8 m spatial resolution) with hillshade effect. We classify the surface meltwater on the ice shelves into three general types: individual channels, individual lakes and interconnected channel-lakes (see close-ups from areas of panel ‘e’).
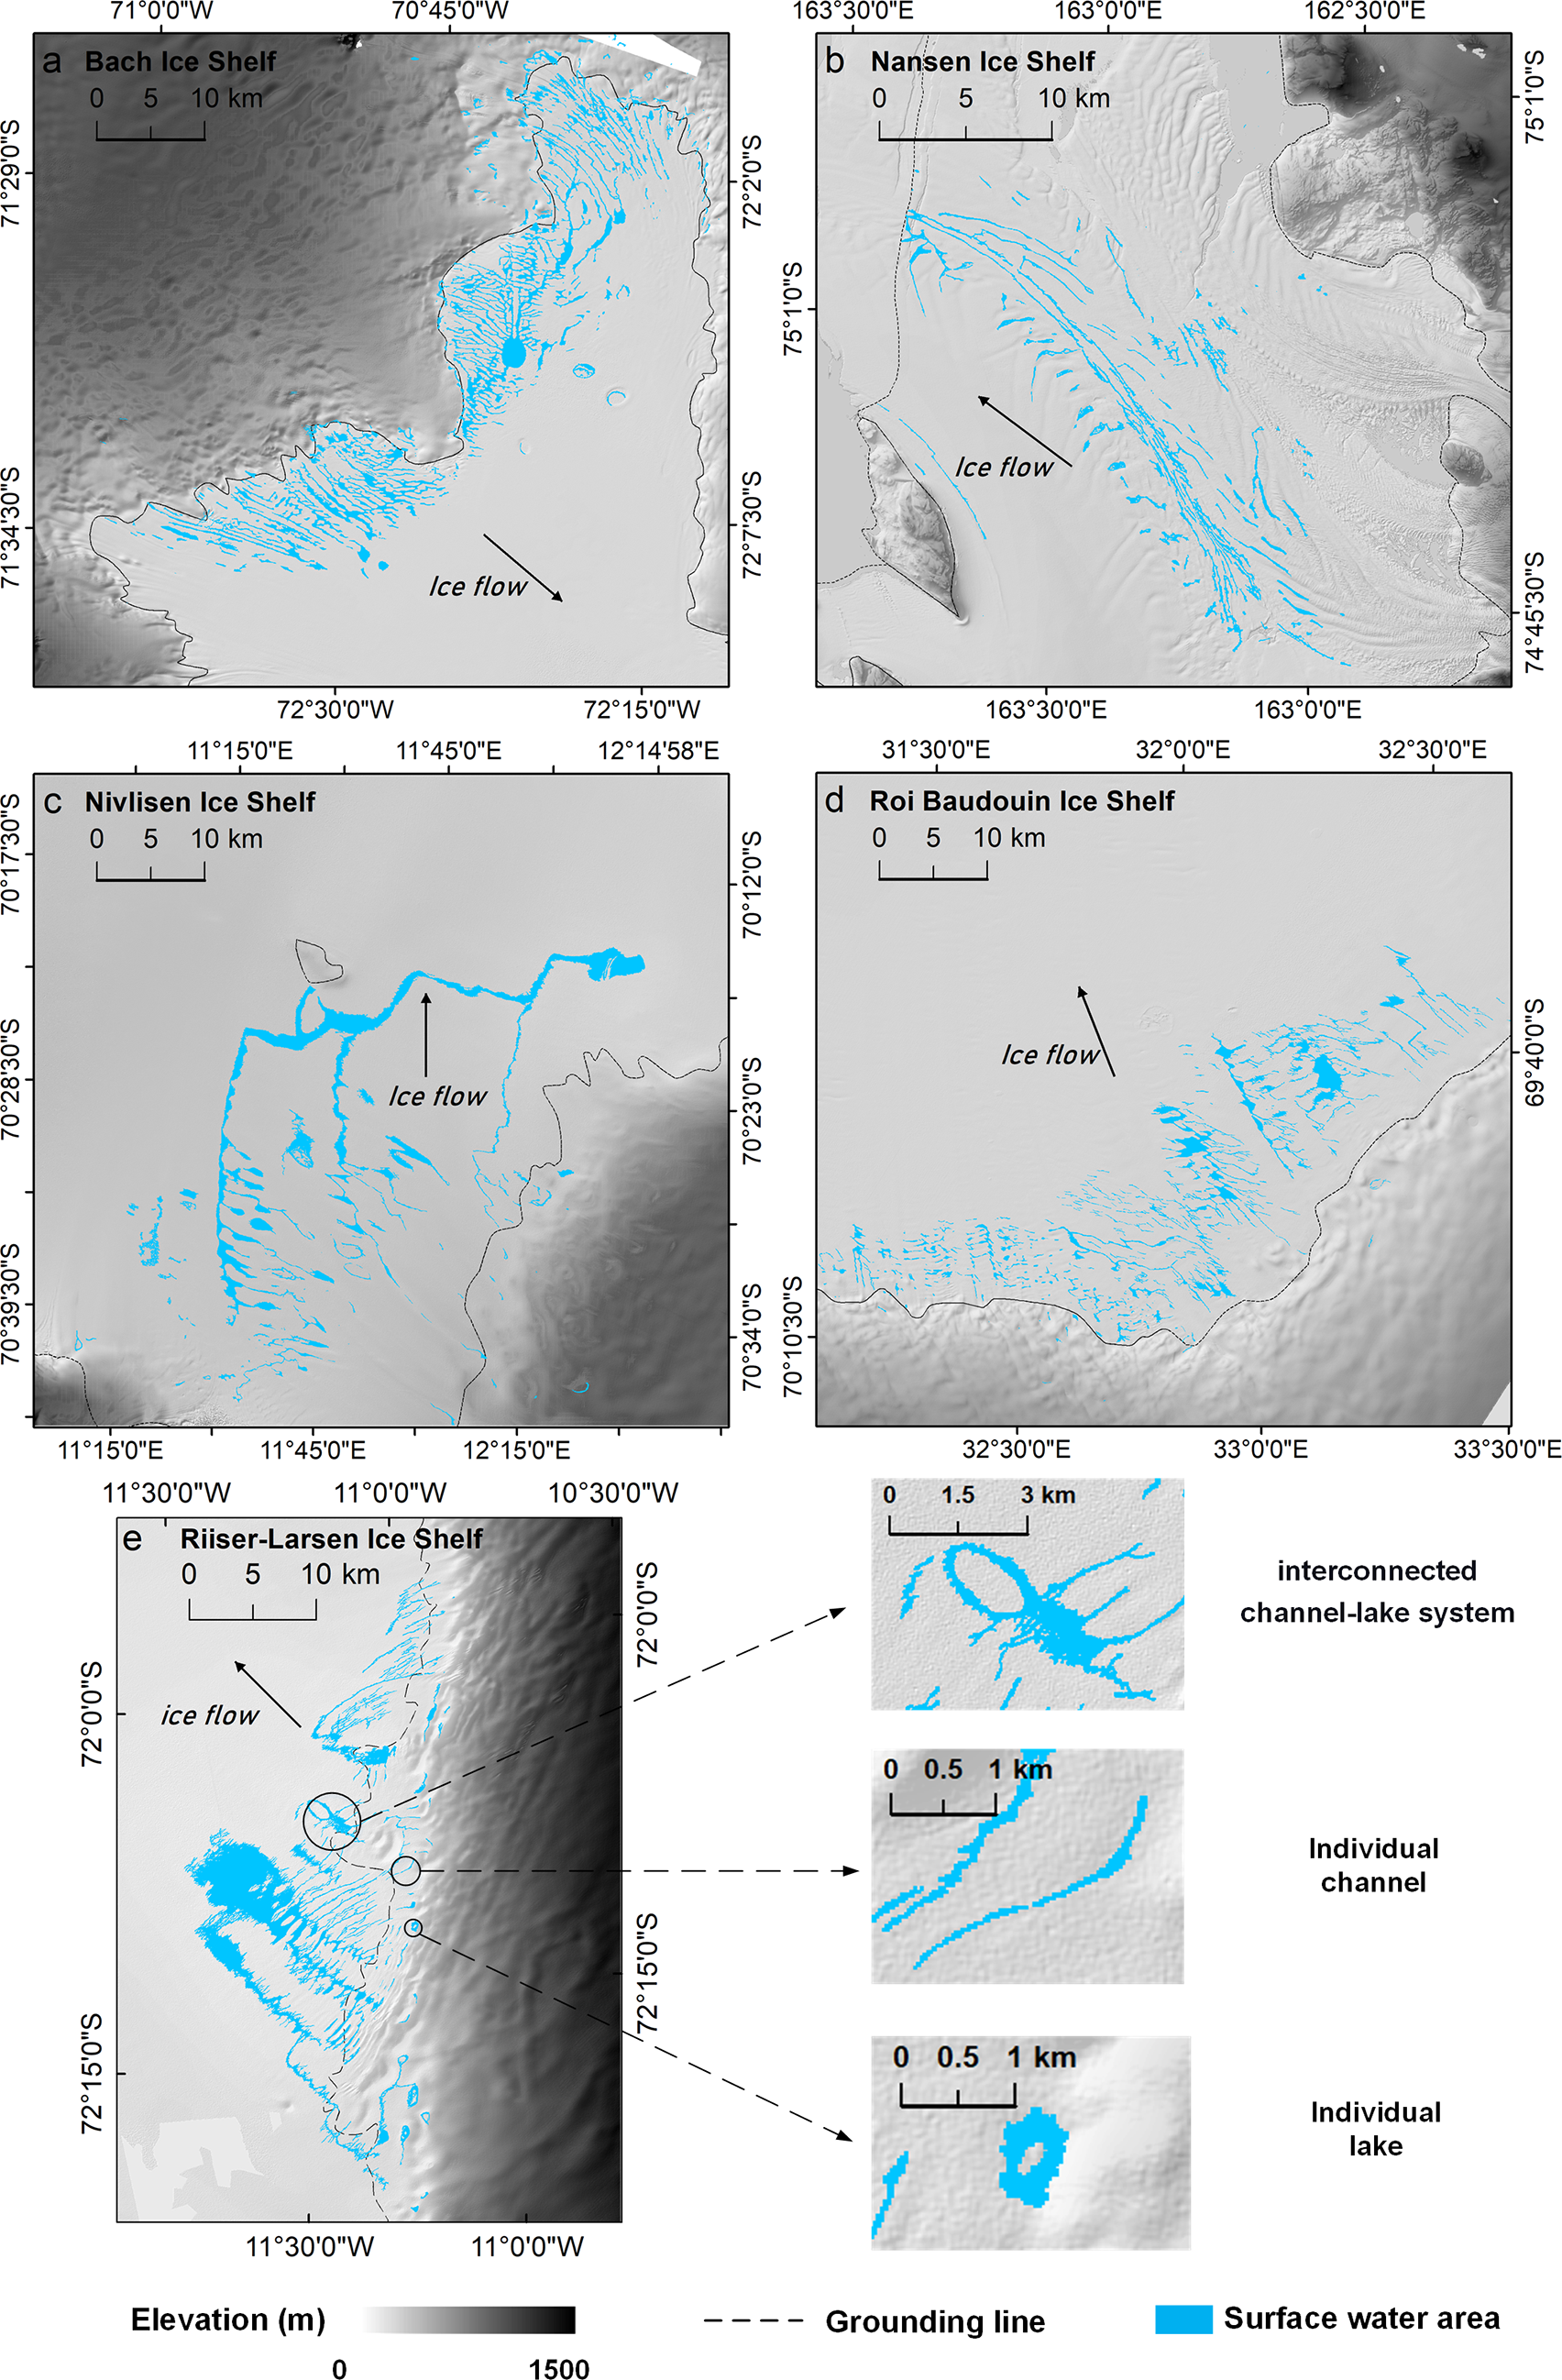
As shown in Fig. 3, the surface meltwater on the ice shelves comprises three broad types of feature: individual channels, individual lakes and interconnected channel-lakes. Individual channels are single channels that may flow into crevasses or the firn layer (note that no obvious moulins or structural features relating to moulins such as ice dolines) were identified in this study, perhaps due to image resolution. Such moulins are relatively rare in Antarctica, compared to Greenland, but have been observed on the Antarctic Peninsula (Tuckett and others, Reference Tuckett2019), the Amery Ice Shelf (Spergel and others, Reference Spergel, Kingslake, Creyts, Van Wessem and Fricker2021; Warner and others, Reference Warner, Fricker, Adusumilli, Arndt, Kingslake and Spergel2021) and on the Roi Baudouin Ice Shelf, Dronning Maud Land, where they are fed by supraglacial channels (Lenaerts and others, Reference Lenaerts2017) and have also been associated with a lake drainage event (Dunmire and others, Reference Dunmire2020). Since individual channels which could also be highly linear lakes, are relatively short, narrow and have minimal influence on the entire network, they were considered as first-order channels (e.g. tributary without inflow) for further analysis. Individual lakes refer to those without any channel inflow or outflow. Some individual lakes may appear as a ring of water around an island of ice. It is possible that some individual lakes are actually fed by channels that are smaller than the 30 m wide detection limitations of optical Landsat-8 imagery. Interconnected channel-lakes are lakes with inflow or outflow channels, allowing meltwater to be transported from one location to another.
To understand the fluvial geometry and connectivity of supraglacial channels (and interconnected lakes), the extracted water mask was transformed into a representation of the channel networks as polylines that follow the central pathway through the mask using the ArcScan tool for ArcGIS (Bajjali, Reference Bajjali2017; Lu and others, Reference Lu2021).
3.3. Ordering supraglacial channel networks
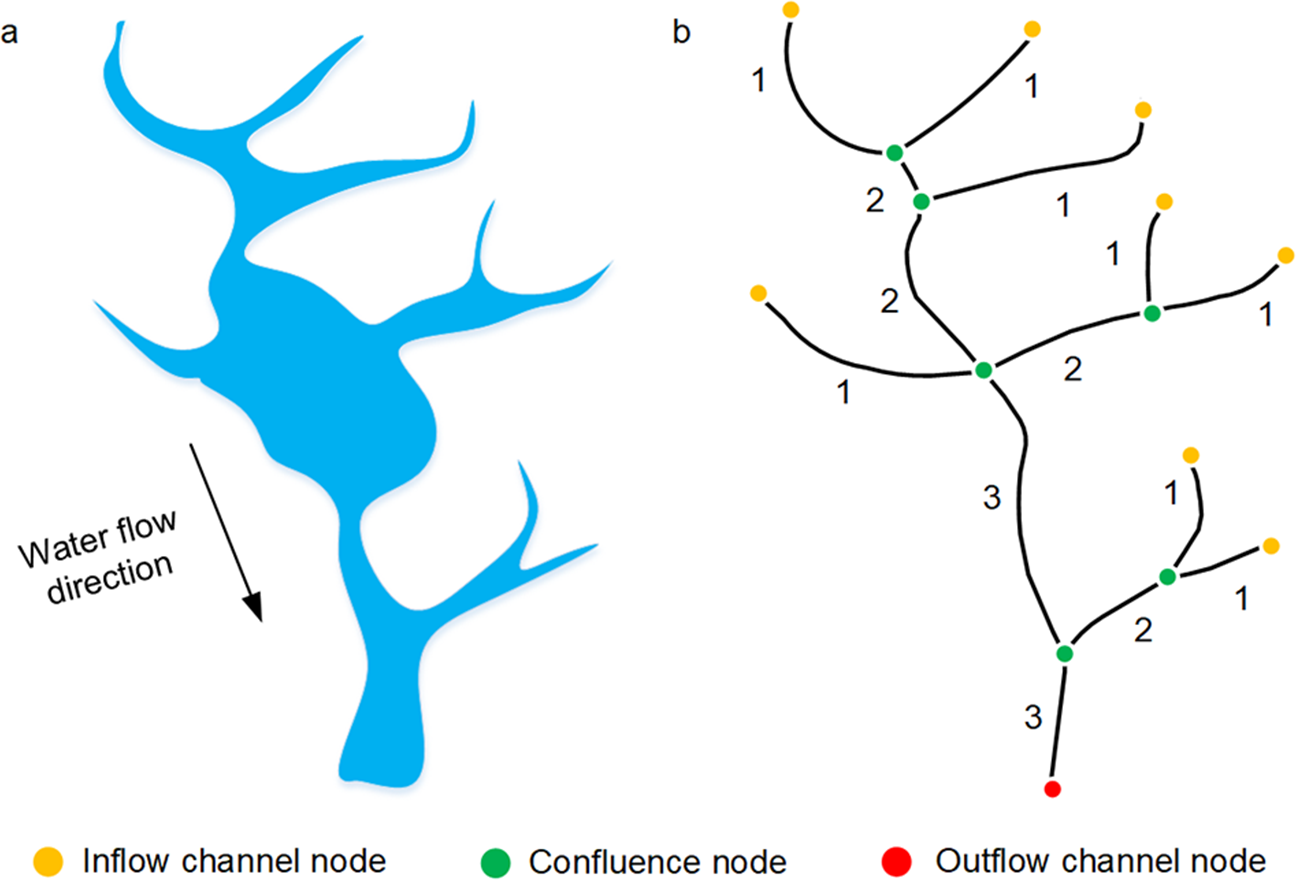
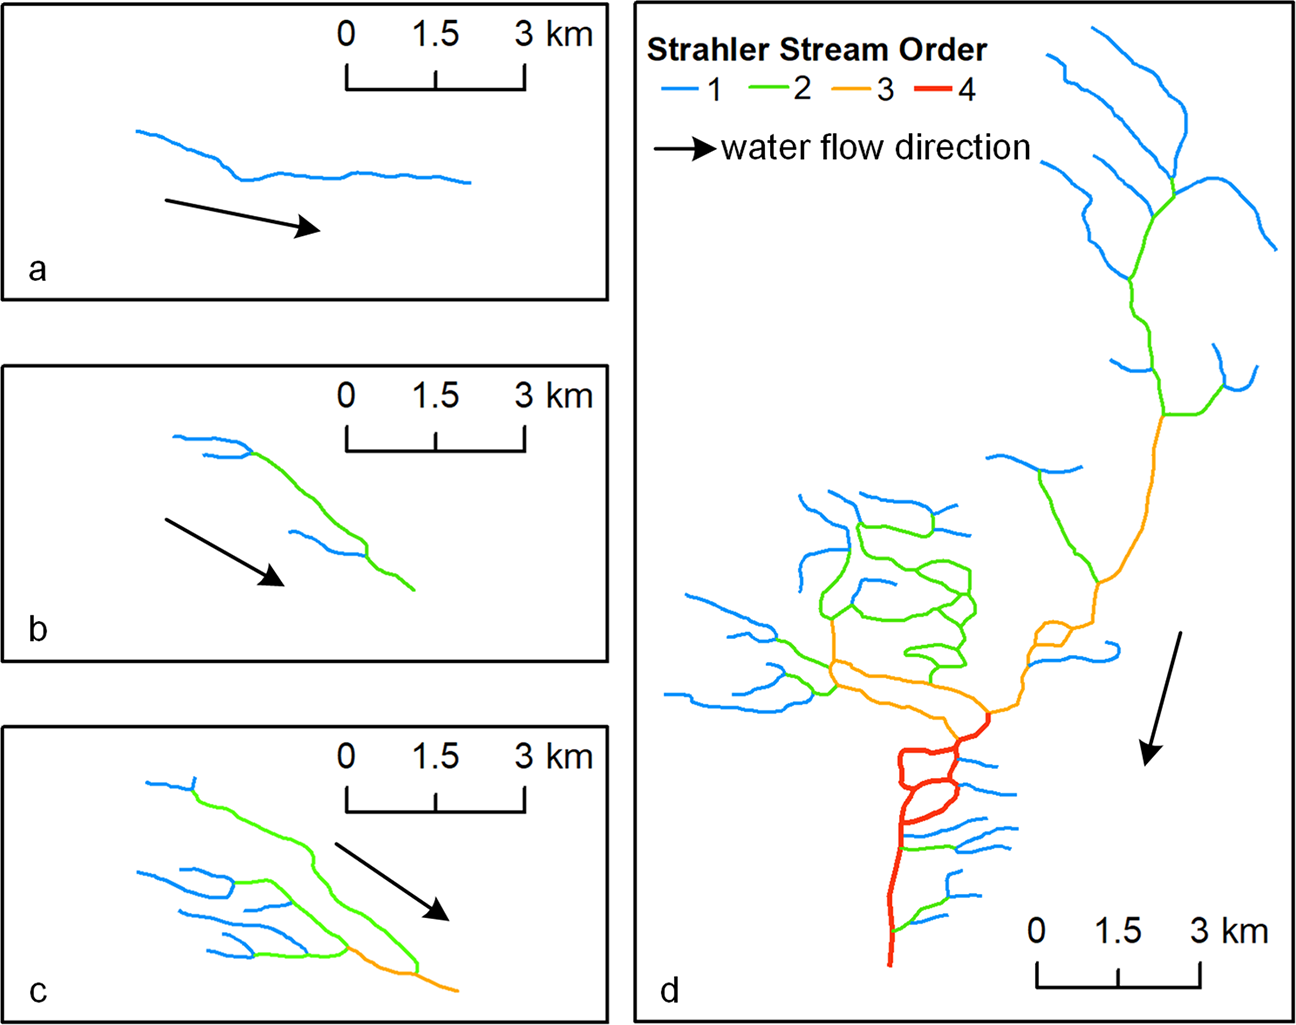
The Strahler stream ordering system was used to classify types of channels based on the number of stream junctions (Strahler, Reference Strahler1957). Figure 4 illustrates the criteria for determining the stream order of a channel network. A channel that has no tributaries is assigned as first-order, while a second-order channel is formed by the confluence of two first-order streams. When two channels with different orders merge into a single channel, it is labelled as the same order as the higher order of the two tributaries. This study assigned the Strahler stream order manually in ArcMap 10.3 software to analyse the structure of drainage networks. This is because hydrological connections can be affected by the spatial organization of channel networks. For example, simple channel networks including more low-order channels are prone to collect water from a limited area and their flow is unlikely to merge with other channels. In addition, the structure of the network provides insights into the potential future evolution. As low stream order channels continue to flow and accumulate water, the stem channels may increase in stream order, leading to a more complex network and a progressively larger drainage basin.
(a) Map of a channel network and (b) schematic diagram of Strahler stream order (black numbers indicate the order).
3.4. Quantifying the fluvial morphometry of supraglacial channel networks
To calculate key fluvial metrics (Table 3), the supraglacial channel networks with assigned stream orders were further analysed at different scales (i.e. channel segments of fixed interval or different orders, and whole channel networks, see Table 3). Channel length, width, depth, slope, bifurcation ratio and orientation were extracted for all segments; drainage area and drainage density were calculated for each supraglacial channel network. Widths and depths of all supraglacial channels were sampled at 30 m intervals along each channel which is consistent with the spatial resolution of Landsat-8 imagery. The width was measured from the polygons extracted from the water extraction maps using the Fluvial Corridor toolbox (Roux and others, Reference Roux, Alber, Bertrand, Vaudor and Piégay2015). To obtain the elevation difference (i.e. surface and bed slope of channels) between the up and downslope points from the REMA DEM data, all the supraglacial channels were split into 100 m sections along-flow for a more accurate representation of subtle terrain variations. Given that 20 times the width of the bankfull contains at least one meandering wavelength for terrestrial rivers (Leopold and others, Reference Leopold, Wolman and Miller1964; Gordon and others, Reference Gordon, McMahon and Finlayson1992) and considering the mean width of supraglacial channels in this study was around 100 m, the calculation of sinuosity was based on the length of the supraglacial channel segments, which were divided into 2000 m intervals. Drainage basins of the supraglacial channel networks for each ice shelf were estimated by the convex hull method (Tay and others, Reference Tay, Sagar and Chuah2006; Smith and others, Reference Smith2015; Yang and others, Reference Yang2018).
Fluvial metrics of supraglacial channels calculated in this study
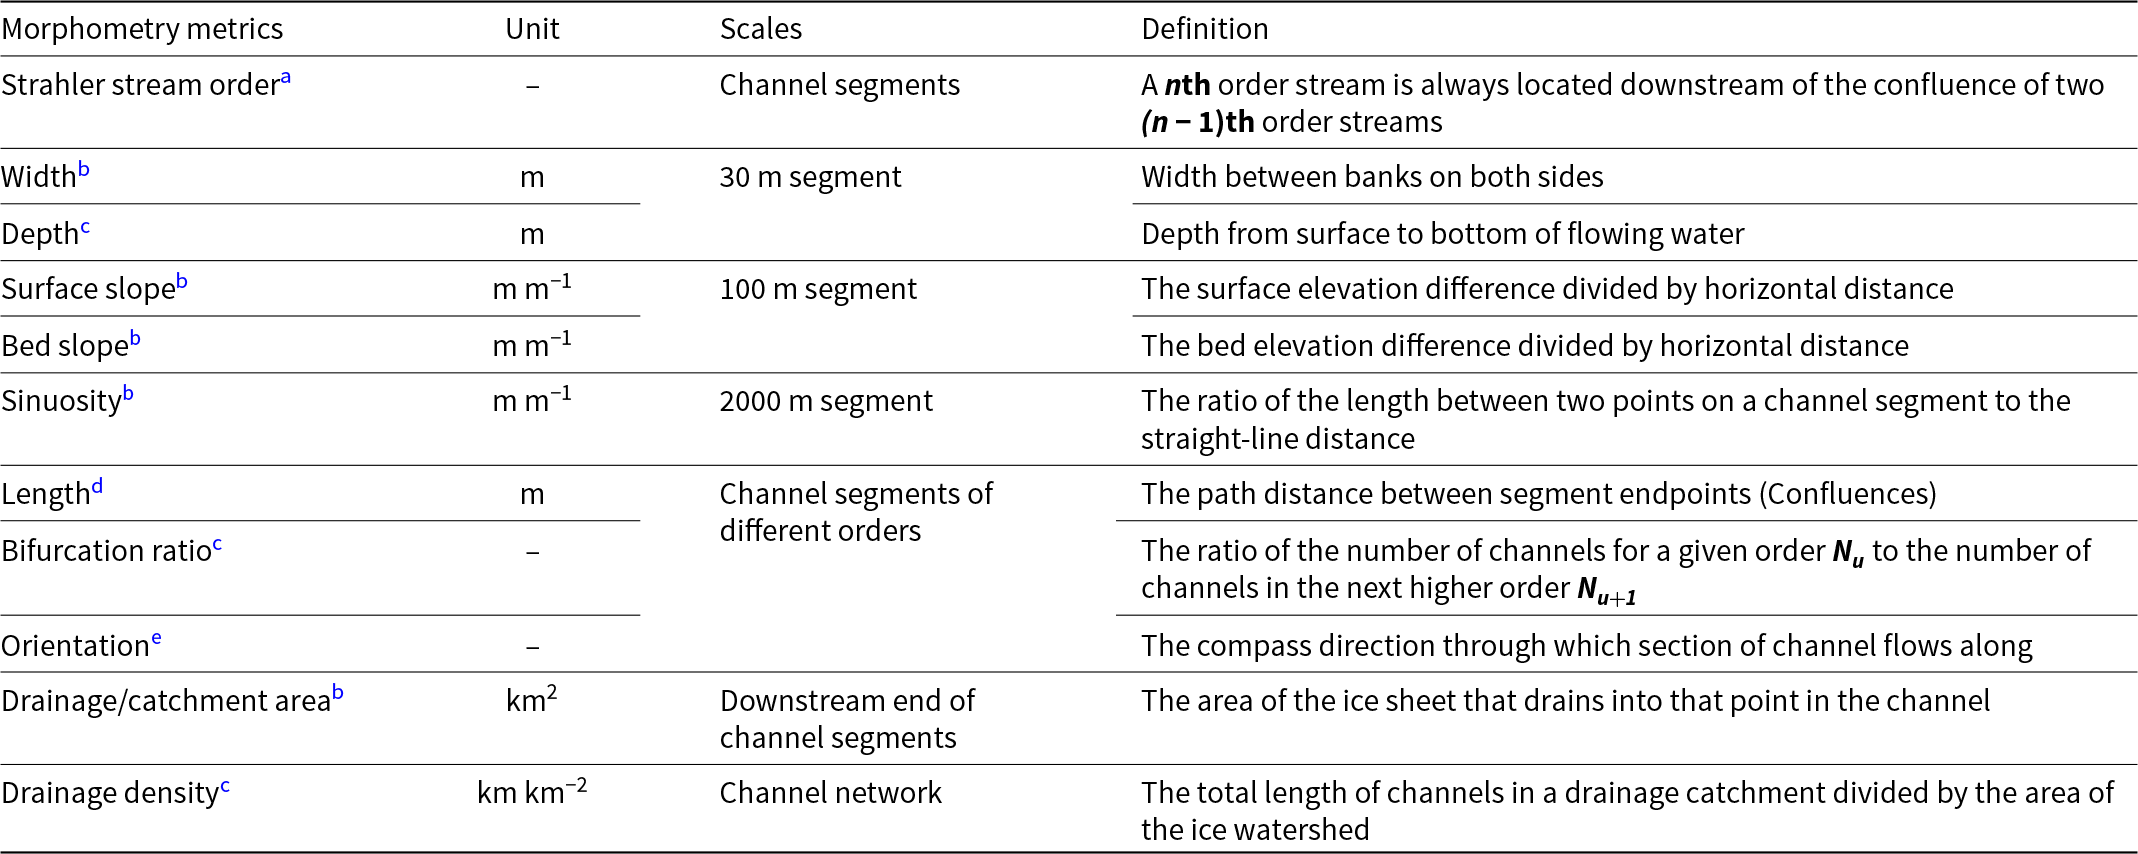
a Strahler (Reference Strahler1957).
b Frasson and others (Reference Frasson2019).
c Yang and others (Reference Yang2016).
d Gordon and others (Reference Gordon, McMahon and Finlayson1992).
e Gioia and others (Reference Gioia, Schiattarella and Giano2018).
3.5. Estimating the depth of supraglacial channels and lakes
A first-order approximation of the depths of all supraglacial channels and lakes were retrieved by using spectral band ratios that are widely used in the literature (Smith and others, Reference Smith2015; Moussavi and others, Reference Moussavi2016; Pope and others, Reference Pope2016; Yang and others, Reference Yang2021). This spectral band ratio approach relies on the relative reflectance in two different wavelengths, and Band-1 (coastal) and Band-3 (green) Landsat-8 OLI imagery have been validated to be one of the best combinations to derive water depth based on the dual-channel model (Eqns (2–3)) (Moussavi and others, Reference Moussavi2016; Pope and others, Reference Pope2016). The empirical derivation of calibrated coefficients is as follows (Pope and others, Reference Pope2016):
 \begin{equation}z = a + bX + c{X^2}\end{equation}
 \begin{equation}X = \ln \left( {Ban{d_1}/Ban{d_3}} \right)\end{equation}
 where  $a = 0.1488$, $b = 5.0370$ and $c = 5.0473$, $Ban{d_1}/Ban{d_3}$ is the ratio of the reflectance of Landsat-8 OLI Band-1 (Coastal/Aerosol: 0.435–0.451 μm) and Band-3 (Green: 0.533–0.590 μm), and $z$ stands for the derived water depth.
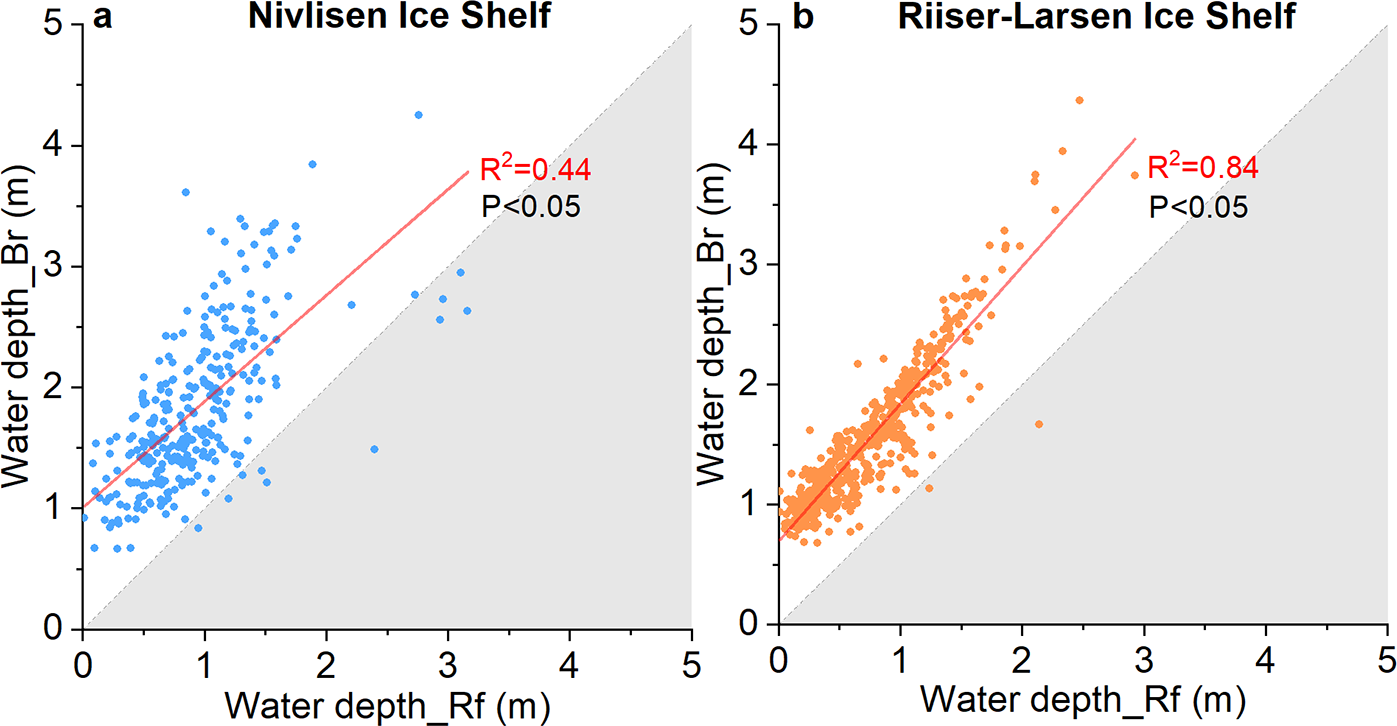
In the absence of in situ validation data, the depths of supraglacial lakes from Arthur and others (Reference Arthur, Stokes, Jamieson, Rachel Carr, Leeson and Verjans2022) were sampled form Landsat-8 imagery in the same melt season (i.e. January of 2020) and from the same ice shelves (i.e. Nivlisen and Riiser-Larsen). They applied a method based on the radiative transfer equation (i.e. the rate of light attenuation in water). However, such radiative transfer models are primarily used to estimate lake depths where the water body’s shortest dimension is much larger than the resolution of imagery pixel (Bell and others, Reference Bell2017). The widths of some supraglacial channels are smaller than the pixel resolution, which means the pixels representing these narrower channels mix water with snow or ice, which may result in underestimation of channel depths in the following calculation. To verify the plausibility of our depth calculations, we compared them with water depths for same regions obtained by Arthur and others (Reference Arthur, Stokes, Jamieson, Rachel Carr, Leeson and Verjans2022) using an independent method. Figure 5 shows the comparison between depths derived from our study (depth_Br) and the reference study of Arthur and others (Reference Arthur, Stokes, Jamieson, Rachel Carr, Leeson and Verjans2022) (depth_Re). A positive correlation is found between depth_Br and depth_Rf, with the results being statistically significant at the p < 0.05 level. Given the differences in the specific days of data collection, such water depths estimated by the spectral band ratio method are considered reliable for the purposes of this study which conducts a drainage comparison on different ice shelves.
Correlation analysis of the depths derived from the reference study (Water depth_Rf) (Arthur and others, Reference Arthur, Stokes, Jamieson, Rachel Carr, Leeson and Verjans2022) and this study (Water depth_Br) for (a) Nivlisen and (b) Riiser-Larsen ice shelves. Grey shaded areas indicate 1:1 reference line.
4. Results
4.1. Spatial distribution of supraglacial lakes and channels
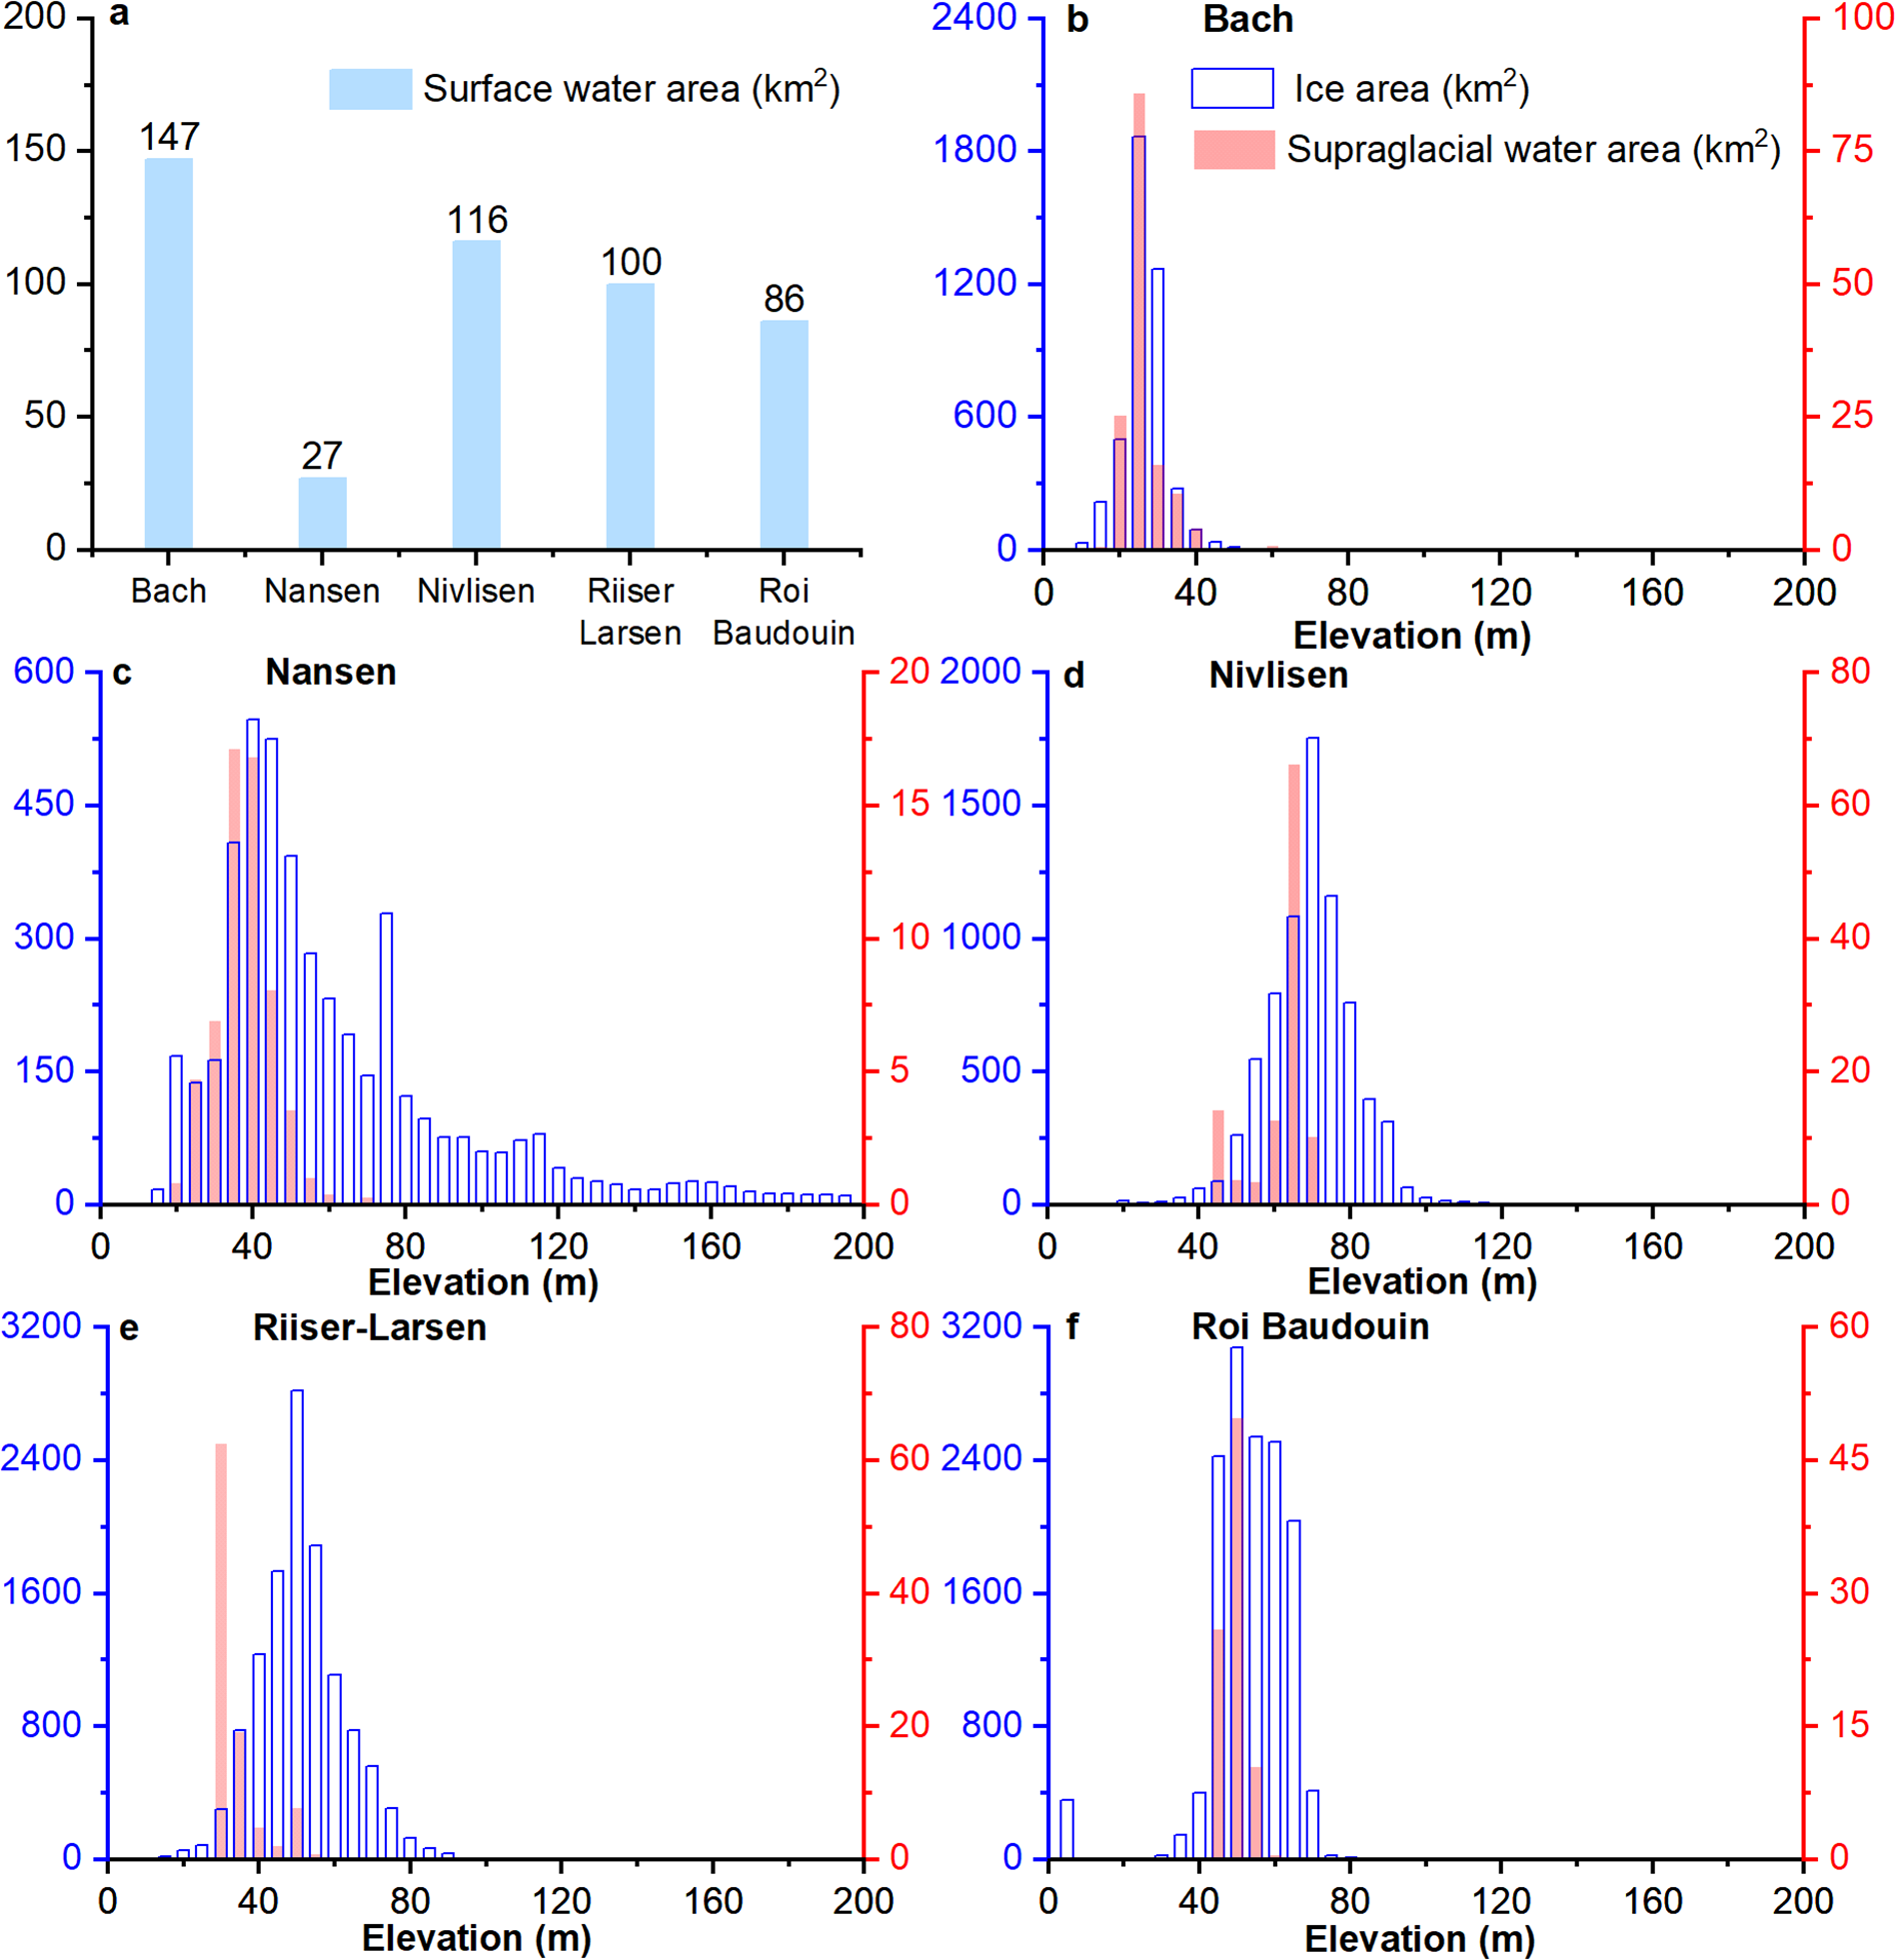
Extensive surface water on Antarctic ice shelves was observed in the selected melt seasons in January 2020 or 2022 (Fig. 6). The largest supraglacial meltwater extents were observed over the Bach, Nivlisen and Riiser-Larsen ice shelves, covering approximately 147 km2, 116 km2 and 100 km2, respectively. Figure 6b–f show that surface water predominantly occurs at relatively lower elevations and close to the grounding lines on all ice shelves. Supraglacial channels at low elevations on GrIS are often drain into regions where a higher concentration of moulins and crevasses are observed (Yang and others, Reference Yang2016). However, in our study areas, there are no obvious moulins and crevassed areas and all the channels terminate in lakes or drain into the firn.
(a) Total surface water area on each ice shelf and (b–f) the distribution of ice areas on each ice shelf (blue bars), and the elevation above sea level of all extracted surface water areas (red bars).
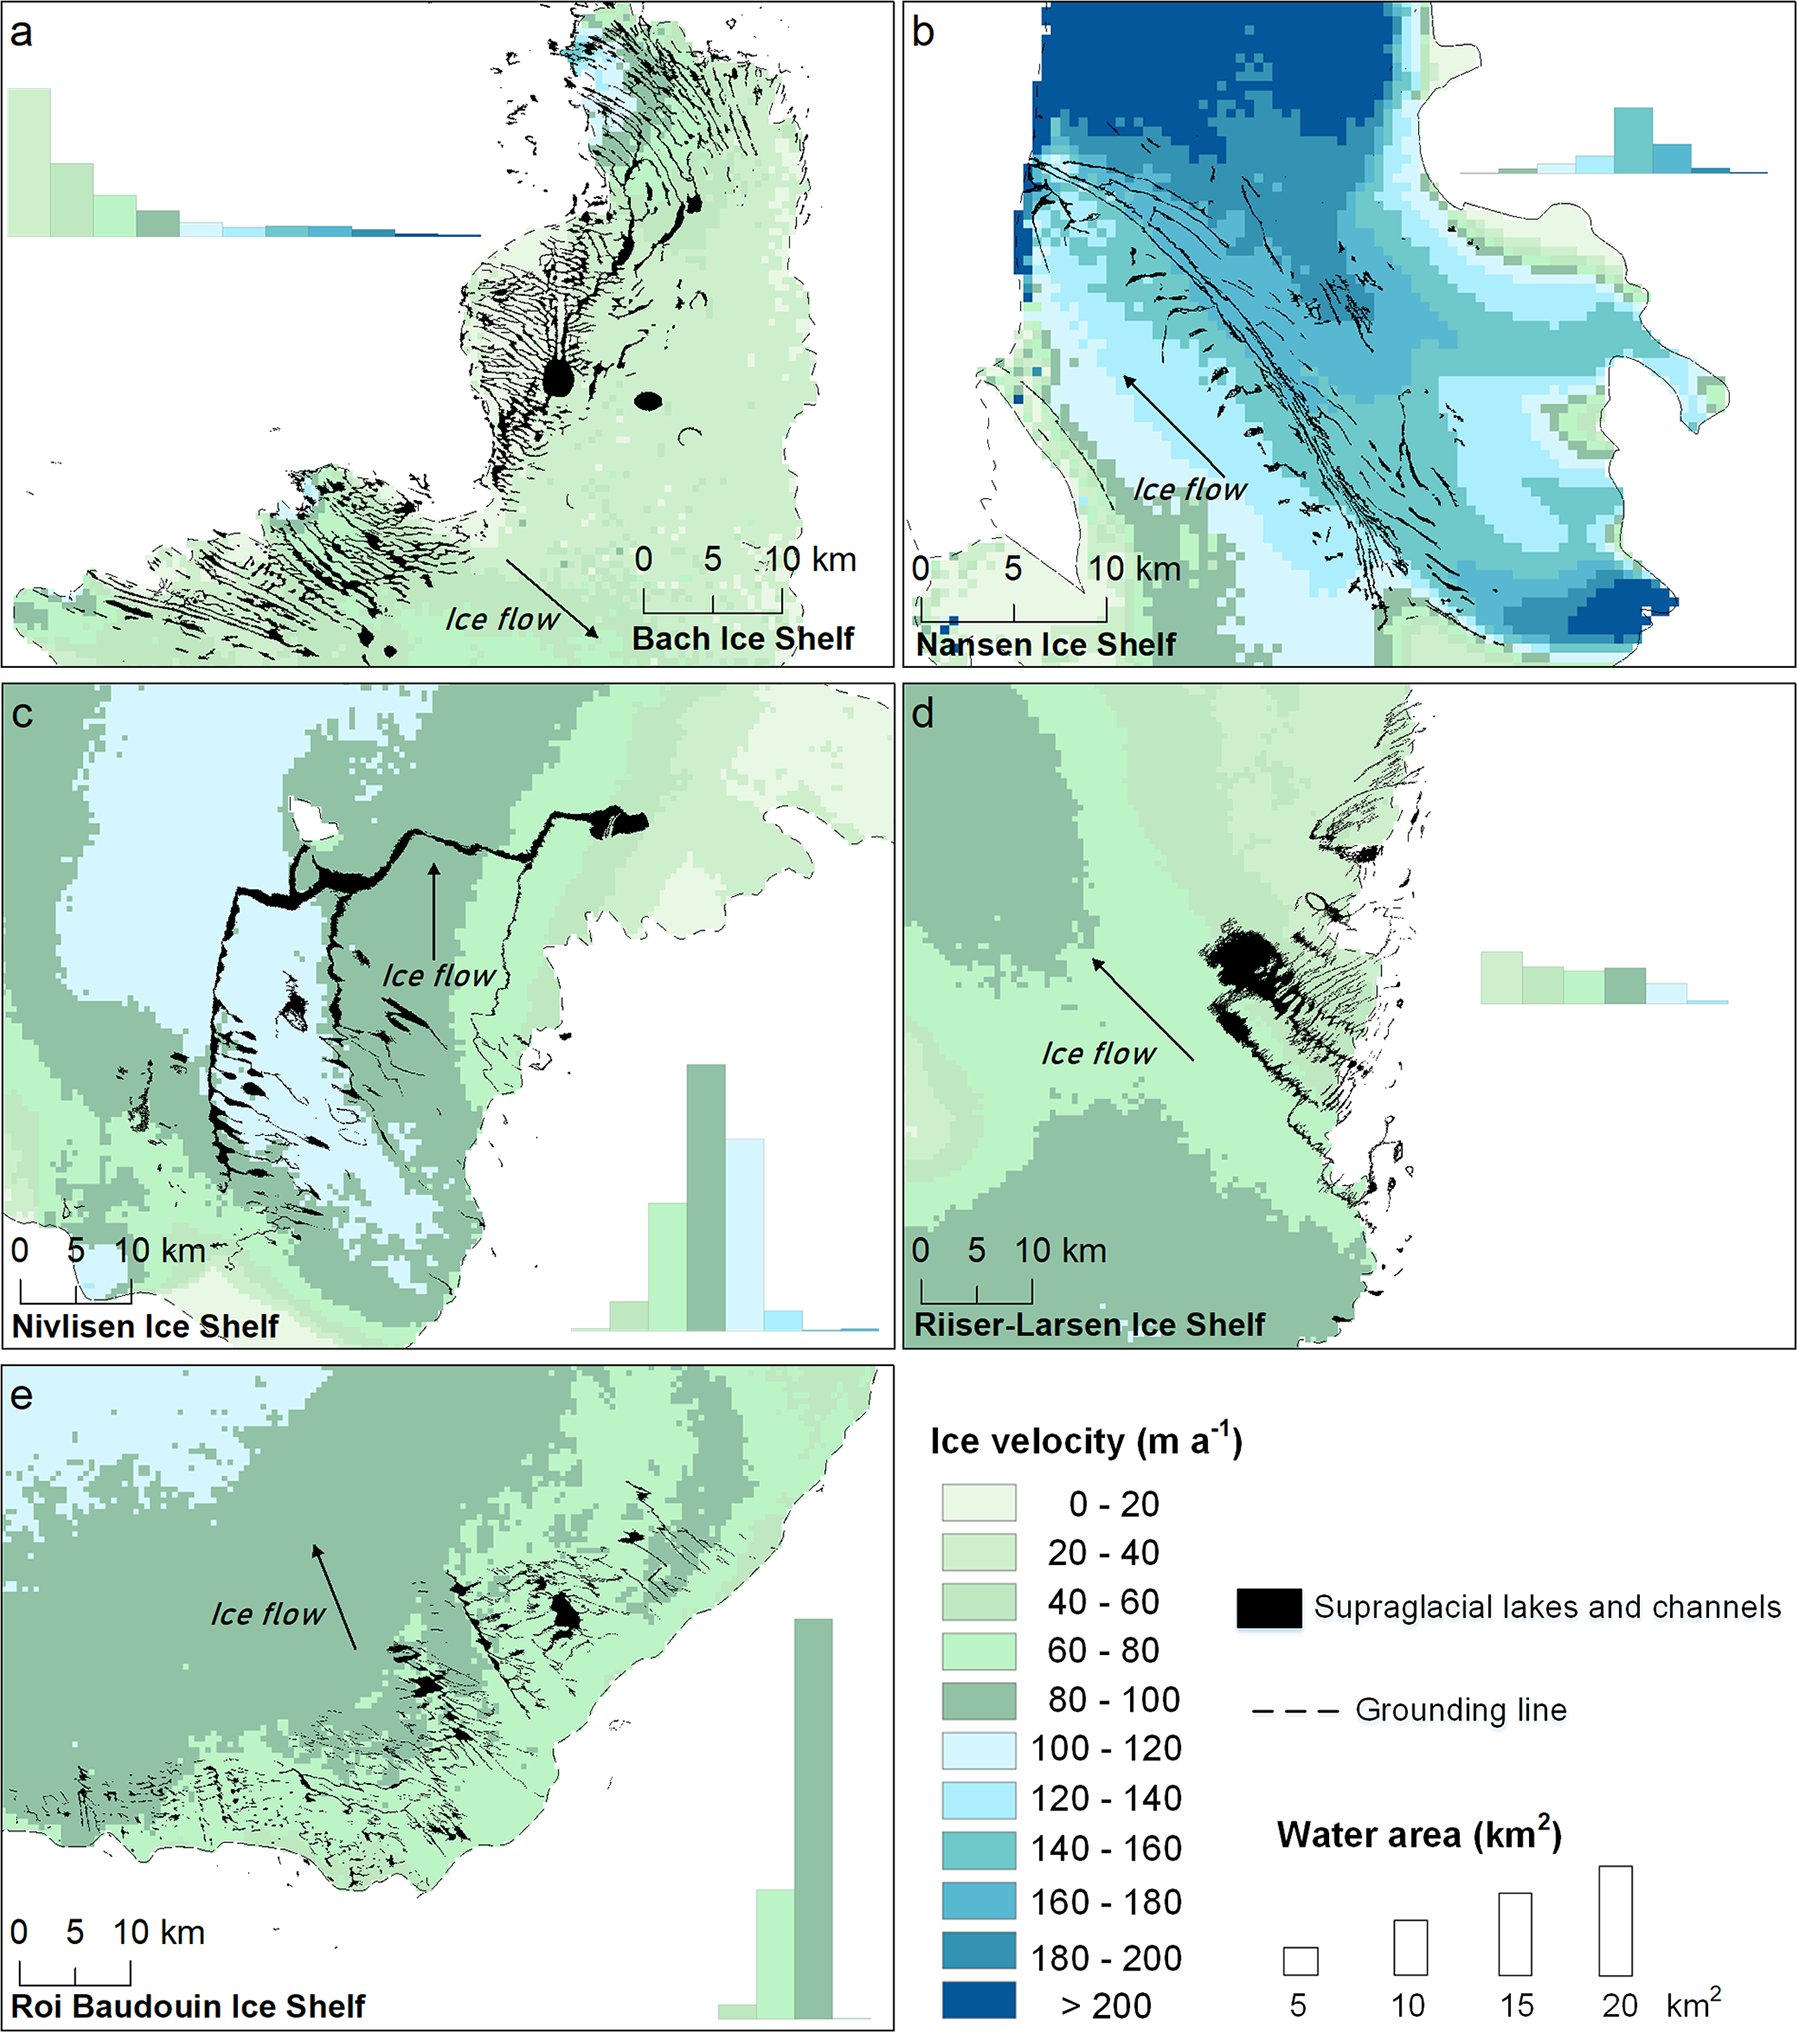
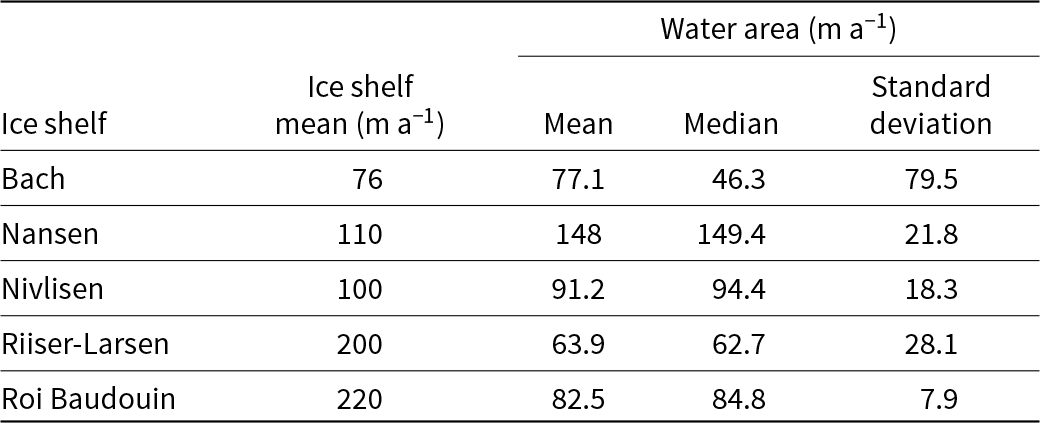
Ice surface velocity data from Shen and others (Reference Shen, Wang, Shum and Jiang2021) were used to examine spatial relationships between ice velocity and the occurrence of hydrological features (i.e. supraglacial lakes and channels). Figure 7 and Table 4 show that surface lakes and channels are observed across a wide range of ice velocities on the studied ice shelves and a large number of lakes and channels form on relatively slow-flowing ice on each ice shelf. Notably, more than 85% of the hydrological features occurred on ice flowing <120 m a−1 for Bach, Nivlisen, Riiser-Larsen and Roi Baudouin ice shelves, while over half of the lakes and channels on Nansen Ice Shelf exist in areas with velocities of less than 150 m a−1.
(a–e) Surface area of supraglacial lakes and channels (in black) superimposed on the ice velocity of each ice shelf. Bar charts show the area of water on a specific velocity range on each ice shelf.
Ice velocity distribution of ice shelf and water area
4.2. Quantification of supraglacial channel networks
Here we define a channel network as one or more trunk channels and their connected tributaries. A total of 119 supraglacial channel networks were found on the five Antarctic ice shelves, with the highest Strahler stream order being fourth-order networks on Bach Ice Shelf (Fig. 8; Table 5). Channels in the low-order networks (i.e. the smallest tributaries) are fewer in number and shorter in length and form a simple structure. In contrast, high-order channel networks include longer channels and exhibit more complex drainage patterns and large length scales. Moreover, it is common to see the high-order channels braid and then form multichannel structures in the network.
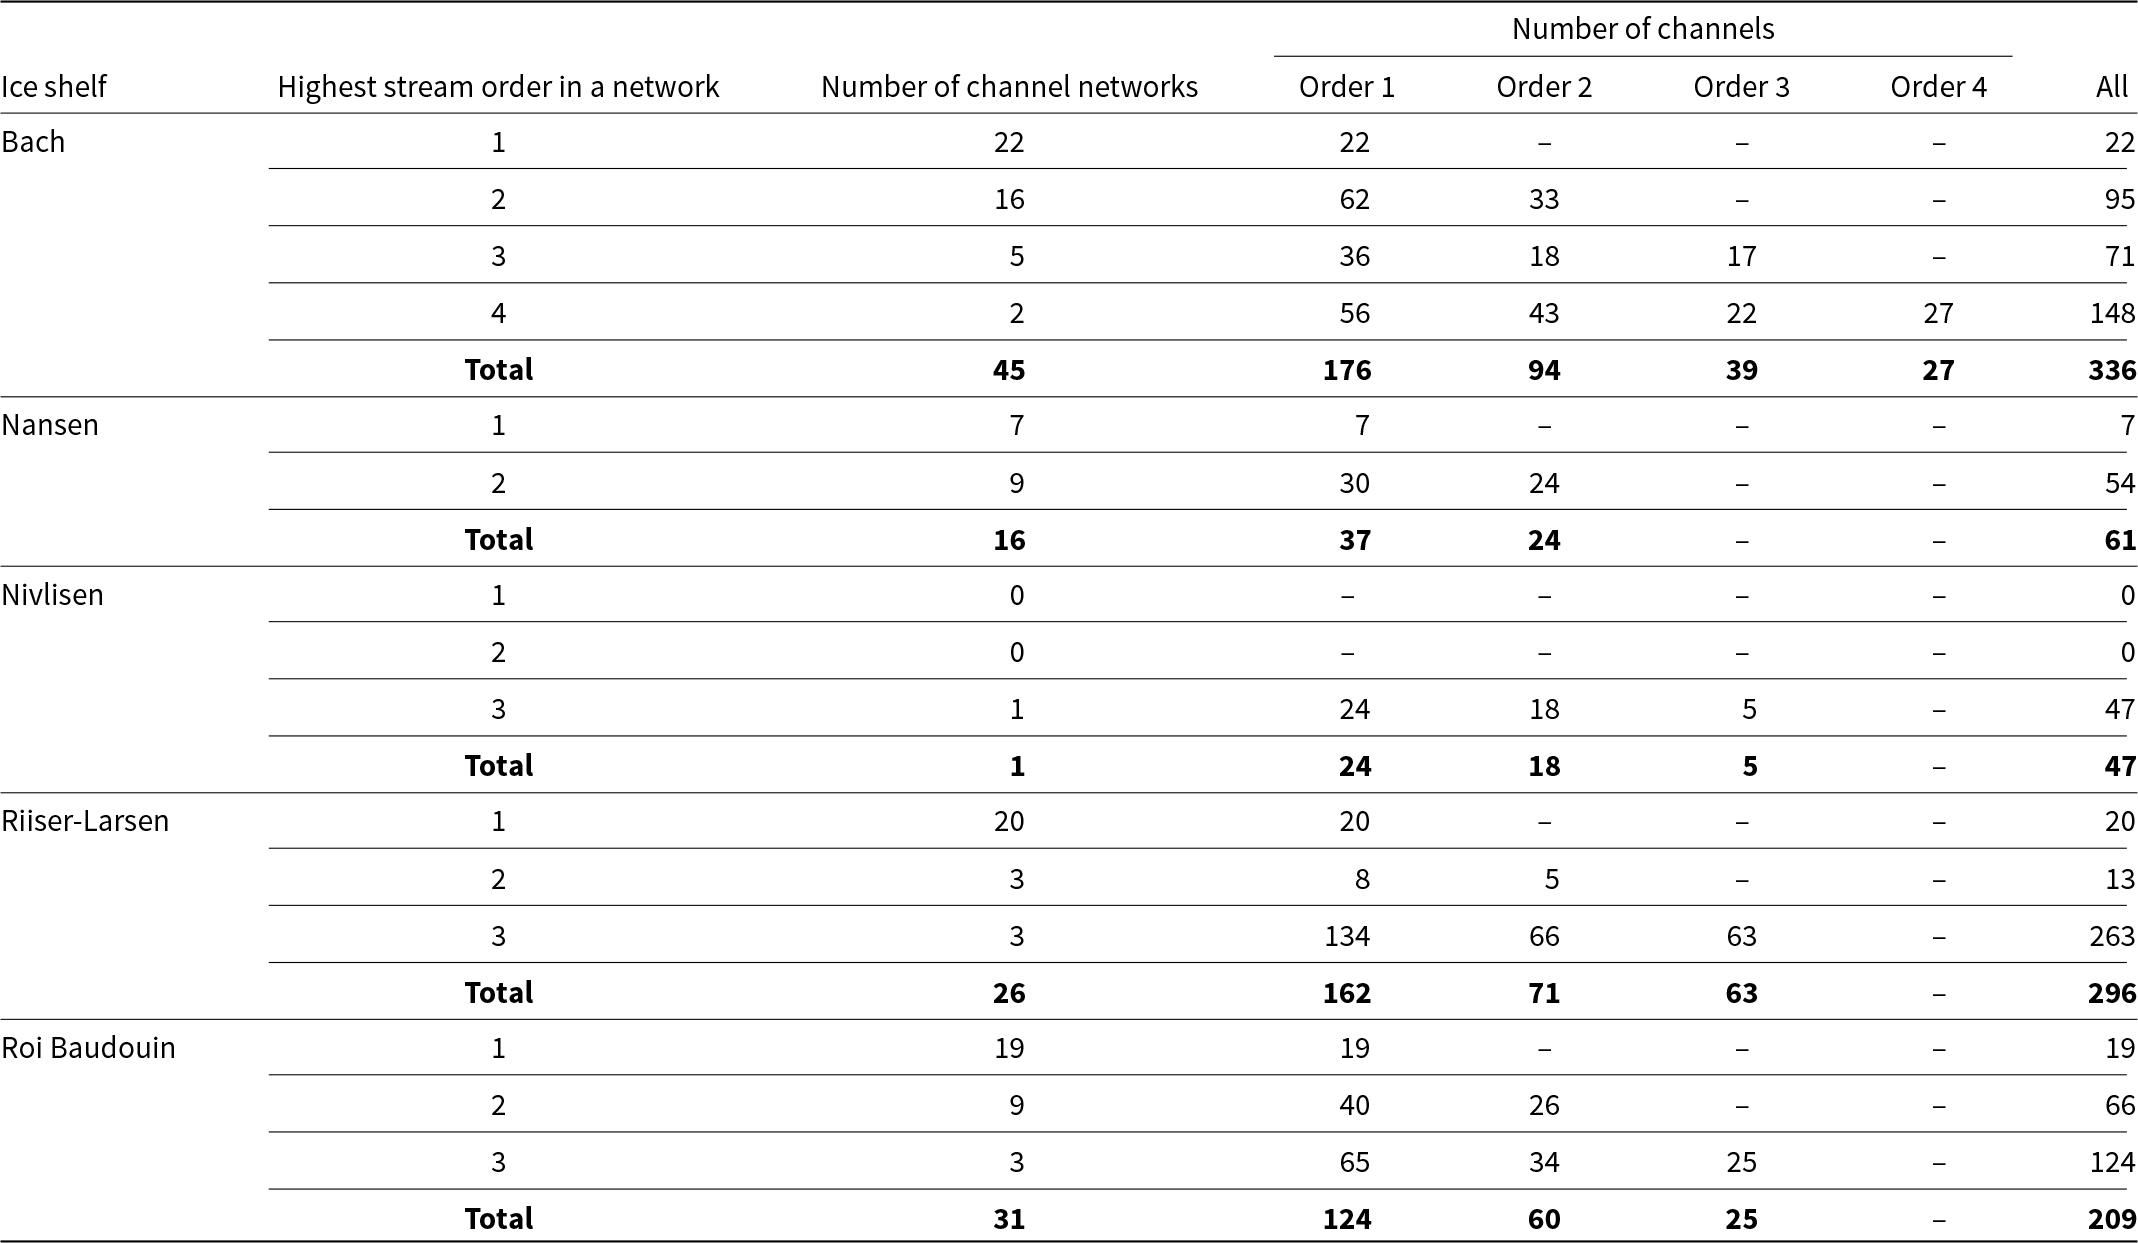
Summary statistics of the stream order networks on each ice shelf are shown in Table 5. While Nansen Ice Shelf supports 61 channels in total, the 16 networks are fragmented and only contain channels of first- and second-order. However, the channel networks on the other four ice shelves, i.e. Bach (45), Nivlisen (1), Riiser-Larsen (26) and Roi Baudouin (31), are found to be up to third- or fourth-order. The largest number of supraglacial channels occurs on Bach Ice Shelf (336 in total), and channels on its surface formed 45 networks containing first- to fourth-order drainage (Fig. 8). For Nivlisen Ice Shelf, there is only one network composed of 47 channels with three stream orders. Although the stream orders of supraglacial channel networks of the five study sites vary, notable similarities can be observed. First-order channels are the most common channel configuration and account for more than 50% of the total number of channels for all five ice shelves. Overall, it is clear that most supraglacial channel networks on Antarctic ice shelves are relatively simple, low-order channel networks. This indicates that the channels on ice shelf surfaces collect water from a limited area, rather than being well-developed and higher-order networks that could more efficiently transport water across larger areas. Surface water appears to preferentially be directed towards or along ice shelf structures, suggesting that surface topography is the primary control on how water is transported across ice shelf. Moreover, such simple structures of channel networks may have the potential for future development. As the low stream order channels continue to flow and accumulate water, the stem channels may increase in stream order, leading to a more complex network and a larger drainage basin.
Examples of supraglacial channel networks with different highest orders on Bach Ice Shelf, ranging from first-order (a) to fourth-order (d). The black arrow shows generalized water flow direction on each panel.
Summary statistics of supraglacial channel networks by Strahler stream order
With reference to the commonly used descriptions for terrestrial fluvial networks (Charlton, Reference Charlton2007), the supraglacial channel networks are best described as ‘parallel’ drainage networks, characterized by numerous channels lying parallel to each other and to the overall ice flow direction, and with tributaries often joining trunk systems at relatively low angles (Fig. 9). In these parallel networks, low-angle junctions suggest that the channels are following the natural gradient of the ice surface, with the slope and underlying structures directing the flow paths. This is exemplified by the Nansen and Nivlisen ice shelves (Fig. 9b, c) where both ice surface slope and the local ice surface relief (e.g. surface flow structures) are influencing drainage patterns. Meanwhile, none of the mapped channels are observed to drain off the ice shelf, even on Nansen Ice Shelf, where previous observations had reported this process (cf. Bell and others, Reference Bell2017). Instead, surface channels deliver the water across the ice shelf to locations where it refreezes or percolates into the firn layer.
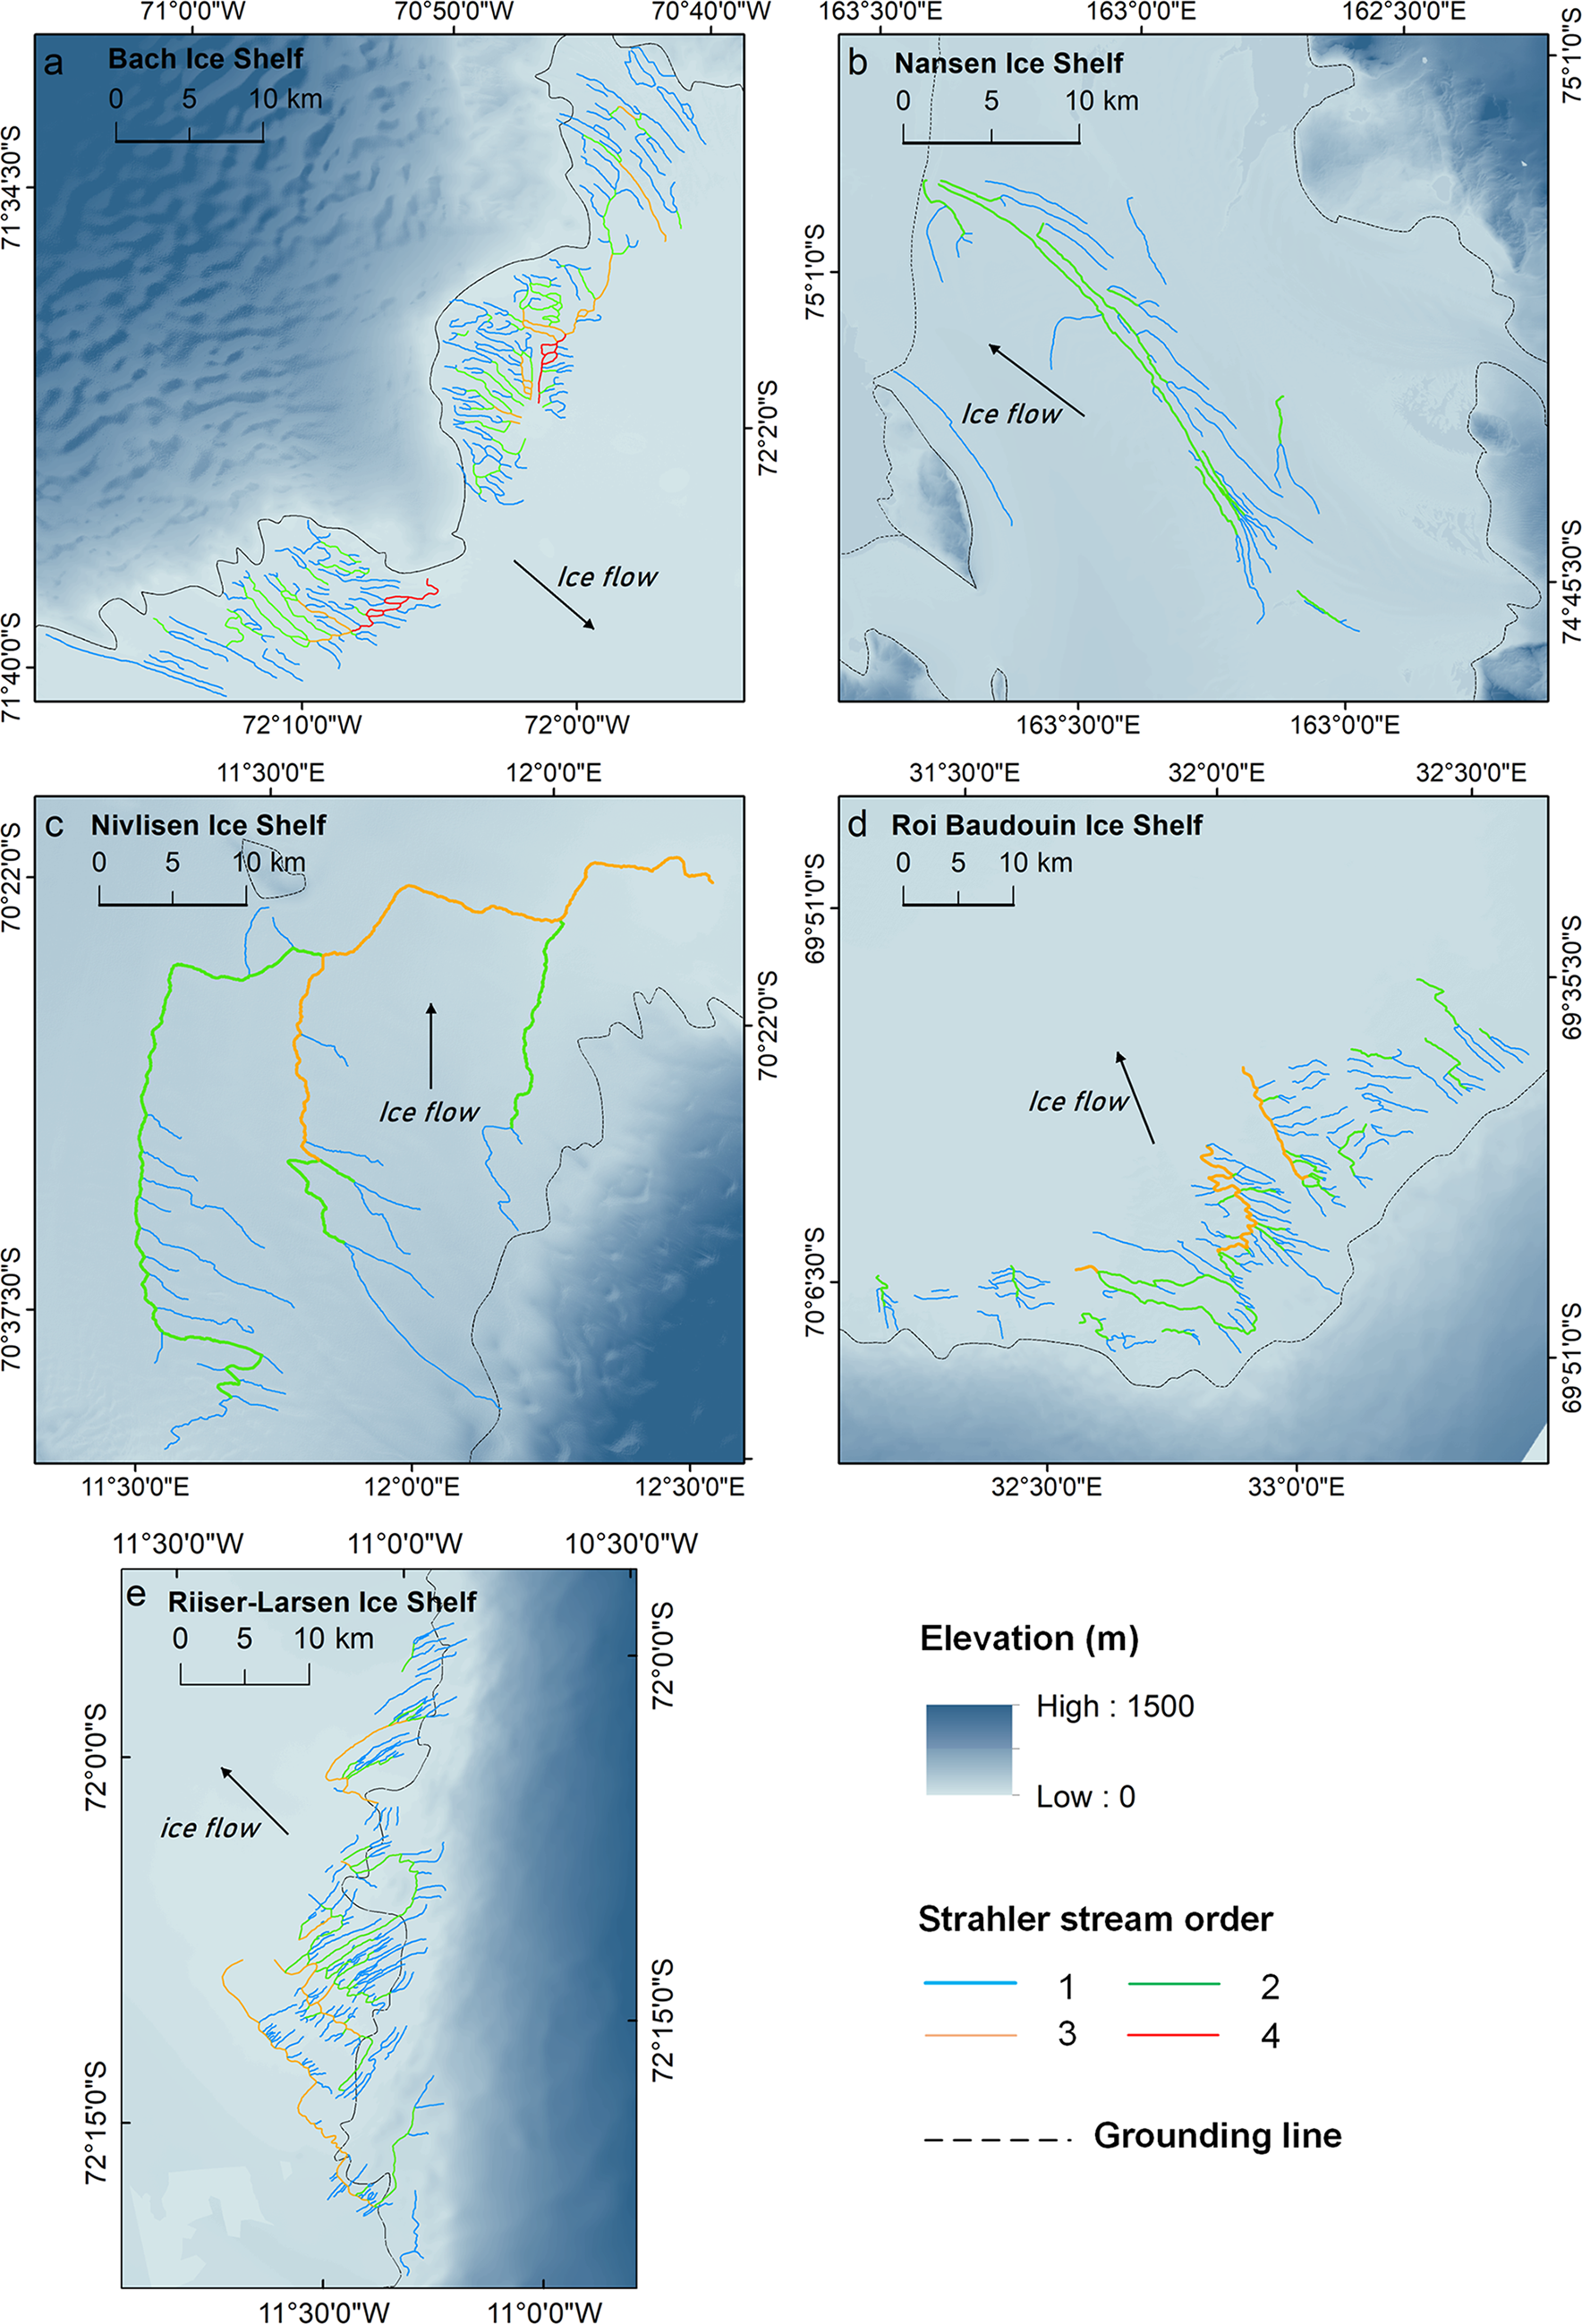
The extracted supraglacial channel network for the studied ice shelves: (a) Bach, (b) Nansen, (c) Nivlisen, (d) Roi Baudouin and (e) Riiser-Larsen. The different colours demonstrate corresponding Strahler stream order which ranges from first to fourth. Underlying images are REMA elevation data with grounding lines of Antarctic ice shelves. Low-order channels generally have short lengths and simple structures, whereas high-order channels are longer and more branching. Generalized ice flow directions are given by the black arrows.
4.3. Fluvial morphometry of supraglacial channels
4.3.1. Length, width and depth
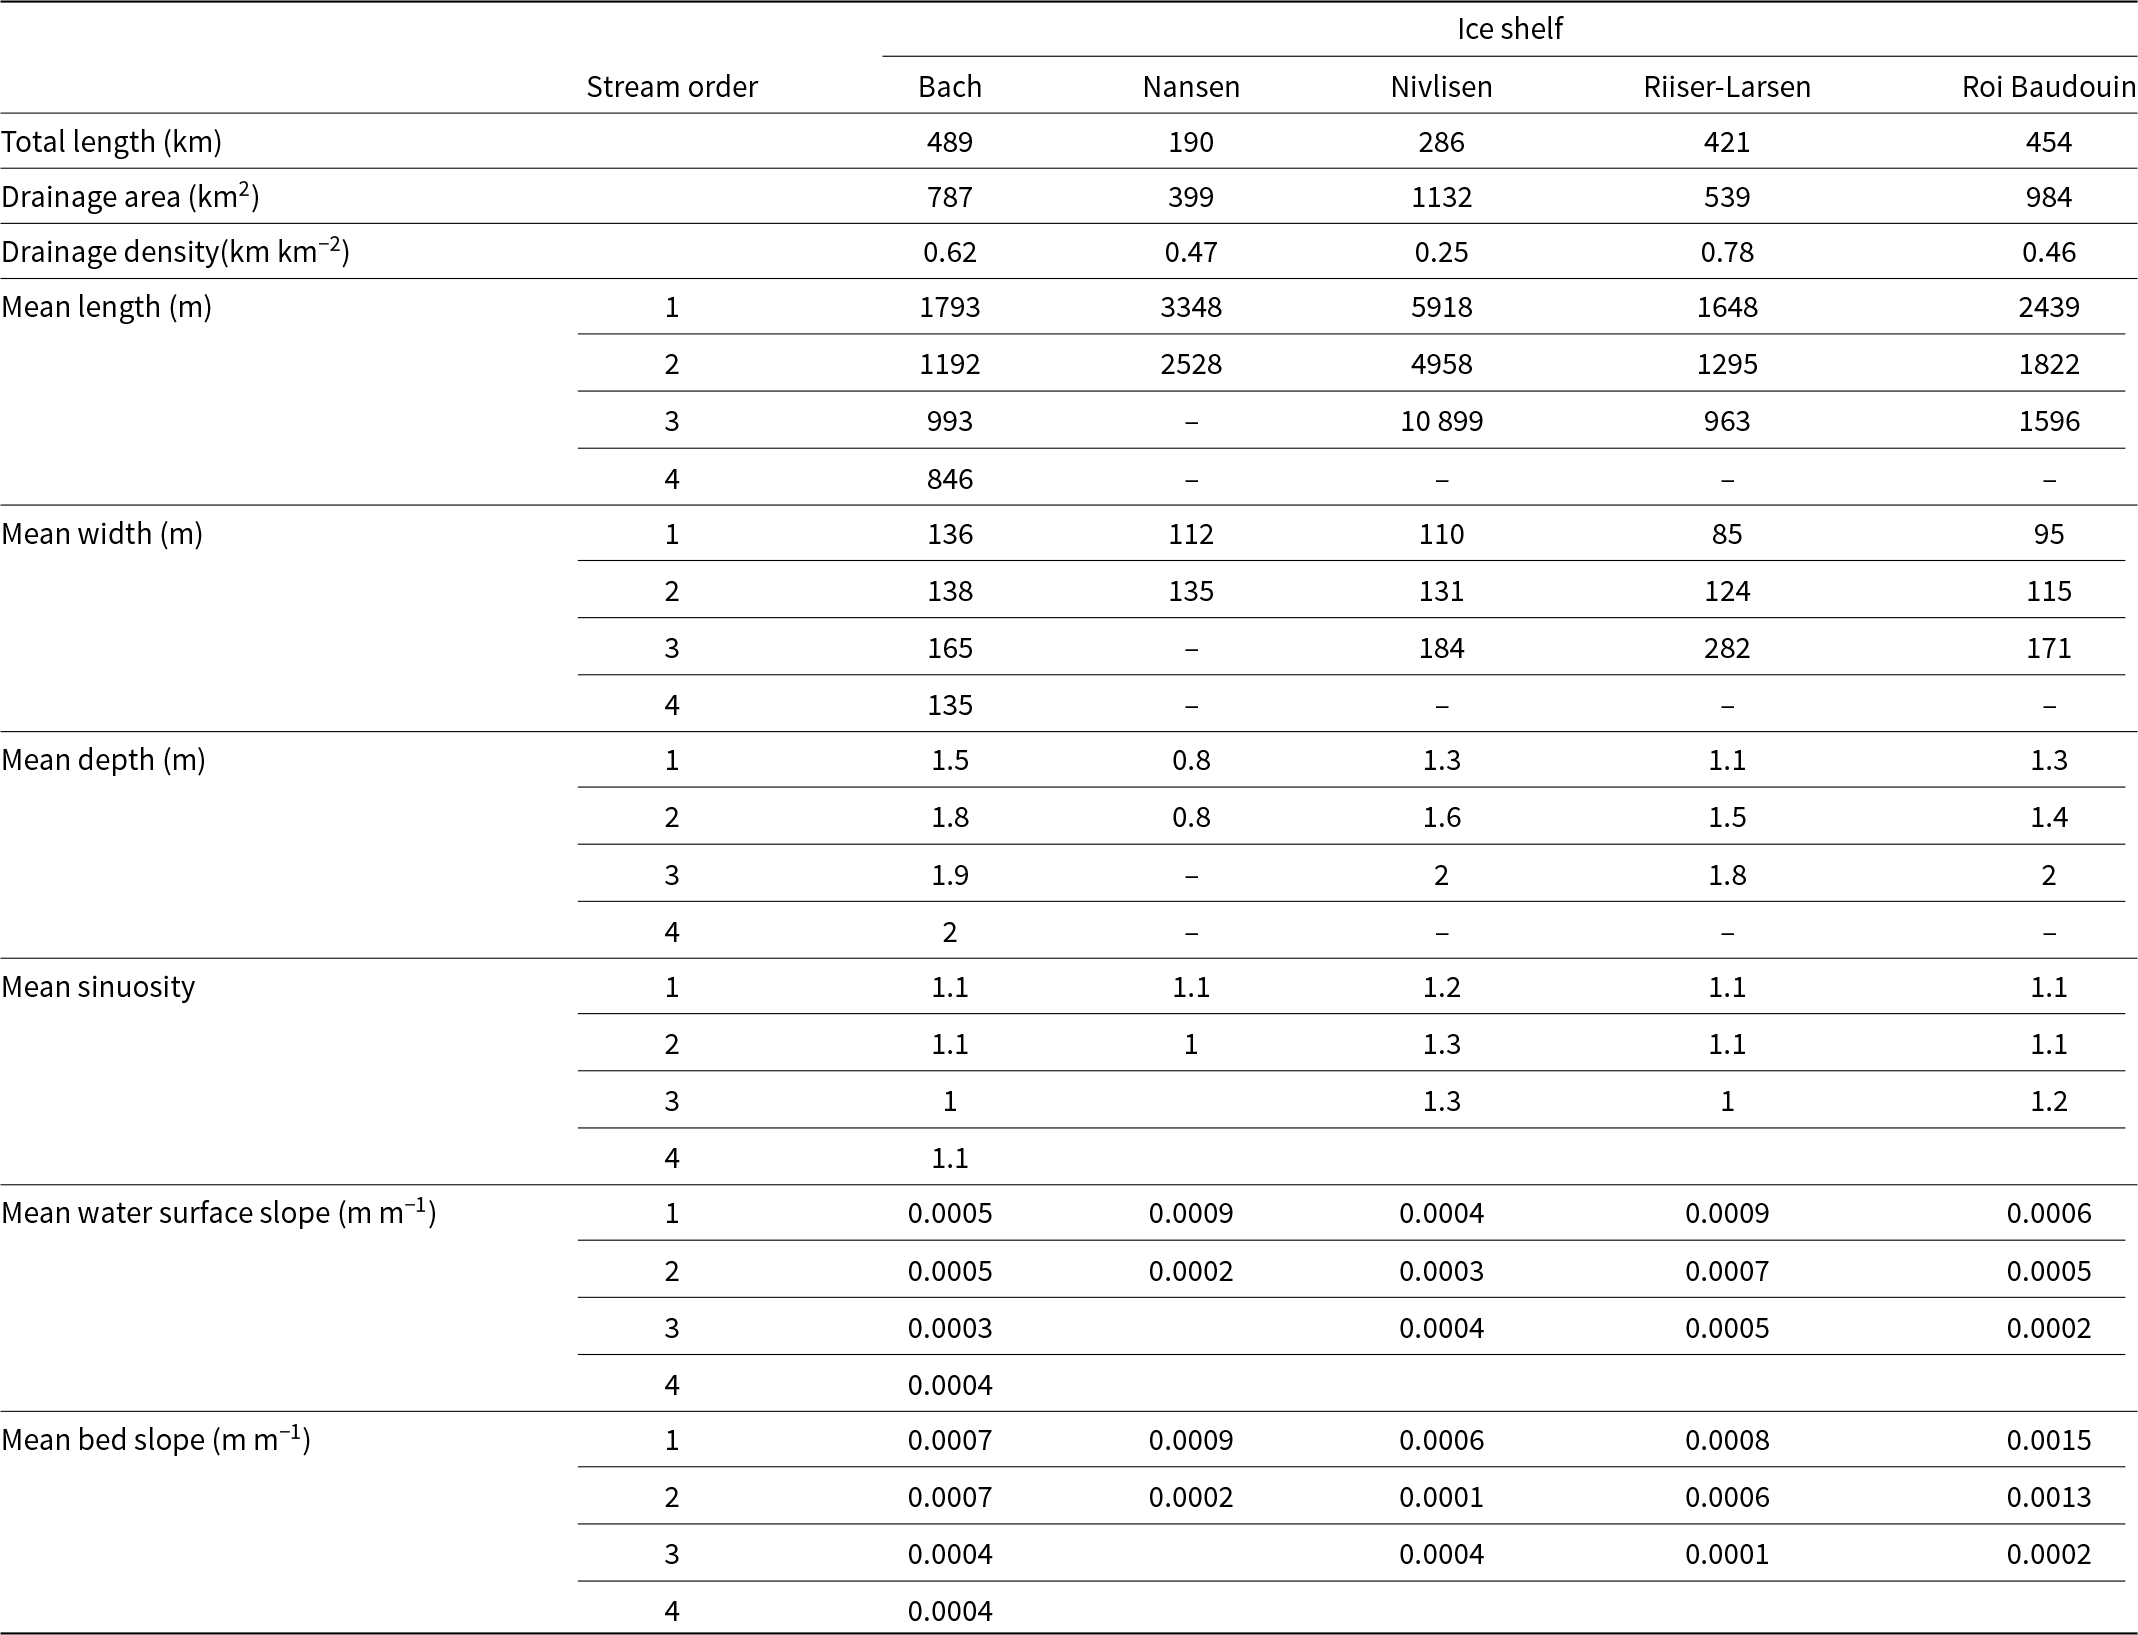
Supraglacial channels on Antarctic ice shelves are typically hundreds of meters long (mean length ranges from 846 m [Bach Ice Shelf] to 10 899 m [Nivlisen Ice Shelf]) and up to 171 m wide [mean width: 85–171 m], with mean water depths ranging from 0.8 m to 2.0 m (Table 6). The cumulative length of channels on Bach Ice Shelf is the longest at approximately 489 km, followed by the Roi Baudouin Ice Shelf (454 km), Riiser-Larsen Ice Shelf (421 km), Nivlisen Ice Shelf (286 km) and Nansen Ice Shelf (190 km). In terms of the total number of channels that can be observed in images used in this study (i.e. channels >30 m wide), Bach Ice Shelf has the highest number of channels (n = 336), and Nivlisen Ice Shelf has the lowest number (n = 47). Drainage areas of the supraglacial channel networks for each ice shelf are displayed in Table 6. The Nivlisen Ice Shelf has the largest basin area of 1132 km2, which is followed by Roi Baudouin (984 km2), Bach (787 km2), Riiser-Larsen (539 km2) and Nansen (399 km2). Drainage density is highest (0.78 km km−2) on Riiser-Larsen Ice Shelf and lowest (0.25 km km−2) for Nivlisen Ice Shelf where channels are more widely spaced.
Summary morphometry statistics of supraglacial channel networks
There is a general increase in both mean channel width and depth from low to high stream order (Fig. 10), although this is not as evident on Bach Ice Shelf (Fig. 10a) and only weakly expressed on the Nansen, which only has two orders of stream network (Fig. 10b). The supraglacial channels on Nivlisen, Riiser-Larsen and Roi Baudouin ice shelves show a more noticeable increase in mean width and mean depth as the stream order increases. However, the variance in width is more pronounced than that of depth for all studied ice shelves.
Mean width and depth of supraglacial channel by stream orders (error bars indicate one standard deviation). Large increase in mean channel width with increasing flow order but only a small increase in depth.
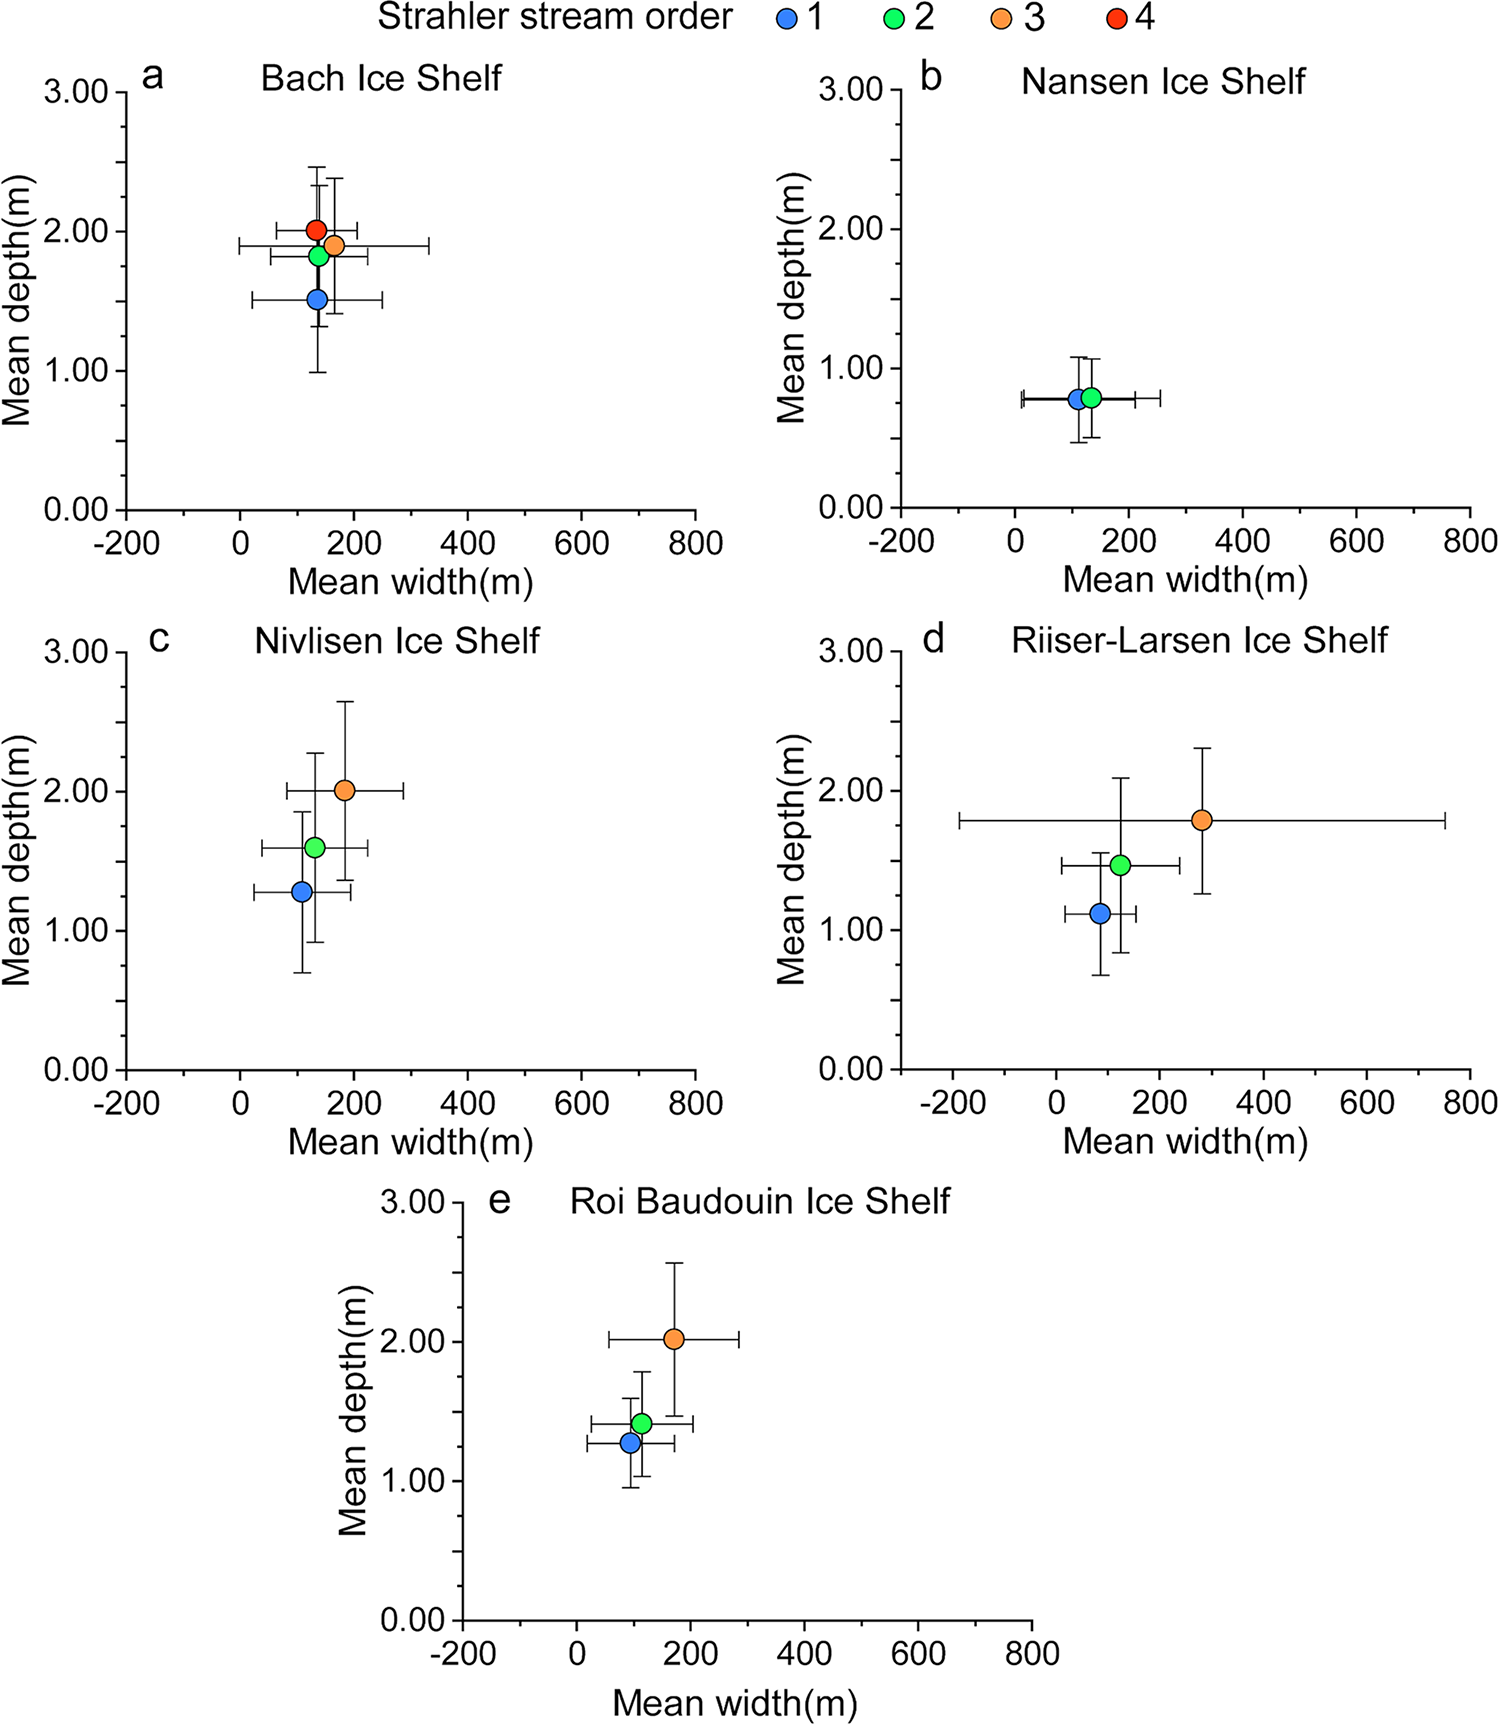
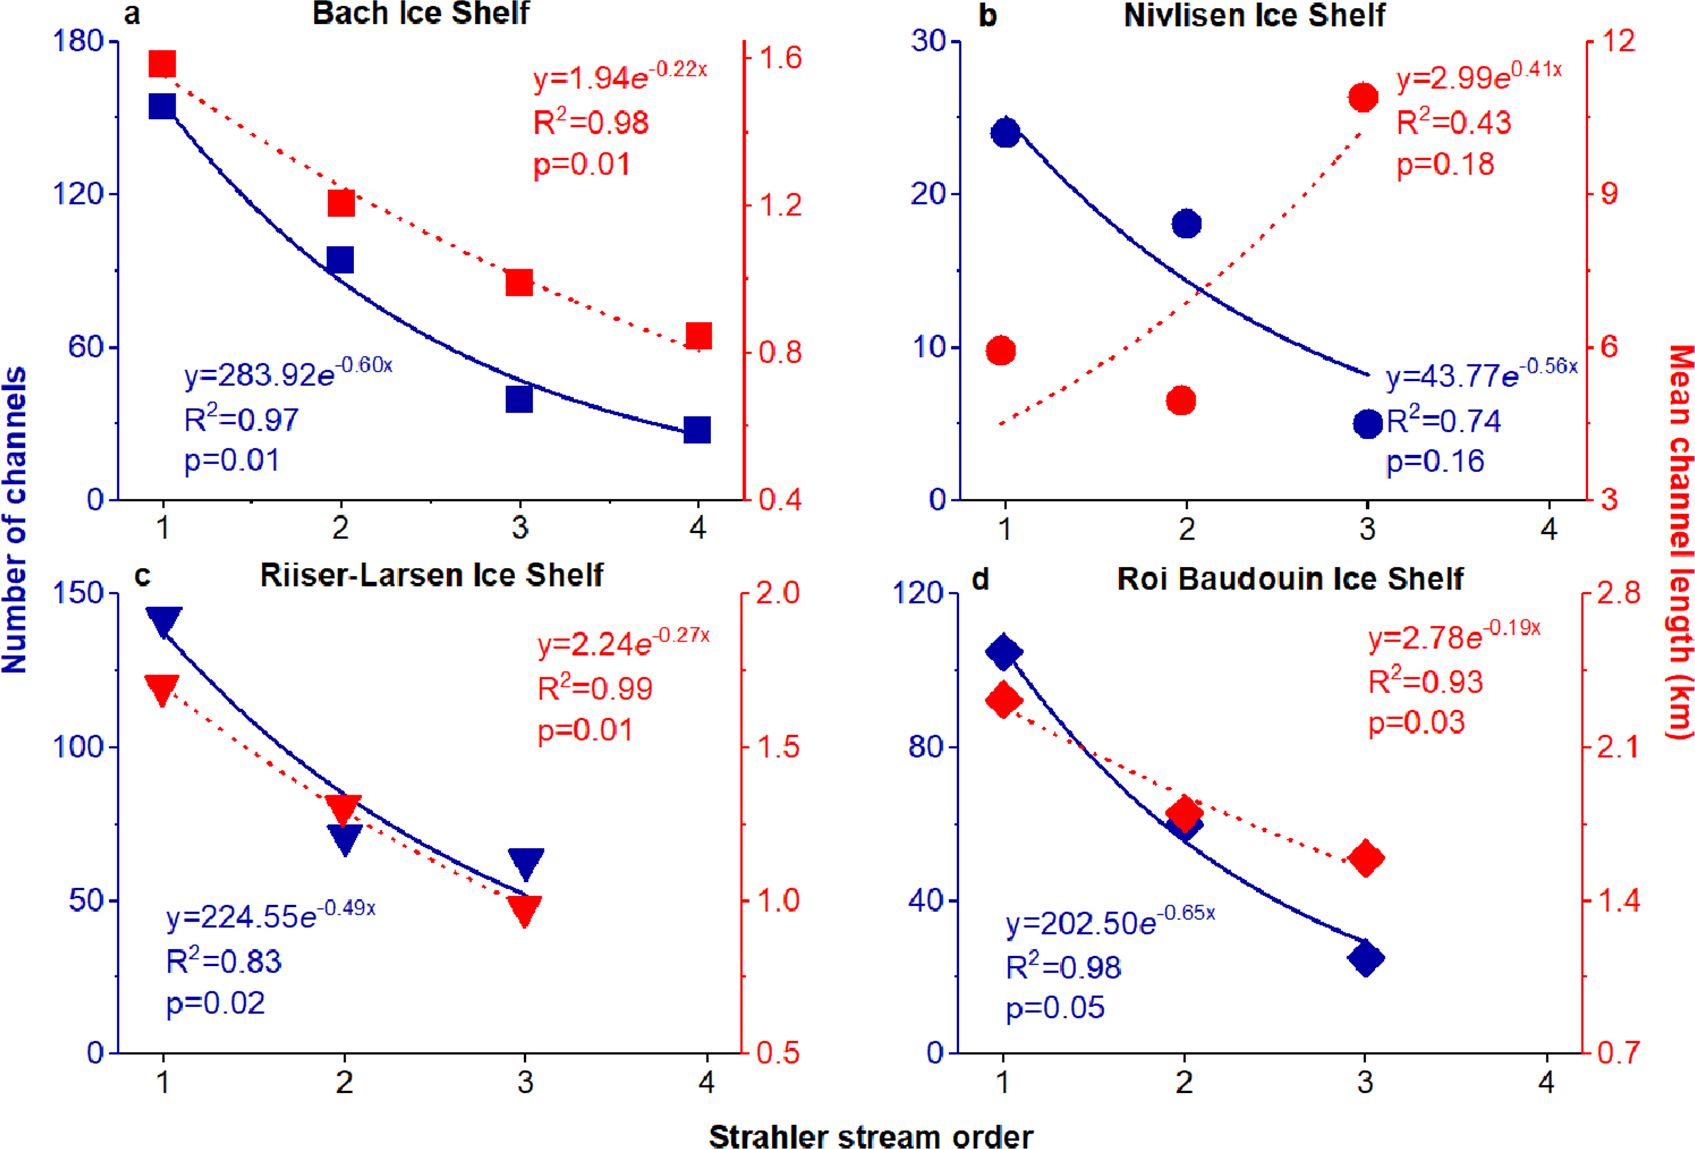
Figure 11 presents the results of the correlation analysis between the number of channels, mean length and the stream orders. Firstly, supraglacial channels on all four ice shelves with more than two stream orders show a strong correlation between number of channels and stream orders. The numbers of channels decline exponentially as the stream order increases, and the R 2 values range from 0.74 to 0.98 which suggests compliance with Horton’s laws (Horton, Reference Horton1945). The relationships between the mean lengths of supraglacial channels and stream orders show two different types of correlation, despite the fact that they are all parallel drainage patterns. Over the Bach, Riiser-Larsen and Roi Baudouin ice shelves, the mean length of channels shows an obviously exponential downward trend with increasing stream order. However, the relationship between the mean length of channels and stream orders for Nivlisen Ice Shelf is positive. The reason for the inconsistent correlation between mean length and stream order is that the supraglacial channel network on Nivlisen Ice Shelf was formed of long, continuous channels with a relatively small number of tributaries with low stream order (i.e. first- and second-order). However, channel networks on the other three ice shelves contained a large number of short, low-order tributaries that join into the stem channels, creating many confluence points and splitting the stem channels into segments of the same stream order but shorter in length. The efficiency of water transportation can be enhanced in higher-order channels, while a drainage system with more lower-order channels may experience decreased overall efficiency. The supraglacial channel networks follow Horton’s law of channel number for first-order to highest order (third- or fourth-order). However, the observed channels on the ice surface do not follow Horton’s law of river length, as the mean lengths of channels decrease as stream order grows. This suggests that rather than being influenced primarily by the downstream accumulation of discharge, the channel network is influenced more by structural controls which create variations in the terrain that affect lengths independently of their order.
Correlation between number, mean length and stream order of supraglacial channels. Note that the Nansen Ice Shelf is omitted because it only has second-order drainage networks.
4.3.2. Sinuosity
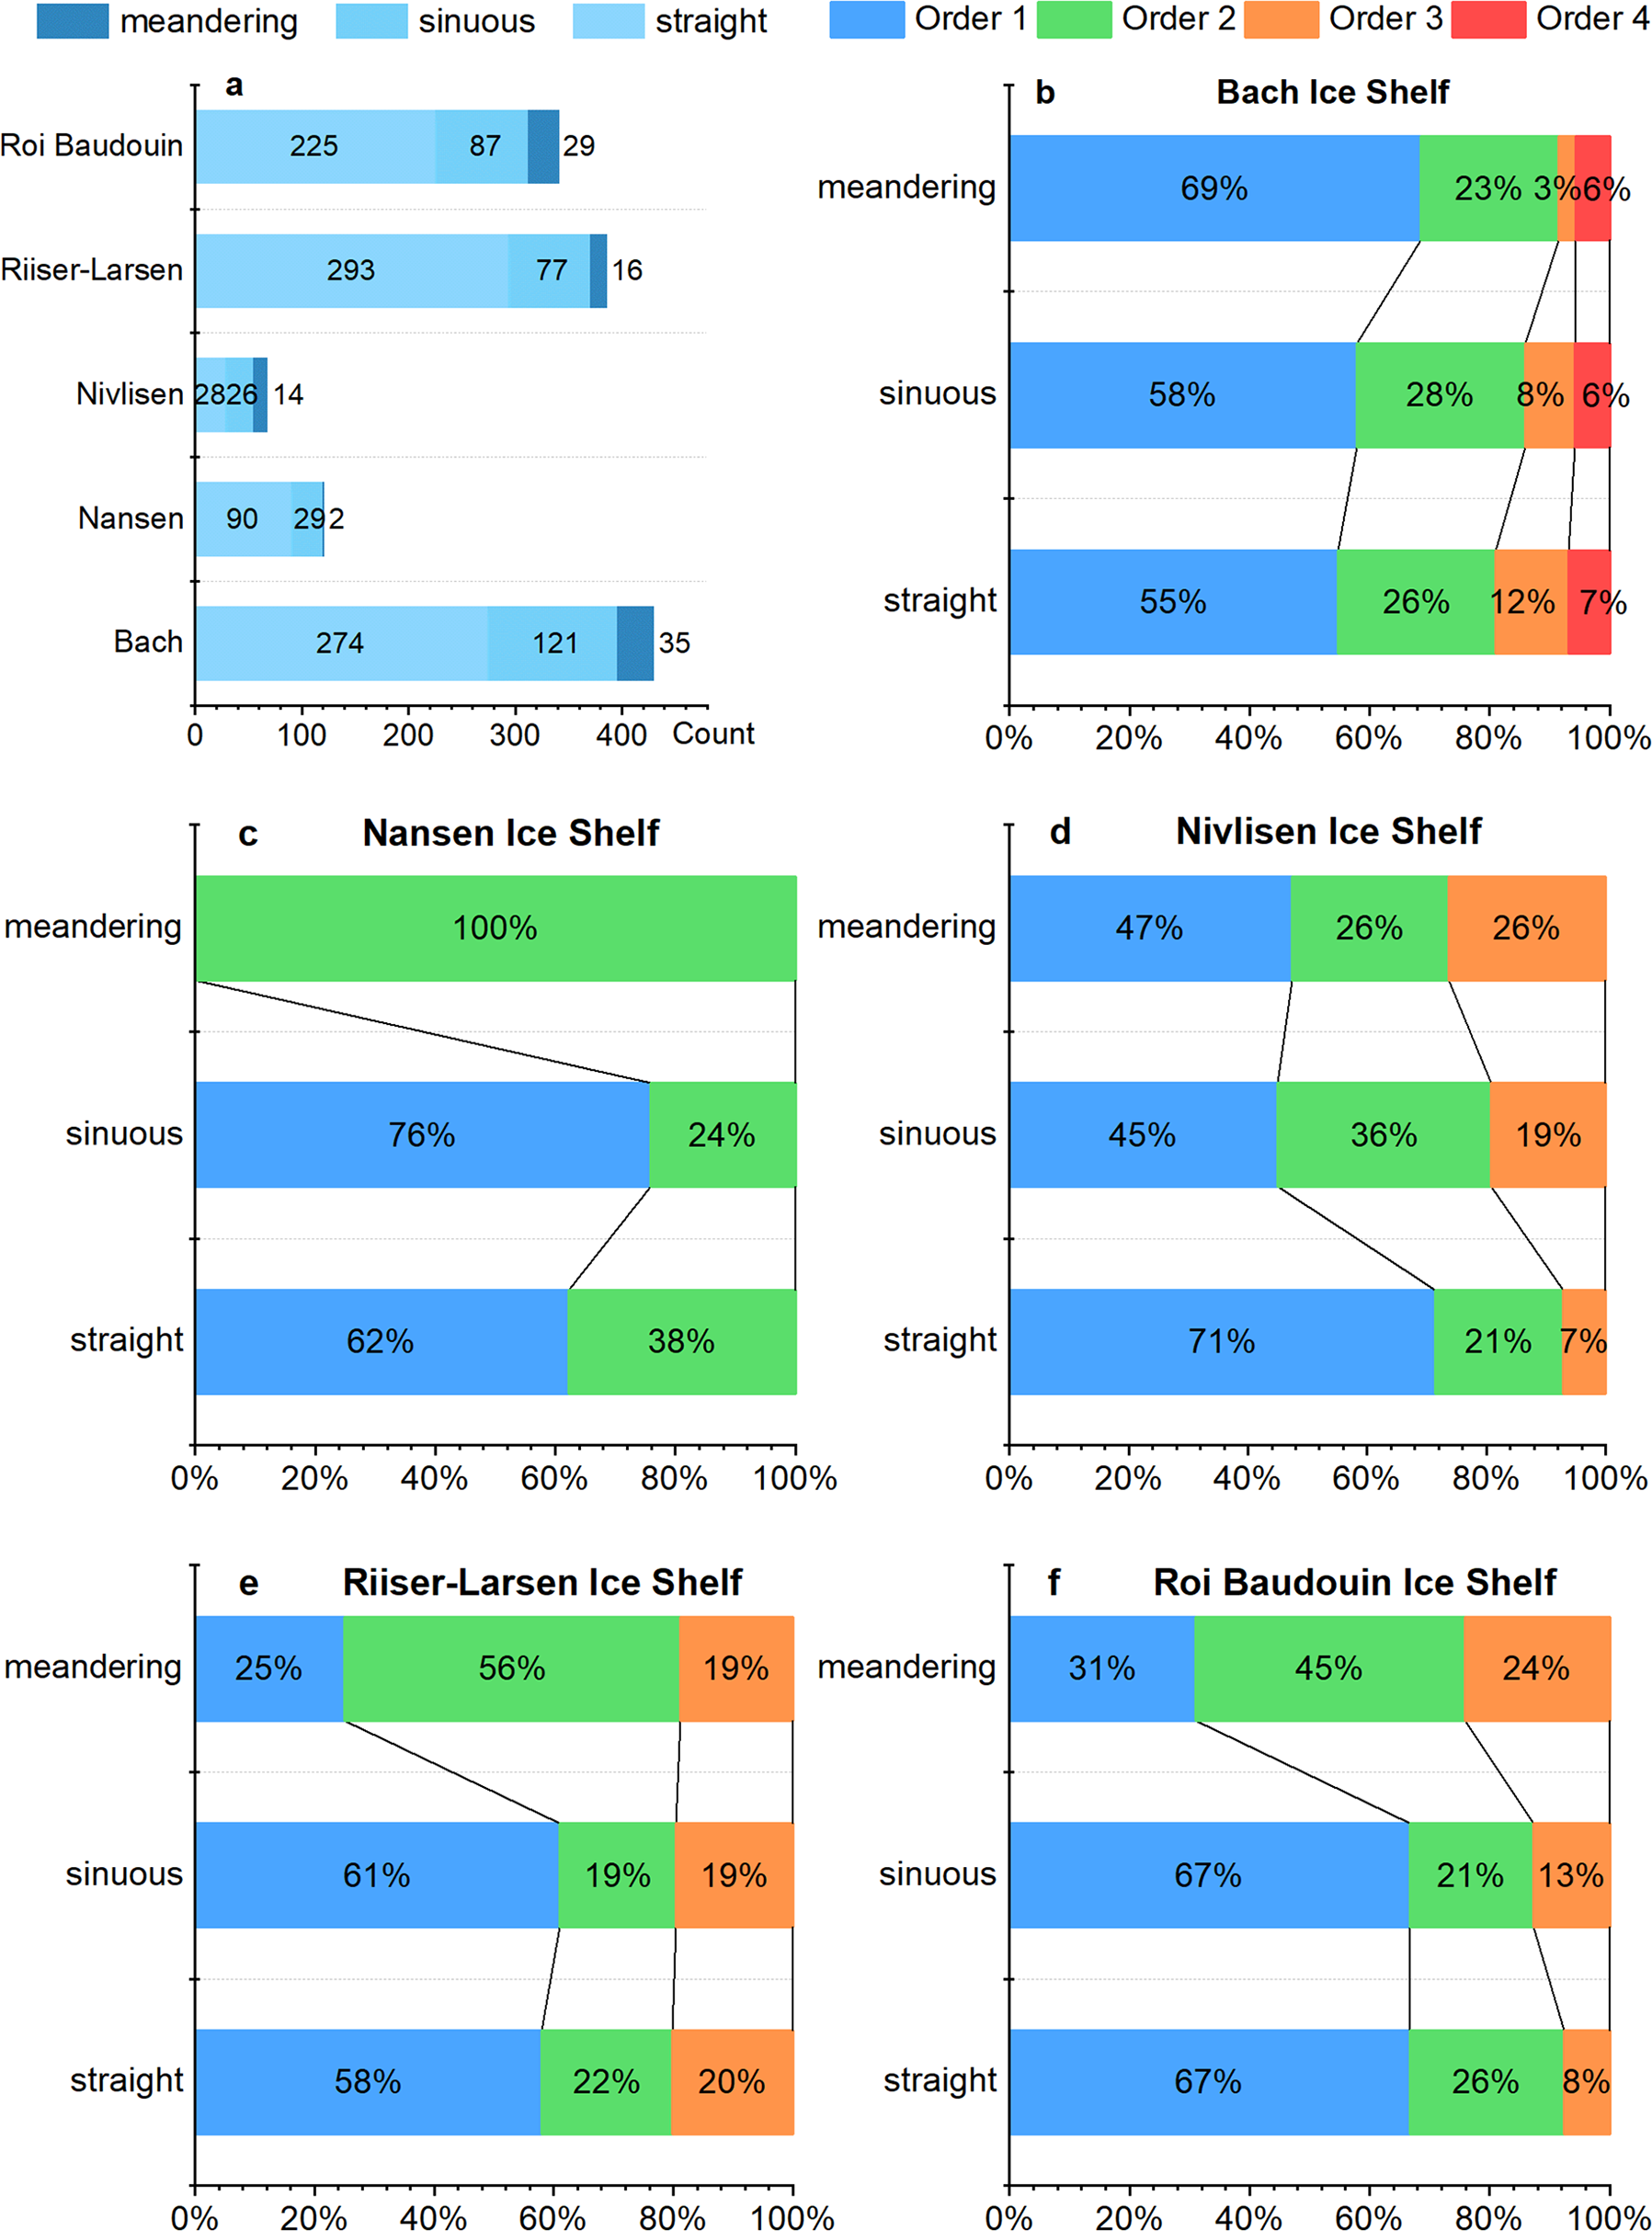
Table 6 displays the mean sinuosity values of different stream orders for all five ice shelves, which are generally low and only vary from 1 to 1.3. Brice and Blodgett (Reference Brice and Blodgett1978) classified channels with sinuosity values less than 1.05 referred to as straight, those between 1.05 and 1.25 as sinuous and those above 1.25 as meandering. Meandering patterns are more frequently observed in second- and third-order channels over Nansen, Riiser-Larsen and Roi Baudouin ice shelves (Fig. 12). In contrast, first-order channels predominantly exhibit meandering characteristics on Bach and Nivlisen ice shelves. As shown in Table 6, the first-order channels on Bach and Nivlisen ice shelves display smaller slopes (both surface and bed slopes) and deeper water depths compared to their counterparts on the other three ice shelves. This indicates that the first-order channels on Bach and Nivlisen ice shelves may possess more energy to generate meanders, rather than being solely shaped by the topography. Such heightened energy potential may also explain the meandering observed in second- and third-order channels on Riiser-Larsen and Roi Baudouin ice shelves.
Variation in supraglacial channels with different degrees of sinuosity: (a) the number of channels on each ice shelf and (b–f) the percentage of sinuosity for each stream order across the ice shelves.
4.3.3. Bifurcation ratio
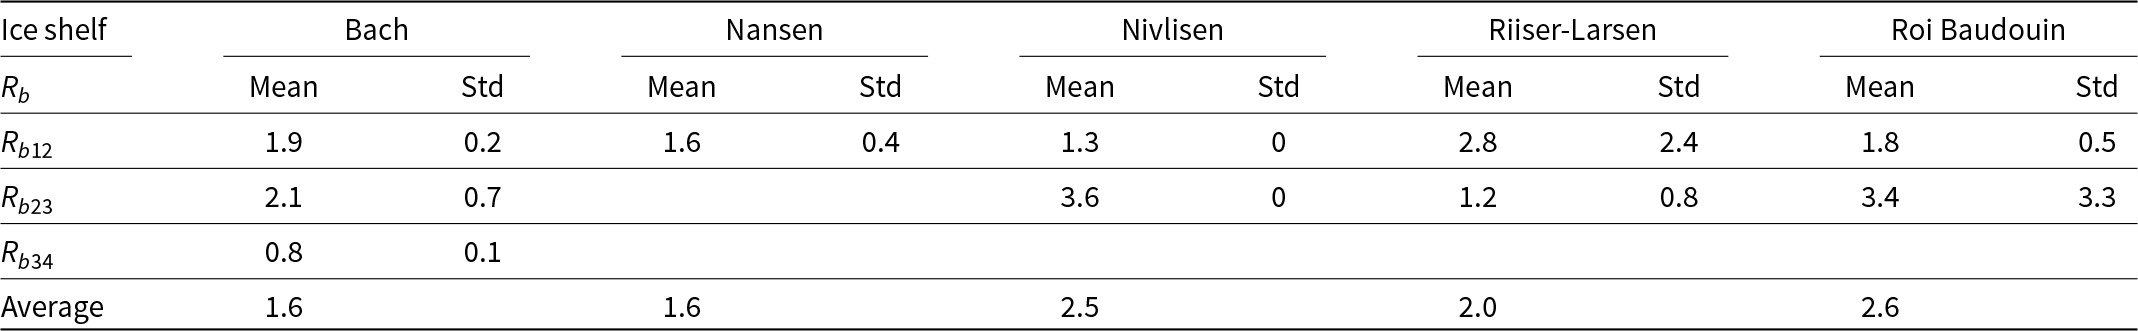
Further analysis of these supraglacial channel networks included calculating the bifurcation ratio (Rb) values, which characterizes the degree of branching and how channels are connected. The Rb was calculated for 51 supraglacial channel networks containing at least two stream orders. The Rb values for these networks range from a minimum of 0.8 ± 0.1 (Bach) to a maximum of 3.6 ± 0 (Nivlisen) (see Table 7). Generally, the Rb decreases in a downstream direction (i.e. towards higher order) in terrestrial river networks (Giusti and Schneider, Reference Giusti and Schneider1965; Yang and others, Reference Yang2016). The mean Rb values for second- and third-order channels range from 1.2 to 3.6 which is low compared to the normal range (2.0–4.0) for terrestrial rivers (Horton, Reference Horton1945), suggesting that supraglacial channels do not branch to the same significant extent as rivers on land.
Interestingly, the channel networks on Nivlisen, Riiser-Larsen and Roi Baudouin have more numerous smaller tributaries, as indicated by their mean Rb values of 2.0–2.6. However, a larger number of tributaries do not necessarily correlate with a higher density of drainage networks. For example, the Nivlisen Ice Shelf channels characterize a single extensive channel network with the highest average Rb value (i.e. 2.5) but the lowest drainage density (i.e. 0.25 km km−2), due to the large space between channels. In contrast, the channel networks on Bach Ice Shelf, with the lowest average Rb value (i.e. 1.6), show a higher drainage density (0.62 km km−2). This discrepancy is attributed to the presence of numerous individual channels that terminate in the firn layer, which cannot be considered in the calculation of Rb but still contribute to the overall drainage density. Only the supraglacial channel networks on Riiser-Larsen and Nansen ice shelves adhere to the patterns observed in terrestrial river systems, where higher Rb values correspond with higher drainage density. This finding highlights the diversity and complex nature of supraglacial channel networks, indicating that environmental and structural differences between ice shelves are crucial factors to consider when interpreting fluvial morphometry.
4.3.4. Channel orientations and relationship with ice flow direction
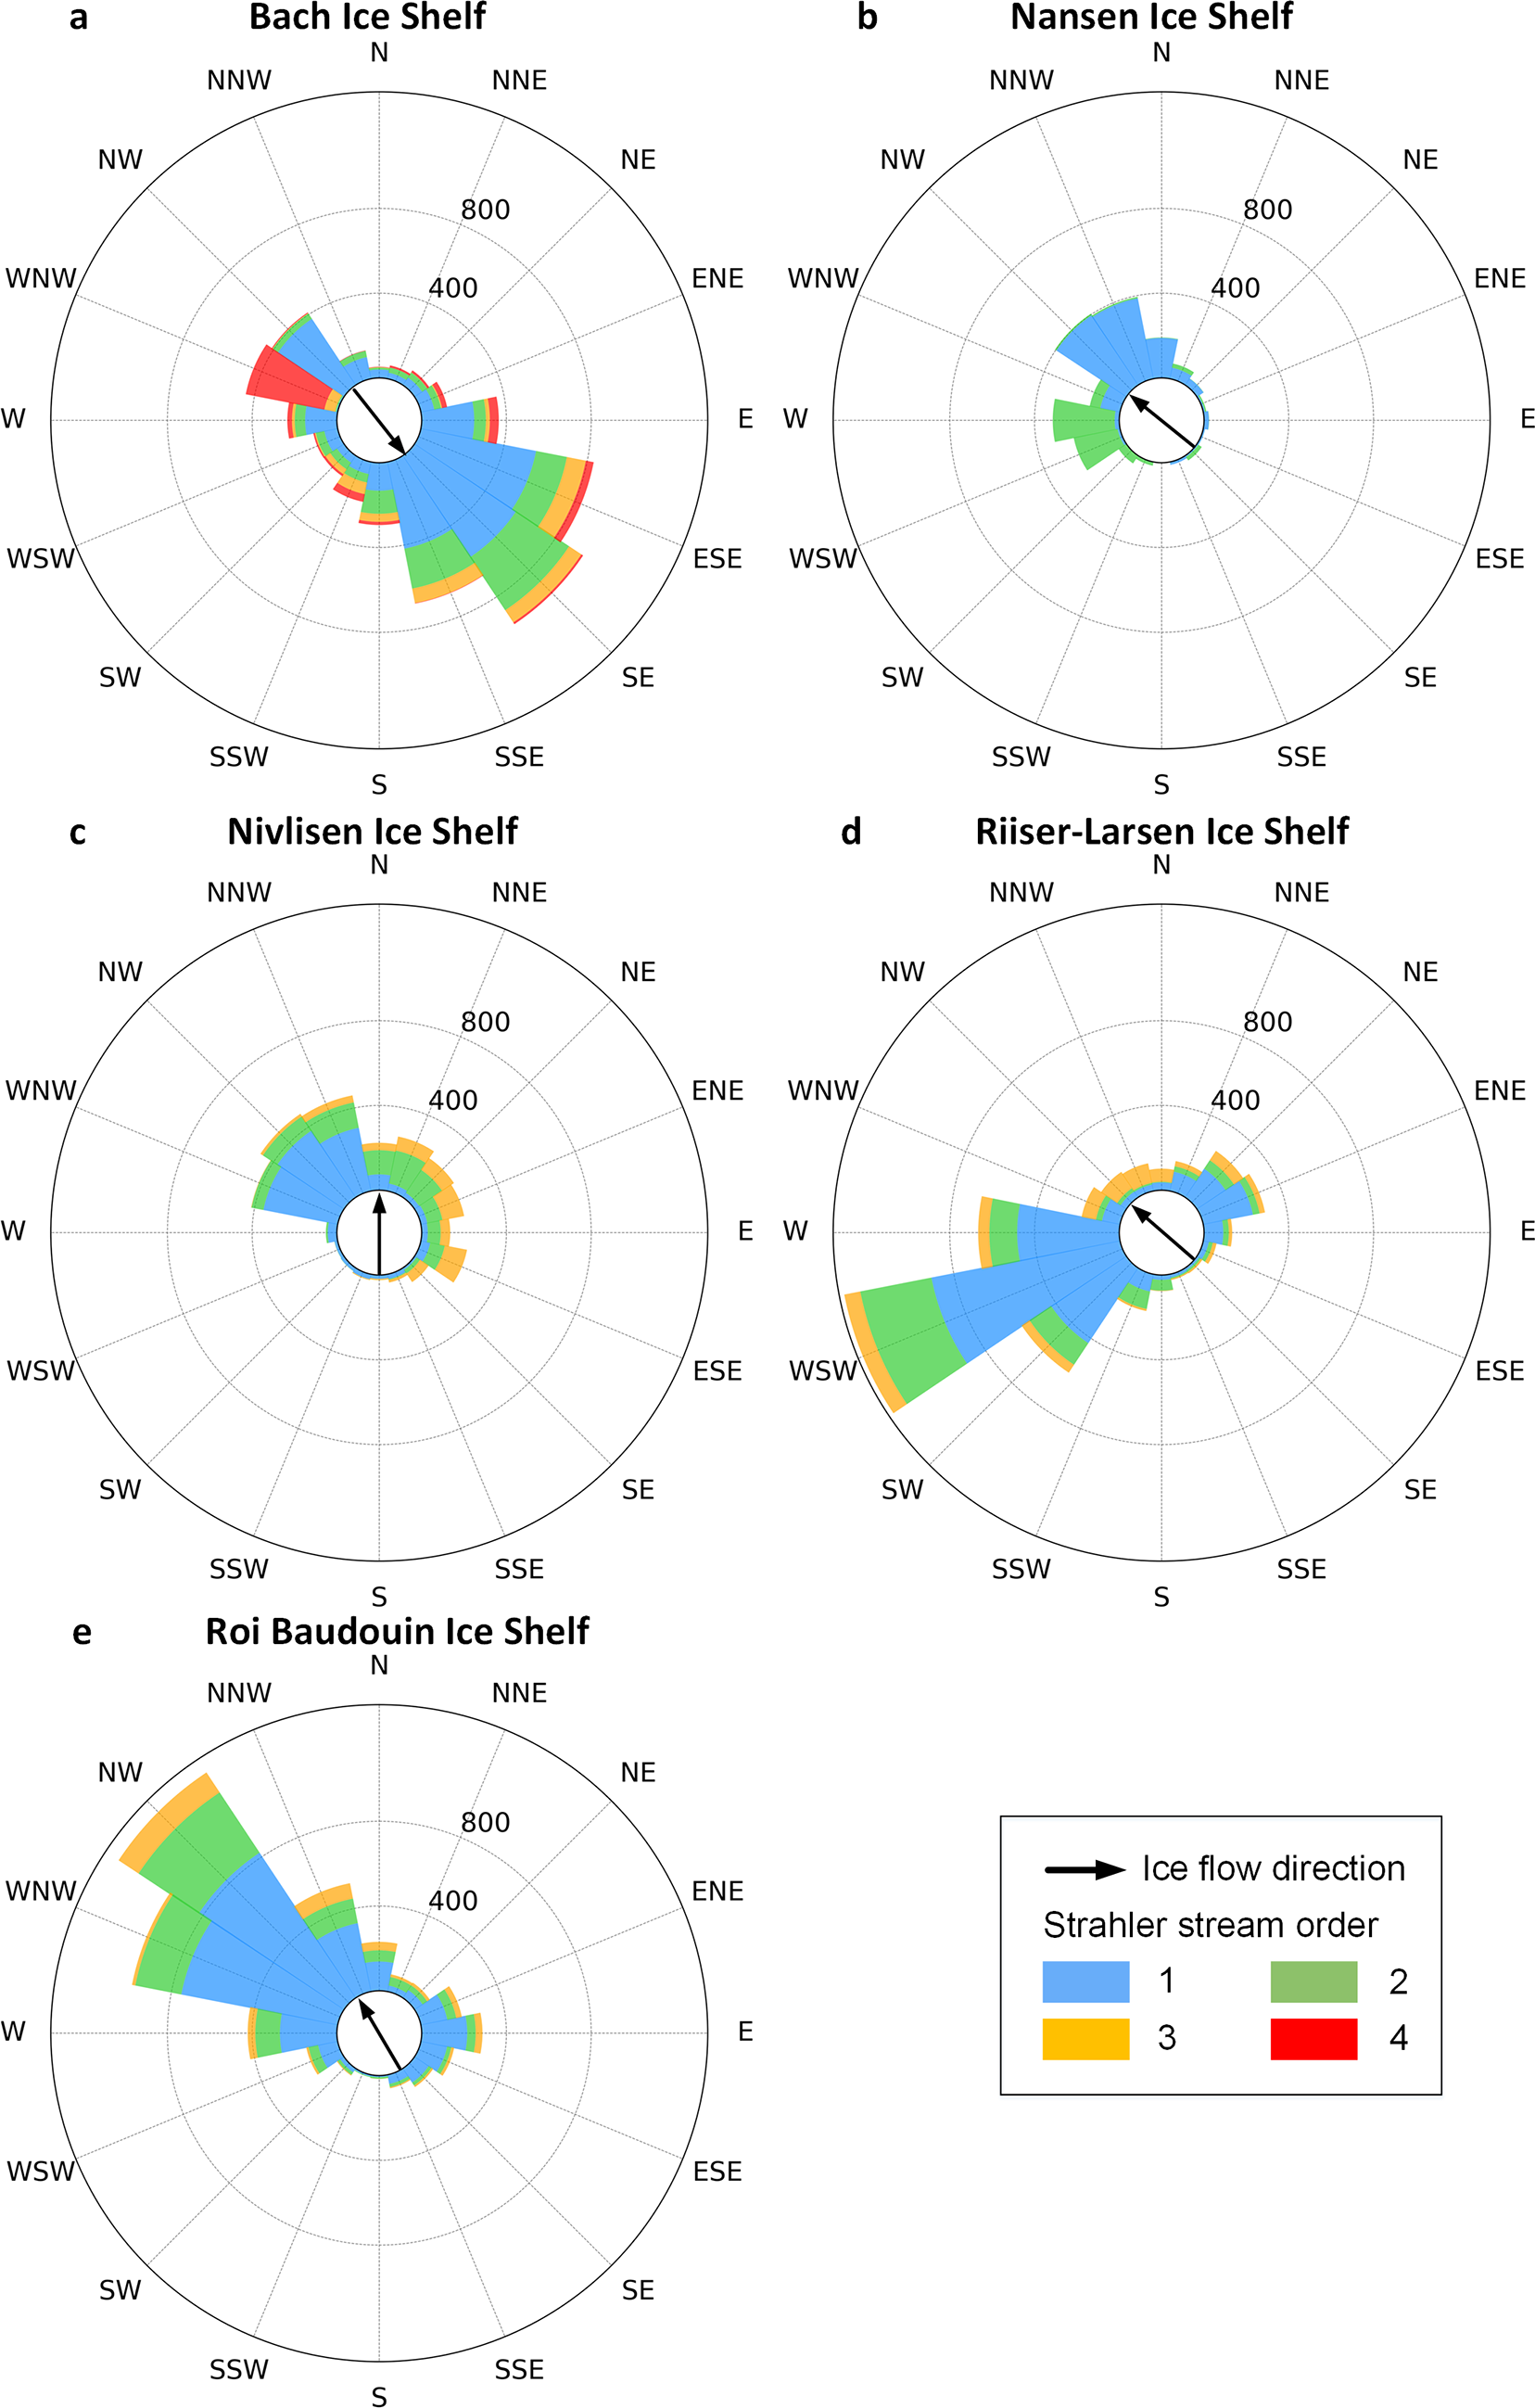
Figure 13 shows channel orientation grouped by Strahler stream order across the five observed ice shelves. Channel orientations on Bach Ice Shelf tend towards the southeast between 112.5° and 157.5°, with most channels aligning closely with ice flow direction. Supraglacial channels on Nansen Ice Shelf only have two stream orders, the first-order channels flow in a southwest direction while the second-order channels trend to the northwest. In contrast, the orientation of the channels on Nivlisen Ice Shelf is dispersed, with an obvious maximum to the northwest and some scattered orientations to the northeast. This dispersion occurs in a relatively flat, low elevation region of Nivlisen, where ice shelf structures are less visible, allowing tributaries to join the stem channels at angles less than 90°. For Riiser-Larsen Ice Shelf, lower-order channels are preferentially orientated to the southwest, but high-order channels shift to a northwest flow. These channel networks on Riiser-Larsen occur in the area at high elevation and across the grounding line, where the transition from grounded to floating ice correlates with an acceleration in ice flow and is more likely to produce surface structures such as fractures and rumples that strongly influence channel orientation. As a result, tributaries join the stem channels at right angles due to the angular nature of the structures. The difference in topography (i.e. slope) may therefore cause the channels to be less consistently aligned with ice flow on Nivlisen and Riiser-Larsen ice shelves. Channels on Roi Baudouin Ice Shelf flow in the northwest direction between 247.5° and 292.5°. Overall, the high-order channels (i.e. stem channels) align most closely with the direction of the ice flow.
Rose diagrams of supraglacial channel orientations for different ice shelves: (a) Bach, (b) Nansen, (c) Nivlisen, (d) Riiser-Larsen and (e) Roi Baudouin. Colours represent Strahler stream order, and radius length indicates the numbers of channels in each stream order. Each supraglacial channel network has a preferential orientation and sometimes all orders align, but sometimes they are at opposing angles. Black arrow (centre) indicates the general ice flow direction.
Mean bifurcation ratio (Rb) of supraglacial channel networks
4.3.5. Ice surface and channel bed slopes
To explore the influence of surface topography on supraglacial channels, the water surface and channel bed slopes were computed at 100 m intervals (see Table 6). The maximum surface slope of the first-order supraglacial channels on Nansen and Riiser-Larsen ice shelves reaches 0.0009, followed by Roi Baudouin, Nivlisen and Bach. For channel bed slopes, Riiser-Larsen Ice Shelf has the lowest mean value (0.0001) and Roi Baudouin has the highest value (0.0015). Notably, lower-order channels (i.e. first- and second-order) generally have steeper slopes than higher-order channels, suggesting that steeper slopes may cause meltwater to have greater energy to incise the ice more deeply and produce faster water flow velocities.
5. Discussion
5.1. Characteristics of supraglacial channel networks on Antarctic ice shelves and comparison to Greenland
In contrast to many previous studies on supraglacial hydrology on ice shelves, this study examines supraglacial lakes and channels as an integrated network, rather than analysing them as independent features. Our observations suggest that supraglacial drainage networks exhibit distinct drainage patterns on the studied ice shelves. Channelized drainage on all ice shelves (i.e. Bach, Nansen, Nivlisen, Riiser-Larsen and Roi Baudouin ice shelves) is characterized by a parallel drainage network (see Fig. 9), rather than a more dendritic pattern. Dendritic patterns have been argued to be an optimal state in the evolution of channel networks in the terrestrial environment (Kwang and others, Reference Kwang, Langston and Parker2021), such that in the absence of topographic, lithological and tectonic constraints, drainage networks should tend towards a dendritic form. Indeed, dendritic patterns have been noted on the GrIS where channels with low surface slope (i.e. in flatter areas) are more likely to exhibit branching characteristics than those on higher surface slopes (Yang and others, Reference Yang2016; Rawlins and others, Reference Rawlins, Rippin, Sole, Livingstone and Yang2023). For example, Yang and others (Reference Yang2016) mapped 523 supraglacial channel networks in western GrIS from WorldView-1/2 images. Their results showed channel networks are heavily branched and dendritic and/or have trellis-like or more parallel drainage systems. Despite the imagery being of different resolutions (i.e. 1–2 m in Greenland vs 30 m here), our analysis of drainage patterns on Antarctic ice shelves reveals a much simpler and more parallel drainage network, with fewer tributaries and with a more consistent alignment with the ice flow direction.
The tendency for parallel drainage to persist in Antarctica suggests there are important topographic or structural controls on the formation of channel networks which force the drainage to follow these linear routes. A clear example is the Nansen Ice Shelf which has only two stream orders. Furthermore, the bifurcation ratio of Nansen channel networks is the second lowest at 1.6 (see Table 6), implying that the channels are rarely confluent. The Nansen Ice Shelf exhibits a variety of structural features, such as flow-stripes, fractures and rumples which influence the high fragmentation (Fig. 3b) and low sinuosity (Fig. 12c) of supraglacial channels. Consequently, the occurrence of meandering channels (with a sinuosity over 1.25) is scarce on Nansen Ice Shelf, with straight channels accounting for 74% and sinuous channels for 24% of the total. Bell and others (Reference Bell, Banwell, Trusel and Kingslake2018) found a surface channel forming a 130 m-wide waterfall on the ice margin of Nansen Ice Shelf on 12 January 2014, while our study did not observe the channels at the same area exporting meltwater off the ice shelf in January 2020. In fact, all the channels we investigated appeared to terminate in the lakes or firn layer.
5.2. The effects of surface topography and structural glaciology
Previous work using satellite remote sensing over multiple years indicates that most supraglacial channel networks on ice shelves are persistent features from year-to-year, generally forming from the end of December and remaining active to mid-late January, corresponding with the austral summer months (Langley and others, Reference Langley, Leeson, Stokes and Jamieson2016; Arthur and others, Reference Arthur, Stokes, Jamieson, Carr and Leeson2020b; Banwell and others, Reference Banwell2021; Dirscherl and others, Reference Dirscherl, Dietz and Kuenzer2021). As observed in this study, supraglacial channel networks are generally located immediately down-ice of the grounding zone. It is characterized by a break in slope as ice begins to float as it ungrounds. This change in slope can generate transverse rumples and crevasses, which are often visible in satellite imagery (Fig. 3). The transverse flow features can sometimes generate channels that do not follow the overall ice surface slope and flow direction, but which then join the higher order trunk channels that are more closely aligned with the ice flow direction at an abrupt angle, as seen on Nivlisen and Riiser-Larsen ice shelves. Indeed, some of the larger trunk channels appear to be more closely controlled by ice surface topography that is aligned with ice flow and known as flow-stripes or longitudinal surface structures (Ely and others, Reference Ely, Clark, Ng and Spagnolo2017). In places, this leads to a more trellis-like pattern in the drainage network.
Comparing between the ice shelves, the channel locations seem to have no apparent connection with variations in ice surface velocity (Fig. 7). The influence of ice topography and volume of water flowing through channels can lead to differences in meander formation (Karlstrom and others, Reference Karlstrom, Gajjar and Manga2013). In most of our observed ice shelves, the low sinuosity relates to structural flow lines which manifest as shallow, narrow and relatively straight depressions in the ice surface and often oriented orthogonal or parallel to ice flow. Moreover, when the volume of water is larger, the channels tend to meander less, as the water is more likely to follow the downslope direction, which in most cases is aligned with the along-ice flow orientation. The results in this study support this view, with high-order channels (i.e. stem channels) accounting for the smallest proportion of meandering channels.
This study highlights that many supraglacial channels run parallel to ice flow (Fig. 13). Indeed, the channels on Nansen Ice Shelf particularly stand out with their parallel drainage pattern. The surface flow-stripes on Nansen surface topographically constrain and steer this linear channel formation, thus leading to a larger proportion of straight and fragmented channels. Meanwhile, supraglacial lakes tend to form at the junctions of along- and across-flow structures, perhaps where there are relative topographic lows on the ice shelf surface. The frequency of the across-flow structures likely relates to the relative rapidity of slope change experienced by the glaciers as they flow across the grounding zone and transition from relatively more steep grounded conditions to a lower gradient floating ice condition of the ice shelves. Moreover, the spacing between parallel linear channels of the drainage network is plausibly linked to the proximity of flow-stripes, and these may be closer where ice is squeezed through a topographic narrowing as it feeds from the grounded ice where topography can confine the glaciers slightly and into the ice shelf.
6. Conclusions
In this study, large (>30 m wide) supraglacial channel networks on five Antarctic ice shelves were mapped from the Landsat-8 satellite imagery around the peak of the melt season in 2020 or 2022: Bach (2020), Nansen (2022), Nivlisen (2020), Riiser-Larsen (2020) and Roi Baudouin (2022). Quantification of the supraglacial channel networks was explored by calculating various fluvial morphometry metrics, including length, width, depth, sinuosity, bifurcation ratio, orientations, slopes and drainage density. We found that extensive interconnected supraglacial lakes and channels exist on all five ice shelves, and most are organized as simple, parallel drainage networks with the highest stream-orders ranging from first- to fourth-order (Strahler ordering system). Supraglacial channel networks on Antarctic ice shelves are commonly observed in regions characterized by low elevations (<60 m) and flat ice surface terrain (channel bed slope <0.001). The channel networks have parallel drainage pattern with channels exhibiting low sinuosity (typically 1.1). The structural characteristics of these networks are primarily influenced by surface topography and the structural glaciology (i.e. longitudinal flow-stripes and transverse rumples) of the ice shelves. The preferred flow orientation of supraglacial channel networks aligns with the ice flow direction of the ice shelves, highlighting their dependence on these factors. This is in contrast with some observations from Greenland that have reported more dendritic patterns and often more meandering channels. A further difference compared to Greenlandic channels is that the termini of Antarctic channels are associated with large lakes or drain into a more porous firn layer, rather than flowing off the ice sheet/shelf or draining into moulins, which has only been observed rarely (e.g. Tuckett and others, Reference Tuckett2019; Dunmire and others, Reference Dunmire2020).
Recent work has highlighted that future climate warming in Antarctica will lead to higher melt rates and increase the volume of surface water on potentially vulnerable ice shelves (Bell and others, Reference Bell, Banwell, Trusel and Kingslake2018; Van Wessem and others, Reference Van Wessem, Van Den Broeke, Wouters and Lhermitte2023)—the so-called ‘Greenlandification’ of Antarctica (Mottram and others, Reference Mottram2021). Supraglacial channel networks will play an increasingly important role in transporting water across such ice shelves, with potential to transport water either towards or away from areas of ice shelves vulnerable to hydrofracturing. This study provides a baseline dataset and future work could investigate both the seasonal evolution of channel networks in relation to climate forcing, as well as their future evolution in a warming climate.
Data availability statement
The satellite imagery, REMA DEM and meteorological data are all open access and freely available (ref. Section 3). The supraglacial lakes and channels mapped in this study will be deposited in Zenodo (doi: 10.5281/zenodo.13769598).
Competing interests
The authors declare that they have no conflict of interest.
Acknowledgements
This research was carried out as part of a Masters by Research in the Department of Geography at Durham University. We are grateful to Dr Caroline Clason (Durham University) and Dr Amber Leeson (Lancaster University) who provided constructive comments on an earlier version of this manuscript. This manuscript also benefitted from the constructive comments of the editor (Dr Bea Csatho) and two anonymous referees, for which we are very grateful.


 Open access