

Seasonal influenza is a common cause of mortality, morbidity and lost productivity, and circulating strains vary from year-to-year and throughout the world [Reference Keech and Beardsworth1]. Pandemic influenza A(H1N1) was first reported in Mexico during the northern hemisphere spring of 2009, with rapid spread to North America and then through the rest of the world over subsequent months [Reference Khan2]. Influenza can be transmitted by direct contact (or fomites), large droplets >20 μm (that settle rapidly) or aerosols <5 μm (that remain airborne for extended periods) [Reference Tellier3]. The relative importance of the three modes is not constant, and recent work suggests that the dominant transmission mechanism depends on factors such as temperature, humidity and room ventilation [Reference Tellier4]. However, airborne transmission is now strongly suspected to play a significant role in short-range (e.g. immediate vicinity) influenza spread indoors under certain conditions, although its specific role in long-range (e.g. building-scale) transmission is more difficult to elucidate [Reference Tellier3, Reference Tellier4].
Instances where airborne transmission is believed to have contributed to human-to-human spread of influenza arising from time spent in aircraft have been documented [Reference Moser5–Reference Baker7]. The outdoor air ventilation rate of the cabin can be a determinant of such outbreaks, as inadequate ventilation prevents effective dilution of airborne droplet nuclei [Reference Tellier3, Reference Tellier4]. Studies addressing other transport modes are scarce.
During the 2009 H1N1 pandemic, three persons in Australia who travelled by car with an infectious source case subsequently developed the illness [Reference Binns, Sheppeard and Staff8]. Despite the potential for influenza transmission in cars, we are not aware of studies to quantify airborne transmission risk and its relationship with cabin ventilation. To address this shortcoming, we performed a measurement and model-based investigation.
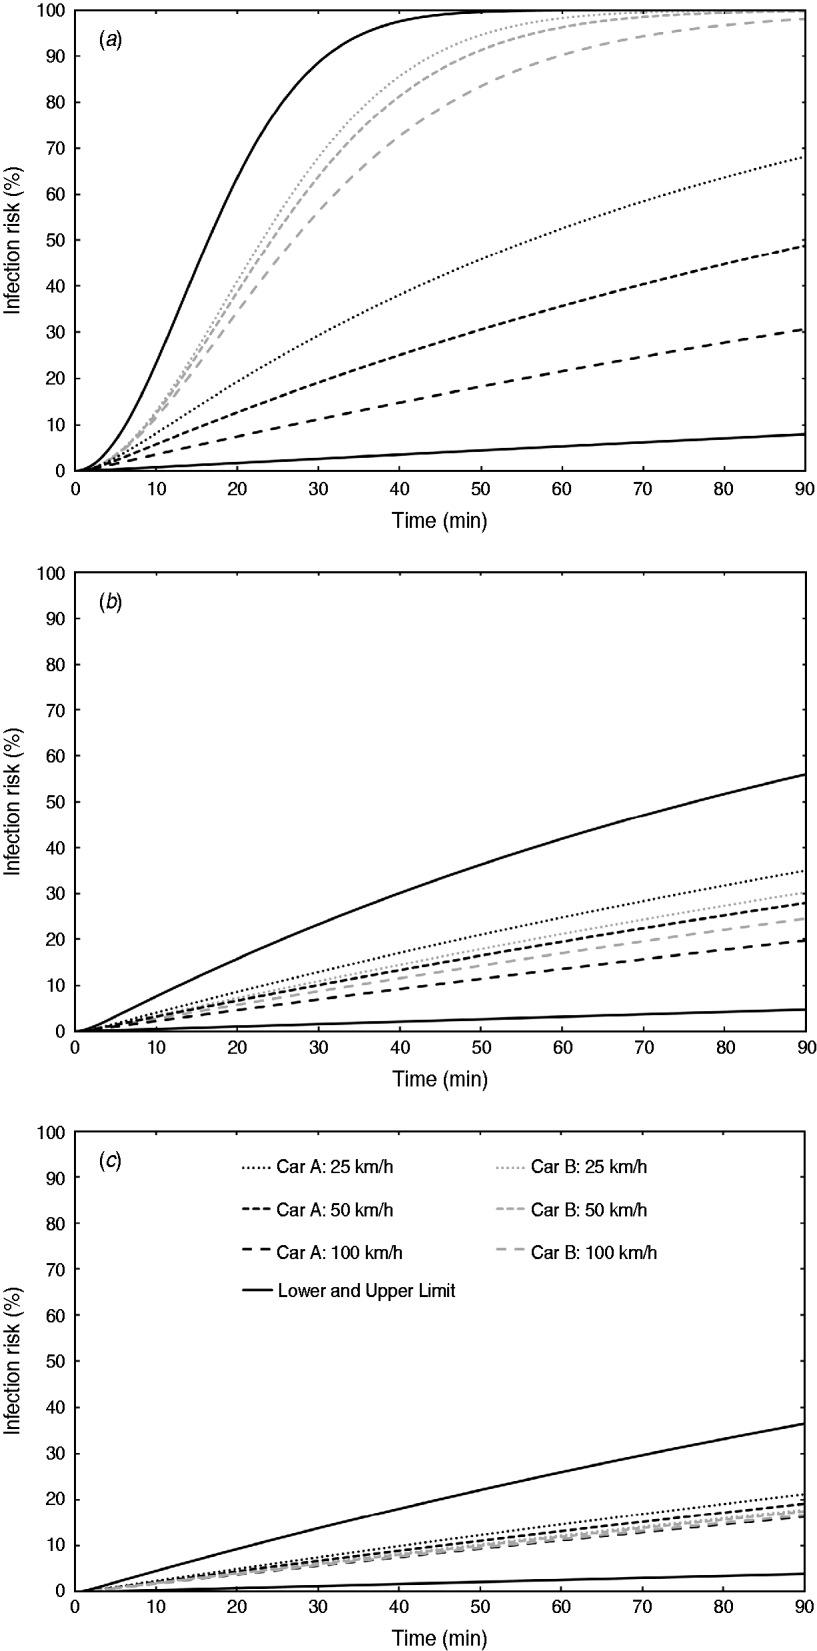
Outdoor air-exchange rate measurements were performed inside the cabins of six passenger cars using sulphur hexafluoride (SF6) as a tracer gas and the constant emission and concentration-decay techniques, as reported previously [Reference Knibbs, de Dear and Atkinson9]. Three distinct ventilation settings were assessed: low (air recirculated at lowest fan speed), medium (air non-recirculated at lowest fan speed), and high (air non-recirculated at second-highest fan speed). Triplicate measurements were performed for all ventilation settings when the cars were stationary and when driven at 60 and 110 km/h. All windows were always kept closed.
The results indicated large inter-vehicle variability in outdoor air exchange under certain ventilation settings as a consequence of both car age and design. We selected the two cars that best highlighted this [Reference Knibbs, de Dear and Atkinson9] for inclusion in further analyses: car A, a 1989 Mazda 121 hatchback, and car B, a 2005 model Volkswagen Golf hatchback. Recirculated air was not filtered in either car.
We employed Gammaitoni & Nucci's [Reference Gammaitoni and Nucci10] variation of the Wells–Riley model to estimate infection risk in the two cars. Using this approach, it was assumed that if a single infectious individual was present, they emitted influenza quanta at a constant rate, and there was no prior source of quanta (i.e. the initial level was zero). An infectious quantum is defined as the dose of droplet nuclei required to cause infection in 63% (1 – e−1) of susceptible persons. Quanta production rates of infectious individuals have been retrospectively calculated by several epidemiological studies of influenza outbreaks, and we used a value of 67 quanta/h, which represents the approximate median of infectivity estimates for both seasonal influenza [Reference Myatt11] and H1N1 [Reference Wagner, Coburn and Blower12]. Furthermore, we used the full range of published values, i.e. 15–128 quanta/h [Reference Rudnick and Milton13], in order to establish the likely range of risk in our simulations.
A key assumption of the model is well-mixed air within the modelled space. While this is unlikely to be the case in many indoor environments, experimental data indicate that mixing within car cabins under closed window conditions is relatively uniform [Reference Ott, Klepeis and Switzer14]. A standard respiratory ventilation rate of 0·6 m3/h was assumed for susceptible persons [Reference Beggs15].
Gammaitoni & Nucci's model (where the initial quanta level=0) is based on the rate of change in quanta levels through time [Reference Gammaitoni and Nucci10, Reference Beggs15]:
Where q is the number of infectious quanta produced per source case (quanta/h), I is the number of infectious source cases, N is the outdoor air-exchange rate (air changes/h), t is the duration of exposure (h), and n is the total number of quanta in the space under steady-state conditions (n=qI/N).
From this, the number of quanta in the space at time t, n t, is:
where n 0 is the initial number of quanta in the space.
Finally, the infection risk is given as:
where p is the average respiratory ventilation rate of susceptible persons.
Average car speeds (25, 50, 100 km/h) and trip durations (up to 90 min) spanning the range typical of commuter travel were modelled. Infection risk was calculated for each combination of car, ventilation setting, speed, and trip time.
Measured outdoor air-exchange rates are summarized in Table 1. The relationship between car speed and air exchange was linear in all cases, and air exchange was calculated for all speeds between 0 and 110 km/h. Under the high ventilation setting, air exchange was comparable to that when a window is partly opened [Reference Ott, Klepeis and Switzer14]. The air-tightness of the vehicles when driven varied significantly, with the newer car (car B) characterized by outdoor air-exchange rates one order of magnitude lower than those in the older vehicle under the low ventilation (recirculation) condition (Table 1).
Summary of car characteristics and ventilation rate measurements (ventilation rates are expressed in units of air changes per hour)
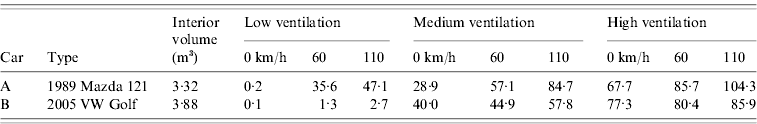
Figure 1(a–c) shows the relationship between trip duration and estimated infection risk for the low, medium and high ventilation settings, respectively. Under the low setting, infection risks in car A reached 68% [range (given in parentheses) calculated using low to high quanta production rates 23–89%], 49% (14–72%) and 31% (8–50%) for a 90-min trip at average speeds of 25, 50 and 100 km/h, respectively. The corresponding 90-min risks in car B were 99·9% (84–99·9%), 99·7% (75–99·9%) and 98% (59–99·9%), respectively.
Estimated influenza infection risk assuming an infectious quanta production rate of 67 quanta/h under (a) low, (b) medium, and (c) high ventilation settings in two cars driven at average speeds of 25, 50, and 100 km/h for up to 90 min. Solid black lines indicate lower and upper risk limits. These were calculated using the minimum and maximum published influenza quanta production rates [Reference Rudnick and Milton13] when applied to the lowest and highest risk scenarios, respectively, of the six shown in each figure.
Under the medium ventilation setting in car A, risk at 90 min reached 35% (9–56%), 28% (7–46%) and 20% (5–34%) at 25, 50 and 100 km/h, respectively. The respective equivalent risks in car B were 30% (8–50%), 28% (7–47%) and 24% (6–41%). When the high ventilation setting was selected, risk in car A after 90 min was 21% (5–36%), 19% (5–33%) and 16% (4–29%) at speeds of 25, 50 and 100 km/h, respectively. In car B, corresponding risks were 17% (4–31%), 17% (4–31%) and 17% (4–29%), respectively. Under medium and high settings, ventilation rates, and thus infection risks, at a given speed were more comparable between the two vehicles than under the recirculation setting. There was also much less variation in ventilation rates with increasing speed. In these cases, air was constantly delivered from outdoors by a fan and air pressure gradients, and vehicle cabin air-tightness was a less important determinant of ventilation rate [Reference Knibbs, de Dear and Atkinson9].
The potential for airborne transmission of influenza, while still the subject of debate, is now supported by a substantial body of work [Reference Tellier3, Reference Tellier4]. The likely in-car H1N1 transmission reported by Binns et al. [Reference Binns, Sheppeard and Staff8] occurred during a predominantly freeway journey of about 180 min. When driving at freeway speed, our estimates indicate that airborne influenza infection risk is 59–99% after 90-min travel if air is recirculated in the newer car. Other potential in-car transmission mechanisms in addition to airborne spread, including direct person-to-person contact and droplets, may have contributed to the reported case [Reference Binns, Sheppeard and Staff8] and cannot be excluded. However, their relative importance is likely to vary according to situation, with poor ventilation generally favouring airborne transmission [Reference Tellier3]. Furthermore, Moser et al. [Reference Moser5] concluded that inadequate ventilation was the main cause of an influenza outbreak (attack rate 72%) when an aircraft was grounded for 3 h. The conditions during that outbreak were particularly amenable to airborne transmission [Reference Tellier3]. Our results indicate that the low air-exchange rate when recirculating air in the two cars, especially the newer car, supports airborne transmission to a greater extent than the medium and high ventilation settings. The reduced humidity of cabin air achieved by air conditioning may also contribute to favourable transmission conditions [Reference Tellier4, Reference Moser5].
For most modelled scenarios in both cars, our influenza transmission risk estimates for a 90-min trip are higher when compared to those for air travel of up to 17 h on a Boeing 747 in the presence of a single infectious person [Reference Wagner, Coburn and Blower12]. Notwithstanding differences in passenger numbers, this finding indicates that control practices during influenza outbreaks should consider the potential role of car travel, in addition to that in other transport modes, as an activity during which transmission may occur.
The model we used is limited with respect to its primary assumptions of: (a) complete air mixing, (b) an equal respiratory ventilation rate and susceptibility to infection among non-infectious passengers, (c) constant quanta generation by the source case, and, (d) the effect of ventilation as a quanta removal mechanism significantly exceeding that of other processes [Reference Rudnick and Milton13, Reference Beggs15]. However, its utility as a tool for assessing relative risks has been demonstrated previously [Reference Rudnick and Milton13, Reference Beggs15].
Most investigations of influenza transmission in transport modes have focused on aircraft and public transport. Our estimates suggest that influenza transmission risks in the two passenger cars we investigated were strongly influenced by vehicle characteristics and ventilation settings, and that marked risk reductions can be achieved by not recirculating air. High-risk persons should be advised to be cautious regarding who they travel with by car during outbreaks of influenza. The potential for in-car transmission of other illnesses spread by the airborne route should not be neglected.
ACKNOWLEDGEMENTS
This work was supported by an Australian Research Council Discovery Grant (DP0558410), ‘Mechanisms of virus transport in indoor environments’.
DECLARATION OF INTEREST
None.


