


1. Introduction
Although the relationship between economic development and fertility is prominently featured in the demographic economics literature, the results of existing studies provide mixed and inconclusive evidence on the causality between the two variables. Theories of fertility suggest that an increase in income per capita has both income effect (an increase in the demand of children) and substitution effect (a decrease in the demand of children due to the opportunity cost of raising children). The overall impact of income per capita depends on which effect dominates. Becker et al. (Reference Becker, Murphy and Tamura1990) suggest that fertility reduction in the demographic transition is driven by the quality–quantity trade-off in fertility decisions. This ambiguity in the theoretical literature is also mirrored in the empirical literature which finds both significantly positive effects of income on fertility [e.g., Brückner and Schwandt, Reference Brückner and Schwandt2013; Lovenheim and Mumford, Reference Lovenheim and Mumford2013; Kearney and Wilson, Reference Kearney and Wilson2018; Gallego and Lafortune, Reference Gallego and Lafortune2021] and negative effects as well [e.g., Jones and Tertilt, Reference Jones and Tertilt2008; Herzer et al., Reference Herzer, Strulik and Vollmer2012] of income on fertility. As a result, the topic has regained interest and become at the forefront of current research frontier in demographic economics literature [see e.g., De La Croix and Doepke, Reference De La Croix and Doepke2003; Galindev, Reference Galindev2011; Lee and Mason, Reference Lee and Mason2014; Schoonbroodt and Tertilt, Reference Schoonbroodt and Tertilt2014; Baudin et al., Reference Baudin, De la Croix and Gobbi2015; Cordoba et al., Reference Cordoba, Liu and Ripoll2016; Field et al., Reference Field, Molitor, Schoonbroodt and Tertilt2016; De La Croix and Gobbi, Reference De la Croix and Gobbi2017; Alam and Pörtner, Reference Alam and Pörtner2018; Bar et al., Reference Bar, Hazan, Leukhina, Weiss and Zoabi2018; Kearney and Wilson, Reference Kearney and Wilson2018; De Silva and Tenreyro, Reference De Silva and Tenreyro2020].
The literature in demographic economics suggests that there are several mechanisms through which income affects fertility. The most common theories proposed in the literature to explain the relationship are either the trade-off between the quantity and quality of children, the higher opportunity cost of time for higher earners of income, or both [see e.g., Becker and Lewis, Reference Becker and Lewis1973; Galor and Weil, Reference Galor and Weil2000; Doepke, Reference Doepke2004, Reference Doepke2015]. Yet, the debate on the power of the theories suggested in the literature in explaining the income–fertility nexus is far from being resolved. For example, Jones and Tertilt (Reference Jones and Tertilt2008) contend that the theories on the relationship between income and fertility are not robust, suggesting the need for further research along these lines.
Given the mixed evidence in the existing literature, the main objective of this paper is to ascertain the marginal effects of income on fertility by employing recently innovated instrumental variable generalized quantile regression (IV-GQR) developed by Powell (Reference Powell2020). The most common approaches employed in the existing studies are the conditional mean regressions that estimate the average effect of national income on the conditional mean of fertility (the central effect). However, economic theories suggest differential impacts of income at different spectrums of the fertility distribution (Becker et al., Reference Becker, Murphy and Tamura1990). Cervellati and Sunde (Reference Cervellati and Sunde2011) suggest that the effect of income on fertility depends heavily on the selected sample and whether countries have already initiated the fertility transition. In light of this, while the standard linear regression techniques used by the existing studies are useful to summarize the average relationship between national income and fertility based on the conditional mean function of fertility, they provide only generalized or stylized view of the relationship based on the averages. More importantly, the average relationship based on the this stylized approach may not represent the fertility–income relationship adequately particularly when conducting cross-country analysis which is crucial to ensure external validity and assess the transferability of policy across countries.
From a policy perspective, it is of paramount importance to examine the effect of income on fertility at different points in the conditional distribution of fertility. To this end, this study employs an IV-GQR approach, which provides the capability to address the estimation issues in the previous studies. Specifically, the IV-GQR approach provides the capability to examine the relationship between income and fertility at different points in the conditional distribution of fertility, thereby providing a more detailed representation of the data. In line with this, Adams (Reference Adams2015) suggests a nonlinear approach to study the interaction between long-run growth and demographic transition where quantity–quality substitution is driven by declining child mortality. Moreover, quantile regression has distinct appealing features as the estimates are robust to non-normal errors and outliers and it accounts for parameter heterogeneity.
The potential bias from endogeneity of income is another important issue in modeling the fertility rate and national income. Changes in fertility could have an effect on GDP growth through the dilution of capital stock. In addition, fertility reduction can boost female labor force participation that increases labor supply and hence raises income per capita. It is also likely that smaller birth cohorts initially reduce youth dependency ratios and increase output per capita—the demographic divided and eventually it could increase old-age dependency ratios and decrease output per capita in those economies further along with the demographic transition. For example, countries with high levels of fertility in developing economies such as in the sub-Saharan region may respond differently than those countries which already have transitioned to permanently low fertility. To address this issue, we use plausibly exogenous variations in oil price shock as an instrumental variable for national income.
Using data for a panel of 122 countries spanning the period 1965–2020, our IV-GQR estimates indicate that national income has generally a negative effect on total fertility. However, our estimates exhibit considerable heterogeneity in the coefficient of income over the distribution of fertility. The gradient of national income is generally decreasing across the quantiles of fertility after the median value suggesting that income elasticity of fertility is relatively lower in poor countries. Our empirical results provide a more complete picture of the entire distribution of the fertility rate as opposed to estimating the simple average relationship.
The remainder of this paper is organized as follows. Section 2 motivates our empirical approach in modeling the relationship between fertility and income from the existing theoretical and empirical literature. Section 3 explores the econometric methodology and data we utilize to examine the complexities of the economic theory and data realities that base our empirical analysis of the effect of income on fertility. Section 4 provides the empirical results and discussions. Section 5 concludes.
2. Literature review
In his seminal paper, Becker (Reference Becker1960) has pioneered the economic approach to explain the theory of fertility choice which plays a central role in modern demographic economics. His main conjecture in the fertility choice is that parents derive utility from both quantity (the number of children) and the quality of children (the amount spent on each child at given prices). Subsequent studies [e.g., Becker and Lewis, Reference Becker and Lewis1973] have taken Backer's seminal work to the next stage placing the quantity–quality trade-off at the front and center stage of fertility theory to explain the negative relationship between national income and fertility. Related studies such as Willis (Reference Willis1973) argued that the rise in women employment is one of the most prominent factors explaining fertility decline over the demographic transition through the dominating effect of the substitution effect over income effect. The choice of quality over quantity of children through investment in children's human capital strengthens the dominating effect of substitution effect over the income effect as household income increases which results in a sharp decrease in fertility rates (Willis, Reference Willis1973; Iyigun, Reference Iyigun2000). Galor (Reference Galor2005, Reference Galor2011) lays the foundation for modern economic analysis in the unified growth theory that emphasizes the role of human capital in the process of economic development and demographic transition. The quantity–quality model of fertility choice has been the workhorse of the economics of fertility over the past five decades and it remains to be an important theoretical framework in fertility research in the next 50 years (Doepke, Reference Doepke2015).
Although the literature on the nexus between income and fertility is growing rapidly, existing empirical studies provide mixed and inconclusive evidence about the link between the two variables. These studies focus on estimating the effect of income on the conditional mean of fertility. Herzer et al. (Reference Herzer, Strulik and Vollmer2012) use a panel co-integration framework to examine the long-run average relationship between income and fertility. Their results show that fertility is negatively related to per capita income. Brander and Dowrick (Reference Brander and Dowrick1994); Schultz (Reference Schultz1997); Ahituv (Reference Ahituv2001), Lorentzen et al. (Reference Lorentzen, Millan and Wacziarg2008) and Jones and Tertilt (Reference Jones and Tertilt2008) are among the most prominent other studies that find a negative association between fertility and income.
The other strand of literature documents evidence on the positive relationship between per capita income and fertility. Brückner and Schwandt (Reference Brückner and Schwandt2013) examine the effect of per capita national income on population growth and fertility. Their findings show that an increase in income has a significant positive effect on both population growth and fertility. Specifically, their estimates show that, very roughly, a doubling of national income leads to one additional child born per woman in a 10 year period. Similarly, Lovenheim and Mumford (Reference Lovenheim and Mumford2013) exploit the variations in home prices as a proxy for the change in family wealth for the 1985 to 2007 to study the effect of shocks in family wealth on fertility. They find that, on average, an increase in home value of $ 100, 000 leads to a 16% increase in the probability of having an additional child. Several other recent studies provide evidence in support of the positive effect of income on fertility [e.g., Lindo, Reference Lindo2010; Black et al., Reference Black, Kolesnikova, Sanders and Taylor2013; Alam and Pörtner, Reference Alam and Pörtner2018; Kearney and Wilson, Reference Kearney and Wilson2018; Gallego and Lafortune, Reference Gallego and Lafortune2021].
Apart from income, one of the major determinants of the total fertility rate is human capital, commonly measured as average years of educational attainment. The relationship between education and demand for children is considerably studied in the literature. Most existing studies provide evidence that education explains cross-country variations in the fertility transition through its positive impact on earnings that reinforces the substitution effect over the income effect (Galor and Weil, Reference Galor and Weil2000; Iyigun, Reference Iyigun2000; Bleakley and Lange, Reference Bleakley and Lange2009; Becker et al., Reference Becker, Cinnirella and Woessmann2010; Galindev, Reference Galindev2011; Vogl, Reference Vogl2016; Fernihough, Reference Fernihough2017; Bucci and Prettner, Reference Bucci and Prettner2020). De La Croix and Doepke (Reference De la Croix and Doepke2004) also show the interdependence between fertility and education decisions. Particularly, female education is found to be a stronger determinant of fertility than male education (Breierova and Duflo, Reference Breierova and Duflo2004; Osili and Long, Reference Osili and Long2008). There are various other determinants of fertility proposed in the literature, including mortality [e.g., Kalemli-Ozcan, Reference Kalemli-Ozcan2003; Doepke, Reference Doepke2005], old-age security hypothesis (Boldrin and Jones, Reference Boldrin and Jones2002), religion (Becker et al., Reference Becker, Cinnirella and Woessmann2010), migration (Berman and Rzakhanov, Reference Berman and Rzakhanov2020), population control policies [e.g., De Silva and Tenreyro (Reference De Silva and Tenreyro2020)], childcare costs and social externalities (Bar et al., Reference Bar, Hazan, Leukhina, Weiss and Zoabi2018; Dzhumashev and Hailemariam, Reference Dzhumashev and Tursunalieva2022).
In sum, there is mixed evidence in the literature on the effect of income on fertility. One potential reason is that these studies estimate the average effect of national income on the conditional mean of fertility. However, economic theories suggest a differential impact of income at a different spectrum of fertility distribution (Becker et al., Reference Becker, Murphy and Tamura1990; Adams, Reference Adams2015). This paper aims to fill this gap in the literature using an IV-GQR technique which provides a rich characterization of the distribution of the outcome variable while allowing for endogeneity.
3. Empirical strategy and data
3.1. Empirical strategy
To identify the causal effect of national per capita income on fertility, we employ an IV-GQR estimation technique proposed by Powell (Reference Powell2020). The IV-GQR estimation method has several appealing features. First, it allows for simultaneity with nonadditive fixed effects that can be a function of unobserved and observed factors. Second, it is more robust to non-normal errors and outliers, unlike ordinary least squares (OLS) estimators that can be inefficient if the errors are non-normal. Third, quantile regression provides a richer characterization of the data, enabling us to examine the effect of national income on the entire distribution of fertility and it is invariant to monotonic transformations. Fourth, quantile regression accounts for unobserved heterogeneity of covariates so that estimates are robust to parameter heterogeneity (Koenker, Reference Koenker2004).
In line with economic theory, IV-GQR is an appropriate approach for modeling the causal effect of income on differential fertility as income has heterogeneous effects at different points of the conditional distribution of fertility. The GQR approach in a panel data framework is appealing as it captures within group variations using nonadditive fixed effects. Unlike most quantile panel data estimators that include additive fixed effects, which separates the disturbance term by imposing an assumption that the parameters vary based only on the time-varying components of the disturbance term, the IV-GQR approach includes nonadditive fixed effects that preserve the interpretation of the parameters and facilitate the with-in group variations. More importantly, the nonadditive fixed effects provide the benefits of estimating unconditional quantile treatment effects while accounting for individual-specific heterogeneity (Powell, Reference Powell2020).
To provide a brief description of the IV-GQR method, we begin with the underlying model given by:

where F is the log of total fertility, Y is the log of national income per capita, and X is a vector of control variables. For some function λ y(.), U y ~ U(0, 1) is the unobserved structural error in the IV-GQR framework. The dependent variable (fertility) is a function of the endogenous variables Y, the covariates X, and the unobserved structural error U. q(Y, τ) is increasing in τ and U y*|X, Z ~ U y*|X for all y, where Z is the instrumental variable for income which is international oil price shock and τ is the τth quantile of the conditional distribution of F. The use of quantile individual effects allows for the presence of individual factors that are correlated with the independent variables. Quantile individual effects are, thus, best characterized as a hybrid between fixed and random effects, allowing for a more flexible specification of econometric models.
The moment conditions for the IV-GQR are given by:


δ(τ) can be estimated in a maximum likelihood framework as follows:

The estimation strategy in (4) allows us to estimate δ(b, τ) for different values of b, where b(τ) is an estimate of β(τ). Estimating b at different quantiles of the conditional distribution of fertility provides a capability to investigate how national income impacts the location, scale, and shape of the distribution of fertility.
3.2. Data
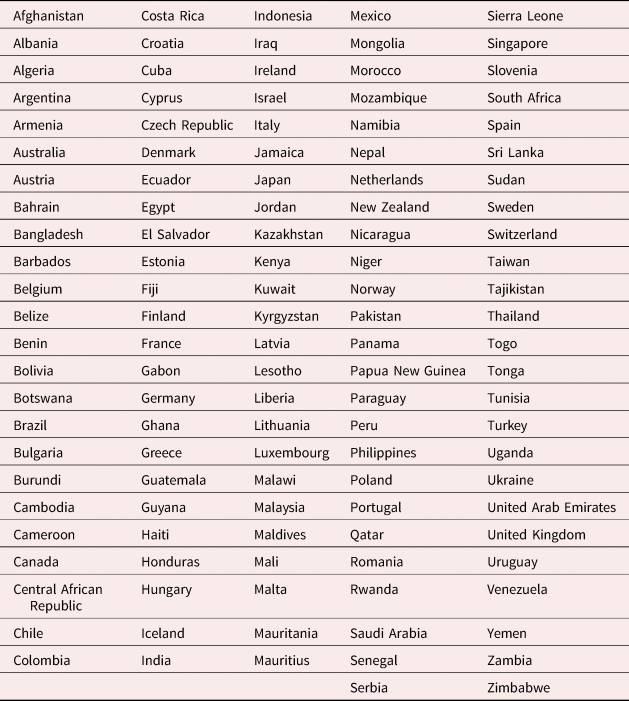
The study uses panel data of 122 developing and developed countries (see Table 7 in Appendix A for the list of countries) for the period 1965–2020 in 5-year non-overlapping intervals. Data for total fertility rate (births per woman), under-5 mortality rate (per 1,000 live births), real GDP per capita (constant 2010 US$), population density (people per sq. km of land area), urbanization (% of total), female labor force participation, share of agricultural and industry value added are obtained from World Development Indicators. Data on Christianity and Islam (% adherents) are from the quality of governance indicators database. Data on international oil price shocks (OPS) is from Brückner et al. (Reference Brückner, Ciccone and Tesei2012) constructed as $OPS_{it} = \Delta \ln ( OilPrice) _t \ast \theta _i$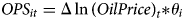 , where θ i is the share of net oil exports in GDP. To account for the larger effect of changes in international oil price shock on countries that are highly dependent on oil exports (imports), the instrument variable is constructed by weighting the oil price by the time-invariant share of net oil exports in GDP (θ i). Data on female education, measured by average educational attainment in years for female population aged above 15 years and over, are obtained from Barro and Lee database (http://www.barrolee.com/data/yrsch.htm). Following De La Croix and Gobbi (Reference De la Croix and Gobbi2017) we included female education in level and squared term in our control variables. Breierova and Duflo (Reference Breierova and Duflo2004) also show that female education is a more important determinant of fertility than male education.
Table 1 presents descriptive statistics of the data. The table shows that there are considerable variations in the values of the key variables across countries. The sample average fertility rate is approximately four births per woman with a standard deviation of two births per woman. The mean value of crude birth rate is about 28 per 1,000 people with a standard deviation of 13, while national per capita income ranges from $ 169 to $ 116, 233 with a mean value of $ 11, 957.
Summary statistics

4. Results and discussion
We begin our empirical analysis with an examination of the simple correlation between fertility and national per capita income. Figure 1 presents the correlation between average fertility and national per capita income. The figure shows a negative and nonlinear correlation between fertility and income. Specifically, the gradient becomes more and more flatter at lower fertility and higher per capita income levels. Developing countries, particularly the sub-Saharan countries and the Caribbeans have high fertility and low per capita income whereas advanced economies have very high per capita income and lower fertility. These observations, however, pertain to raw cross-country correlations. We report our main IV-GQR estimation results in Table 4 as a step to a more rigorous causality analysis following a benchmark estimation for the purpose of comparison.
Average GDP per capita and fertility rate: cross-country scatter plot.

4.1. Benchmark results
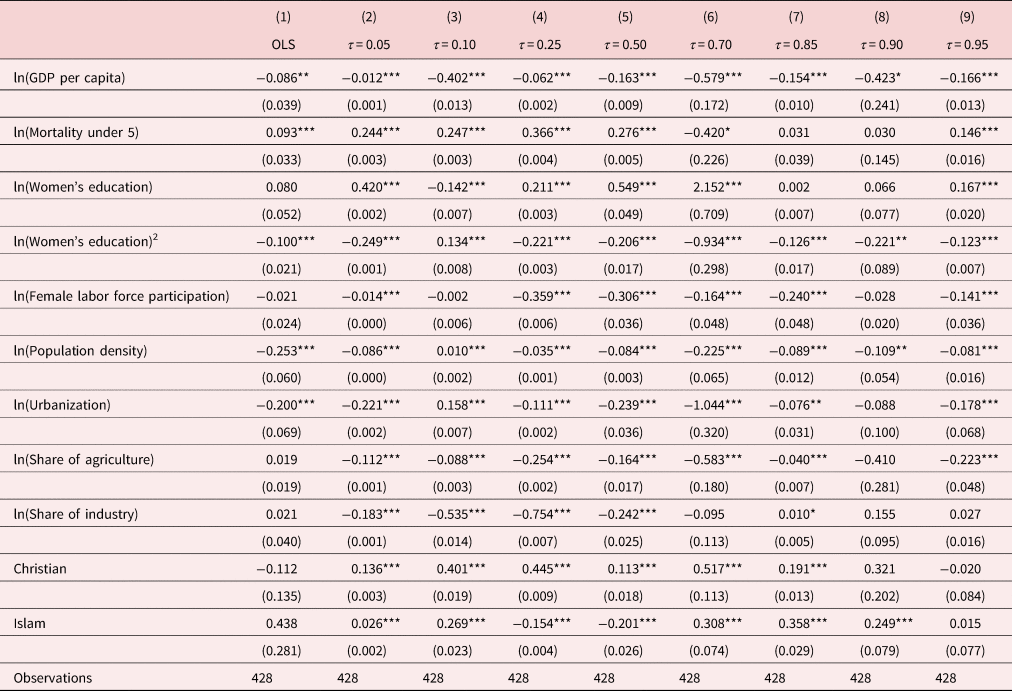
Table 2 presents the benchmark estimates of OLS and basic quantile regressions for the purpose of comparison with our main IV-GQR results in Table 4. The OLS estimates are reported in column (1) and the quantile regression estimates for the 0.05, 0.10, 0.25, 0.50, 0.70, 0.85, 0.90, and 0.95 quantiles (τ) are reported in columns (2)–(9), respectively. The estimated coefficient of per capita income is mostly negative and statistically indistinguishable from zero due to endogeneity bias. Although the basic quantile regression is useful in accounting for unobserved heterogeneity, it does not address the endogeneity bias. For this reason, the estimates from the basic quantile regression in Table 2 do not show improvements compared to the OLS estimates.
Benchmark results

Notes: The dependent variable is the log of fertility. Robust standard errors in parentheses. ***p < 0.01, **p < 0.05, *p < 0.1.
Most of the other covariates have statistically significant coefficients with expected signs. Under-5 infant mortality has a strong positive effect on the total fertility rate under all specifications. Specifically, a 1% increase in mortality is associated with approximately 0.2% to 0.4% increase in fertility rate. Female labor force participation and population density have a strong negative effect on the total fertility rate supporting the findings of De La Croix and Gobbi (Reference De la Croix and Gobbi2017).
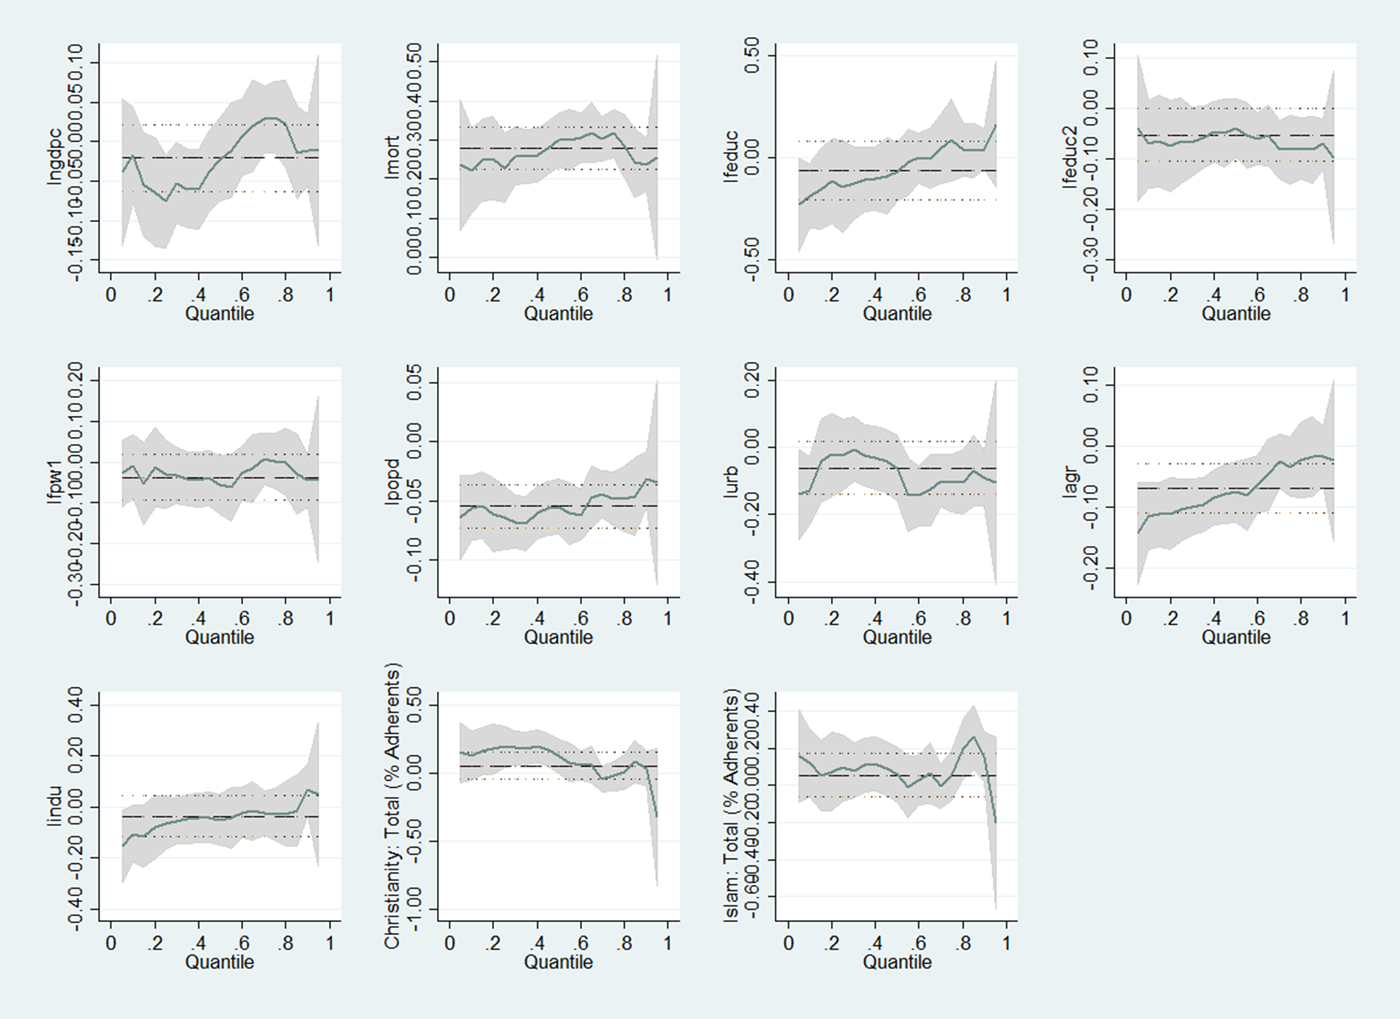
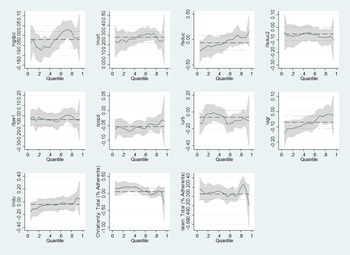
Figure 2 provides the visualization of the estimates from the OLS and basic quantile regressions, ignoring the issue of endogeneity. As shown in the figure, the 95% confidence interval of the OLS estimates incorporates the quantile point estimate in almost all cases. Only some of the quantile regression estimates for the covariates lie at some point outside the confidence intervals of the OLS estimates. This suggests that without addressing the issue of endogeneity using appropriate identification strategy, the basic quantile regression approach does not yield much improvement over the OLS method. Therefore, our identification strategy relies on an IV-GQR approach where national income is instrumented by international oil price shocks.
Quantile regression and OLS coefficients and confidence intervals for each independent variable as τ varies from 0 to 1.
4.2. Instrumental variable estimates
Economic theory suggests that fertility and income are jointly determined [see e.g., Browning, Reference Browning1992]. The most common mechanism for reverse causality from fertility to income is that high population growth leads to dilution of capital stock, which in turn leads to lower income per capita (Doepke, Reference Doepke2004). Changes in fertility could also have an effect on GDP growth through several mechanisms. For example, smaller birth cohorts, initially reduce youth dependency ratios and increase output per capita while the eventual increase in old-age dependency ratios could decrease output per capita for those economies further along with the demographic transition. Due to this endogeneity issue, OLS and the basic quantile regression estimations cannot pin down the causal relationship between the two variables. To identify the causal effects of national income on fertility, we employ the IV-GQR approach where income is instrumented by changes in international oil price shocks interacted with average net oil exports as a share of GDP. Our IV-GQR approach captures not only the exogenous variations of income within countries but also exploits the variations in GDP per capita across countries. This is because exogenous variations in terms of trade cause significant variations in countries’ GDP per capita and the effect that international oil price shock has on GDP per capita differs across countries according to their position as a net oil importer or exporter.
The exclusion restriction in our IV-GQR estimation is that oil price shocks only affect fertility through their effect on national per capita income. Since we have only one instrument, the equation is exactly identified and hence we are not able to find post-estimation tests of over-identification restrictions. However, we document alternative robustness checks that confirm our results are insensitive to changes in our specifications that suggests the validity of the instrument. Oil price shock as an instrument for national income has been used in other notable studies [see e.g., Brückner et al., Reference Brückner, Ciccone and Tesei2012; Acemoglu et al., Reference Acemoglu, Finkelstein and Notowidigdo2013; Brückner and Schwandt, Reference Brückner and Schwandt2013]. In terms of the relevance of the instrument, the first-stage results in Table 3 show that oil price shocks have a negative significant effect on national per capita income. The F-statistics is well above 10 indicating the relevance of the instrument.
First-stage results

Notes: The dependent variable is the log of real GDP per capita. The specification includes year and country fixed effects. Robust standard errors in parentheses. ***p < 0.01.
The IV-GQR estimates are reported in Table 4. As shown in Table 4, the estimated coefficient of GDP per capita is negative and statistically significant in all regressions except for column (7). Comparing with the benchmark results, the IV-GQR estimates reflect the severity of the endogeneity bias in the benchmark estimates that arises from the joint determination of income and fertility if one fails to account for it. To facilitate comparison, the OLS estimate is reproduced in column (1) of Table 4. Clearly, results in Table 4 show that the OLS estimates are not sufficient to capture the nature of the relationship between income and fertility. Our IV-GQR results show that national per capita income has a heterogenous effect on the distribution of total fertility rate. Specifically, our estimates reveal that a 1% increase in national per capita income leads to a reduction in fertility by about 0.02% to 0.2% over a 5-year period in countries where the fertility rate is below the 25th percentile (τ < 0.25). Interestingly, for the fertility distribution above the median (τ > 0.5) income elasticity of fertility is decreasing along the distribution of fertility. Overall, the IV-GQR estimates exhibit considerable heterogeneity in the negative income elasticity of fertility, ranging from 0.005 at τ = 0.95 to a maximum value of 0.494 at the median. More generally, we find that the gradient of national income on fertility is decreasing across quantiles of fertility above the median value.
Instrumental variable generalized quantile estimations results

Notes: The dependent variable is log of total fertility. Robust standard errors in parentheses. ***p < 0.01, **p < 0.05, *p < 0.1.
The effect of female education on fertility is non-linear. That is women's education may increase fertility initially but decreases it at a higher level of education. Similar to the findings of De La Croix and Gobbi (Reference De la Croix and Gobbi2017), our results show that population density has a strong negative effect on fertility. Furthermore, religiosity is positively associated with the total fertility rate while urbanization is negatively associated with fertility as expected.
The negative effect of income is generally decreasing with the quantile index of fertility suggesting that in high fertility countries such as sub-Saharan countries income has a relatively smaller impact on fertility. That is, in the upper tail of the fertility distributions, the IV-GQR estimates suggest a moderate negative and significant effect of national income on fertility. To sum up, the IV-GQR estimates exhibit considerable heterogeneity in the coefficients of income. Our findings suggest that models based on conditional mean regressions may not be able to capture the full distributional effect of national income on fertility.
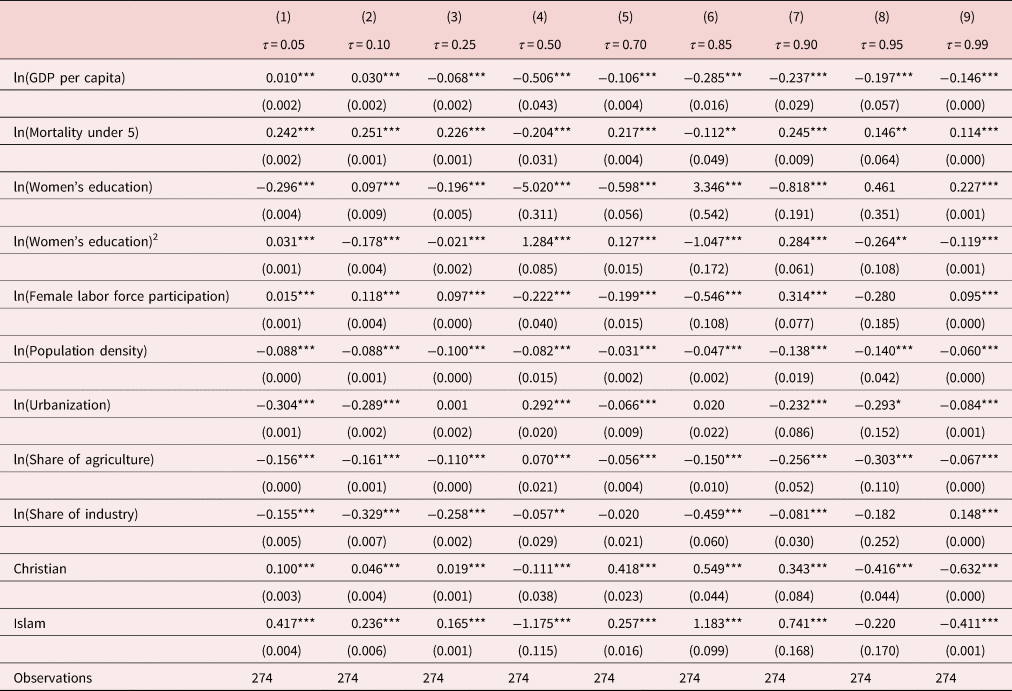
To check for the robustness of our main results, we use crude birth rate as the dependent variable instead of the total fertility rate. As shown in Table 5, the effect of income on crude birth rate is generally negative and statistically significant at conventional significance levels. The estimates vary considerably across the distribution of the total fertility.Footnote 1 The results confirm the robustness of the main findings. Our estimates over much of the distribution of fertility support the findings of the strand of literature that document a negative relationship between income and fertility [e.g., Jones and Tertilt, Reference Jones and Tertilt2008].
Robustness results using crude birth rate
Notes: The dependent variable is the log of crude birth rate. Robust standard errors in parentheses. ***p < 0.01, **p < 0.05, *p < 0.1.
In Table 6, we perform alternative estimations using the sub-sample that excludes net-oil exporters. The results show that per capita national income has a positive effect on fertility at the lower tail of the fertility distribution (τ ≤ 0.10) and negative thereafter. This result is in line with an emerging literature that suggests some developed countries are undergoing a new phase of demographic change known as the “fertility rebound” (Myrskylä et al., Reference Myrskylä, Kohler and Billari2009; Luci-Greulich and Thévenon, Reference Luci-Greulich and Thévenon2013, Reference Luci-Greulich and Thévenon2014; Yakita, Reference Yakita2018; Dzhumashev and Hailemariam, Reference Dzhumashev and Tursunalieva2022). That is, it appears that there is a new process of demographic change and economic development where the declining trend in fertility is reversed in advanced economies with a high level of per capita income and low level of fertility rate. The plausible mechanism is that at a very high level of per capita income and very low fertility below the replacement rate, families are not constrained by the quantity–quality trade-offs. At this phase of the demographic transition, per capita income is high enough so that the fertility rate increases where parents are not constrained by resources limitations to needed for investment in their children's education.
IV-GQR estimates for a subsample excluding net oil exporters
Notes: The dependent variable is log of total fertility. Robust standard errors in parentheses. ***p < 0.01, **p < 0.05.
Several other recent studies show that there is a positive relationship between income and fertility [e.g., Lovenheim and Mumford, Reference Lovenheim and Mumford2013; Kearney and Wilson, Reference Kearney and Wilson2018; Gallego and Lafortune, Reference Gallego and Lafortune2021]. Chung and Lee (Reference Chung and Lee2021) find that an increase in women's income is associated with higher probability of childbirth for South Korea. The positive effect is stronger in the top quartile of income which is strengthened by the work–family balance policy. Our results differ from Chung and Lee (Reference Chung and Lee2021) in that we find a positive effect of income on fertility at the lower distribution of fertility for net oil importers. d'Albis et al. (Reference d'Albis, Gobbi and Greulich2017) find that, in European countries with minimal or absence of child care services, there is a U-shaped relationship between the probability of having a second child and the woman's potential wage, whereas in countries with easy access to childcare, the probability of having a second child is positively related to the woman's potential wage. Our results lend support to the findings of d'Albis et al. (Reference d'Albis, Gobbi and Greulich2017) in that in countries with lower fertility rates, a positive income shock increases childbirth. Kearney and Wilson (Reference Kearney and Wilson2018) exploit the positive economic shock associated with fracking in the 2000s to study the effect of an increase in the potential earnings of men on nonmarital births. They find that the positive economic shock associated with fracking boom and the resulting increased wages for non-college-educated men caused an increase in both marital and nonmarital birth rates. Along these lines, Alam and Pörtner (Reference Alam and Pörtner2018) also find that a negative income shock in developing countries lowers the likelihood of pregnancy and child birth. Similarly, Lindo (Reference Lindo2010) examines the causal effect of income shocks on fertility exploiting the large and permanent income shock generated by a husband's job displacement and women's fertility response. The finding shows that the negative income shock reduces total fertility, suggesting a positive relationship between income and fertility. Our results compliment these studies by providing a richer characterization of our data that underpins the complex relationship between income and fertility, which cannot be captured by the average relationship.
There are some potential mechanisms such as institutional differences across countries and generous government policies that lower the cost of raising children in advanced economies that drive our results. For example, in most advanced economies countries education has been publicly provided at little or no cost to parents and strict child labor-laws ensure a low opportunity cost of children's time [see Doepke, Reference Doepke2015]. In addition, some countries provide long-term support to parents, such as payments in cash or in-kind, provision of free or subsidized childcare services that help to increase women's labor force participation [see e.g., d'Albis et al., Reference d'Albis, Gobbi and Greulich2017; Chung and Lee, Reference Chung and Lee2021]. In such settings with high per capita income, the low cost of having an additional child leads to an increase in fertility. In contrast, developing countries have financial and infrastructure constraints to provide high-quality public education or childcare services and they have weak or inexistent child-labor laws. Therefore, the opportunity cost of education and children's time is high in developing countries, implying that the quantity–quality trade-off to be an important framework in governing the negative relationship between income and fertility at higher quantiles of the fertility distribution.
5. Conclusion
The relationship between national income and fertility has occupied a central place in the demographic transition and economic development literature. Existing empirical studies that summarize the average relationship between the two variables provide mixed evidence. None of these studies have examined the effect of national income on the whole distribution of fertility. In this paper, we reassess the causal effect of national per capita income on the whole spectrum of fertility distribution using international oil price shocks as an instrument for income and employing recently innovated IV-GQR method.
Using data for a panel of 122 countries over the period 1965–2020, our IV-GQR estimates show that national income has a nonlinear effect on fertility rates. The preponderance of the evidence from our analysis show that national per capita income has a significant negative effect on fertility over much of quantiles of the distribution of fertility. The magnitude of the estimated gradient declines along the fertility distribution above the median. However, the relationship between income and fertility is positive and significant at the lower tail of the fertility distribution when we exclude net oil exporting countries that characterizes the situation of some advanced economies. Our results indicate that the relationship between fertility and national income is nonlinear, suggesting that models based on conditional mean regressions may not capture a complete picture of the effect of income on fertility. A higher level of women education has a strong negative effect on fertility suggesting reforms in education policies in developing countries can help reducing fertility by promoting quality over quantity of children.
Our findings are largely in line with the findings of recent studies that document a negative relationship between income and fertility rate [see e.g., Jones and Tertilt, Reference Jones and Tertilt2008; Herzer et al., Reference Herzer, Strulik and Vollmer2012]. Our findings on the negative relationship between income and fertility lend support to the quantity–quality theory of fertility that suggests the trade-off between quantity and quality of children and consistent with unified growth models [see Galor and Weil, Reference Galor and Weil2000; Galor and Moav, Reference Galor and Moav2002]. Another important mechanism that may drive the negative relationship between income and fertility is the higher opportunity cost of parental time in raising children for individuals with higher earnings. That is, the demand for children is likely to be lower for higher wage earners since children are more expensive for parents in terms of time forgone that could be spent in the labor market. The time-intensive nature of raising children increases the relative shadow price of children, leading to a stronger substitution effect that reduces the fertility rate. This also explains the stronger effect of income on fertility on the lower distribution of fertility. The positive relationship between income and fertility at the lower level of fertility supports the recently emerging literature on fertility rebound (Myrskylä et al., Reference Myrskylä, Kohler and Billari2009; Luci-Greulich and Thévenon, Reference Luci-Greulich and Thévenon2014).
Our empirical results are of substantial public policy interest. From a policy perspective, predicting the effect of income on fertility on the upper tail of the fertility distribution will likely be of more interest for public policy than the effect of income on the mean of the fertility distribution. Particularly, our findings suggest that the increase in income in developing countries may not be sufficient to achieve the desired reduction in fertility to facilitate the demographic transition. Policies promoting access to women's education coupled with reproductive health and family planning services might be effective at reducing fertility in developing countries. On the other hand, our results on the tendency for fertility rebound in advanced economies that give rise to a positive relationship between national per capita income and fertility have important policy implications from a different perspective. The fertility rebound may alleviate the repercussions of increased life expectancy and population aging in advanced economies that imply the need for designing appropriate policy responses, such as social security reform and immigration policies. These findings have implications for international bodies such as the World Bank which may be looking to sponsor population policies.
Conflict of interest
The author declares none.
Appendix A
List of countries in the sample


 Open access