


Introduction
Concerns about the upward trend in university grades have been voiced by academia and industry. The questions raised include “Are students better prepared or are higher grades being granted easier?” History of concerns about grade increases dates back to at least 1894, when the “Report of the Committee on Raising the Standard, Harvard University, 1894” (as cited in Kohn, Reference Kohn2002, p. 1) stated students are sometimes receiving A and B grades too readily. This upward trend is often noted as grade inflation; however, not all grade increases should be labeled inflation. Of the multiple definitions of grade inflation (Schutz et al., Reference Schutz, Drake, Lessner and Hughes2015), the definition adopted here is the one used by Reference Kostal, Kuncel and SackettKostal, Kuncel, and Sackett (2016, p. 13) which states “… increases in grades across time that do not reflect changes in the quality of students’ work (cf. Bejar and Blew, Reference Bejar and Blew1981).” The key component of this definition is not reflecting “changes in quality of student work.”
Grade inflation raises concerns about the credibility of academia’s standards of excellence and accountability through the lowering of academic standards (Kolevzon, Reference Kolevzon1981). Lowering of standards through grade inflation raises the additional concern that grades are losing their ability to differentiate students’ work (Kamber and Biggs, Reference Kamber and Biggs2004; Pattison, Grodsky, and Muller, Reference Pattison, Grodsky and Muller2013; Peace, Reference Peace2017). This inability to differentiate students’ work arises because grades have a ceiling, and one cannot give students a grade higher than the university’s highest grade (Kamber and Biggs, Reference Kamber and Biggs2004). Studies indicate grade inflation is not only a concern in the U.S. (Marini et al., Reference Marini, Shaw, Young and Ewing2018; Baird, Carter, and Roos, Reference Baird, Carter and Roos2019), but there is interest in the phenomenon internationally (Bachan, Reference Bachan2018).
Multiple forces have come together to produce grade inflation. Schutz et al. (Reference Schutz, Drake, Lessner and Hughes2015) list 27 reasons for grade inflation that have been proposed in the literature. Within these forces, one finds evidence that instructor, university, and student characteristics may lead to grade inflation (Peace, Reference Peace2017). Universities competing for reputation, competition for students, and increasing tuition and costs may lead universities to permit grade inflation to positively influence their reputation and justify tuition increases (Jewell, McPherson, and Tieslau, Reference Jewell, McPherson and Tieslau2013). Instructors may inflate grades for reasons such as favorably biasing the student evaluations, pressure from their system to maintain student satisfaction, and job security (Eiszler, Reference Eiszler2002; Kezim, Pariseau, and Quinn, Reference Kezim, Pariseau and Quinn2005; Jaschik, Reference Jaschik2008; Peace, Reference Peace2017). Students place pressure on the system for high GPAs because of financial aid considerations and job placement. The notion that with increased tuition comes the right for high grades may also lead to grade inflation (Peace, Reference Peace2017). Studies such as Boretz (Reference Boretz2004) contradict these consumerism conclusions, suggesting students would rather earn higher grades. She notes the widespread acceptance of grade inflation is potentially damaging to universities. Although grades maybe at an all-time high, Boretz (Reference Boretz2004) argues faculty development programs and increases in study support services have led to the increases. Along these lines, Jephcote, Medland, and Lygo-Baker (Reference Jephcote, Medland and Lygo-Baker2021) argue unexplained increases in grade should not automatically be viewed as grade inflation. Blindly labeling increases as grade inflation is damaging to higher education. Rather one should see opportunities to investigate the institutional context the grades are occurring.
Grade inflation is an empirical issue; factors, however, can give raise to higher grades that are not attributed to grade inflation as defined above. A positive shift in grade distribution that is caused by increases in achievement or learning is grade improvement, not grade inflation (Mostrom and Blumberg, Reference Mostrom and Blumberg2012). Changing demographics and ability of students, increased student support services, improved instruction, and faculty development programs are some factors that can lead to grade improvement (Kuh and Hu, Reference Kuh and Hu1999; Boretz, Reference Boretz2004; Mostrom and Blumberg, Reference Mostrom and Blumberg2012). Further, Boretz (Reference Boretz2004) and Watjatrakul (Reference Watjatrakul2014) suggest that the move toward consumerism in higher education increases the quality of education through supporting student learning thus leading to higher grades. The idea of grade improvement was further developed by Flynn (Reference Flynn1987), who came up with the phenomena known as “The Flynn Effect.” In his work, the results of IQ tests in schools are increasing on average approximately three points per decade. This finding is supported by Trahan et al. (Reference Trahan, Stuebing, Hicock and Fletcher2014); meta-analysis that finds grades for standardized tests is increasing, which may be attributed to an increase in the population’s intelligence quotient.
The current study uses a unique data set of university, instructor, and student-specific characteristics to examine grades in the College of Agriculture and Life Sciences (COALS) at Texas A&M University (TAMU) from 1985 to 2019. Specifically, three interrelated objectives are to examine: 1) has grade inflation occurred, 2) has the distribution of grades as measured by the standard deviation changed; and 3) how various factors influence class mean GPA and grade distributions.
This study’s contributions include the use of a detailed data set to identify the effect of specific variables. Further, this study explicitly examines a college of agriculture at the class level instead of department- or university-level GPAs. No previous study was found with this explicit, detailed focus at a class level. COALS is one of the largest colleges of agriculture, awarding the most degrees in agriculture in the U.S. (DATAUSA, 2020) in 2019, approximately 3.5% of the degrees awarded nationally. Further, being a land grant university, COALS missions are similar to other land grant universities.
Literature Review
Given the importance of student success to both the student and university, it is not surprising the number of theories and factors proposed to explain student success. Kuh et al. (Reference Kuh, Kinzie, Buckley, Bridges and Hayek2006, p. 9) note “… no single view is comprehensive enough to account for the complicated set of factors that interact to influence student and institutional performance …” Student performance and grades are generally explained by the school climate including instructor characteristics and student preparedness and motivations (Kuh et al., Reference Kuh, Kinzie, Buckley, Bridges and Hayek2006; Wang and Degol, Reference Wang and Degol2016). Two good reviews are Wang and Degol (Reference Wang and Degol2016) at the pre-university level which provides a comprehensive conceptualization including many factors also relevant at the university level and Kuh et al. (Reference Kuh, Kinzie, Buckley, Bridges and Hayek2006) which reviews university level studies with emphasis on student preparedness and behaviors.
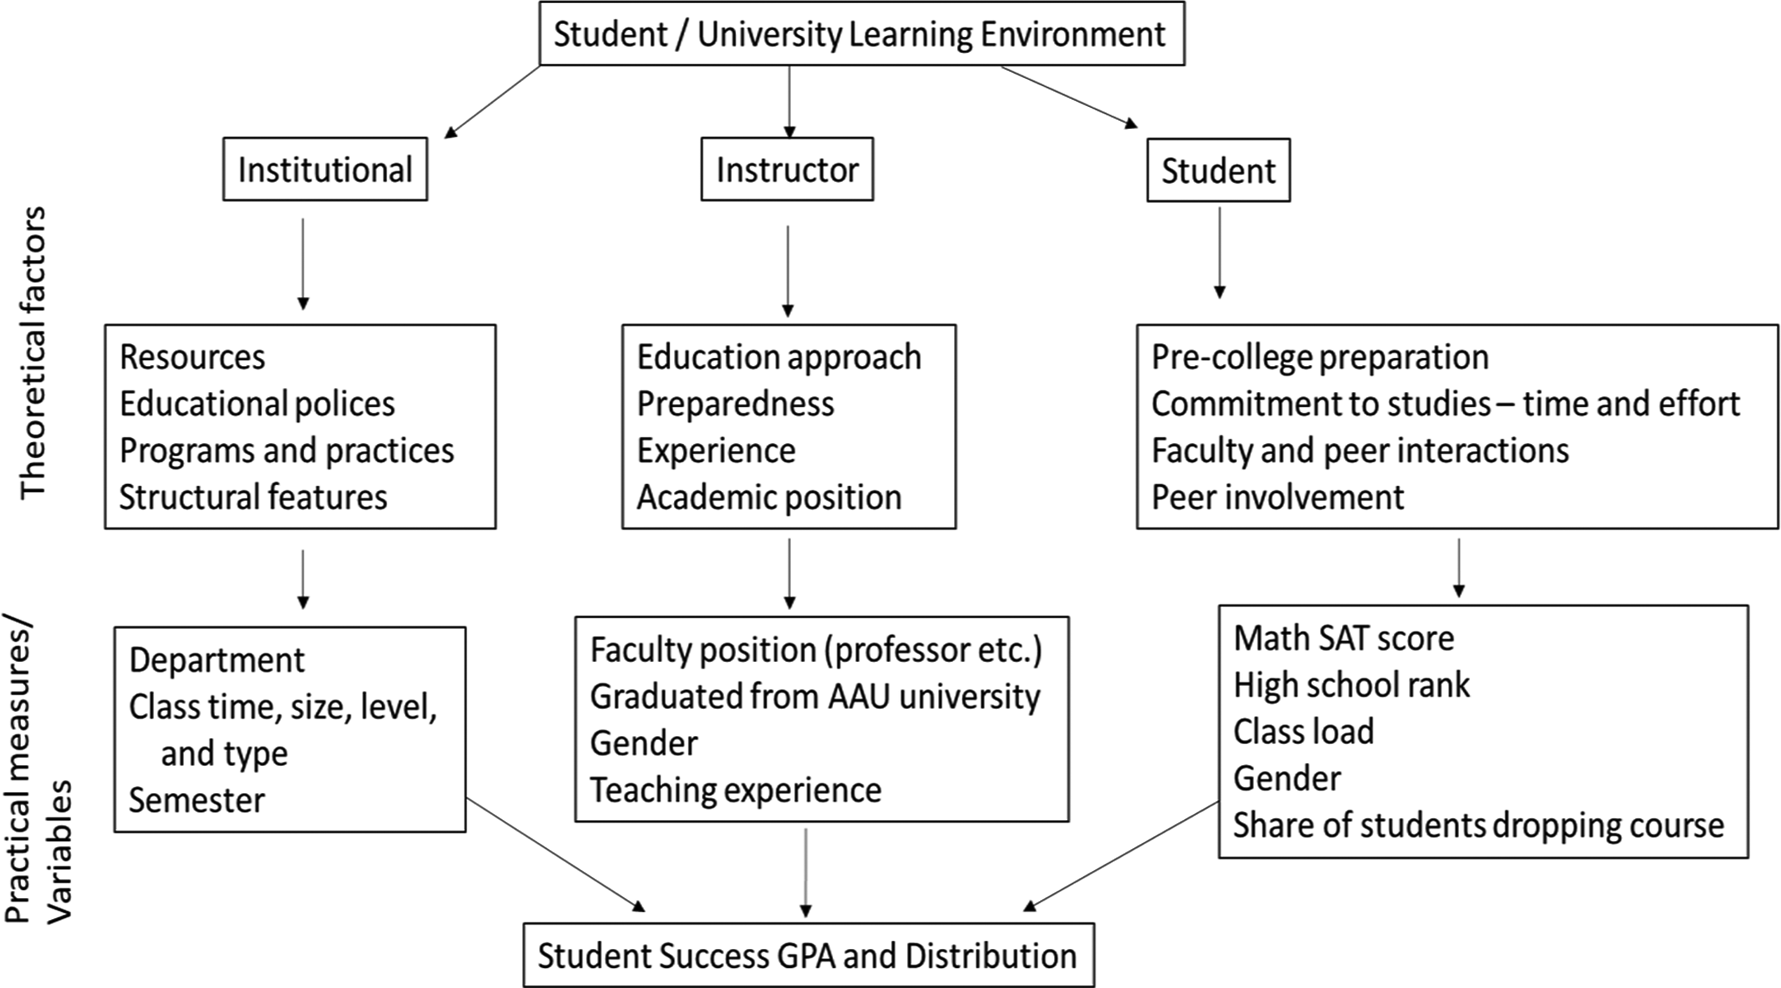
Based on previous research, factors influencing grades are categorized into three groups: institutional, instructor specific, and student characteristics. Institutional factors under university, college, or departmental control include educational polices and curricula, resources devoted to teaching, and structural features ranging from quality of the classroom to class features. Instructor’s factors include the experience and ability of instructors to convey information to students along with incentives associated with their position. Kuh et al. (Reference Kuh, Kinzie, Buckley, Bridges and Hayek2006) note theories of student success in college emphasize the importance of academic preparedness and experiences during college. Variables for these student characteristics, however, are difficult to measure or obtain especially over time. Proxies are commonly used. Further, to help account for institutional and instructor-specific characteristics, three-stage hierarchical models with two entity-specific levels are estimated (one model is developed for class mean GPA and the other for class GPA standard deviation). The two levels are department and instructor. Previous studies have also used fixed effects models to control for unobservable effects (Kokkelenberg, Dillon, and Christy, Reference Kokkelenberg, Dillon and Christy2008; Beenstock and Feldman, Reference Beenstock and Feldman2016; Hernández-Julián and Looney, Reference Hernández-Julián and Looney2016). No study was found that explicitly considered only the college of agriculture with the level of detail in the current study.
Grade Inflation and Distributional Changes
Juola (Reference Juola1979) shows grade increases of approximately 0.4 grade points using data from 1965–1973 with the largest increases occurring in between 1968 and 1970. Studies using data from the 1970s and early 80s show either a decrease or only a small increase in GPA (Juola, Reference Juola1979; Bejar and Blew, Reference Bejar and Blew1981; Adelman, Reference Adelman2004). Later studies suggest grade inflation renewed in the late 1980s (Kuh and Hu, Reference Kuh and Hu1999; Rojstaczer and Healy, Reference Rojstaczer and Healy2010; Kostal, Kuncel, and Sackett, Reference Kostal, Kuncel and Sackett2016). Grade inflation leads to changes in grade distributions.
Suslow (Reference Suslow1976) notes there has been a shift in grade distributions with a decrease in the proportion of C’s, D’s, and F’s and an increase the proportion of A’s and B’s. Rojstaczer and Healy (Reference Rojstaczer and Healy2012) suggest that since the early 1980s, the largest change in grade distribution is an increase in proportion of As with corresponding decrease in Bs and Cs. The proportion of Cs shows the largest decrease. Proportion of Ds and Fs also show a slight decrease. The decrease in Ds and Fs may be a function of increasing withdrawals from classes. Adelman (Reference Adelman2004), for example, mentions that an important issue in change in the distribution of grades is a doubling of the percent of withdrawal or noncredit between 1972 and 1992 cohorts. Jewell, McPherson, and Tieslau (Reference Jewell, McPherson and Tieslau2013) suggest grade inflation maybe nonlinear, they find trend, and trend squared variables are significant in explaining grades. In contrast, Kezim, Pariseau, and Quinn (Reference Kezim, Pariseau and Quinn2005) suggest a linear trend in grades over a 20-year period for a private college business school.
Not all studies, however, agree with these findings of grade inflation, suggesting grade inflation does not exist or is a non-issue (Adelman, Reference Adelman2008; Brighouse, Reference Brighouse2008; Pattison, Grodsky, and Muller, Reference Pattison, Grodsky and Muller2013). McAllister, Jiang, and Aghazadeh (Reference McAllister, Jiang and Aghazadeh2008), for example, show increasing grades in an engineering department match increasing achievement potential as measured by standardized test scores. Along these lines, Kostal, Kuncel, and Sackett (Reference Kostal, Kuncel and Sackett2016) note it is hard to indicate the extent of grade inflation, because of the many other factors that can contribute to raising grades; one must remove the influence of these factors to determine the severity of grade inflation. Kuh and Hu (Reference Kuh and Hu1999) explore grade increases after controlling for student characteristics, such as family educational background, academic achievements in high school, and socioeconomic status. They show grade increases net of these specific controls is slightly larger than without controls. Kostal, Kuncel, and Sackett (Reference Kostal, Kuncel and Sackett2016) results, however, show an opposite effect of including control factors. These studies suggest the need to control for institutional, instructor, and student factors when examining potential grade inflation.
Institutional Factors
Studies such as Diette and Raghav (Reference Diette and Raghav2015) and Hernández-Julián and Looney (Reference Hernández-Julián and Looney2016) use fixed effects models to show there are differences associated with students’ grades and their major. Danilowicz-Gösele et al. (Reference Danilowicz-Gösele, Lerche, Meya and Schwager2017) suggest one reason for differences in departments maybe student self-selection. Further, Diette and Raghav (Reference Diette and Raghav2015) and Hernández-Julián and Looney (Reference Hernández-Julián and Looney2016) discuss different departments have different grading norms that may be used to manage demand for courses and majors. Bond and Mumford (Reference Bond and Mumford2019) examine increase in grades across various colleges at Purdue University. Their results suggest differences exist between colleges. They show much of the increases in grades in the college of agriculture are driven by increasing student ability. Department/colleges characteristics and differences, however, are difficult to quantify. As such, to account for department-specific characteristics, departments are added as a level in the models.
Empirical studies and theoretical reviews find quantifiable variables under institutional control are important in student success (McElroy and Mosteller, Reference McElroy and Mosteller2006; Cuseo, Reference Cuseo2007; Kokkelenberg, Dillon, and Christy, Reference Kokkelenberg, Dillon and Christy2008; Henebry, Reference Henebry2010; Wang and Degol, Reference Wang and Degol2016). Cuseo (Reference Cuseo2007, p. 12) in his review on class size concludes
The research reviewed in this article indicates that large class size is a contextual variable that has generally adverse effects on student learning, mediated primarily by lowering students’ level of engagement (active involvement) with the course instructor, with classmates, and with the subject matter.
He goes on to state the only argument for large class size is fiscal. Class meeting times may also influence learning. McElroy and Mosteller (Reference McElroy and Mosteller2006) believe “optimal learning times” depends on the students’ circadian rhythm. Skinner (Reference Skinner1985) finds class mean GPAs are lower for morning classes compared to afternoon and evening classes. Henebry (Reference Henebry2010) finds students are more opt to pass a class that meets more than once a week. Skinner (Reference Skinner1985), however, finds an opposite effect on the number of class meeting times. He suggests better attendance in classes meeting only once a week may improve grades. Student performance differs for length of class and meeting times be it because of student circadian rhythms or instructor ability.
Instructor-Specific Factors
The importance of the instructor and instructional method in students’ learning is well documented (Kezim, Pariseau, and Quinn, Reference Kezim, Pariseau and Quinn2005; Kuh et al., Reference Kuh, Kinzie, Buckley, Bridges and Hayek2006; Joyce et al., Reference Joyce, Crockett, Jaeger, Altindag and O’Connell2014). Hoffmann and Oreopoulos (Reference Hoffmann and Oreopoulos2009 p. 491) note “Hard-to-measure instructor qualities may matter more in predicting achievement, even for instructors that exhibit the same age, salary, rank, and gender.” Given the importance and difficulty to measure these qualities especially for data going back to 1985, instructors are modeled as a level in the mixed effect models.
In addition to individual instructor effects, other quantifiable characteristics are shown in the literature to influence grades. Studies (Moore and Trahan, Reference Moore and Trahan1998; Ronco and Cahill, Reference Ronco and Cahill2004; Kezim, Pariseau, and Quinn, Reference Kezim, Pariseau and Quinn2005; Sonner, Reference Sonner2000) suggest grade inflation may be related to the increase in the use of non-tenure track faculty (term used loosely here as different studies used different terminology and length of contract). Kezim, Pariseau, and Quinn (Reference Kezim, Pariseau and Quinn2005) and Sonner (Reference Sonner2000) indicate the use of non-tenured faculty is a cause of grade inflation, whereas Figlio, Schapiro, and Soter (Reference Figlio, Schapiro and Soter2015) find students learn more from non-tenured faculty, which would not be grade inflation. On the other hand, Chen, Hansen, and Lowe (Reference Chen, Hansen and Lowe2021) state instructors hired on a temporary, part-time basis assign higher grades than full-time instructors without a discernable increase in learning. Hoffmann and Oreopoulos (Reference Hoffmann and Oreopoulos2009) and Solanki and Xu (Reference Solanki and Xu2018) find instructor gender plays a small but statistically significant role in student achievement. Both Hoffmann and Oreopoulos (Reference Hoffmann and Oreopoulos2009) and Solanki and Xu (Reference Solanki and Xu2018) indicate a same-sex instructor increases grade performance. Kapitanoff and Pandey (Reference Kapitanoff and Pandey2017) suggest at least for the first exam, females underperform at a higher rate than males if the instructor is also female. Stratton, Myers, and King (Reference Stratton, Myers and King1994) find as instructors’ experience measured as years teaching increases, grades also increase. In summary, both quantifiable and unquantifiable instructor characteristics have been shown to influence student’s performance.
Student Specific Factors
Kuh et al. (Reference Kuh, Kinzie, Buckley, Bridges and Hayek2006) review theoretical perspectives on student learning including sociological, organizational, psychological, cultural, and economic perspectives. They conclude the students “… wide path with twists, turns, detours, roundabouts, and occasional dead ends …” is more realistic than a direct route to student achievement (Kuh et al., Reference Kuh, Kinzie, Buckley, Bridges and Hayek2006, p. 7). In their framework, besides institutional factors, pre-college experiences and student behaviors or engagement also matter in student success. Pre-college experiences include enrollment choices, academic preparations, aptitude and college readiness, educational aspirations, family and peer support, motivation to learn, gender, race, ethnicity, and demographics. Of these experiences, Reference Kuh, Kinzie, Buckley, Bridges and HayekKuh et al. (2006, p. 31) conclude, “In fact, the best predictor of college grades is the combination of an individual student’s academic preparation, high school grades, aspirations, and motivation.” Kobrin et al. (Reference Kobrin, Patterson, Shaw, Mattern and Barbuti2008) and Westrick et al. (Reference Westrick, Le, Robbins, Radunzel and Schmidt2015) indicate the importance of pre-college preparation in explaining the first year success of college students. Rothstein (Reference Rothstein2004), however, finds that much of the SAT predictive power on grades is derived from SATs correlation with high school demographics. Studies also suggest changing demographics may lead to higher grades (Kuh and Hu, Reference Kuh and Hu1999; Kostal, Kuncel, and Sackett, Reference Kostal, Kuncel and Sackett2016). Kuh and Hu (Reference Kuh and Hu1999) suggest increased female enrollments in colleges may lead to higher grades because females tend to receive higher grades, while Bergtold, Yeager, and Griffin (Reference Bergtold, Yeager and Griffin2016) did not find any significant differences between performances of male and female students.
Although brief, this review shows the importance of controlling for factors that may influence grades, therefore, creating a better picture whether grade inflation is occurring. Further, it is not just the institution, instructor, or student factors that determines student success, but rather the interaction of all of these factors.
Data and Empirical Model
Data
Data for 14 departments (13 departments and one degree which is considered a separate department, but classes are taught by various departments) in COALS from Spring 1985 through Fall 2019 (the last pre-COVID-19 semester) are utilized giving 35 years of data, far more than many studies. The data starts in fall 1985 because this is the first semester grade data were available. The primary reason behind selecting COALS is access to the data. Another important factor is the wide range of diverse disciplines within COALS which ranges from basic science and technology to economics and agricultural communication. This wide spectrum of disciplines helps make the findings relevant to other universities. In addition, methods utilized are applicable to other universities. Data from the University are supplemented with information from undergraduate catalogs, faculty and department websites, e-mails to instructors, as well as discussions with staff and faculty in the various departments. Departments changing names and combining departments resulted in no data for Forestry and Rangeland Science Departments. A total of 17,696 usable observations are obtained. All data is at the class level. Grading scheme used by TAMU is a four-point scale based on receiving four points for an A, three for a B, two for a C, one for a D, and zero for an F (TAMU does not use grade modifiers of plus or minus). Class mean GPA is based on the number of students receiving each grade. Grade distribution is based on the standard deviation of the grades received in the class. Individual projects, study abroad, and internship classes are not included. These classes are eliminated because students tend to receive A’s or credit for completion in these classes. Distant learning or in-absentia classes are eliminated because they do not have a specific meeting time and number of classes per week, variables used in the model. Classes with variable credits are also eliminated. Further for privacy reasons, information for any classes of less than five students. are not available. Summer classes are also eliminated from the analysis, because most summer courses, especially early in the data set, fall into one of the categories of classes that are dropped. Further it is felt summer courses being shorter in length either five or 10 weeks instead of 14 or 15 weeks (changed over the data set) may not be directly comparable. Data from Texas A&M were given by sections. In some cases, classes in COALS might have different sections taught at the same time by the same instructor. Sections that were held at the same time and by the same professor were merged to reflect the fact that the sections meet as one class. The different sections are generally for accounting and reporting purposes and not a difference in the class delivery.
Student grade information is highly protected by students’ privacy rights laws. Because of this privacy, this research uses class level data rather than individual student data. Over the data period, changes occurred in the data reporting formats and requirements from year to year, specifically in student admissions information and information reported in university catalogs. As such, in many cases, department and administration leadership were contacted to understand data changes. Further, much of the faculty information was obtained by internet searches or contacting instructors directly. These sources of information were particularly used for early years and non-tenure track instructors.
Variable Descriptions and Summary Statistics
Based on the literature, a theoretical model of the three sets of factors influencing grades is presented in Figure 1. Institutional, instructor, and student factors come together to determine the class mean GPA and standard deviation. Empirical variables used as proxies for the theoretical model, their descriptions, and summary statistics are presented in Table 1 and Figure 1. Most of the variables are self-explanatory. Class averages for variables that are based on student information, such as SAT scores, are based on all students in the class that had such information reported. TAMU, COALS, and departments early in the data set did not require students to provide SAT scores or their rank in high school for admission to the University. As such, the class average may be based on less students than in the class, especially in the early years. To account for this non-reporting, a qualitative 0–1 variable for the years 1985–1988 is included with one indicating the years 1985–1988. This variable is then interacted with SAT and High School rank. Variables associated with Association of American Universities (AAU) and foreign universities are included as a proxy for potential differences in instructor background (not quality). AAU is comprised of some of the leading universities in the U.S. and Canada.
Institutional, instructor, and student variables that my affect a students’ grade.
Variable description and summary statistics
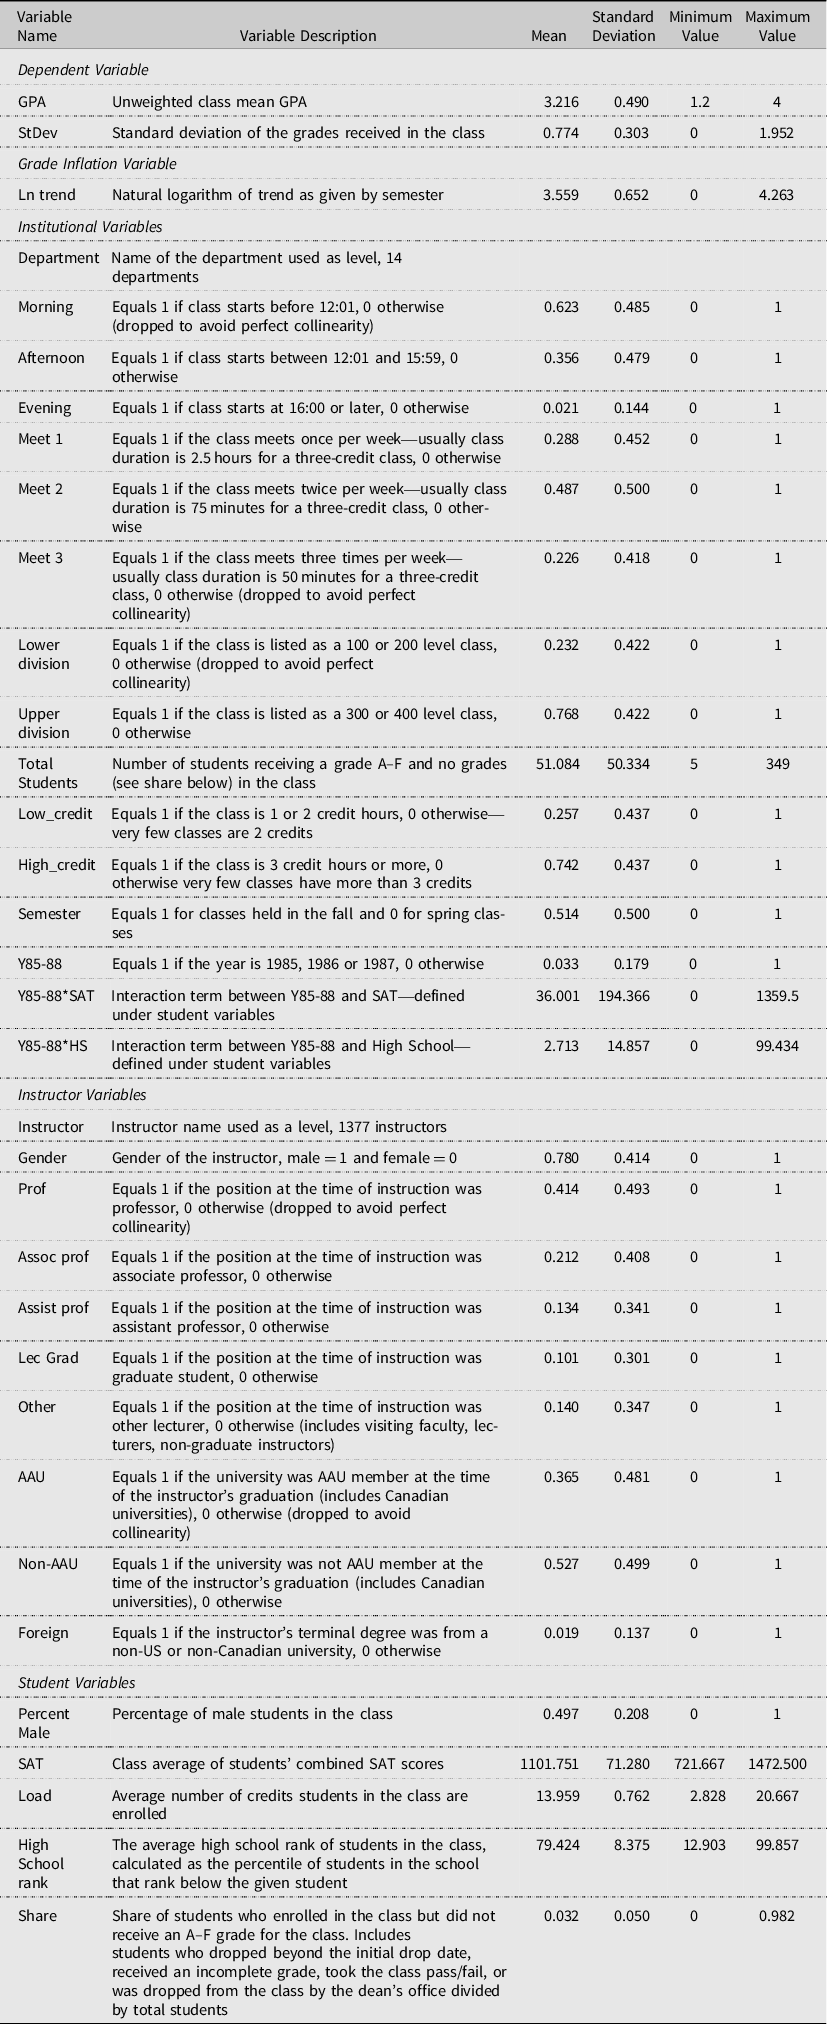
Qualitative variables’ (listed as 0–1 variables in Table 1) mean values can be interpreted as the share of class in the category. As to institutional variables, most classes meet either in the morning or afternoon, meet twice a week, and are upper division classes. Average class size is 51 students but ranges from five to 349 students. Approximately 78 percent of the instructors are male. Few instructors’ last degree is from a foreign institution. At the time of their graduation, slightly more instructors received their degree from non-AAU-affiliated institutions than from AAU-affiliated universities. Average percent of male students in class is slightly higher than females. SAT scores are somewhat above the national average (College Board, 2015). High school rank average is approximately the 79 percentile (or top 21% of the graduating class in the high school). Students took on average 14 credits per semester with only a small percentage of students dropping or receiving a no grade in a class.
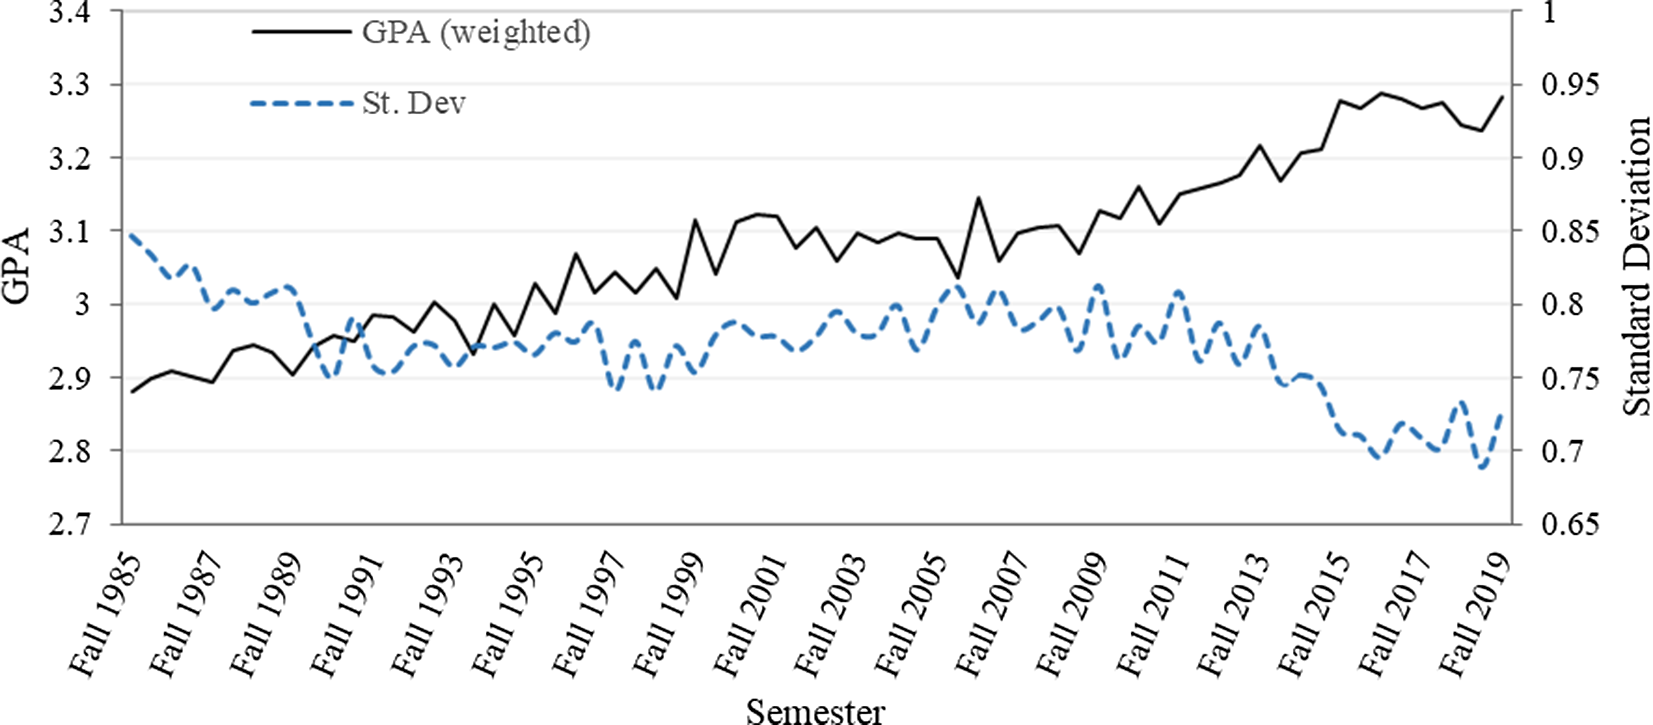
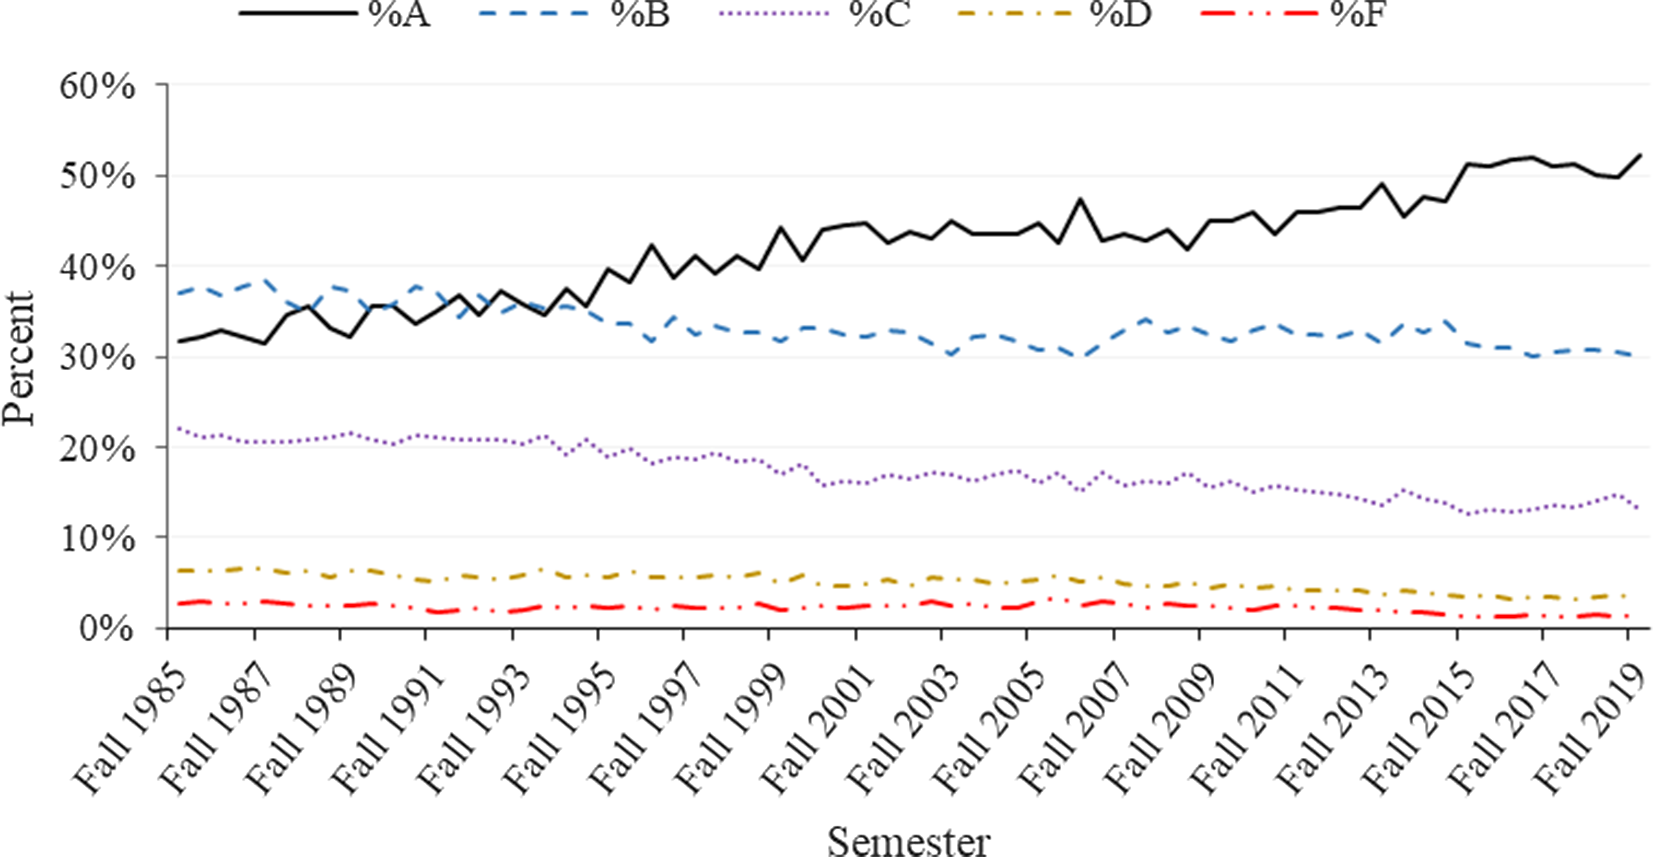
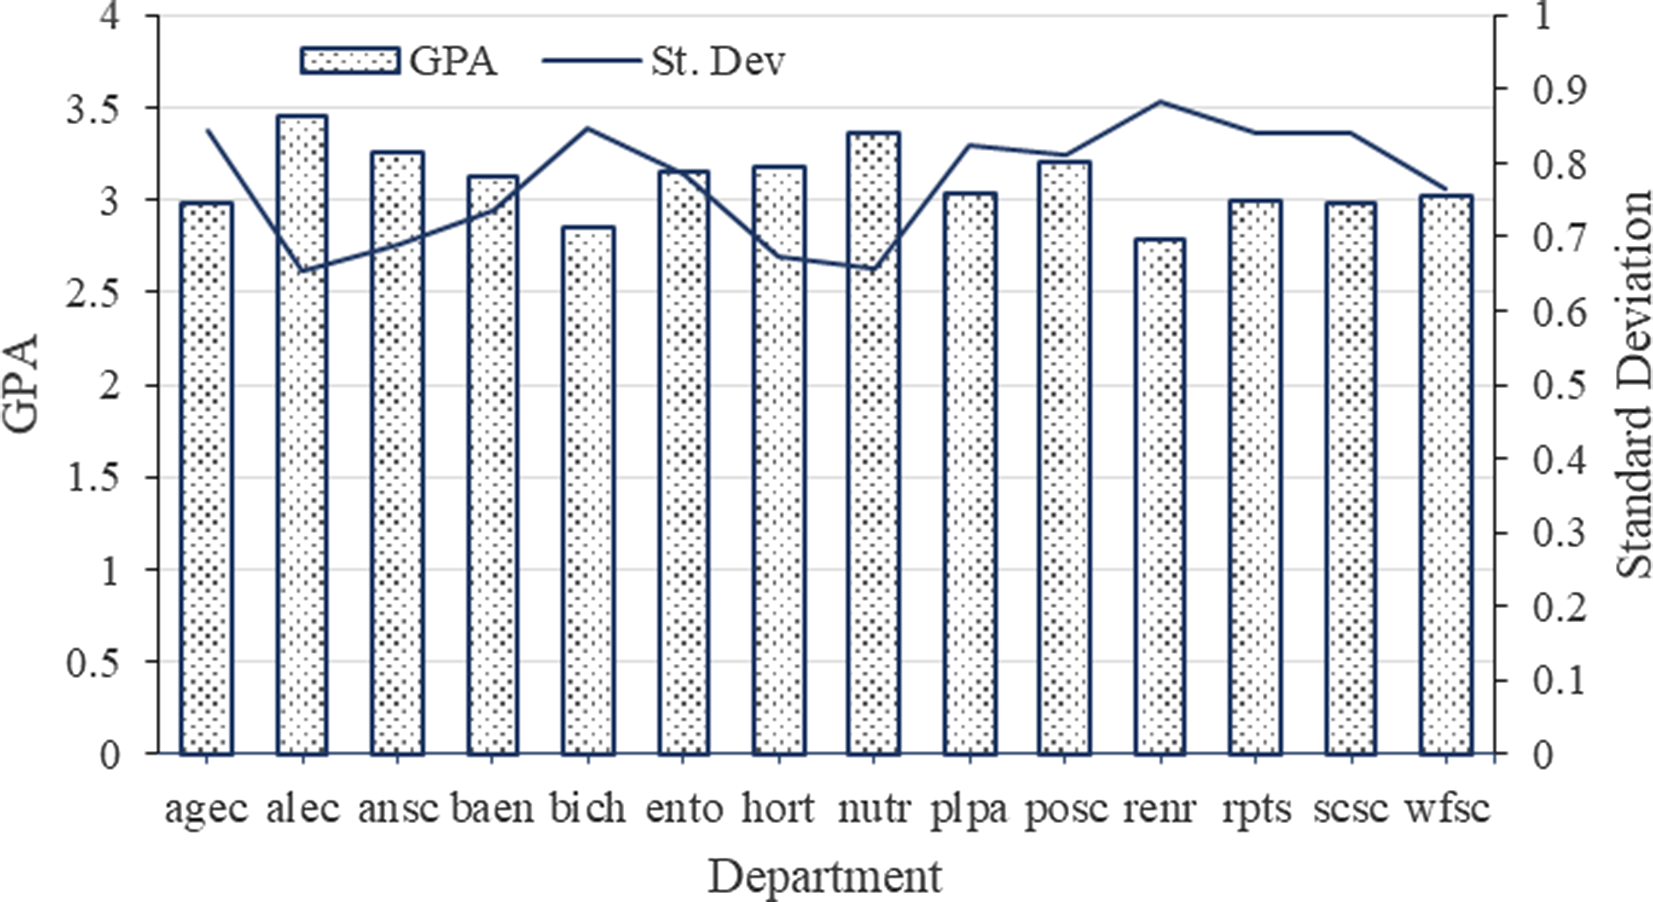
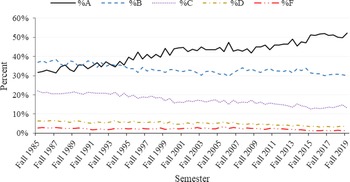
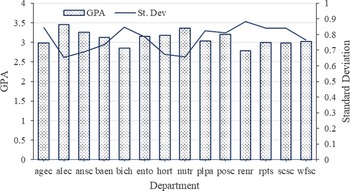
In Figure 2, mean GPA and standard deviation are graphed by semester for all classes. Mean weighted GPA overall years is 3.08. In fall 1985, mean weighted GPAs is 2.88. By fall 2019, GPA has increased to 3.28. Standard deviation declined from 0.85 to 0.73. Examining the percentage of letter grades helps explain the above increase in GPA and decrease in standard deviation (Figure 3). The percentage of A’s increases from about 32% to over 52%. All other letter grades percentages have decreased over the time frame with the percentage of C’s showing the largest decrease (from approximately 22% to a little more than 13%). Mean GPAs and standard deviations by department show considerable variation, with mean GPAs, ranging from 2.79 for the Department of Renewable and Natural Resources to 3.46 for the Department of Agricultural Leadership Education and Communication (Figure 4). Standard deviation and GPA show an inverse relationship caused by the increase in A’s and decrease in F’s. Such departmental differences provide support for the inclusion of departments as a level in the model.
Weighted (by class size) average COALS GPA and standard deviation by semester from fall 1985 to fall 2019.
Percentage of letter grades in COALS in all courses from fall 1985 to fall 2019.
Overall weighted by student mean GPA and standard deviation by department in COALS for the fall 1985 to fall 2019.
Estimation Methodology
When discussing observations that are a part of one group or a cluster, there is risk of drawing inferences about the groups based on simple aggregation of the individual data. Diez-Roux (Reference Diez-Roux1998) argues the relationships observed at the individual level may not hold between the same variables observed in a group, which will result in inferential errors. At the group level, there may be specific group properties that will affect the variables in the same way, regardless of the individual characteristics. In the scope of this study, there may be department-specific characteristics that might follow the same pattern within the same department. This means that data within the same department might be correlated, whereas data from different departments may be considered independent. A similar argument holds for instructors.
Multilevel mixed modeling accounts for both within-individual and between-individual variations (Douglas, Reference Douglas2004; Wu, Reference Wu2019; Shinn and Rapkin, Reference Shinn, Rapkin, Shinn and Rapkin2000). Following Kokkelenberg, Dillon, and Christy (Reference Kokkelenberg, Dillon and Christy2008), Beenstock and Feldman (Reference Beenstock and Feldman2016), and Hernández-Julián and Looney (Reference Hernández-Julián and Looney2016), a mixed effect model is used to incorporate the variations of grading between the departments and individual instructors, as well as to account for the internal correlation while controlling for other factors.
The model is a three-stage hierarchical model with two levels, where the first stage measures the fixed effect or within-individual variation, while the second and third stages measure the random effect or the between- individual variations for instructors and for departments. The estimation consists of separate sets of regressions nested within each other (Greene, Reference Greene2012). Combining the stages, one obtains
 $$y_{ijk}=\beta _{0}+X_{k}\beta _{k}+u_{i}+u_{ij}+\epsilon _{ijk}$$
where
k indicates an individual class;
j = 1, …, 1359 instructors nested within i = 1, …,14 departments;
y ijk —is the individual class mean GPA or class GPA standard deviation;
β 0—is the intercept to be estimated;
β k —is a vector of coefficients to be estimated associated with the fixed part of the model;
X k —is the matrix of independent variables described in Table 1;
u i —is the particular department GPA (standard deviation) variation from the mean GPA (standard deviation) in the fixed part of the model;
u ij —is the variation of the instructor mean GPA (standard deviation) from the department mean GPA (standard deviation) in the random part of the model; and
∈ ijk —is the variation of each class GPA (standard deviation) from the instructor mean GPA (standard deviation) in the random part of the model.
The model is estimated using mixed command in Stata 15 (StataCorp, 2017).
Results and Discussions
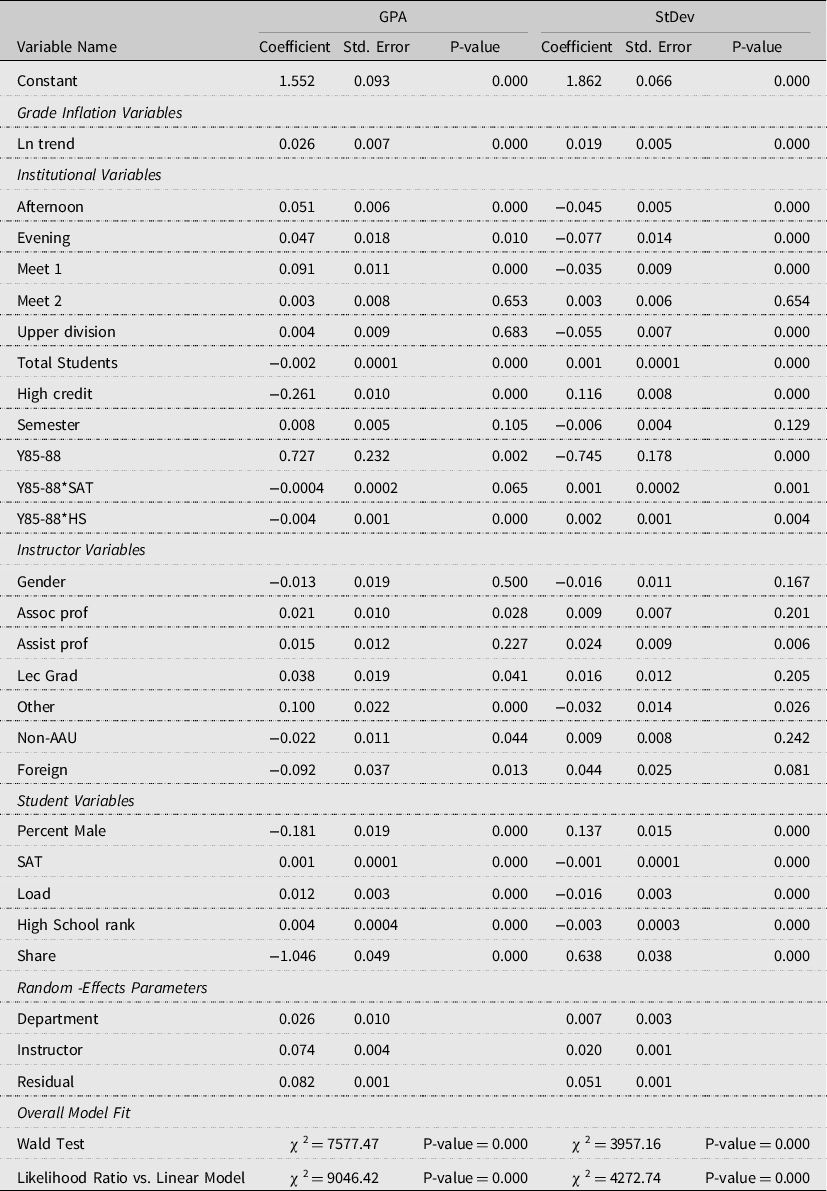
Estimation results for both the GPA and standard deviation (StDev) models are presented in Table 2. Wald statistics for both models indicate jointly all variables except the intercept differ from zero at p-values less than 0.01. Likelihood ratio tests reject the null hypotheses; the models including random effects are equivalent to a linear regression model. Evidence of clusterization of the data is tested using interclass correlation coefficients, which are the ratio of one variance to the sum of the other two variances. The coefficent for level two, for example, is the ratio of level two estimated variance to the sum of the level one and level two estimated variances. Because this measure is greater than 0 (0.14 for the department and 0.55 for the instructor given department), the conclusion clustering is indicated (Park and Lake, Reference Park and Lake2005). The selection of both levels (random effects) is also supported by model selection information criteria, and minimum values were attained using both levels when compared to one level or no level. Finally, both random effects parameters differ from zero in the two models. As is common practice, the coefficients associated with the levels are not presented given the number of coefficients, rather just over all significance is discussed. Overall, model statistics provide evidence for the appropriateness of the mixed effects model.
Estimated coefficients of the GPA and StDev models
Trend Variables
In the GPA model, the trend variable is significant and positive, indicating over the period 1985–2019, there is evidence of systematic grade increases in COALS (Table 2). Without the department and instructor levels included in the model, trend remains positive, significant, and is larger in magnitude. Department and instructor levels appear to partially account for the increases in GPA seen in Figure 2. In the StDev model, the trend variable is significant and positive. Without the department and instructor levels, the coefficient on trend in StDev model is not significant.
Institutional-Level Data
Estimated institutional random effects parameters are significant in both the GPA and StDev models indicating common grading patterns within a department. These results are in line with previous studies such as Diette and Raghav (Reference Diette and Raghav2015), Hernández-Julián and Looney (Reference Hernández-Julián and Looney2016), and O’Connor (Reference O’Connor2020). Variables associated with Y85-88 indicate university reporting requirements may help explain GPA. All other institutional variables in the GPA model except semester, upper division classes, and meeting twice a week are significant at p-values of 0.01 or less indicating institutional variables affect student learning as measured by GPA. Semester being insignificant indicates class GPA does not vary by spring and fall semesters, a pleasing result for COALS. GPAs for classes held twice a week do not significantly differ from classes held three times a week. However, GPAs for classes meeting once a week are higher than those meeting three times a week. Classes that meet more often per week are generally shorter in duration (Table 1). Contrary to Henebry (Reference Henebry2010), longer classes appear to result in higher GPAs. This result may be because longer duration classes tend to more specialized attracting interested and motivated students.
Classes held during the morning hours result in lower GPA than classes that are held in the afternoon and in the evening. Based on a Wald test, grades for evening and afternoon classes do not significantly differ from each other. One possible explanation for morning classes having lower GPAs is students in morning classes my not have had enough sleep, which affects their performance during the class (Wahlstrom, Hendrix, and Frederickson, Reference Wahlstrom, Hendrix and Frederickson1998; Wheaton, Chapman, and Croft, Reference Wheaton, Chapman and Croft2016). Further, evening classes tend to be more specialized courses that may be contributing to the larger GPAs. There is no significant difference between grades in upper and lower division classes. Classes with three or more credit hours tend to have lower GPAs than classes with one or two credit hours.
GPA is negatively correlated with the class size, which is consistent with previous findings (Kokkelenberg, Dillon, and Christy, Reference Kokkelenberg, Dillon and Christy2008). Higher grades for smaller classes may be a result of better learning outcomes (Nye, Hedges, and Konstantopoulos, Reference Nye, Hedges and Konstantopoulos2000), because in smaller classes instructors are able to provide more time to individual students both during class and office hours (Jewell, McPherson, and Tieslau, Reference Jewell, McPherson and Tieslau2013).
All institutional variables’ coefficients in the StDev model are significant at p-values of 0.01 or less except those for semester and classes that meet twice a week. The signs of the significant coefficients in the StDev model tend to be opposite of the signs in the GPA model. Generally, variables that increase GPA tend to decrease standard deviation or variability of grades. Most likely cause of this inverse relationship is GPAs having an upper bound of four.
Instructor Specific Variables
As in the case with departments, the random part of the model indicates significant variability in grading patterns of individual instructors. Coefficients associated with associate professor, lecturer graduate student, and lecturer other are significant and positive indicating classes taught by these instructors on average have higher GPAs. The increasing trend of using graduate students and other lecturers accounts for some of the increase seen in GPAs overtime. The questions are do students learn more from these non-professorial rank instructors, which would not be grade inflation, or do these instructors grade easier, which is grade inflation? Unfortunately, the data set cannot answer these questions. Anecdotal evidence provided by some graduate students suggest their incentive is to get good teaching evaluations to help in obtaining the first faculty position. Easy grading resulting in higher GPAs may contribute to higher evaluations (Peace, Reference Peace2017; Howard and Maxwell, Reference Howard and Maxwell1980; Eiszler, Reference Eiszler2002). Kezim, Pariseau, and Quinn (Reference Kezim, Pariseau and Quinn2005) and Sonner (Reference Sonner2000) also find visiting and adjunct faculty grades are higher. They suggest that the reason for the higher grades may be the expectation of higher student evaluations because these instructors are often hired on the term-by-term basis and higher student evaluations are more likely to result in their contract being extended. Classes with instructors who graduated from an AAU university have higher GPAs than classes with non-AAU or foreign universities’ instructors. Instructor gender does not significantly influence GPAs. This result differs from some previous studies (Moore and Trahan, Reference Moore and Trahan1998; Kezim, Pariseau, and Quinn, Reference Kezim, Pariseau and Quinn2005) and is in line with others (Figlio, Schapiro, and Soter, Reference Figlio, Schapiro and Soter2015; Ronco and Cahill, Reference Ronco and Cahill2004). The insignificance may arise from controlling for individual instructor variability.
In the StDev model compared to professors, assistant professors tend to have more variable GPAs, while other faculty members show smaller variability in grades. Assistant professors having a larger variability may be because of differences in experience and the number of times an instructor has taught a particular class.
Student Specific Variables
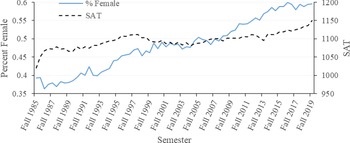
All student variables are significant. Coefficients associated with variables measuring student motivation and ability, SAT, class load, and high school rank are positive. These results are supported by previous studies, such as Kobrin et al. (Reference Kobrin, Patterson, Shaw, Mattern and Barbuti2008) and Westrick et al. (Reference Westrick, Le, Robbins, Radunzel and Schmidt2015) who find high school performance and innate ability of students are good indicators of university performance. Student motivation to achieve and less time to procrastinate may explain why larger class loads results in slightly higher GPAs. As the percent of no grades increases, the class GPA decreases, which may be because student tend to drop harder classes or classes with more work to maintain their GPA. As the percent of females in the class increases (percent male decreases), GPAs increase. Kuh and Hu (Reference Kuh and Hu1999), and Voyer and Voyer (Reference Voyer and Voyer2014) find females tend to have higher grades than male students.
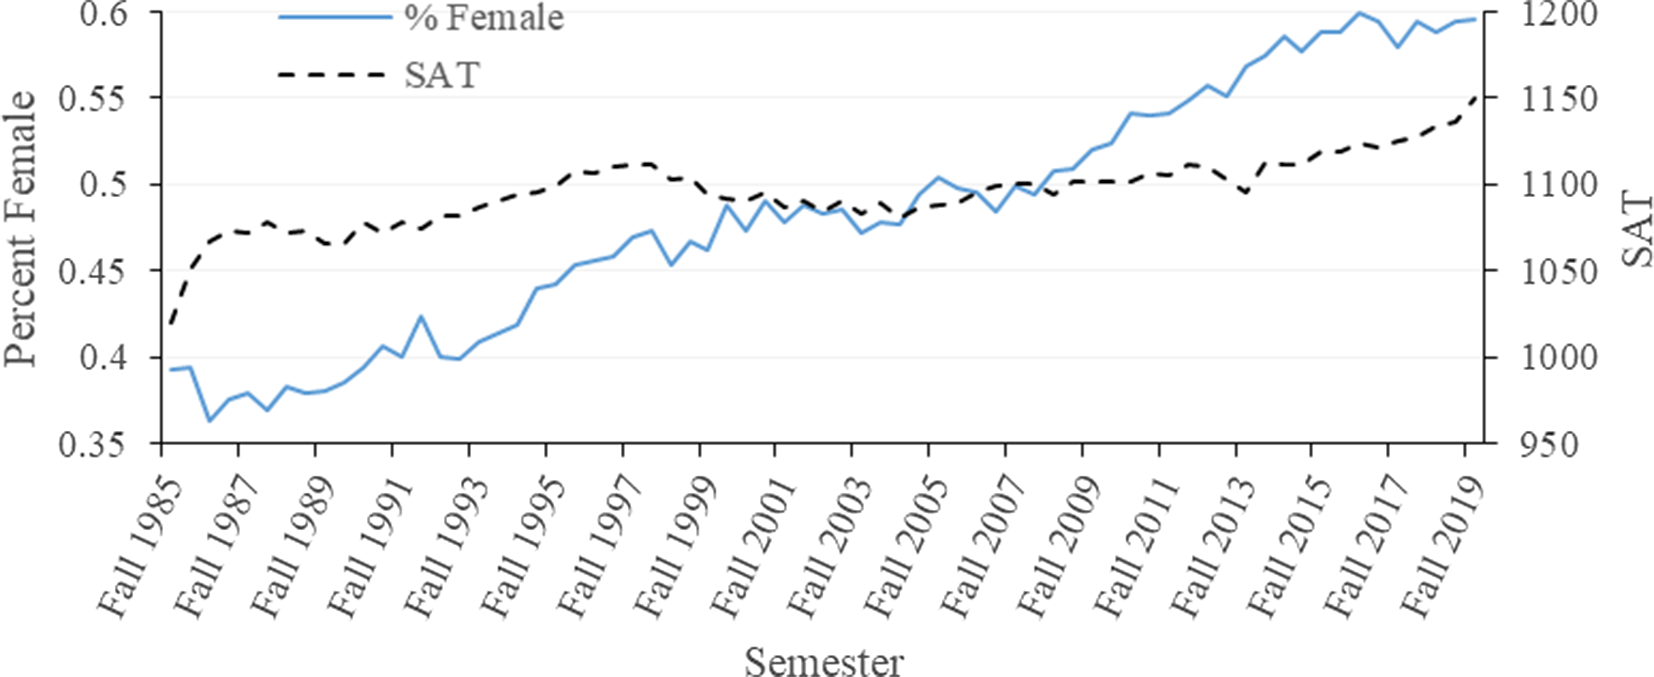
Both the number of female students in COALS and the students average SAT have been increasing over time (Figure 5). These increases help explain the increasing grades in COALS. Increasing SAT would not cause grade inflation, because better students are expected to obtain better grades. The reason females tend to have better grades determines if the increased percent of females is associated with grade inflation. If instructors simply grant higher grades to females, then grade inflation is present; however, if females are more motivated and study harder, it is not grade inflation. Unfortunately, the dataset cannot clarify this issue. Dampening the GPA increase is student load and high school rank, both of which decrease slightly overtime.
Average SAT score for all students in COALS and percentage of female students by year from fall 1985 to fall 2019.
All student variables are significant in the StDev model. There is higher variability in grades for classes with more male students than female students. The higher the student load, SAT score, and high school rank, the lower the variability in grades.
Excluding Earlier Years
Grade inflation is considered an empirical issue occurring over decades, as such the analysis used all years in which data are available. To examine if problems with data consistency in the years 1985–1988 impact the results, the models are re-estimated excluding these years. In removing the years, 1.735 observations are lost. All coefficients' sings are unchanged. Both trend and lecture gradues coefficients are less significant but still significant at the six percent or less. As such, there is no real change in inferences between including or excluding the early years.
Discussion
As discussed earlier, grade inflation is important to universities, instructors, and students. Universities competing for reputation, students and resources may permit grade inflation to occur (Jewell, McPherson, and Tieslau, Reference Jewell, McPherson and Tieslau2013). Instructors may inflate grades for personal gain such as favorably biasing student evaluations (Jaschik, Reference Jaschik2008; Peace, Reference Peace2017), whereas students may pressure academics for higher grades (Peace, Reference Peace2017). Grade inflation, however, not only affects universities, instructors, and students, but also spills over into the employment sector where the recruitment of a good candidate is often based on university GPA (Adams, Reference Adams2015; Fossati, Wilson, and Bonoli, Reference Fossati, Wilson and Bonoli2020). A high GPA may suggest a job candidate has high aptitude and motivation, but on the other hand, it could just be the result of inflated grading. It is clear comparing student GPAs across the time in the presence of grade inflation is inappropriate and may result in poor hires by companies. Whether grade increases are grade inflation or caused by improvements in teaching and students’ preparedness is an empirical issue. As such, using data from Texas A&M College of Agriculture and Life Sciences (COALS) three interrelated objectives are to examine: 1) has grade inflation occurred, 2) has the distribution of grades as measured by the standard deviation changed,; and 3) how various factors influence class mean GPA and grade distributions. Even though the study is conducted based on data from a specific institution, the results may be generalized to other land grant universities, because the results support findings of earlier studies that did not explicitly focus on colleges of agriculture.
Utilizing data from 14 departments in COALS for the years 1985–2019, this study found evidence of systematic increases in mean class GPAs and standard deviation of grades after controlling for the influence of institution, instructors, and student factors. The results are suggestive of grade inflation, but with the caveat not all factors potentially influencing grades could be included. All three groups of factors are important in explaining class GPAs and standard deviations. Overall, the findings and results are quite robust to changes in model assumptions. If the model is simplified to one level (department) or to no levels, majority of conclusions about the inferences of the various characteristics on mean class GPAs and standard deviation hold, supporting the validity of model.
Findings have implications on recruitment policies and requirements. With respect to instructors, a positive signal to administration is seen in that there are no differences in GPAs by instructor gender. The practice of increasingly hiring graduate students and other instructors is associated with increasing grades, but is it inflation or do these instructors provide a better learning environment? Other instructors, for example, tend to have less of a research role, which leaves more time to allocate to class preparation and lecturing. If inflation, the trend of hiring non-tenure track instructors may be particularly worrisome as universities move towards increasing use of non-permanent faculty. Addressing this increase in grades, however, is not easy given an environment of decreasing budgets and increasing accountability as measured by evaluations of instructors’ performance. Studies have suggested grades and evaluations are positively correlated (Marsh and Roche, Reference Marsh and Roche2000). If this is the case, then other measures of instructor effectiveness may have to be used. Hiring instructors with AAU backgrounds may result in higher GPAs but the reason is not clear. More research is necessary here; is it for example better preparedness by instructors or more focus on research that results in different class GPAs. Assuming GPAs are good measures of learning, administrators may choose to schedule their core, degree-specific classes later during the day to maximize student learning. Further, smaller class sizes appear to be beneficial for learning. Universities should stride for smaller classes instead of larger classes. Budgetary considerations, however, are driving both class size and use of graduate students and other instructors. Some larger classes, however, may serve to weed-out students from the major, instructors in these classes may give lower grades (Weston et al., Reference Weston, Seymour, Koch, Drake, Seymour and Hunter2019). This observation complicates the issue.
From an instructor standpoint, implications are few. Given the trend of using student evaluations and assuming higher class GPAs are associated with better evaluations, instructors may want to ask to teach smaller class sections of specialized courses. Another consideration is class duration. Longer classes yield higher GPAs, but this is most likely because longer and less frequent classes tend to be more specialized.
With the goal of potentially higher GPA, when selecting between different sections of a class, students could check the instructor background and should try to register for the sections that have fewer students. In addition, given a chance, they may consider taking classes offered later during the day. Students may take classes taught by graduate students and other instructors in anticipation of higher grades, but should be aware of the potential opportunity cost of missing on insights when taught by more experienced professorial track faculty members.
Suggestions for Future Research and Limitations
The results suggest further research on separating the effects of grade improvement and grade inflation is necessary. Because variations are seen by department, examining departments separately or by general focus such as STEM or social is seen as a valuable contribution. Improved understanding of this phenomena and identifying source of grade increases is essential to determine if grade inflation is occurring. Research on grading patterns directly before and after instructor's promotion would provide insights on how the promotion process impacts grades. Whether instructors shift their time and effort towards publications and away from teaching or if they grade easy to improve evaluations needs exploring. Although different colleges of agriculture have somewhat different employment areas, they do compete against each other for hiring of their graduates. Further, how graduate schools and employers use/compare students’ GPAs from different university should be explored, given the empirical nature of grading. Can or should grades from different universities be compared? Being an empirical issue, how do grades in colleges of agriculture vary by university. Such research would benefit both graduate colleges and employers. How has COVID-19 change the grading environment? If changes occurred, are they permanent changes?
As with all studies, limitations exist. Being a case study, all limitations of such studies apply here. The primary limitation is the inability to include all characteristics influencing class GPAs. As mentioned by a reviewer, instructor level may not account for all influence of an instructor, such as changing teaching styles. Unfortunately, such information is not available going back to 1985. An attempt was made to include infrastructure (building, classroom, lab modernization, electronic equipment available, etc.) in each classroom and how it evolved over time. Such details, however, are not available for the classrooms. Including interaction terms may be appropriate, but with the number of variables in this study the question becomes which interactions to include because including all interactions creates an unwieldly model. Interactions are not included to avoid a data mining exercise.
Data availability statement
Data are available from the authors.
Author contributions
Conceptualization, J.W.M., K.K.L., A.Y.; Methodology, J.W.M., A.Y.; Formal Analysis, J.W.M., A.Y.; Data Curation, J.W.M., K.K.L., A.Y.; Writing—Original Draft, J.W.M., K.K.L., A.Y. Writing—Review and Editing, J.W.M., K.K.L., A.Y.; Supervision, J.W.M.; Funding Acquisition, NA.
Financial support
This research received no specific grant from any funding agency, commercial, or not-for-profit sectors.
Conflict of interest
Anna Yeritsyan, James Mjelde, and Kerry Litzenberg declare none.


 Open access