


1. Introduction
The stock-to-use ratio (STU) of an agricultural commodity, calculated as ending stocks divided by total use of that commodity, has been used by market analysts as an important variable in projecting future commodity prices (Dawe, Reference Dawe2009). The importance and the explanatory power of STU in explaining agricultural commodity price behavior, particularly as an indicator of future price spikes, is based on the fact that STU reflects the history of past production and consumption of the commodity (Bobenrieth et al., Reference Bobenrieth, Wright and Zeng2013). While stock-to-use ratio and price are strongly interlinked, and the former can be used to predict price movement behavior (Peterson and Tomek, Reference Peterson and Tomek2005; Schewe et al., Reference Schewe, Otto and Frieler2017; Schnept, Reference Schnept2005), there is no consensus on the direction of the relationships. Generally, higher stock-to-use ratios (STUs) are linked to lower prices due to reduced volatility (Baffes and Haniotis, Reference Baffes and Haniotis2016; Ott, Reference Ott2014). A few empirical studies, however reported a positive relationship during the periods of structural change (Goodwin et al., Reference Goodwin, Schnepf and Dohlman2001; Timmer, Reference Timmer2009, Reference Timmer2010; de Gorter et al., Reference de Gorter, Drabik and Just2013). It necessitates conducting country- and commodity-level case studies to decipher the dynamic relationship between STU ratio and prices of agricultural commodities.
Studies on this important issue are scarce and primarily based on either U.S. data or global aggregated data (Flanders, Reference Flanders2017; Good and Irwin, Reference Good and Irwin2015; Irwin and Good, Reference Irwin and Good2013; Westcott and Hoffman, Reference Westcott and Hoffman1999; Wright, Reference Wright2014). For example, Flanders (Reference Flanders2017), Good and Irwin (Reference Good and Irwin2015), Irwin and Good (Reference Irwin and Good2013) and Westcott and Hoffman (Reference Westcott and Hoffman1999) demonstrated that the STU and prices are inversely related in the case of U.S. corn, soybean, and wheat. Wright (Reference Wright2014) found an inverse relationship between the global STU of rice and its price. Although rice is a staple food for half of the world’s population, and 90% of rice is produced and consumed in Asia (FAO, 1998), to the best of our knowledge, no study has examined the country-level dynamics of the STU and rice prices in any Asian country.
Data limitations are the key reason why empirical research has frequently overlooked the relationship between country-specific STU and global rice prices. Additionally, the international rice market is relatively thin compared to other major cereal markets, further complicating such analysis (Gibson, Reference Gibson1994; Headey, Reference Headey2011; Nielsen, Reference Nielsen2003; Siamwalla and Haykin, Reference Siamwalla and Haykin1983; Wailes, Reference Wailes and Wailes2005). Also, the international rice market is fragmented between different types and varieties, such as japonica and indica types, and specifically by grain type and quality (Mottaleb and Durand-Morat, Reference Mottaleb and Durand-Morat2024). For all these reasons, the availability of rice price series is limited (Jayne, Reference Jayne1993). This probably discouraged researchers from investigating interrelationships between STU and price (Mottaleb and Durand-Morat, Reference Mottaleb and Durand-Morat2024). Furthermore, reliable high-frequency data on national rice stocks are often unavailable or classified, particularly in major producers like China and Vietnam, where stocks are treated as strategic assets.
To fill in the study gap, this study examined the dynamic relationship between the STU and the price of rice in the major economies of the world. Since the unprecedented commodity price hikes in 2006–08, global ending stocks of rice have increased steadily until 2020. Thus, questions arise regarding the type of relationship that exists between ending stocks, use, and the export price of rice. More specifically, is there any causal relationship between STU and export price of rice that could justify the use of rice price to explain the STU and vice versa? Are there specific countries where the STU-export price causal relationship can be informative and serve to monitor the global rice market more efficiently? The objective of this study is to answer these questions using state-of-the art time series analysis and a dataset spanning over 61 years.
In many countries in Asia, rice is a politically sensitive commodity, which results in a high global level of support (OECD, 2023). As such, the law of supply and demand often fails to fully explain Asian rice market dynamics (Nguyen et al., Reference Nguyen, Do, Kay and Kompas2020). Furthermore, the STU represents the realized surplus from the difference between supply and all forms of utilization (e.g., exports, domestic consumption, losses), which are often influenced by agricultural policies and other unobservable factors such as political influence (e.g., export/import ban and its underlying rationale) (Heien, Reference Heien1977). It would thus be interesting to examine whether the STU and price of rice in Asian countries follow the general movement behavior as observed by some studies for other commodities (Peterson and Tomek, Reference Peterson and Tomek2005; Schewe et al., Reference Schewe, Otto and Frieler2017; Schnept, Reference Schnept2005),
Examining the relationship between the STU and commodity prices, specifically rice, could be insightful for understanding agricultural commodity markets. As empirical studies are few on this issue; to fill in the research gap, this study examined the causal relationship between the STU of the top 16 rice exporting and consuming countries and the global export price of rice. In the process, this study firstly applied the panel vector autoregression (PVAR) model estimation process by pooling the STU from 16 countries (Argentina, Bangladesh, Brazil, Cambodia, China, India, Indonesia, Japan, Nigeria, Pakistan, Philippines, South Korea, Thailand, the U.S., Uruguay and Vietnam) from 1961 to 2022. Secondly, this study applied a vector autoregression (VAR) estimation process for all sampled countries separately following the Granger causality test.
The case is worth investigating for two crucial reasons. First, since its domestication around 8000-9000 years ago (Callaway, Reference Callaway2014), rice is a major pillar of human food security. Nearly 4 billion people, or half of the world’s population, rely on rice for their daily dietary energy (Muthayya et al., Reference Muthayya, Sugimoto, Montgomery and Maberly2014). According to the Food and Agriculture Organization of the United Nations (FAO), on average, rice contributed 18% of the daily total dietary energy intake by a person in the world (FAOSTAT, 2022a). Because of its strategic importance in ensuring food security, many countries stockpile rice as buffer stocks to ensure food security in times of crisis. This study intends to examine the relationship between STUs and the global rice price by linking country-level rice stock behavior with the global rice export price. The findings of this study can contribute to devising effective rice market monitoring policies that can help various stakeholders, including aid and development agencies and private traders, improve their decision-making processes.
Second, the global rice market is thin compared to other cereals such as wheat and maize (Gibson, Reference Gibson1994; Headey, Reference Headey2011; Nielsen, Reference Nielsen2003; Siamwalla and Haykin, Reference Siamwalla and Haykin1983; Wailes, Reference Wailes and Wailes2005). For example, according to FAOSTAT (2022e), around 32 and 17% of the global wheat and corn production, respectively, were exported in 2021, while only 9% of total rice production was exported. One explanation for the thin nature of the international rice market is the high level of policy intervention and market protection (Calpe, Reference Calpe2006). Another explanation is related to the nature of rice production and consumption. Simply put, rice is primarily consumed in the regions where it is produced. Based on the second explanation, we can expect trade to increase faster in the future, as total consumption in China, the largest rice producer, is projected to decrease due to both a decline in per-capita consumption and population (Durand-Morat and Bairagi, Reference Durand-Morat and Bairagi2022).
Finally, rice in the international market is less substitutable due to a highly heterogeneous preference structure (e.g., stickiness, aroma, shape) (Chen and Saghaian, Reference Chen and Saghaian2016; Cramer et al., Reference Cramer, Wailes and Shui1993; Dawe, Reference Dawe2008; Jayne, Reference Jayne1993; Siamwalla and Haykin, Reference Siamwalla and Haykin1983; Wailes, Reference Wailes and Wailes2005; Yap, Reference Yap1997). The thin nature of the rice market may lead to global export prices not reflecting the global demand, supply, and stock situation (Tomek and Robinson, Reference Tomek and Robinson1990). Applying the simple VAR model estimation technique, this study examines the two-way causal relationship among the STU in the 16 major rice-producing, consuming, and exporting countries, with the global export price of rice. The findings can contribute to understanding why the global rice stocks have been increasing since the global rice market crisis of 2006–08.
The study is organized as follows. Section 2 includes a literature review and an examination of rice stock policies in the sampled countries. Section 3 presents the materials and methods, and Section 4 includes major findings and discussions. Finally, Section 5 presents conclusions and policy implications.
2. Literature review: ending stock, market price, and stock policies
In the literature, ending stock is considered a summary of commodity market conditions, as the dynamic relationship between ending stock and price of a commodity summarizes the effects of both supply and demand during the entire marketing year (Cooper and Lawrence, Reference Cooper, Lawrence, Bosworth and Houthakker1975; Schewe et al., Reference Schewe, Otto and Frieler2017; Schnept, Reference Schnept2005). Schewe et al. (Reference Schewe, Otto and Frieler2017) point out that in predicting stakeholders’ behavior in the agricultural commodity market, the dynamic relationship between ending stock and price would be vital. With sufficient length of information, stock has an important role in explaining commodity price behavior (Peterson and Tomek, Reference Peterson and Tomek2005). Also, Bobenrieth et al. (Reference Bobenrieth, Wright and Zeng2013) argued that the observed stock behavior of three major grains, such as rice, wheat, and corn, is closely related to the price behavior, and Goswami and Karali (Reference Goswami and Karali2022) found that the STU of both soybean and corn impacts their prices.
In general, higher STUs would result in lower prices and vice versa, as STU is significantly and negatively correlated with price volatility in commodity markets (Baffes and Haniotis, Reference Baffes and Haniotis2016). Baffes and Haniotis (Reference Baffes and Haniotis2016) and Ott (Reference Ott2014) demonstrate the negative and significant effect of STU on various global commodities prices, including rice, and Flanders (Reference Flanders2017) provides country-specific evidence of such a relationship using U.S. price and stock data for Corn, Soybeans, and Wheat. Good and Irwin (Reference Good and Irwin2015), Irwin and Good (Reference Irwin and Good2013) and Westcott and Hoffman (Reference Westcott and Hoffman1999) also demonstrated that the STU ratio and prices are inversely related in the case of U.S. corn, soybean, and wheat. Traoré (Reference Traoré2014) supports a similar argument by examining cotton markets and demonstrates how declining STU in China amplified global price changes. These research investigations highlight that while several factors influence commodity prices, STU levels remain a fundamental driver, particularly for staple crops (such as rice).
However, a substantial structural change in the market may converse or delay this causal relationship and market dynamics may force ending stocks and price in the same direction (Goodwin et al., Reference Goodwin, Schnepf and Dohlman2001; Timmer, Reference Timmer2009, Reference Timmer2010; de Gorter et al., Reference de Gorter, Drabik and Just2013). Furthermore, this stockholding behavior would be more common where stakeholders view the shock as an ongoing phenomenon rather than a one-off event (de Gorter et al., Reference de Gorter, Drabik and Just2013). These complexities highlight the need for nuanced analysis, such as a PVAR model that captures the dynamic interdependence between STU and market prices across multiple countries over time (Rezitis and Ahammad, Reference Rezitis and Ahammad2015)
In addition to global market dynamics, it is important to examine country-level factors (particularly the influence of major rice-producing economies) in analyzing the relationship between the STU and market prices. The significance of country-level dynamics may vary across commodities due to differences in market structure, trade dependency, and domestic policy interventions (Cooper et al., Reference Cooper, Lawrence, Bosworth and Houthakker1975). Therefore, while STU is recognized as an indicator of price trends, its predictive power may differ across both countries and commodities.
The existing literature provides limited and mixed evidence on country-specific influences in commodity markets, particularly in the case of rice, highlighting a critical gap that warrants further investigation. For instance, Traoré (Reference Traoré2014) indicates that China has a significant role in explaining the global cotton market price (1975–2009), suggesting the potential of country-level impact on world price dynamics in commodity markets. On the other hand, Dawe and Slayton (Reference Dawe, Slayton, Dawe and Slayton2010) show that the global ending stocks of rice and STU indicate normal market trends over time (1979–2008), and that excluding China does not bring any significant difference in the direction and scale of the trends.
These findings suggest that some major rice-producing countries may not possess sufficient market power to shape market trends despite their presumed influence on the rice market. However, Saghaian (Reference Saghaian2010) argues that ignoring country-level dynamics may lead to a misleading understanding of the causal relationships between economic factors in the commodity market. Therefore, a country-focused approach is essential to better understand how national STU levels influence both domestic and global rice prices, especially given the variability in trade policies, stockholding behavior, and levels of market integration across countries (Clarete et al., Reference Clarete, Adriano and Esteban2013; Cooper et al., Reference Cooper, Lawrence, Bosworth and Houthakker1975).
Overall, the existing literature provides ample evidence that examining the role of STU is essential for understanding global market behavior. It is also crucial to consider the influence of ending stocks in selected countries when analyzing global rice prices. Despite the importance of this issue, few studies have explored the time-series relationship between rice ending stocks and global rice prices. Moreover, no study has investigated the country-level influence of major rice-producing economies on the relationship between the ending stocks-to-use ratio and global rice prices. Additionally, recent methods such as panel VAR, which are well-suited to capturing dynamic interactions and cross-country heterogeneity, remain largely underutilized in this area.
Some countries, such as Argentina, Uruguay, and the United States, lack explicit stock policies, with rice stocks primarily influenced by market conditions or unexpected carryover stocks. In contrast, countries such as China and India, the top producers and consumers of rice, have defined stock policies. A summary of the stock policy situation in the selected countries is provided in Table 1a of Appendix A.
3. Materials and methods
3.1. Data
This study analyzes the relationship between the global rice export price and the stocks-to-use ratio (STU) of 16 major rice-exporting and rice-consuming countries. Countries were selected based on two criteria: being a net rice exporter and/or having ending stocks of at least one million metric tons in 2022/23. The selected countries are Argentina, Bangladesh, Brazil, Cambodia, China, India, Indonesia, Japan, Nigeria, Pakistan, the Philippines, South Korea, Thailand, the United States, Uruguay, and Vietnam. Among them, Argentina, Brazil, Cambodia, India, Pakistan, Thailand, the United States, Uruguay, and Vietnam are net exporters, while the others are primarily net importers (Table 1).
Few indicators on rice cultivation, trade and consumption of the sampled countries in 2022/23 (million ha and million metric tons)

Source: Authors based on USDA (2024).
Altogether, the sampled 16 countries accounted for 87% of global rice production, 37% of global rice imports, 91% of global rice exports, 83% of global rice consumption, and 94% of global rice ending stocks in 2022/23 (Table 1).
The STU for each country was calculated using ending stocks and domestic consumption data from 1961 to 2022, sourced from the USDA Production, Supply, and Distribution online database (USDA, 2024). The STU is defined as ending stocks divided by total domestic consumption, multiplied by 100. In absolute terms, China holds the largest rice stocks, followed by India (Table 2). In terms of STU (%), Uruguay ranked first with 250% in 2022/23, followed by China at 69% (Figure 1).
Stock-to-use ratio (STU) (%) of rice in sampled 16 countries in 2022/23. Source: Authors based on USDA (2024).


The global rice export price data is calculated as the total value of rice exports in US$ in year t, divided by the total volume of rice exports in metric tons in year t, and the data are sourced from the Food and Agriculture Organization of the United Nations (FAO)’s online data portal (FAOSTAT, 2022b, 2022c). The nominal export price information was converted into real export price using the U.S. CPI (RateInflation, 2023), setting 2010 = 100.
Crude oil and fertilizer (urea, potassium chloride, and phosphate rock) prices come from the World Bank’s Commodity Price Data (World Bank, 2024). Per capita gross domestic product (GDP) data come from the World Development Indicators, an online portal of the World Bank (2022).
3.2. Estimation method
In examining the relationship between the global average export price of rice (US$/ton), and the STU of the countries sampled, this study applied the VAR model in a time series setting. In a VAR model, all variables are endogenous, which means all variables are both dependent and independent variables at the same time. In addition to STUt and global export price, five more variables are included as completely exogenous variables: the real global average GDP per capita (US$), the crude oil price (US$/barrel), and the prices of urea, phosphate rock, and potassium chloride (US$/ton).
Globally, the demand for rice has been driven by population and income growth (van Dijk et al., Reference van Dijk, Morley, Rau and Saghai2021), particularly in Africa (Balasubramanian et al., Reference Balasubramanian, Sie, Hijmans and Otsuka2007; Mottaleb et al., Reference Mottaleb, Fatah, Kruseman and Erenstein2021; Seck et al., Reference Seck, Diagne, Mohanty and Wopereis2012). The global average GDP per capita is expected to capture the influence of increased income on the global rice export price. The crude oil price, on the other hand, is one of the most important global macro indicators, and directly impacts global commodity prices, including rice (Adeosun et al., Reference Adeosun, Olayeni, Tabash and Anagreh2023; Camp, Reference Campn.d.; Chen et al., Reference Chen, Kuo and Chen2010; Kolaczkowski and White, Reference Kolaczkowski and White2022; Peersman et al., Reference Peersman, Rüth and Van der Veken2021). To capture its impact, the annual crude oil price has been included in the VAR model. Finally, urea, potassium, and phosphate are the basic synthetic fertilizers used in rice cultivation. To capture the influence of fertilizer prices on the international rice price, the prices of three major fertilizers are included in the model.
Considering the inverse relationship between STU and price, following Irwin and Good (Reference Irwin and Good2015) the empirical panel VAR model is specified as follows:
 $${Y_{it}} = \left[ {\matrix{ {\ln \left( {{1 \over {{{ST}}{{{U}}_{it}}}}} \right)} \cr {\ln ({{Pric}}{{\rm{e}}_{it}})} \cr } } \right] \to {{vector}}\;{{of}}\;{{endogeneous}}\;{{variables}}\;(2 \times 1)$$
 $$\left[ {\matrix{ {{{\matrix{ {\ln {{\left( {{{Crude}}\;{{oil}}} \right)}_t}} \cr {{{\matrix{ {\ln {{\left( {{{Urea}}} \right)}_t}} \cr {\ln ({{GDP}})}_t } }}} \cr {\ln ({{Phosphate}})}_t } }}} \cr {\ln {{({\rm{Potassium}})}_t}} \cr {{{Structural}}\;{{brea}}{{\rm{k}}_t}} \cr } } \right] \to {{vector}}\;{{of}}\;{{strictly}}\;{{exogenous}}\;{{variables}}\;(\;5\; \times 1)$$
Then the Panel VARX (P) system can be defined as:
 $${Y_{it}} = {A_i} + \sum\limits_{p = 1}^P {{B_p}} {Y_{i,t - p}} + C{X_{it}} + {e_{it}}$$
In Eq. (3):
A i = variable specific intercept vector (2 × 1)
B p = coefficient matrix for lag p (2 × 2)
C = coefficient matrix for strictly exogenous variables (2 × 6), and
e it = error vector (2 × 1).
Additionally, in the empirical estimation process, we have added the fifth lag of $\ln ({1 \over {\rm STU}_{it}})$
and ln (Price
it
) as explanatory variables to estimate the new generation Toda-Yamamoto Granger causality test (Toda and Yamamoto, Reference Toda and Yamamoto1995). Specifically for STU:
$\ln ({1 \over {\rm STU}_{it}})$
and ln (Price
it
) as explanatory variables to estimate the new generation Toda-Yamamoto Granger causality test (Toda and Yamamoto, Reference Toda and Yamamoto1995). Specifically for STU:
 $$\begin{align}\ln {\left( {{1 \over {{{STU}}}}} \right)_{it}} = & {a_{1i}} + \sum\limits_{j = 1}^P {{B_{11}}} \ln {\left( {{1 \over {{{STU}}}}} \right)_{i,\;t - j}}\; + \sum\limits_{j = 1}^P {{B_{12}}} \ln {\left( {{1 \over {{{STU}}}}} \right)_{i,\;t - 5}}\; \\& + \sum\limits_{j = 1}^P {{B_{13}}} \ln {({{Price}})_{i,\;t - j}}\;\; + \sum\limits_{j = 1}^P {{B_{13}}} \ln {({{Price}})_{i,\;t - 5}}\; + \;{C_1}{X_{it}} + {e_{1,it}}\end{align}$$
The Granger Causality test is formulated as follows:
 $${\rm{Does}}\;{\rm{price}}\;{\rm{Granger}}\;{\rm{cause}}{\mkern 1mu} \ln {\left( {{1 \over {{\rm{STU}}}}} \right)_{it}} \to {H_0}:{\mkern 1mu} {B_{13j}} = 0\quad \forall j = 1, \ldots, p.$$
A rejection of the null hypothesis (H 0) will indicate the presence of a causal relationship between price to STU. The presence of a causal relationship from STU to price will also be tested. In Eq. (4), the inclusion of the fifth lags of endogenous variables as strictly exogenous variables is based on the specification of Toda and Yamamoto (Reference Toda and Yamamoto1995) for an estimation of new generation Granger Causality test.
Furthermore, a VAR model and the Granger causality tests were performed for all 16 sampled countries, applying the multivariate VAR model estimation process using the following specification:
 $${Y_{it}} = {\delta _i} + \sum\limits_{j = 1}^P {{B_j}} {Y_{i,t - j}} + C{X_{it}} + {\mu _{it}}$$
where,
Yit = 17 × 1 vector of endogenous variables for unit i (=17, in which 16 country-level STU shares and prices) at time t,
Xit = 7 ×1 vector of strictly exogenous variables,
Ai = 17 × 1 vector of fixed effects (can also be a constant if not panel),
Bj = 17 × 17 coefficients matrices for lag j,
C = 17 × 5 coefficients matrix for exogenous variables,
μ it = 17 × 1 vector of error terms.
Figure 2 presents the temporal changes in the global real export price of rice and the average STU of the 16 sampled countries during 1961–2022. It shows a visible upward trend for the STU and a downward trend for the real export price of rice (Figure 2).
Relationship between real rice export price (US $/ton) and the average stock to use ratio (STU) of the 16 countries studied during 1961–2022. Source: Authors.

In time-series estimation, testing for unit roots is essential, as most econometric techniques require series to follow an AR(0) or AR(1) process. This study applied the GLS-based augmented Dickey-Fuller, Phillips-Perron, and Zivot-Andrews tests, which account for structural breaks (Table 1a, Appendix A). Results show that Argentina, Bangladesh, Brazil, India, Japan, and Nigeria follow an AR(0) process, while others exhibit AR(1) behavior. As cointegration allows models without first differencing, a Dickey–Fuller-based cointegration test was conducted and confirmed the existence of long-run relationships. Thus, the empirical analysis uses natural log-transformed levels of the data.
The Zivot-Andrews unit root test, which allows for a single structural break in the intercept and/or trend, indicates that the STU series for all sampled countries exhibit one structural break (Table 1a, Appendix A). To account for this, a common structural break dummy variable was constructed, taking the value of 1 for the years 1972 onward and 0 otherwise, and was incorporated into the panel VAR model. Historically, 1972 marked the beginning of the global food crisis, triggered by major crop failures in South Asia due to a failed monsoon (FAO, 1975). Following severe drought and production failure, Thailand, the leading rice-exporting country at the time, banned rice exports in April 1973 (Timmer, Reference Timmer2010). The Zivot-Andrews unit-root test thus truly identified the timing of structural breaks.
In a VAR model, selecting an appropriate lag length is crucial. Following Khim and Liew (Reference Khim and Liew2004), this study relies on the AIC criterion, which performs better with small samples (fewer than 60 observations). The test statistics suggested selecting two lag lengths. After estimating the VAR model, two-way causality tests are conducted using the Toda-Yamamoto approach (Toda and Yamamoto, Reference Toda and Yamamoto1995), which is a modified version of the original Granger causality procedure (Granger, Reference Granger1969). Following model estimation, standard diagnostic tests were performed, including the Lagrange Multiplier test for autocorrelation, the model stability test, and the Jarque-Bera test (Jarque and Bera, Reference Jarque and Bera1987) to assess the normality of residuals (Jarque and Bera, Reference Jarque and Bera1987). To check the robustness of the findings, the model specified in Eq. (6) is also separately estimated for the two endogenous variables using the Fixed Effects estimation method.
4. Findings and discussions
The estimated functions applying the panel VAR model estimation process are presented in Table 2a, Appendix A. The direct interpretation of the coefficients from a VAR model is complex. Thus, the explanation mostly relies on the Granger Causality test reported in Table 3.
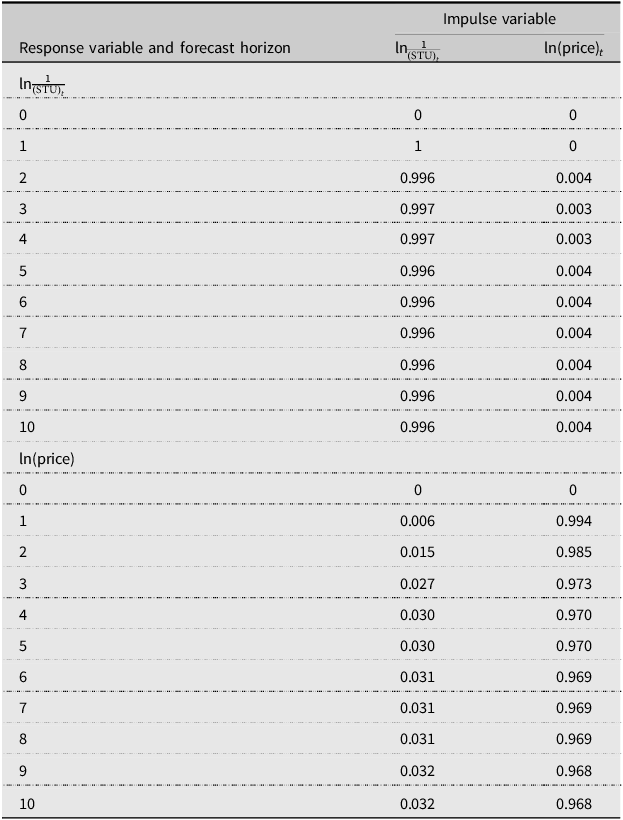
Forecast-error variance decomposition (FEVD) after panel VAR model.

FEVD standard errors and confidence intervals based on 200 Monte Carlo simulations are saved in file.
The Granger causality test results (Table 3 show that ln(price) does not Granger-cause ln(1/STU), but ln(1/STU) weakly Granger-causes ln(price). Conceptually, ln(1/STU) represents scarcity: as STU falls, scarcity rises, reflected in an increase in ln(1/STU), and vice versa. From Table 3a (Appendix A), the coefficient of ln(1/STU) is 0.025, indicating that a 1% increase in ln(price) is associated with a 0.025% decrease in STU. Overall, combining the Fixed Effects estimation and Granger Causality results, STU is negatively associated with global rice prices. The findings support the findings of Flanders (Reference Flanders2017), Good and Irwin (Reference Good and Irwin2015), Irwin and Good (Reference Irwin and Good2013) and Westcott and Hoffman (Reference Westcott and Hoffman1999). The diagnostic tests (Table 3a in the Appendix A) confirm no autocorrelation and model stability. Fixed Effects estimation shows that price and the inverse of the stock-to-use ratio have a significant, albeit weak, influence on each other (Table 3a, Appendix A). The structural break dummy indicates no shift in the inverse STU after 1972; however real rice export prices declined by 0.10% after 1972.
Among the exogenous variables, the global average per capita GDP significantly and positively affects the stock-to-use share (scarcity) and negatively and significantly affects the global rice price (Table 3a, Appendix A). In addition, crude oil prices and potassium prices have a negative and significant effect, while phosphate rock and urea prices have a positive and significant effect on the global rice export price. In contrast, phosphate rock and urea prices have a positive and significant effect on the global rice export price (Table 3a, Appendix A). The findings indicate that to maintain global rice prices stable, it is imperative to ensure a stable urea and phosphate rock supply in the global market. Overall, the results (Table 2) highlight the importance of closely monitoring rice STU for understanding and forecasting rice prices.
After the panel VAR model, an Impulse Response Function-based graph is presented in Figure 3 to examine the response of the reference variable due to a one standard deviation equivalent shock.
Impulse response graph after panel VAR model.

From the top left panel, it is evident that a positive shock to ln(price) initially increases ln(price) sharply, but the effect decays quickly and stabilizes around zero after approximately 5–6 steps. It indicates that a shock to rice price has a short-lived effect on itself. From the top right panel, a positive shock to ln(1/STU) (i.e., an increase in scarcity) initially pushes ln(price) down slightly, then price remains slightly lower (Figure 3). It means that an increase in scarcity (higher ln(1/STU)) does not immediately drive rice prices higher (Figure 3). Instead, Instead, it depresses the initial price slightly, though the effect is statistically insignificant as the confidence band crosses zero. From the bottom left panel, a positive shock to ln(price) leads to a mild increase in ln(1/STU) (scarcity) initially, but the effect is very small and fades over time (Figure 3). It means that a price shock slightly increases scarcity (lower stocks relative to use), but again, the effect is weak. Finally, from the bottom right corner, a positive shock to ln(1/STU) persists for many periods and declines gradually (Figure 3). It indicates a scarcity shock (higher ln(1/STU)) is persistent – scarcity doesn’t revert quickly.
In addition to the IRF graph, we have estimated and reported forecast-error variance decomposition (FEVD) after panel VAR model (Table 3). The FEVD results show that most of the forecast error variance of ln(1/STU) is explained by its shocks (about 99.6%), indicating that scarcity dynamics are largely self-driven. In contrast, for ln(price), about 3% of its forecast error variance by horizon 10 is explained by shocks to ln(1/STU), while the remaining 97% is explained by its shocks, suggesting that rice prices are primarily self-determined but slightly influenced by scarcity over time.
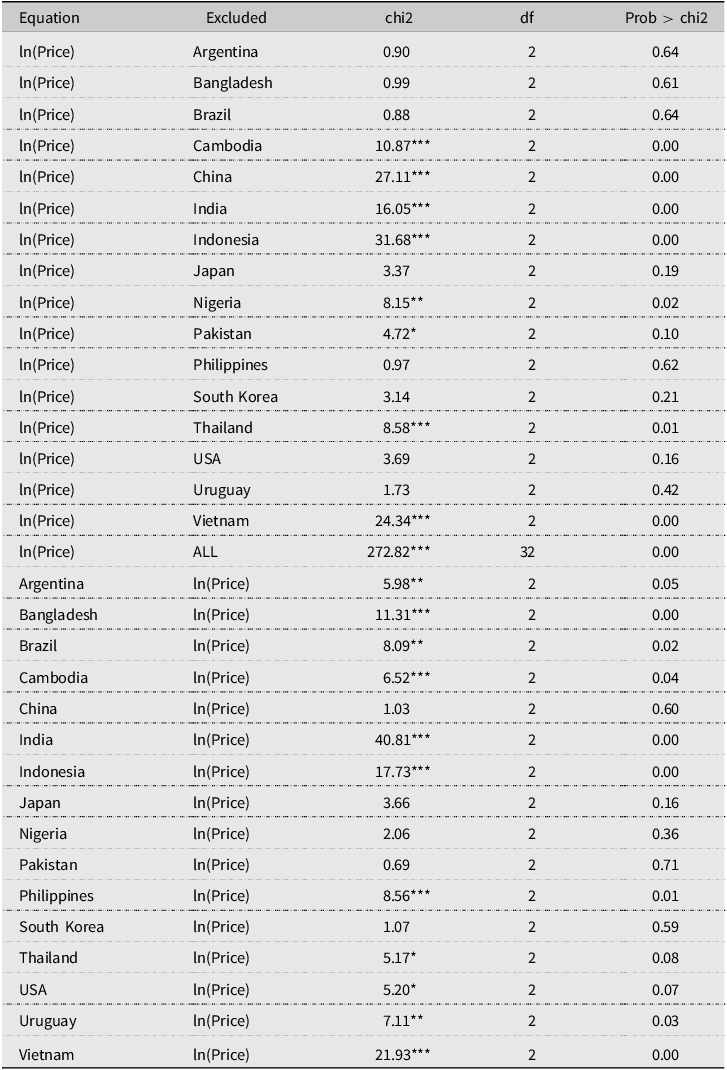
The country-specific function explaining ln(price) and ln(1/STU) applying VAR model are presented in Table 4a, Appendix A, followed by the Granger causality test in Table 5a. While the Causal relationship between price and STU are presented in Table 4, the country-to-country causal relationships are presented in Table 5a, Appendix A.

Based on the Granger Causality tests results reported in Table 4, to monitor rice market behavior through examining stock-to-use share, the stock-to-use share of Cambodia, China, India, Indonesia, Nigeria, Pakistan, Thailand and Vietnam should be closely monitored (Table 4). Among these countries Cambodia, India, Pakistan, Thailand and Vietnam are the major rice exporting countries. Conversely, except China, Japan, Nigeria, Pakistan and South Korea, rice price Granger Causes stock-to-use share of all other sampled countries. Importantly, despite being the largest rice stockpiling country in the world, Chinese rice stock is immune of global rice export price. The findings confirm the opinion of Dawe (Reference Dawe2009), who argued that China neither influences nor is influenced by global rice market trends due to its political nature. In this study, however, it is found that global rice price significantly influences the Chinese stock-to-use behavior but not vice versa (Table 4).
5. Conclusion and policy implications
Rice is a major staple in the world, and the main source of dietary energy for half of the world’s population. An observation of recent trends shows that the ending stock to consumption share of rice in the world has increased steadily from 2005 to 2020. Ending stocks are considered as a summary of commodity market conditions (Schewe et al., Reference Schewe, Otto and Frieler2017; Schnept, Reference Schnept2005), and in practice, its relationship relative to consumption, known as the stock-to-use ratio or STU, is commonly used as a predictor of price behavior. In general, a higher STU is interpreted as a reason for weak prices and vice versa (Schnept, Reference Schnept2005). Additionally, since the STU accounts for the effects of agricultural and trade policy on the market and rice often follows political trends rather than supply and demand logic in many Asian countries, using the STU to predict global rice prices has valuable implications.
Rice markets in many countries around the world, including China and India, are highly protected, and rice stocks in particular respond to political rather than market conditions. The empirical results from the panel VAR model provide evidence of a unidirectional Granger causality from STU to the global rice export price: rice STU significantly affects the global rice export price of rice, but the global rice export price has no significant influence on rice STU. When the relationship is examined at the country level, the rice STU of Cambodia, China, India, Indonesia, Nigeria, Pakistan, Thailand, and Vietnam significantly drives the global rice export price. In the case of Cambodia, India, Indonesia, Thailand, and Vietnam, however, a bi-directional relationship is identified between the STU of rice and the global rice export price.
The findings of this study help explain the recent surge in the stock-to-use ratios (STU) of rice globally. Rice remains the most important staple grain in countries such as Bangladesh, Cambodia, India, Indonesia, the Philippines, and Vietnam. The results show that the global rice export price significantly Granger-causes the STU in these countries, suggesting that governments may be increasing their buffer stocks in anticipation of future market crises and supply shocks.
Moreover, the unidirectional causal relationship from STU to price in China, India, Indonesia, South Korea, and Vietnam indicates that the stock behavior of these countries can substantially influence global rice export prices. Additionally, the inconsistent causal links between global rice market prices and the rice stock dynamics of major countries imply that, despite China holding the largest rice stock in the world, its rice market appears to be driven more by political considerations than by economic factors.
This is likely because rice plays a critical role in food and nutrition security in China, where average annual per capita consumption is approximately 132 kg, contributing about 25% of daily dietary energy intake (FAOSTAT, 2022b). By insulating its rice stockpile from global price movements, the Chinese government ensures a stable and adequate domestic rice supply. However, based on the findings, the STU-export price causal relationship of Cambodia, India, Indonesia, Thailand, and Vietnam can be informative and serve to monitor the global rice market more efficiently.
One potential limitation of this study is that, in estimating the country-level VAR models, the model stability tests could not provide conclusive confirmation of stability. Additionally, although the new-generation Toda–Yamamoto Granger causality tests were employed to explore the relationship between STU and price, the relatively small sample size may pose challenges, as highlighted by Maziarz (Reference Maziarz2015). While efforts have been made to address this limitation, further analysis may be necessary to provide greater clarity regarding the direction of causality. Additionally, this study focused exclusively on the bidirectional relationship between STU and price, without accounting for country-specific trade policies, economic conditions, or consumer behavior. Future research should incorporate these policy variables to enhance the model’s explanatory power and improve forecasting accuracy.
Supplementary material
The supplementary material for this article can be found at https://doi.org/10.1017/aae.2025.10020.
Data availability statement
The data in Stata format and the corresponding Stata do files are publicly available on Harvard Dataverse at the following https://doi.org/10.7910/DVN/UMFQOG.
Acknowledgements
The funding support of the Asian Development Bank Institute, Tokyo, Japan, is gratefully acknowledged. The authors also sincerely thank the reviewers for their valuable feedback and contributions, which have greatly enhanced the quality of this paper.
Authors contribution
All authors made equal contributions to this study.
Competing Interests
The authors declare that they have no competing interests related to the publication of this research. There are no financial, personal, or professional relationships that could be perceived as influencing the results or interpretation of this work.







 Open access

