Issues of economic inequality are at the heart of politics, and attitudes toward inequality are generally regarded as the most important defining characteristic of the political left-right continuum (Arian and Shamir Reference Arian and Shamir1983). Further, income inequality has increased dramatically in recent years both within the United States and within many European countries (Piketty and Saez Reference Piketty and Saez2001; Piketty and Saez Reference Piketty and Saez2006; Piketty Reference Piketty2014). As a result, economic inequality has reappeared as a key issue in the study of politics (Shaw and Gaffey Reference Shaw and Gaffey2012; Luttig Reference Luttig2013; McCall Reference McCall2013; Iversen and Soskice Reference Iversen and Soskice2015; Shariff, Wiwad and Aknin Reference Shariff, Wiwad and Aknin2016).
Numerous studies have investigated public attitudes toward inequality using a set of specific survey questions about the perceived and preferred earnings of people in different occupations. Two major conclusions have emerged from studies using these measures. First, by comparing answers to these survey questions with real pay data from various countries, scholars have repeatedly concluded that people generally want dramatically less economic inequality than what actually exists within their country (Kelley and Evans Reference Kelley and Evans1993; Svallfors Reference Svallfors1993; Svallfors Reference Svallfors1997; Kelley and Zagorski Reference Kelley and Zagorski2004; Osberg and Smeeding Reference Osberg and Smeeding2006). Second, these measures have also shown a seemingly strong consensus on the desired level of income inequality across the political spectrum. People to the left and to the right on the political spectrum exhibit a remarkable level of agreement about the ideal level of inequality (Kiatpongsan and Norton Reference Kiatpongsan and Norton2014). In this study we argue that both of these findings are artifacts of the questions commonly used to measure attitudes toward inequality.
Preferences for greater or lesser inequality are most frequently tapped using a series of questions about perceived actual pay of CEOs and workers, and ideal CEO and worker pay. These items have been widely used by many survey organizations including the General Social Survey in the United States (see, e.g., McCall Reference McCall2013), and, most prominently, the International Social Survey Programme (ISSP), an ongoing program of cross-national collaboration involving 53 countries. These measures tap preferences on inequality by first asking respondents what they perceive to be the average salaries of CEOs and workers in the national currency, and then immediately after asking for respondents’ preferences on what, ideally, the average CEO and worker should make. The ratio between the first two questions is then used as a measure of perceptions of actual pay inequality, while the ratio between the latter two questions is used as a measure of people’s preferences regarding ideal pay inequality. The higher the ratio of ideal CEO to worker pay, the more inequality a given respondent is assumed to prefer in his or her country. For purposes of our discussion, we refer to these two ratios as the Perceived Pay Ratio and the Ideal Pay Ratio, respectively.
As we demonstrate, people’s preferences regarding just pay are heavily anchored on the initial values they provide for perceived actual pay, both when such initial values are generated by respondents themselves, and when an initial value is provided. Further, we find that results may be highly dependent on the way in which these questions are asked; requesting salary amounts for CEOs and workers and having the researcher construct a ratio from them (e.g., $200,000/$25,000 or 8/1) results in answers indicating a much lower acceptance of economic inequality than asking directly about the desired ratio or multiple (e.g., CEOs should make eight times as much as workers). Our findings have implications for whether and to what extent people on the left and right share common views on inequality, as well as for how perceptions of just pay ought ideally to be assessed in international comparisons.
We begin our investigation by reviewing evidence from previous research on preferences for greater equality. Next, we use research on the anchoring effect to propose an explanation for the puzzling consensus on inequality across the political spectrum. Third, drawing on previous research on ratio bias and unit effects, we question whether the current measures actually tap people’s preferred levels of economic inequality. We then use cross-national survey data and original experimental data to test these proposed theories about current measures. Finally, in order to examine potential alternatives to these widely used measures of attitudes toward inequality, we use our experiment to examine six possible approaches and test their predictive validity.
SURPRISING CONSENSUS ON INCOME INEQUALITY
Most people vastly underestimate current economic inequality (Norton and Ariely Reference Norton and Ariely2011). Even within the United States, where a majority recognizes that inequality has increased during the last 20 years (Bartels Reference Bartels2005), Americans immensely underestimate levels of inequality. Indeed, across a host of western countries, there is widespread agreement among the mass public that income differences are too large (Svallfors Reference Svallfors1993; Svallfors Reference Svallfors1997; Kelley and Zagorski Reference Kelley and Zagorski2004; Osberg and Smeeding Reference Osberg and Smeeding2006). Furthermore, a majority of Americans favor a cap on very high incomes (Burak Reference Burak2013), and there appears to be a widespread, pervasive desire for less economic inequality.
This extensive agreement is not just found across western countries, but also between the people on the left and right within these countries: When asked to indicate their preferred distribution of wealth, respondents with differing political preferences exhibit “much more consensus than disagreement” (Norton and Ariely Reference Norton and Ariely2011). A recent study by Kiatpongsan and Norton (Reference Kiatpongsan and Norton2014) finds a similar pattern: using data from 40 countries, they find, first, that most people vastly underestimate actual wage inequality between CEOs and unskilled workers. In all of the countries where Kiatpongsan and Norton (Reference Kiatpongsan and Norton2014) compare estimates with actual data, estimated wage inequality with is significantly lower than the actual wage inequality. Second, the study shows that most people would prefer more equal pay, even compared to their own, low estimates of inequality. In the United States, for example, the actual pay ratio of CEOs to unskilled workers is 354:1, but respondents estimate the ratio to be only 30:1, and the median respondent has an Ideal Pay Ratio of just 7:1 (Kiatpongsan and Norton Reference Kiatpongsan and Norton2014). Surprisingly, preferences regarding Ideal Pay Ratios are also remarkably similar across respondents with differing semantic, that is, word-based, assessments of inequality. Kiatpongsan and Norton show this by comparing the group of people who “strongly agree” that current inequalities are too large with the group of people who “strongly disagree.” Surprisingly, they find that “the Ideal Ratios for both groups were strikingly similar (4.7:1 and 4.8:1)” (Kiatpongsan and Norton Reference Kiatpongsan and Norton2014, 590).
A comparably puzzling result was found when respondents were analyzed according to their political left-right self-placement. Respondents on the far left had an Ideal Pay Ratio of 3.4:1, while people on the far right had an Ideal Pay Ratio of 4.0:1, and people at the center of the political spectrum had the highest Ideal Pay Ratio of 5.6:1.Footnote 1 In other words, these authors suggest that a relative consensus exists across the political spectrum when it comes to the desired level of income inequality, just not of their semantic assessments of the severity of the current situation. This general agreement across the political spectrum fits well with Kiatpongsan and Norton’s (Reference Kiatpongsan and Norton2014) main claim about the universal desire for more economic equality. However, for more than two centuries, the distinction between left and right in politics has been taken to denote different positions on economic inequality (Arian and Shamir Reference Arian and Shamir1983). To be sure, left and right also refer to positions on other, non-economic, political issues, but multiple recent studies find that left-leaning voters are still—on average—more averse to economic inequality than right-leaning voters (Bartels Reference Bartels2005; Rekker et al. Reference Rekker, Keijsers, Branje and Meeus2017). Thus, it seems unlikely that people from opposite sides of the political spectrum should really agree on ideal levels of economic inequality, and for this reason alone, the pay ratio questions merit a closer look.Footnote 2
How do respondents communicate their Ideal Pay Ratios to survey researchers? Importantly, respondents are not asked to directly express their attitudes toward inequality when using this assessment technique. Instead, researchers derive preferences for levels of inequality by focusing on respondents’ numeric reports of what a “chairman” (CEO) and “an unskilled worker in a factory” ought ideally to earn annually. Using these items, the respondent’s ideal level of inequality is calculated by the researcher as the ratio of what a respondent thinks that a CEO should be paid relative to what he or she thinks an unskilled factory worker should be paid. Similarly, perceived inequality has been calculated as the ratio of what a respondent thinks that a CEO actually is paid to what he or she thinks an unskilled worker is paid.
Notably, when using the pay ratio technique, respondents never directly express an opinion about inequality; instead, the researcher constructs a measure of the respondent’s “preference” based on the open-ended numeric estimates that the respondent offers. Does this way of asking about economic inequality help explain the surprising agreement about inequality across the political spectrum? We first examine the possibility that this finding is an artifact of an anchoring effect.
THE ANCHORING OF ATTITUDES
Whenever people are asked to provide an answer to a question in the form of a number, either in a survey or in other situations, they are tasked with a rather difficult undertaking. People can in some circumstances provide meaningful answers to such questions about quantities (Ansolabehere, Meredith and Snowberg Reference Ansolabehere, Meredith and Snowberg2013). But unlike traditional close-ended survey questions, the number of possible answers to such a numerical question is, in principle, infinite. To make this task easier, people often rely on an “anchoring heuristic” (Tversky and Kahneman Reference Tversky and Kahneman1974). Using an anchoring heuristic means that people arrive at the answer about what a given number should be by starting at one value (an “anchor”) and then adjusting away from this number. However, this adjustment tends to be insufficient, and the answer will therefore be biased by the initial value, creating an anchoring effect.
Anchoring was first demonstrated in the seminal article by Tversky and Kahneman (Reference Tversky and Kahneman1974). In one of their experiments, respondents were asked to estimate the percentage of African countries in the United Nations. Before providing their own estimate, respondents were asked to indicate whether the actual number was higher or lower than a random number generated by spinning a wheel of fortune. These arbitrary random numbers turned out to have a marked effect on respondents’ answers. Respondents given a high random number provided much higher estimates than respondents given a low random number, despite the fact that they were aware the number was random.
The precise psychological mechanism behind the anchoring effect has been debated. While Tversky and Kahneman (Reference Tversky and Kahneman1974) originally explained it as insufficient adjustment from the anchor, others have argued that it should be viewed as a result of priming, where a given anchor activates consideration in favor of this estimate (Strack and Mussweiler Reference Strack and Mussweiler1997). Recent studies suggest that these explanations for the anchoring effect are not mutually exclusive, but rather complementary (Simmons, LeBoeuf and Nelson Reference Simmons, LeBoeuf and Nelson2010), and the multiple mechanisms might explain why the anchoring effect can be found across so many domains. It has been documented to occur in forecasting (Critcher and Gilovich Reference Critcher and Gilovich2008), value estimations of real estate (Northcraft and Neale Reference Northcraft and Neale1987) and probabilities on the risk of nuclear war (Plous Reference Plous1989). In fact “it is unusual in experimental settings not to be able to demonstrate it” (Furnham and Boo Reference Furnham and Boo2011).
Most of the experiments conducted on the anchoring effect have investigated how anchoring influences subjective judgments of factual numbers, not subjective valuations or preferences (Ariely, Loewenstein and Prelec Reference Ariely, Loewenstein and Prelec2003). However, a few studies have shown that anchoring works not only in relation to purely cognitive estimations of what some factual number is, but also in normative assessments of what a given number should be. For example, anchoring influences willingness to pay for specific goods (Wu and Cheng Reference Wu and Cheng2011), and decisions on how much to save for retirement (Choi et al. Reference Choi, Haisley, Kurkoski and Massey2012). Whether the anchoring effect can also be found with respect to assessments of just pay is so far untested.
When it comes to beliefs about the ideal level of economic inequality, an obvious potential anchor is the perceived level of current economic inequality. Further, this potential anchor is made highly salient in the ISSP question sequence because respondents are explicitly asked about their assessment of actual inequality in pay immediately before being asked about what the extent of inequality in pay should be. How might the anchoring effect explain the surprising finding that people appear to prefer the same level of pay inequality, regardless of their semantic assessment of whether current inequality is too great? We suggest that the reason for this finding is that people who regard current levels of inequality as too great—based on semantic assessments—also tend to provide numeric estimates of current inequality that are larger than the estimates given by people who are more accepting of inequality. If people’s numeric estimates of the current level of inequality serve as an anchor when giving subsequent numeric estimates of what economic inequality ought to be, this might explain why both groups arrive at roughly the same number when it comes to constructing a ratio of the ideal extent of economic inequality: first, due to anchoring on perceived current levels, respondents provide assessments of ideal CEO and worker pay that correlate with their perceived current pay. Second, while people who regard current inequalities as too large adjust more when moving from current to ideal pay, they also start from a higher anchor, meaning that they will tend to end up with Ideal Ratios very similar to people who are more accepting of inequality.
Consistent with these observations, Osberg and Smeeding (Reference Osberg and Smeeding2006) noted a strong correlation between perceived and Ideal Pay Ratios. They also suggested controlling for perceived inequality when analyzing Ideal Pay Ratios. However, whether this correlation is caused by anchoring effects remains unexplored so far, and subsequent studies have often analyzed Ideal Ratios without controlling for Perceived Ratios (e.g., Kiatpongsan and Norton Reference Kiatpongsan and Norton2014).
FROM RAW NUMBERS TO RATIOS
In addition to being susceptible to anchoring effects, we suspect that these widely used survey questions also suffer from what is known as “ratio bias” or “unit effect” (Pandelaere, Briers and Lembregts Reference Pandelaere, Briers and Lembregts2011). Importantly, while the questions described above ask about ideal levels of pay for a CEO and a worker, these pay measures are rarely used directly as indicators of preferences for greater or lesser inequality. Instead, it is the resulting ratio between these two numbers that presumes to be a meaningful measure of attitudes toward inequality. Take, for example, a respondent stating a preferred CEO pay of $200,000 and a preferred worker pay of $25,000. From a strictly logical point of view, these answers indicate that the respondent prefers that a CEO earn eight times as much as a worker. However, studies on unit effects lead us to suspect that this would not necessarily be this respondent’s answer, had we asked directly for a ratio instead of raw numbers: while $200,000/$25,000 is logically equivalent to 8/1, people often exhibit “ratio bias,” that is, they tend to perceive ratios as larger when they are expressed in terms of large numbers rather than small numbers (Burson, Larrick and Lynch Reference Burson, Larrick and Lynch2009).
The ratio bias effect, which also has been termed “denominator neglect” (Okan et al. Reference Okan, Cokely and Maldonado2012), the “numerosity effect” (Reyna and Brainerd Reference Reyna and Brainerd2008), and the “unit effect” (Pandelaere, Briers and Lembregts Reference Pandelaere, Briers and Lembregts2011), is a highly general phenomenon that affects decision making within several different domains (Denes-Raj, Epstein and Cole Reference Denes-Raj, Epstein and Cole1995) including games of chance (Kirkpatrick and Epstein Reference Kirkpatrick and Epstein1992; Denes-Raj and Epstein Reference Denes-Raj and Epstein1994), consumer purchases (Burson, Larrick and Lynch Reference Burson, Larrick and Lynch2009; Pandelaere, Briers and Lembregts Reference Pandelaere, Briers and Lembregts2011) and perceptions of risk. For example, people rate cancer as more dangerous when it is described as killing “1,286 out of 10,000 people” than when it is described as killing “24.14 out of 100 people” (Yamagishi Reference Yamagishi1997). Similarly, people tend to rate the potential for death as more risky when they are provided the number of deaths per year than when they are given the equivalent number of deaths per day (Bonner and Newell Reference Bonner and Newell2008). By the same token, a recent study shows that people are more averse to a tax increase when this increase is described in yearly costs rather than monthly costs (Pedersen Reference Pedersen2017). These latter two examples—deaths and taxes—also illustrate how ratio bias works in cases where the denominator is not explicitly spelled out.
Given the ubiquitousness of ratio bias effects, it seems reasonable to expect this effect to be at play when respondents answer numeric questions on pay for different occupations. Hence, we would expect the same multiple of difference between a CEO and worker to seem larger when expressed in dollars than when it is expressed as an explicit ratio. When the ratio between CEO and worker pay is expressed in dollars, for example, $200,000 versus $25,000, the inequality in wages will be perceived as being larger than when the same relationship is simply described as a CEO making eight times as much as a worker. Consequently, we expect that asking directly about multiples instead of raw dollars will lead to substantially higher Ideal Pay Ratios.
METHODS
As a first step in testing our two central hypotheses, we reanalyze the existing data used in many studies of inequality. As noted, the ISSP pay ratio data have been used by many researchers as measures of desired levels of economic inequality (Kelley and Evans Reference Kelley and Evans1993; Svallfors Reference Svallfors1993; Svallfors Reference Svallfors1997; Kelley and Zagorski Reference Kelley and Zagorski2004; Kiatpongsan and Norton Reference Kiatpongsan and Norton2014). We use the 2009 data set that is based on respondents from 40 different countries. We limit our analyses to cases without missing values on the variables of interest to us, which still leaves us with 23,096 respondents. A widely acknowledged challenge with using the pay ratios between a CEO and a worker is that this calculated variable is heavily right-skewed and contains some extreme outliers. To account for this, we used the same approach as in previous studies (e.g., Kelley and Evans Reference Kelley and Evans1993), by taking the natural log of both variables in our analyses. We use these ISSP variables for purposes of evaluating whether measures of preferences on inequality are influenced by anchoring effects.Footnote 3
In addition to re-analyzing existing data, we conduct an online experiment to evaluate the hypothesis that further measurement error is produced by ratio bias effects. Unlike the ISSP analyses, this study was designed explicitly to compare alternative measurement strategies, and to evaluate their predictive validity. Using subjects recruited through Amazon’s Mechanical Turk (MTurk), we manipulated whether respondents were asked these income questions in terms of raw dollars (similar to ISSP), or in terms of the multiple of the average worker’s income that should equal the CEO’s income.Footnote 4
A second, three-level experimental factor altered the Anchoring Context in which the Ideal Pay Ratio was elicited. One level of this factor asked respondents either for estimates of Perceived Incomes first, and Ideal Incomes second. A second level of this factor reversed the order, asking for Ideal Incomes first, and Perceived Incomes second. The third level of the Anchoring Context factor gave respondents the correct anchor for existing salaries or multiples in the United States context, and then asked for their Ideal Incomes, expressed in terms of either dollars or multiples, based on their assigned level for the first factor. (Exact question wordings can be found in Online Appendix A.) These two factors comprised a 3 by 2 full-factorial experimental design, and 577 respondents were randomly assigned to one of these six different ways of eliciting an Ideal Pay Ratio.
In addition to evaluating whether these measurement approaches generate systematically higher or lower estimates of ideal levels of inequality, we used this original data collection as an opportunity to better establish the predictive validity of alternative measures of Ideal Pay Ratios. Respondents were therefore also asked for their views on 25 different questions involving economic inequality. These items involved strictly word-based answers, without reference to numbers, with greater support for inequality consistently coded as the higher scores. As shown in Online Appendix B, these included general questions about differences in income as well as policies designed to reduce inequality. These items formed a unidimensional and highly reliable index of attitudes toward economic inequality (α=0.94), so we took the standardized mean value across all 25 semantic questions to serve as each respondent’s attitude toward economic inequality (exact question wordings can be found in Online Appendix B). This index allows us to ascertain which measurement strategy best predicts the kinds of outcomes it should.
Our experiment on MTurk, which was conducted in December 2014, was available to residents of the United States that were at least 18 years of age.Footnote 5 MTurk respondents do not constitute a probability sample of the general population, but this is not problematic because we do not use them to estimate effect sizes for treatments in the population as a whole. Instead, we use them to experimentally test our hypotheses involving how two different factors (raw dollars versus multiples of the average worker’s income and Anchoring Context) affect the estimates that respondents are likely to give. In addition, while we do not claim our sample is a representative population-based sample, or that the experimental results perfectly mirror those from such a representative sample, we note that Mturk samples are more representative than samples consisting of college students (Berinsky, Huber and Lenz Reference Berinsky, Huber and Lenz2012).
RESULTS
Re-Analysis of ISSP Surveys
To what extent are Ideal Pay Ratios susceptible to anchoring effects? If this measure constructed from Ideal Income numbers effectively taps respondents’ attitudes toward inequality, then it should meet several basic predictive criteria. First, the Ideal Pay Ratio should correlate with the semantically expressed indicator that the respondent believes differences in income are too large; in other words, those who desire a smaller ratio (i.e., smaller differences in income between CEOs and workers) should be more likely to agree that income differences are too large. In addition, if the measure represents attitudes toward inequality, then respondents on the right should express views consistent with less of a desire for equality than respondents on the left. Because items asking about perceived pay are generally asked first, we hypothesized that the higher the perceived current ratio for current CEOs to workers, the higher the Ideal Ratio should be as well.
Table 1 shows three ordinary least squares regression models. The dependent variable in all models is the natural log of the Ideal Pay Ratio between a CEO and an unskilled worker. In Model 1 we replicate the previous findings from Kiatpongsan and Norton (Reference Kiatpongsan and Norton2014) and others, showing that respondents’ attitudes toward economic inequality are very poor predictors of their Ideal Pay Ratio. There is no significant linear relationship between a respondents’ attitude on whether current differences in income are too largeFootnote 6 and their Ideal Pay Ratio between a CEO and an unskilled worker.
Predicting Respondents’ Ideal Pay Ratio (CEO/Worker)
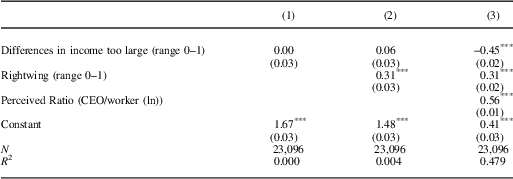
Note: Entries are ordinary least squares regression coefficients predicting the natural log of respondents’ ideal pay ratios, with robust standard errors in parentheses.
*p<0.05, **p<0.01, ***p<0.001.
In Model 2, we include respondents’ left-right position. While this model shows that people on the right side of the political spectrum want a higher pay ratio, the impact of this variable is very small (R 2<0.01). Hence, while the coefficient is statistically significant, the explanatory power of this variable is so limited that it is arguably correct to state that people to the left and people to the right differ very little in their views about the Ideal Pay Ratio.
In Model 3 we take into account potential anchoring based on Perceived Pay Ratios. As shown in the third column of Table 1, the inclusion of this variable has a tremendous effect. First, the model has much greater explanatory power (R 2=0.48). Second, when controlling for this variable, we see, consistent with what one would expect, that the more people agree that income differences are too large, the more they suggest lower Ideal Pay Ratios. This relationship is suppressed in Model 1 (and in Kiatpongsan and Norton Reference Kiatpongsan and Norton2014), because people who regard current inequality as being too large also estimate the factual, current inequalities to be larger than people who did not find current inequalities to be too large. In Model 3 the respondent’s attitude toward whether current differences in income are too large predicts Ideal Pay Ratios, although much more weakly than the Perceived Pay Ratio. Excluding the respondent’s attitude toward whether current differences in income are too large lowers R 2 by less than 0.01.Footnote 7 The results in Table 1 are thus consistent with the anchoring hypothesis; Perceived Ratios play an important role in anchoring Ideal Pay Ratios, and the semantic question only correlates logically with Ideal Ratios once this anchoring has been taken into account.
It is still possible that people’s Ideal Pay Ratios are meaningful so long as they are evaluated relative to their Perceived Pay Ratios. Even if people are wildly inaccurate in suggesting salary numbers, these numbers may still locate the respondent correctly with respect to general attitudes toward whether there is too much or too little inequality. To test this proposition, we divided respondents into three groups: (1) those whose Perceived Ratio was higher than their Ideal Ratio and who logically should agree that differences in income are too large; (2) those whose Perceived Ratio was lower than their Ideal Ratio and thus who should disagree that differences in income are too large; and (3) those who provided Ideal and Perceived Ratios that were exactly the same, thus suggesting that they should either disagree that income differences are too large, or neither agree nor disagree.
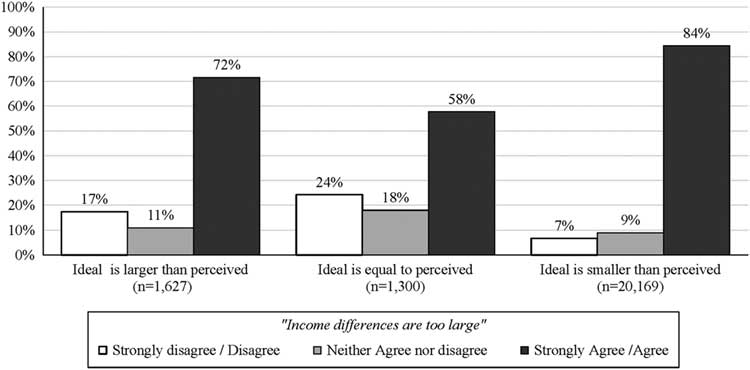
As shown in Figure 1, majorities of respondents agreed that differences in income were too large, even when providing ratios that suggested precisely the opposite. Among those who provided Ideal Ratios that were smaller than their Perceived Ratios, a full 84 percent chose the logically consistent answer to the semantic question and agreed that income differences were too large. However, among those who provided equal perceived and Ideal Ratios, a surprising 58 percent nonetheless agreed that differences were too large. Even more damaging to validity, as illustrated by the leftmost dark gray column of Figure 1 we see that among those who provided Ideal Ratios that were larger than Perceived Ratios, a full 72 percent gave a wholly inconsistent semantic assessment indicating that they agreed that differences in income were too large. Clearly this pattern of results makes little sense if Perceived and Ideal Ratios represent what previous scholars have assumed.
Lack of correspondence between semantic assessment of income differences and pay ratios Note: Bars represent the percentage that answered as indicated on the semantic question about whether income differences are too large (conditional on their answers regarding Ideal and Perceived Pay Ratios).

Of course, all measures, semantic or otherwise, contain measurement error. But what is particularly problematic about the pattern observed in Figure 1 is that the measurement error is highly systematic. If we assume that people are indeed capable of providing word-based answers about whether they think inequality is too great (a reasonable assumption in our view), then measurement error systematically increases the more a person disagrees that income differences are too large. For example, among all of those respondents who agree or strongly agree that differences in income are too large (the three dark gray bars in Figure 1), only 10 percent provide Perceived and Ideal Ratios that are inconsistent with their stated views. However, among those who disagree or strongly disagree that income differences are too large (the three white bars), 69 percent provide Perceived and Ideal Ratios that do not accurately reflect that view. This is not what we would expect if pay ratios mimicked semantic assessments: Had this been the case, the white bar on the far left would mirror the tall black bar on the far right. Instead, people overwhelmingly agree that income differences are too large even when they provide pay ratios in which the Ideal Ratio is larger than what they perceive to be the actual ratio. Thus, use of the ratios is especially likely to misrepresent the views of those who do not believe inequality is too high.
In sum, the analyses of the ISSP data strongly suggest that the Ideal Pay Ratios elicited in surveys are dramatically impacted by an anchoring effect. Respondents’ estimates of current incomes serve as anchors when they estimate what Ideal Incomes ought to be. As a result, perceived and Ideal Pay Ratios have little to no predictive validity as measures of the levels of inequality people say they actually desire in their countries. They do not correlate with views about whether inequality is too little, too great or about right, and they bear little relationship to left-right views. Once the anchoring effect is taken into account, the relationship between Ideal Pay Ratios and semantically assessed attitudes is quite logical, but using researcher-constructed ratios from respondent-generated salary amounts is clearly a highly error-prone approach to measuring preferences for greater or lesser equality. In order to evaluate whether these measures are additionally plagued by ratio bias, we turn next to our experimental results that systematically alter the context in which respondents answer questions about actual and ideal pay.
Experimental Results
As in the analyses of the ISSP data, the dependent variable in our experiment is the natural log of the Ideal Pay Ratio between a CEO and a worker. Because we have a 3 (Anchoring Context)×2 (raw dollars versus multiples) experimental design, we begin our analysis with a two-way factorial analysis of variance to analyze potential main effects. As predicted, the analysis shows a significant main effect of Anchoring Context (F (2,573)=9.43, p<0.001), as well as a significant main effect of raw dollars versus multiples (F (1,574)=42.22, p<0.001).Footnote 8
The effect of different Anchoring Contexts is illustrated in the left-hand side of Figure 2. As can be seen, changing the order in which actual and Ideal Pay Ratios were asked had little effect on the Ideal Pay Ratio. For respondents providing Ideal Ratios before actual ratios, the mean logged Ideal Ratio is 2.7, while respondents providing actual ratios before Ideal Ratios have a mean logged Ideal Ratio of 2.4 (difference is non-significant, p=0.24). These results do not demonstrate that respondents’ perceptions of actual pay ratios anchor their responses to Ideal Pay Ratios. However, they do not necessarily demonstrate that anchoring effects are completely irrelevant either. We cannot rule out the possibility that in order to generate estimates of how much they would like people to make, they may rely on perceptions on much they think people currently make, even when they are not explicitly prompted to voice these estimates by the preceding question to do so. Our initial comparison does not definitively demonstrate an anchoring effect or lack thereof, but it remains important because it tells us that if answers are potentially biased by anchoring, changing the order of questions in ISSP and other surveys will not solve the problem.
The effect of Anchoring Context and dollars versus multiples on Ideal Pay Ratios (with 95 percent confidence intervals) Note: Points represent the average natural log of Ideal Pay Ratios by experimental factors. The three by two analysis of variance produced two significant main effects, one for anchoring context (F (2, 573)=9.43, p<0.001), and one for dollars versus multiples (F (l,574)=42.22, p<0.001). Asking in terms of multiples produces significantly higher Ideal Pay Ratios than dollars (p<0.001), and providing a common actual pay ratio anchor before asking about the Ideal Pay Ratio produces a significantly higher Ideal Pay Ratio (p<0.01).)
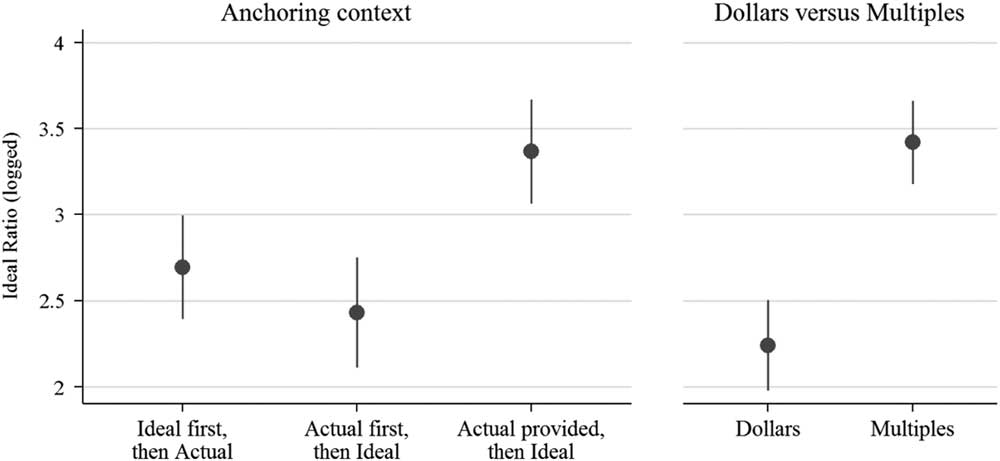
More importantly, when we compare respondents that were supplied with information on the actual pay ratio, either in the form of information on CEO and worker pay in dollars or directly in the form of the actual ratio between these amounts, it becomes clear that anchoring effects are at work. Providing the same anchor for actual pay to all respondents significantly increased the mean logged Ideal Pay Ratio to 3.4. This value is significantly different from the other two Anchoring Contexts (p<0.01).
The effect of asking directly in multiples, rather than in raw dollars, is illustrated on the right hand side of Figure 2. The effect of asking in terms of multiples rather than raw salary amounts was to significantly increase the Ideal Pay Ratio expressed by respondents. Respondents providing answers in raw dollars had a mean logged Ideal Ratio of 2.2, whereas respondents answering directly in multiples had a mean logged Ideal Ratio of 3.4 (significant difference, p<0.001). These results are perfectly consistent with previous findings from psychological and market research literature on ratio bias: differences described in dollars tend to be perceived as larger than the same differences described in terms of a ratio, and respondents consequently seem to express less egalitarian preferences when asked about pay differences in multiples rather than dollar amounts.
The Predictive Validity of Pay Ratio Measures
Our analyses have so far shown that Ideal Pay Ratios are problematic measures of attitudes toward economic inequality. Pay ratios are clearly influenced by anchoring effects and by whether they are elicited in raw dollars or multiples. These effects are troubling in that they indicate problems with using the Ideal Pay Ratios as valid measures of desired levels of equality. The anchoring effect exists because people apply the anchoring heuristic in cases where they are unsure about the right answer. When people are confronted with easy numerical questions, for which people are not in doubt about the appropriate answer, we do not expect to see anchoring effects, as evidenced by the fact that anchoring effects within a given field are generally smaller among experts (Kaustia, Alho and Puttonen Reference Kaustia, Alho and Puttonen2008; Furnham and Boo Reference Furnham and Boo2011). Strong anchoring and ratio bias effects may therefore be an indication that people are offering little more than wild guesses.
In our final set of analyses, we investigate the predictive validity of the six different measurement approaches outlined in our experiment. If these items tap what they are intended to measure—preferences for greater or lesser economic equality—then they should be strongly associated with semantic measures of attitudes toward economic inequality. Using our 25-item index, in Figure 3 we illustrate the strength of the relationships between our index of attitudes toward inequality and the various measures of Ideal Pay Ratios.
Correlations between Ideal Pay Ratio and index of attitudes toward inequality, by experimental factors Note: Bars represent the size of the correlation between the average natural log of the Ideal Pay Ratio and the index of attitudes toward inequality, by experimental factor. A test using Fisher’s r-to-z transformation (Fisher Reference Fisher1921; Cox Reference Cox2008) confirmed that the correlation in the actual provided conditions (r=0.34) was significantly higher (p<0.05) than the correlations in the ideal first conditions (r=0.13) and the actual first conditions (r=0.12).
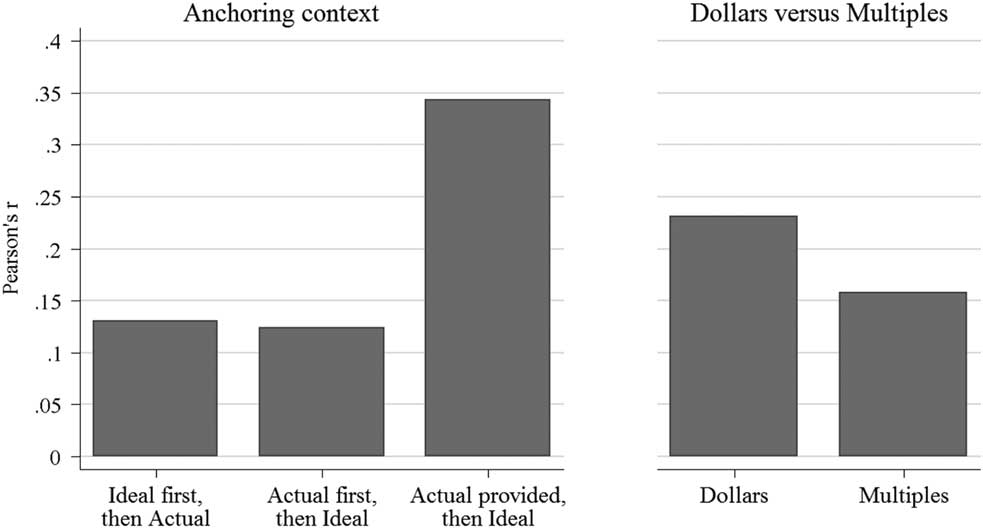
As shown in Figure 3, the correlations between attitudes toward inequality and the Ideal Pay Ratios vary a great deal, and the correlations are clearly highest in the conditions where respondents were given the factual anchor before providing their own numbers. A test based on Fisher’s r-to-z transformation (Fisher Reference Fisher1921; Cox Reference Cox2008) confirms that the correlation in the conditions where an actual anchor was provided (r=0.34) is significantly higher (p<0.05) than the correlations in the conditions where Perceived Pay Ratios were asked before ideal (r=0.12) and the conditions where Ideal Pay Ratios were asked before perceived (r=0.13). When everyone, regardless of their political predispositions, receives the same anchor, their adjustment away from this anchor is, to some degree, a measure of their preferences for decreased inequality. In contrast, when people are not given an anchor, their Ideal Pay Ratios reflect their own self-generated anchor as well as their adjustment away from this anchor, which makes the Ideal Pay Ratio a less valid measure of attitudes toward economic inequality.Footnote 9
Thus far, we have evaluated the predictive validity of Ideal Pay Ratios by virtue of their relationships with criterion variables such as left-right leanings and an overall index of attitudes toward inequality. But if such pay ratio questions are worth additional survey time, they should be capable of capturing more about respondents’ attitudes than the usual indicator of ideology or party identification. In addition to being consistent with ideological leanings, they should also be able to capture the component of people’s attitudes toward inequality that are specific to this particular issue. In other words, beyond party and ideology, are Ideal Pay Ratios capable of predicting the component of attitudes toward inequality that is unique to this issue? In order to test this hypothesis, we subjected our pay ratios to one additional, more stringent, test. In this case we used the ratios to predict our index of attitudes toward inequality after controlling for party identification and ideology.
Table 2 shows the predictive power of Ideal Pay Ratios broken down by our two experimental factors, whether respondents were asked in terms of multiples versus dollars, and whether the actual pay question was asked before or after the ideal, or actual was provided. As in previous analyses, we find no obvious advantage or disadvantage to using dollars versus multiples. However, consistent with our previous findings, the only Ideal Pay Ratio that successfully predicted the index of attitudes toward inequality after controlling for party and ideology is the one in which respondents were given accurate information about actual inequality before being asked about ideal levels. Moreover, as indicated by the R 2s in these models, the model in which anchors were provided is the strongest model for purposes of explaining the index of attitudes toward inequality. The results thus consistently suggest that regardless of the criteria used to evaluate various approaches to measuring people’s preferred level of inequality, our findings are the same. The Ideal Pay Ratio with a provided anchor correlates most strongly with left-right orientations just as such measures should, and it also best predicts non-numeric measures of attitudes toward inequality.
Extent to Which Ratios Predict Index of Attitudes Toward Inequality, After Controlling for Ideology and Party, by Dollars Versus Multiples and Order
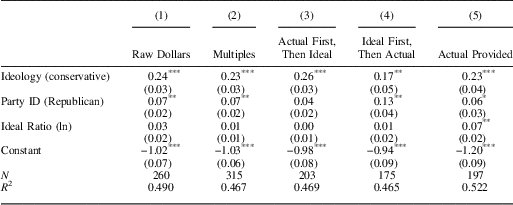
Note: Entries are ordinary least squares regression coefficients predicting the index of attitudes toward inequality by experimental conditions, with robust standard errors in parentheses.
*p<0.05, **p<0.01, ***p<0.001.
CONCLUSION
It is easy to see why Ideal Pay Ratios are alluring for scholars in search of a measure of attitudes toward economic inequality: the measure is continuous, provides ample variance, and it is convenient in cross-national research and readily comparable to real world data on economic inequality. It is thus understandable that this operationalization has been used in so many studies within the field (Kelley and Evans Reference Kelley and Evans1993; Svallfors Reference Svallfors1993; Svallfors Reference Svallfors1997; Kelley and Zagorski Reference Kelley and Zagorski2004; Osberg and Smeeding Reference Osberg and Smeeding2006; McCall Reference McCall2013; Kiatpongsan and Norton Reference Kiatpongsan and Norton2014; Trump Reference Trump2017). Our study has, however, shown that the use of pay ratios as a measure of attitudes toward inequality is highly problematic.
The first problem with the Ideal Pay Ratio measure is that it is heavily affected by the anchoring effect, and people’s Ideal Pay Ratios are therefore far more influenced by their assessment of current inequality than by their political predispositions. As demonstrated in our analyses of ISSP data, a consequence of this anchoring effect is that extant analyses of pay ratios overstate the level of agreement on ideal levels of inequality across the political spectrum. Further, the strong anchoring effect also complicates cross-national comparisons: The classic study by Svallfors (Reference Svallfors1997), for example, was correct in concluding that there were large differences in Ideal Pay Ratios between people in different countries. But such differences cannot be interpreted simply as attitudinal differences between the populations in these two countries. These differences are also—to a very large degree—driven by differences in perceptions regarding current levels of inequality.
The problem of anchoring can be addressed, although not necessarily solved, by controlling for people’s perceptions of actual inequality, as we did in our re-analysis of the ISSP data, and as Osberg and Smeeding (Reference Osberg and Smeeding2006) suggested more than a decade ago. Alternatively, one can address the problem by providing people with information about current incomes before asking them about Ideal Incomes, as we did in our experiment. The experiment confirmed that when respondents are provided with a shared anchor, the predictive validity of Ideal Pay Ratios is increased. Therefore, if scholars for some reason want to use Ideal Pay Ratios as a measure of people’s attitudes toward economic inequality, then they should provide respondents with an anchor.
However, there is still the second problem with Ideal Pay Ratios, namely their susceptibility to ratio bias effects. Our experiments demonstrated that people’s Ideal Pay Ratios become significantly and substantially higher when they are asked for these ratios in multiples rather than in dollars. This result suggests that people are not necessarily as radically egalitarian as one would think based on the typical measure. However, the large effect caused by this change in question format may also suggest that the absolute level of researcher-constructed Ideal Ratios have little meaning. Hence, we would caution researchers against interpreting Ideal Pay Ratios as measures of absolute levels of desired inequality. Ideal Pay Ratios are, at best, measures that provide a relative indication of people’s attitude on inequality. Because they are seductively comparable to real world data on income inequality, it is far too easy to claim that a given ratio is what the people “want.” Both scholars and policymakers should refrain from interpreting these measures as desired levels of equality. Scholars wanting information on Ideal Pay Ratios may consider asking directly for multiples rather than amounts in raw dollars, in order to reduce the number of survey questions that must be asked. However, as shown in our experiment, asking in multiples rather than dollars does not seem to increase the modest predictive validity of pay ratios.
In sum, the findings in this paper should serve as a caution to comparative scholars interested in studying economic inequality. The most widely available and widely used measures appear to be highly problematic as measures of attitudes toward inequality. The value of the Ideal Pay Ratio question is limited and leads to misleading conclusions unless scholars pay close attention to anchoring effects and ratio bias effects when interpreting the measure.
More generally, the results of this paper serve as an example of how numerical questions should be treated with caution, both when designing and interpreting surveys. People may in many cases be able to provide quantitative answers, for example, when the question is exceedingly simple—such as supplying one’s age—but the relationship between people’s attitudes and these numeric values is tenuous. Although in studies of economic matters it is especially tempting to ask survey respondents to volunteer numbers, such questions can easily lead scholars astray.
It is undoubtedly dramatic to announce that liberals and conservatives surprisingly share similar views on the need for greater equality, or that people across the globe are radically egalitarian compared to the status quo. Unfortunately, careful analyses and close attention to the validity of survey measures leads to less startling, yet more consistent findings.