


1. Introduction
Automatic voter registration (AVR) systems register to vote all eligible individuals who transact with proscribed government agencies, most commonly the Department of Motor Vehicles (DMVs), barring opt-out. Twenty states plus the District of Columbia have authorized some form of this policy since 2015, with several additional states considering adoption.Footnote 1 Notably, this is more than the number of states adopting “active” motor voter laws in the 1980s and early 1990s, a trend that sparked national legislation—the National Voter Registration Act (NVRA)—that passed in 1993 (Knack, Reference Knack1995).Footnote 2
Straightforward analysis of the effect of AVR on voter turnout is hindered by various causal inference problems. AVR is implemented in a state all at once, making it difficult to construct a reasonable counterfactual. The base turnout rate of AVR-registered voters is biased upward because of the presence of voters in this pool who would have registered through traditional means and voted regardless of AVR. Temporal comparisons will be potentially biased either upward or downward, due to omitted variables particular to each election cycle: variation in the offices with competitive races, the level of excitement for individual candidates, or money spent on mobilization efforts. Likewise, geographic cross-sectional analysis within a state is potentially biased because the areas with high AVR take up rates are systematically different than areas with low AVR usage in a myriad of ways potentially correlated with turnout.Footnote 3 Like temporal analysis, these omitted variables could bias estimation of the effect of AVR on turnout either upward or downward. For example, high AVR usage geographies with younger demographics could negatively bias turnout estimates whereas high AVR usage in geographies with competitive races could positively bias turnout estimates. These causal inference challenges make it difficult to isolate the turnout effects of this important and rapidly spreading election reform.
Our insight in this paper is to take advantage of an exogenous reason why an individual is registered to vote through AVR—the voter's birth date—and use this exogenous reason as a way to gain causal leverage on the impact of AVR on turnout. In a number of states, driver's licenses expire on birthdays, causing some individuals to be more likely to visit the DMV, and hence be registered or have their records updated via AVR, in the period prior to their birthday. This is important because only those individuals registered prior to the registration deadline are eligible to vote in a subsequent election. Therefore, the precise date of one's birthday has an influence on potential voting patterns, long after one turns 18 years old and gains initial voting eligibility.
We take advantage of this exogenous variation, comparing the registration and turnout rates of individuals born prior to the registration deadline to individuals born after the registration deadline (within a reasonable time range—see below for details). This point of causal leverage allows us to construct precise estimates of the effect of AVR on voter turnout for two states, California and Oregon. The results are confirmed with a sensitivity analysis that leverages the additional predictive power of birth year on license renewal patterns. We then construct causal estimates of AVR on registration, disentangling AVR registrants who are likely to register outside of DMV visitation or with previously implemented motor voter registration opportunities. The results show a significant and positive impact of AVR on turnout, particularly in back-end AVR systems.
2. Literature review
All states except North Dakota require voter registration, and these records are used by election administrators for election planning and administration, such as for assembling voter lists, distributing ballots, and allocating voting equipment. Ever since the Help America Vote Act of 2003 required states to maintain centralized voter registration databases, these lists have become an essential part of election administration (Kropf and Kimball, Reference Kropf and Kimball2011) and voter contact and mobilization (Hersh, Reference Hersh2015).
While there are varying views on the need for voter registration, scholars have shown for decades that registration acts as a barrier to participation. In response, many states, and eventually the Federal Government, took action to reduce the burdens created by registration requirements. AVR is, in this respect, only the most recent version of an extension of the motor voter laws that became commonplace in the American states in the 1980s and 1990s. These laws culminated in the passage of the National Voting Registration Act of 1993 (NVRA), which among other things, mandated that states offer voter registration at government service agencies. DMVs became an important part of the voter registration system in the states, although always in a voluntary, opt-in manner on behalf of the registrant.
Motor voter laws have been extensively studied by academic researchers. These laws add voters to the rolls (Wolfinger and Hoffman, Reference Wolfinger and Hoffman2001) and produce more representative voter rolls in terms of income and age (Hill, Reference Hill2003; Rugeley and Jackson, Reference Rugeley and Jackson2009). Wolfinger and Hoffman (Reference Wolfinger and Hoffman2001) note that the impact on representativeness is particularly pronounced when the legislation is effectively implemented in state agencies beyond the DMV, especially public assistance offices (see also Williamson et al., Reference Williamson, Cataldo and Wright2018). The effect of motor voter laws on turnout, however, is less clear. The strongest effects were found in states voluntarily implementing their own motor voter programs prior to NVRA. These results hold cross-sectionally (Franklin and Grier, Reference Franklin and Grier1997) as well as in fixed effect models using time-series cross-sectional data (Knack, Reference Knack1995; Rhine, Reference Rhine1995). Single-state analyses provide mixed results, with positive effects found by Highton and Wolfinger (Reference Highton and Wolfinger1998) in Colorado and Hanmer (Reference Hanmer2009) in two of four states analyzed (Michigan and North Carolina). Work by Piven and Cloward (Reference Piven and Cloward2000) highlights the variance in implementation among states adopting these laws prior to the national legislation, potentially explaining these mixed effects. Putting aside variance, Brown and Wedeking (Reference Brown and Wedeking2006) argue that motor voter laws “alter(ed) the long standing relationship between registration and turnout” precisely because the laws succeeded in adding many new registrants to the rolls, but among those with a low propensity to turn out to vote.
Regardless of policy or implementation, however, the causal relationship between changes to registration laws, composition of the rolls, and ultimately turnout remains difficult to isolate. The endogeneity of motor voter laws must be considered, even in fixed effects analysis. The conditions that lead states to adopt motor voter laws might be the very conditions that foster stronger voter turnout, regardless of the policy change. Thus even positive and significant results cannot necessarily be attributed causally to the passage of motor voter legislation.
The adoption of the NVRA is, of course, not endogenous to state-specific characteristics. However, estimating an overall effect of the national legislation is dubious, in part because of the extremely varied commitment to implementation (Highton and Wolfinger, Reference Highton and Wolfinger1998). Knack (Reference Knack1999) points out that the first presidential election following the implementation of NVRA had the lowest voter turnout rate since 1924 in addition to the lowest aggregate decline since 1920. Hanmer (Reference Hanmer2009) found positive and significant results in turnout for the subset of states that actively implemented NVRA, but Brown and Wedeking (Reference Brown and Wedeking2006) found no lasting changes. This research faces some of the same causal inference problems that we wrestle with here: variation in implementation by state means that the potential problem of state-level endogeneity again arises, calling into question any significant findings.
There is good reason to believe that AVR might be more successful than previous motor voter laws at increasing voter turnout. Research has confirmed the substantial effects of moving from opt-in to opt-out systems (Sunstein and Thaler, Reference Thaler and Sunstein2008), which means the net cast by AVR will be much wider than traditional motor voter laws. Indeed, non-rigorous analysis of turnout is encouraging: Oregon's voter turnout as a percentage of the voting eligible population increased 4.1 percent from 2012 to 2016, the highest of any state during that time period, and increased another 9 percent in 2020 (national turnout increased 7.5 percent from 2016 to 2020). California's 2018 midterm turnout increased by a whopping 18.9 percent from 2014 levels.Footnote 4 Unfortunately, these non-rigorous analyses, while suggestive, are not a good way to produce precise estimates of the turnout effects of AVR. Comparing a state's subsequent voter turnout to previous years or other states could either overestimate or underestimate AVR's effect size; one simply cannot disentangle AVR from other factors influencing state voter turnout, such as voter interest. This is true even with more sophisticated comparative methods, such as the use of synthetic controls (McGhee et al., Reference McGhee, Mehlotra and Romero2019). Although matching and weighting states based on previous turnout, as is done in synthetic control models, increase the equivalency of comparison groups based on historical metrics, it still cannot account for differences that arise in any given state election; an usually competitive gubernatorial race or initiative campaign will differentially affect a state from its synthetic control matches in the post-treatment period. This is particularly true for analysis of recent policy adoptions, such as AVR, where the post-treatment period is short.
Research on Oregon's AVR, the first state to adopt the policy, has some additional preliminary, positive research findings. Two studies, published by Demos and The Center for American Progress, attempt to triangulate the effect of Oregon's AVR on voter turnout by identifying those individuals who registered and voted in 2016 but were unlikely to do so in the absence of AVR. McElwee et al. (Reference McElwee, Schaffner and Rhodes2017) found that 89,000 new voters registered by AVR in 2016, and, in total, there were 53,000 more new voters in 2016 than in 2012. Using the latter estimate in their calculation, they suggest that AVR may have increased voter turnout by 2 percent. Similarly, Griffin et al. (Reference Griffin, Gronke, Wang and Kennedy2017) estimate that 40,000 individuals voted because of AVR in the 2016 election that otherwise wouldn't have. This would account for 1.9 percent of voters in 2016. This estimate was derived by counting the number of individuals who voted and registered via AVR who fit the following criteria: (1) were not registered during the 2008, 2010, 2012, or 2014 elections, (2) were old enough that they could have been registered and voted since 2008, and (3) did not return their registration postcard to indicate partisanship.
Unfortunately, triangulating new voters in this way still does not fully address causal inference concerns. Both of these approaches may underestimate or overestimate the true effect on voter turnout. Leveraging differences in turnout over time makes the estimate subject to differences beyond the adoption of AVR. Variation in the candidates running for office in 2012 and 2016 may have resulted in differences in voter interest, causing the increase in new voters. Alternatively, the increase in new voters may simply have been caused by population growth. Indeed, the Oregon DMV reported a 48 percent increase in surrendered licenses from out of state during that time interval, an increase of over 30,000 individuals. Failure to take into account additional voters from out of state may also unduly inflate the triangulated estimates provided in McElwee et al. (Reference McElwee, Schaffner and Rhodes2017) and Griffin et al. (Reference Griffin, Gronke, Wang and Kennedy2017), as these individuals would have no Oregon voter history but may nonetheless be likely voters with or without AVR.Footnote 5 On the other hand, these authors may have underestimated the effect of AVR on voter turnout by ignoring the effect on the youth vote or other individuals who simply did not fit their specific criteria.
An additional complication in the literature probing the effect of AVR is that not all AVR systems are equivalent. Most prominently, AVR systems can be either “front-end” (sometimes also called “automated” voter registration) or “back-end.” Under the front-end system, a citizen is given an opportunity to register to vote (or have their registration records updated due to an address change) during a DMV transaction, and the citizen needs to positively assent to the change. Under the back-end system, eligible citizens are automatically registered, and have an opportunity to opt-out later in response to a postcard mailer. By nature of examining both a front-end (California) and back-end (Oregon) state, this paper is able to give some insight into potential differential efficacy of producing new voters.
Overall, existing analyses of the turnout effects of motor voter laws and AVR have mixed or tenuous results, which is much like the broader literature on the effect of all electoral reforms on voter turnout (see e.g., Kousser and Mullin, Reference Kousser and Mullin2007; Gronke et al., Reference Gronke, Galanes-Rosenbaum, Miller and Toffey2008; Mycoff et al., Reference Mycoff, Wagner and Wilson2009; Neiheisel and Burden, Reference Neiheisel and Burden2012; but also Gerber et al., Reference Gerber, Huber and Hill2013; Leighley and Nagler, Reference Leighley and Nagler2013; Burden et al., Reference Burden, Canon, Mayer and Moynihan2014; Holbein and Hillygus, Reference Holbein and Hillygus2016). In particular, researchers note that there is a trade-off between lowering the costs of voting, and making it more difficult for parties to mobilize voters (Hanmer, Reference Hanmer2009; Burden et al., Reference Burden, Canon, Mayer and Moynihan2014). In this way, lowering registration and voting costs does not necessarily guarantee increases in voter turnout. Rigorous analysis is necessary to confirm the effects of any policy change. The analysis in this paper identifies a new way to isolate the causal impact of AVR on turnout by using the citizen's birth date as an exogenous variable that is related to registration via AVR but is unrelated to turnout.
3. Evidence for the relationship between voter registration and birthdays
Our analytical approach leverages within-state variation in voting rates by registrant birth date, producing a matched comparison group that varies only by their exposure to the AVR system. We compare turnout rates of voters with birth dates prior to an AVR deadline to those with birth dates after that deadline using instrumental variable analysis. Our registration and turnout data are from the state of Oregon in 2016 and 2018 and the state of California in 2018.
We expect a systematic relationship between effective voter registration dates and birthdays because of DMV policy as driver's licenses expire on birth dates in both states (license renewal is required every five years in California and every eight years in Oregon). The relationship between birthdays and registration dates will be strong for AVR-registered voters and small but present for traditionally registered voters due to pre-existing motor voter policy as well as age-induced voter eligibility.
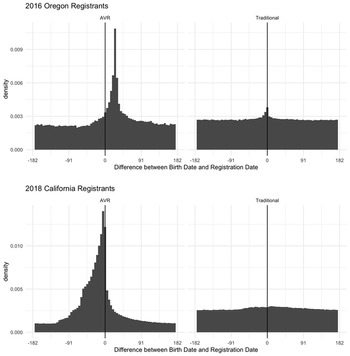
Figure 1 displays the distribution of all voters in Oregon (2016) and California (2018) voter files based on the difference between their birth date and their effective voter registration date for AVR and non-AVR registrants.Footnote 6 The x-axes display the difference in calendar days between these two events, with a maximal difference of 182 days prior and subsequent to one's birth date. The figure shows that the relationship between birth date and registration date is stronger for AVR than for non-AVR-registered voters. In 2016 in Oregon, effective registration dates most commonly fall in the month following one's birthday, peaking precisely 25 days post-birthday. Much of this delay is due to AVR policy that potential voters have 21 days to opt-out of registration or choose a political party, with the remainder presumably due to administrative processing time. In California, the modal AVR registrant has an effective registration date that falls one day prior to their birth date. This more proximate relationship is due to the fact that California operates a “front-end” AVR system, wherein a voter's opportunity to opt-out of registration occurs at the time of their DMV visit.Footnote 7 This difference, as well as the availability of online and by mail renewal in California, likely explains differences in the strength of the explanatory power of birthdays between the two states.
Relationship between birth date and registration date.
Note: California data limited to registrants following AVR implementation in April 2018.

Statistical analysis presented in Table 1 confirms that AVR-registered voters are more likely than traditionally registered voters to have effective registration dates proximate to their birthday. Here we will define “proximity” as 30 days prior or subsequent to one's birthday. Examining voters registered in the each state's calendar year of AVR adoption, we estimated a logistic regression with the dependent variable coded as 1 if the voter's effective registration date is within 30 days (prior or subsequent) to their birthday. The independent variables in each regression are dichotomous indicators of whether the voter was registered traditionally or by AVR. The marginal effects from this estimation suggest that registration through AVR increases your probability of having effective registration dates in proximity to your birthday by 7.9 percent in the state of Oregon (2016) and 23.6 percent in California (2018), each estimate relative to traditionally registered voters.Footnote 8
AVR registrants are more likely to register close to birth date

Notes: Logistic regression with dependent variable coded as 1 if registration date is within 30 days of birth date. Robust standard errors in parentheses.
*p<0.1, **p<0.05 , ***p < 0.01.
It is important to note that AVR is not the only reason that there is a relationship between birth dates and registration dates. Age-induced voter eligibility as well as new license procurement leads to voter registration subsequent to one's birthday, a relationship strengthened in states with pre-registration laws. A second reason is pre-existing motor voter policies. As previously noted, a myriad of state and federal laws and administrative policies have made the DMV a source for voter registration for some time. To accurately assess the effect of AVR, it will be important to account for proximate registrations and voting turnout that would have occurred under previous motor voter opportunities.
4. Methods: instrumental variable analysis
Now that we have established the relationship between birth dates and voter registration, we turn to the methodology we employ: instrumental variable analysis. This technique is used when correlation between the explanatory variables and the error term is suspected. In the case of AVR, we are concerned that registrations with AVR are correlated with other factors that affect voter turnout, biasing estimation. An instrumental variable (IV) is a third variable that is correlated with your explanatory variable, but not with omitted variables of concern (the error term), thus allowing a causal estimate untainted by endogenous correlations.
A dichotomous variable coding birthdays just prior and subsequent to a cutoff date is a valid instrument in the case of AVR. As previously illustrated, birthdays are correlated with AVR date due to driver's license renewal policy. Those registered to vote prior to registration deadlines will be eligible to vote in a given election, whereas those who are registered after the deadline will not be eligible. The timing of one's birthday, at least within a subset of the calendar year (discussed in greater depth below), is not correlated with any known factors that affect voter turnout, hence making it a valid exogenous indicator.
Instrumental variable analysis will provide us with an estimate of the Local Average Treatment Effect (LATE). The LATE is the causal estimate of the treatment for the subset of individuals who receive the treatment only through the causal pathway of the instrument. In the language of Angrist et al. (Reference Angrist, Guido and Imbens1996), it is the average treatment effect for the “compliers.” Compliers receive the treatment if and only if the instrument is switched on. In this study, the LATE is the treatment effect for those who are registered to vote in time for the general election only as a result of the timing of their birthday, and who would otherwise not have been registered.
It is useful to break down the type of registrants who will drive the LATE estimate. Imagine there are five types of potential voters, a spectrum of individuals for whom the likelihood of AVR having a causal impact varies based on their vote propensity and on the method of registration. For shorthand, we will call the voter types “already voters,” “would-be voters,” “cost-conscience voters,” “uninterested voters,” and “anti-voters.” Summaries of registration methods (depending on the value of the instrument) and our predictions for the likelihood that AVR will impact (assist) these voters are listed in Table 2.
Theoretical predictions for the impact of AVR on turnout

Already voters are those individuals who pre-exist in the voter rolls prior to AVR implementation. They may be interested in politics and vote with regularity. The likelihood that these voters are impacted by AVR is comparatively low. Would-be voters are those individuals who are not yet registered to vote, perhaps due to a recent move or otherwise change in eligibility, but would achieve registration in time for the voter registration deadline regardless of AVR. These individuals may or may not register via AVR, depending on whether they happen to go to the DMV in advance of the voter registration deadline. These voters would likely cast votes at rates similar to the already voters.
In contrast, cost-conscious and uninterested voters would only register to vote because of AVR. These are the individuals who we expect to be influenced by the instrument; if their birthday falls prior to voter registration deadlines, then they will register to vote in time for the election. If their birthday falls after the deadline, they will not register in time for the election.Footnote 9 We expect cost-conscious and uninterested voters to exclusively register by AVR, and cost-conscious voters will vote at higher rates. These two voter types will drive the LATE estimate.
Finally, anti-voters are individuals opposed to voter registration and voting, opting out of AVR if registration is proposed (or done automatically). By nature of their absence in the voter file, these individuals do not appear in our analysis. We view this omission as non-consequential since both their voting outcome and registration status are unaffected by the instrument.
This typology of voters highlights how descriptive statistics of the turnout rates of automatically registered citizens overemphasize the effects of AVR. These registrants are a combination of would-be voters, cost-conscious voters, and uninterested voters. However, because would-be voters would most likely find other means of registration in the absence of AVR, their presence in the pool of AVR registrants overstates the causal impact of the policy. In contrast, this instrumental variable analysis will provide a causal effect on cost-conscious and uninterested voters, the groups that would be unlikely to register to vote at all in the absence of AVR. Following the language of Angrist (Reference Angrist1990), these groups of individuals constitute the “compliers” and their treatment effect constitutes the LATE and provides us a valid causal estimate of the turnout effects of AVR.
4.1. Data
These data for this study come from voter registration files in Oregon (2016 and 2018) and California (2018). We limit the scope of the analysis in several ways. Most significantly, we limit each data file to voters who updated or initiated their registration while AVR was in place.Footnote 10 This is the pertinent subset of the data for our purposes, as inference is drawn based on the timing of one's registration transaction for those individuals whose birthdays affect that timing. Individuals who did not change their registration status in a given calendar year are extraneous because, by definition, they were not affected by AVR. Their presence in the data weakens the strength of our instrument, since the relationship between birthdays and registration timing is stronger in the time interval when AVR is in place.
We also limit our analysis based on the registrant's particular birthday. This follows guidance from critiques of previous research exploiting birthdays as an exogenous variable for instrumental variable analysis (Angrist, Reference Angrist1990, Angrist and Krueger, Reference Angrist and Krueger1992). Buckles and Hungerman (Reference Buckles and Hungerman2013) bring to light the limits of the exogeneity of birth dates. Using data on maternal characteristics, they show that mothers who give birth to children in the winter are systematically different than mothers who give birth to children in the summer, namely they are more likely to be teenagers, unmarried, and lack a high school degree (Buckles and Hungerman, Reference Buckles and Hungerman2013). Because the maternal characteristics associated with winter birthdays may also be associated with voting patterns, we choose to confine our sample to registrants whose birthdays occur during an interval of time following the voter registration deadline and the election, compared to mirror interval proceeding that block of time.
This subset has several additional properties advantageous to our particular data analysis needs. First, it omits individuals who were ineligible to vote in the general election due to age requirements. Previous research has hypothesized that those born before and after the election are differentially affected by voter mobilization and, perhaps, persistent enthusiasm or lack thereof (Holbein and Hillygus, Reference Holbein and Hillygus2016; Nyhan et al., Reference Nyhan, Skovron and Titiunik2017). Individuals in this time window do exhibit a higher relationship between birth date and registration date than the general population, simply because registration surges at this point in the election cycle. This surge is apparent both for traditional and AVR. We will mitigate this concern by testing for the existence of differential registration bias between the birthday intervals analyzed.
Our instrumented variable is a dichotomous variable, coded one if the voter is registered to vote by the general election voter registration deadline and zero otherwise. Our primary IV is a dichotomous indicator for birthdays that occur prior to a cutoff date: the voter registration deadline in California and 21 days prior to the voter registration deadline in Oregon. In Oregon, the cutoff date varies from the voter registration deadline due to the fact that AVR registrants have 21 days to opt-out of registration. Twenty-one days prior to the voter registration deadline is thus the latest date by which visits to the DMV would result in on-time AVR without affirmative action by the individual. In California, the voter registration deadline is the analogous date.Footnote 11
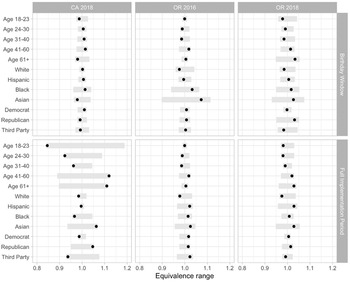
Figure 2 presents equivalence tests for covariates based on our instrument (Hartman and Hidalgo, Reference Hartman and Hidalgo2018). Equivalence tests begin with the initial hypothesis that the data are unbalanced, and only reject this hypothesis if they provide sufficient statistical evidence in favor of consistency. This test avoids bias favoring finding balance between small samples. The shaded regions in the figures represent the range of values for which equivalency cannot be rejected. The dots represent odds-ratios for differences between the relevant time intervals. The tests are powered to detect a 1 percent difference in proportions, a deviation considered anecdotally to be of substantive value by previous research on voter turnout (Green and Gerber, Reference Green and Gerber2019). As is evident in the figure, we largely achieve statistical equivalency for both time periods under consideration. Regardless, the differences present within both the narrower birthday window and the full calendar year are substantively small in size, and as we will show later, much smaller than what we find for voter turnout. The results constitute important evidence for the independence of our instrument. As balance appears better in the narrower birthday window, these tests bolster confidence in our decision to rely on a smaller subset of voters based on their birth date.
Testing for covariate equivalency, full implementation period versus narrowed time interval.
Notes: Equivalence tests were conducted using the protocol described in Hartman and Hidalgo (Reference Hartman and Hidalgo2018) and the R package equivtest. As all covariates were dichotomous, the exact Fisher binomial two-sided test for two samples was employed. The x-axis of the equivalence range depicts odds-ratios.

We also test for differential voter registration bias. As noted by Nyhan et al., differential voter registration bias can also bias turnout estimates (Nyhan et al., 2017). Registration might vary based on birthdays for two reasons. First and non-consequentially, birth patterns vary over the course of a year, which would naturally lead to variation in the rate of registration. Second, political campaigns may differentially mobilize voters based on their birthdays, particularly those whose birthdays fall prior or subsequent to the election. To test for differential mobilization within our intervals, we use federal CDC natality data as a baseline for population by birthdays.Footnote 12 We conduct a t-test for the number of registered voters as a proportion of births based on our registration cutoff dates. We find statistically significant registration differences between people with birthdays before and after the registration deadline using the full calendar year, but not in our more narrowly chosen time interval prior to election day. We will return to the issue of differential registration bias in an additional sensitivity analysis.
5. Results
Following Angrist (1990), instrumental variable analysis starts with a calculation of Wald estimates. Wald estimates are the ratio of the difference of proportion of the outcome y (voter turnout) for the group z = 1 (pre-registration cutoff birthdays) and the group z = 0 (post-registration cutoff birthdays) to the difference in proportions of the variable x (registration by the election deadline) for the group z = 1 and the group z = 0.Footnote 13 The first-stage estimates represent the differences in voting-eligible registration rates between birthday intervals among registrants who made alterations to their registration status. Table 3 presents the construction of Wald estimates for the relevant state elections. As previously discussed, we limit the data to individuals who registered by any method while AVR was in place and have birthdays falling in mirror time intervals based on registration cutoff dates and the date of the general election.
Wald estimates for effect of AVR on turnout

Notes: Rates computed as proportions. Confidence intervals of first and second stage obtained through difference in proportions test. Confidence intervals of Wald estimate derived from 2SLS.
***p < 0.01, **p < 0.05, *p < 0.1.
The estimates for Oregon 2016 and 2018 show that those registrants with birthdays that fall 21 days prior to the registration deadline were 2 percent more likely to be registered in time for the election relative to those with birthdays following the cut-off date. Although this number is small in magnitude, it is statistically significant and much larger than any difference in covariates such as party membership or demographic characteristics. In California, registrants with birthdays prior to that state's voter registration deadline were almost 9 percent more likely to be registered in time for the general election compared to individuals with later birthdays. The increased strength of the instrument in California may reflect the ability of Californians to renew by mail or online, a convenience that could potentially lead individuals to take action closer to their expiration date. Overall, by nature of the relatively late date of the general election in the calendar year, both groups are highly likely to be registered to vote on time for the election. For example, among Oregon 2016 registrants, 83.4 percent of individuals with birthdays prior to our registration cutoff date were eligible to vote in the general election, compared to 81.4 percent in the later birthday interval.
The second-stage estimates represent the differences in voter turnout rates between birthday intervals. Again, the raw differences are small in magnitude—less than 1 percent in California 2018 and less than half a percent in Oregon 2016 and 2018—but are nonetheless statistically significant in Oregon 2016 and California 2018. Registrants with birthdays before the relevant voter registration cutoff dates are more likely to vote than registrants with later birth dates.
A Wald estimate is equivalent to the coefficient of a two-stage least squares IV regression with no covariates and a dichotomous instrument. As with the coefficients from IV regressions, it should be interpreted as the LATE, or treatment effect on the compliers. Here we see that birthday-induced voter registration increases the likelihood of voting by 0.24 in Oregon 2016, 0.17 in Oregon 2018, and 0.1 in California 2018. Voters use AVR both to newly register and to update their registration, so this statistic is the combined effect for both groups. In California, which provides a data field indicating new registrations, 24.7 percent of all AVR-registered individuals are new registrants. In Oregon, no new registration field is available, so we rely on having no data on voter history for the previous general election as a proxy for new registrations. Using this metric, 99.7 percent of AVR registrants were new registrants in 2016. The source of registration was not made available for Oregon 2018 so no descriptive statistics are available.Footnote 14 The vast difference between California 2018 and Oregon 2016 is likely due to administrative decisions on what registration changes to attribute as “AVR.” In later estimates, we will focus only on new registrations to make comparisons as similar as possible.
As previously stated, the Wald estimate is the causal effect for the compliers, the subgroup of the population that would register if and only if their birthday happens to fall before the AVR voter registration cutoff date. As we will address in the next section, calculating the number of compliers is important in understanding the magnitude of the overall effect of AVR. Finally, this causal effect may encompass multiple policies. In particular, this estimation strategy cannot disentangle the effects of previous motor voter policies from the effects of AVR. As such, the causal estimate must be interpreted as the aggregate impact of all motor voter policies. We will return to this limitation later in the paper.
To bolster confidence in our results, we conduct placebo tests in years prior to AVR implementation. Using the Oregon 2016 and California 2018 voter files, we limit the analysis to voters who updated or originated their registration four years prior, and look only at age-eligible individuals in those years. In Oregon, we repeat this exercise both for what would have been the AVR cutoff date (21 days prior to the registration deadline) in addition to the actual voter registration deadline. We move the interval of birthdays considered to reflect this difference based on the precise historical election date. These analyses, reported in Table 4, find some significant results for registration, but not for turnout. Further, the registration effects are smaller than what we estimate under AVR. This mostly aligns with our expectation that traditional motor voter legislation was less effective at AVR in terms of bolstering registration and turnout.
Placebo Wald tests

Notes: Rates computed as proportions. Confidence intervals of first and second stage obtained through difference in proportions test. Confidence intervals of Wald estimate derived from 2SLS.
***p < 0.01, **p < 0.05, *p < 0.1.
We now add covariates to this estimation using a two-stage least squares IV regression. In the first stage, instruments predict the explanatory variable of interest. In the second stage, the model estimated values in stage one are used to predict the dependent variable. As before, our instruments are birthday indicators, the instrumented explanatory variable is any registration prior to the voter registration deadline, and the dependent variable is voter turnout. There is no two-stage least squares estimator for dichotomous outcomes and estimates are derived from linear probability models in both stages.Footnote 15
We controlled for several demographic variables. We code for residency in a populous county dichotomously, coded as one if you live in a county with over 150,000 residents, and zero otherwise. We also include control variables that measure whether or not the voter is registered as a Democrat, Republican, or with a third party, the omitted category being an unaffiliated voter. We control for race and gender using imputations.Footnote 16 Finally, we include a continuous variable for the age of the potential voter at the time of the election.
Our estimation appears in Table 5. Diagnostic tests confirm that our instrument has sufficient strength. Following the rule of thumbs put forward by Stock and Watson (Reference James and Mark2007), the F-tests comparing the sum of squared residuals from first-stage models with and without our instrument is above 10, F = 187 in Oregon 2016, F = 177 in Oregon 2018, and F = 4628 in California 2018. Robust standard errors were employed in these calculations.
Instrumental variable analysis on turnout

Note: Second stage of a two-stage least squares instrumental regression (linear probability model). Dependent variable is voter turnout. Omitted categories are race identified as other, non-affiliated partisanship, and male-identified gender.
***p < 0.01, **p < 0.05, *p < 0.1.
The two-stage results largely conform to the Wald estimate, showing that AVR increases one's likelihood of voting by 0.29 in Oregon 2016, 0.22 in Oregon 2018, and 0.1 in California 2018. Again, the previous caveats apply. We must interpret these results as the LATE, as a combined effect for new and updated registration, as well as a combined effect for AVR and previous motor voter policies.
Table 5 also presents results limited to new registrations.Footnote 17 These results show that much of the variation in turnout estimates has to do with variation in the proportion of registrants that are new voters. The act of updating one's registration before or after the registration deadline, not surprisingly, has a much lower impact on turnout likelihood than failing to register prior to the deadline. Limiting the data in this way, we see a much higher voter turnout rate from California's AVR, 38.2 percent, but little difference in Oregon. The control variables behave expectedly, with age, race identified as white, urban residency, and partisan political affiliation all positively associated with voting.
6. Subgroup analysis
The effects presented above are a combination for all registrations. The next step in the analysis is to consider heterogeneous treatment effects. Fortunately, it is possible to rerun our estimation within subgroups to gauge such important variation. Table 6 presents the results of a series of two-stage least squares analyses, each run on a different subgroup population. As with our primary analysis, we are leveraging exogenous differences in birth dates to construct our estimates, comparing voters whose birth dates fall before and after an AVR cutoff date for voter eligibility. In order to make Oregon and California as most comparable as possible, we limit the analysis to new registrants during AVR implementation periods.
Results by subgroups for new registrants

Notes: Coefficients estimate the effect on turnout of AVR prior to deadline from a series of IV regressions calculated using the AER package in R. Robust standard errors are in parentheses and calculated with the sandwich package.
***p < 0.01, **p < 0.05, *p < 0.1.
Subgroup analysis reveals several interesting variations in effect sizes. We see differences in the effect of gender on turnout. In both California and Oregon, the effect of AVR on turnout is stronger for women than men. Specifically, in Oregon 2016 the effect size for women is 0.47 compared to 0.18 in men. The gap is smaller in that state in 2018, but still substantial. In California, the overall effect for women was 0.34 compared to 0.25 for men. Explanations for this unexpected policy consequence are worth considering. A straightforward interpretation is that barriers to voter registration are more significant for women than men and that AVR reduces this disparity. Alternatively, however, it may simply be more a function of the recent political climate than the policy per se, with women differentially energized to vote conditional on eligible registration.
Age is also an important determinant for AVR-induced turnout. In both states, we see a trend toward larger effect for younger registrants. This is particularly true in California, where the turnout rate estimated for those aged 18–23 is 72 percent. This age group has null results in Oregon, likely due to the fact that the eight year expiration cycle in that state means that registrants in this age category would not yet be eligible for license renewal. In Oregon in both years of analysis, the largest effects are for age grouping of 31–40.
The results based on race suggest consistently strong turnout effects for whites. Across all three models, the coefficient for whites was somewhat larger than the coefficient in the full model. No significant effects were found for either Blacks or Asian Americans in any model, though this finding may simply be the result of limited power. Indeed, no subgroup regression with less than 20,000 observations obtained significance. The Hispanic population in California was significantly affected by AVR, boosting turnout for this group by 0.31. Results based on county population suggest a somewhat stronger effect in populous counties, at least in midterm elections.
7. Sensitivity analysis
Instrumental variable analysis is a useful tool for casual estimates of endogenous phenomenon, but is not without pitfalls. In political science research, exclusion restrictions are often violated, leading to overestimates of causal effects, which can be particularly problematic in the presence of weak instruments (Lal et al., Reference Lal, Xu, Lockhart and Zu2021). In order to bolster confidence in our turnout results, we conduct a sensitivity analysis using a second IV and alterative research design.
While one's birth date is predictive of the timing of one's DMV visit within the calendar year, one's birth year is additionally predictive. Figure 3 displays the relationship between birth year and AVR in Oregon 2016 and California 2018 and 2019. As is clear in the figure, AVR is more likely in even years in the state of Oregon, and every fourth year in the state of California, at least for a subset of birth years. While the cause of California's pattern is unknown to the researchers, Oregon's even-year pattern is explained by prior statute. Specifically, until 2001, Oregon statute required that individuals with even-year birth dates renew their licenses in even years, while odd-numbered birth years renew in odd years (ORS 807.130(1)). The nullification of this statute in 2001 explains the end of the pattern for birth years starting in 1985, as this is the first birth year cohort to obtain a new license, at age 16, under the revised statute.
Relationship between birth year and AVR.
Notes: Square markers represent birth years noted as high-probability birth years to predict license renewal.

This new instrument—high-probability birth years—allows us to examine the effect of AVR on voter turnout using an alternative research design. Instead of comparing individuals who register before or after the voter registration deadline, in this secondary analysis we compare individuals who register to those that do not. This allows us to more carefully address concerns of differential registration bias (Nyhan et al., 2017). Although the voter file only contains information on registered individuals, the existence of state-specific single-year age census data allows us to accurately impute missing data for the unregistered. Specifically, using census single-year age estimates as a proxy for the eligible voting population,Footnote 18 we subtract the total number of voters registered in each birth year. Although we do not have any additional demographic information for the unregistered population, we do know that, by nature of their lack of registration, they did not vote in their states' relevant general election.
In this analysis we limit our data to new registrants and unregistered individuals in the AVR implementation periods of Oregon 2016 and California 2018.Footnote 19 We consider only new registrants whose effective registration date is prior to the voter registration deadline in each state. Finally, because the instrument is only predictive of registration within a subset of birth years, we limit the data to only these relevant generational cohorts, those aged 31–84 in Oregon and 39–59 in California.Footnote 20 The first stage of the 2SLS regression predicts registration and the second stage predicts turnout. The results appear in Table 7. As is evident from the first-stage F statistic, the instrument has sufficient predictive power. The point estimates are similar for the state of California and (39.5 versus 38.2 percent) and almost identical for the state of Oregon (29.4 versus 28.7 percent). The attenuated affect in California is likely explained by the exclusion of younger registrants, a group which had a particularly strong treatment effect in the subgroup analysis.
IV sensitivity analysis

Note: Second stage of a two-stage least squares instrumental regression (linear probability model with high-probability birth year as instrument).
* ***p < 0.01, **p < 0.05, *p < 0.1.
8. Registration and total turnout effect
The turnout rates presented above do not necessarily inform the magnitude of the effect of AVR in each state. As previously mentioned, the results constitute the increase in vote likelihood due to AVR for the compliers (those who registered in time to vote only by chance of the timing of their birth date). It is possible for a state to have a large turnout effect, but few compliers, an outcome theoretically of lower substantive importance than a policy that produces a small turnout effect but has many compliers. Hence, to fully understand the effect of AVR, it is important to estimate the number of people registered to vote due to the policy that would not otherwise be registered.
For the purposes of estimating AVRs, there are two counterfactuals that must be considered. First, a subset of AVR registrants would seek out voter registration independent of visiting the DMV. Second, another subset of AVR registrants would have registered through previously available motor voter opportunities, but only conditional on visiting the DMV. In this section we seek to estimate both populations for Oregon and California. To simplify the comparison, we limit estimates to new registrants only.
To start this exercise, we begin with the actual number of AVR registrants who registered between May and October in the first year of AVR implementation in each state. We use the voter registration files to calculate this figure, aggregating registrants with effective registration dates in this time period.Footnote 21 There were 88,737 such new registrants in Oregon (2.9 percent of Voting Eligible Population (VEP)) and 286,067 new registrants in California (1.1 percent of VEP).
To estimate the proportion of these voters that would have registered by other means in the absence of DMV visitation, we look more closely at how our instrument predicts both traditional registration and AVR-specific registration. We use the instrument employed in our sensitivity analysis, birth year not birth date, in this calculation for two reasons. First, birthdays that fall right before the registration deadline are outliers in terms of traditional registration rates and may yield inappropriate extrapolations. Second, it is better to include the unregistered population in the denominator of these calculations.Footnote 22 For these analyses we use the same subset of data described in the sensitivity analysis.
We find that high-probability birth years are associated with increases in AVR by 6.9 percent in Oregon and 9.6 percent in California. In contrast, low-probability birth years are associated with significant increases in traditional registration, 0.4 percent in Oregon and 2.0 percent in California.Footnote 23 This latter correlation represents voters that, by nature of their lack of visit to the DMV, are seeking out traditional forms of registration. The ratio of traditional to AVR predicted by our instrument suggests that at minimum 3.9 percent of Oregon AVR registrants and 28 percent of California AVR registrants would find other means to register in the absence of a DMV visit.
The second subset of AVR registrants that should not be included in our turnout estimates are those that would have registered under prior DMV motor voter policies. To capture this population it is necessary to turn to historical data on registration patterns. We conduct a logistic regression predicting the likelihood that a voter registers in accordance with the birth year instrument before and after AVR implementation. For example, in the state of Oregon, the dependent variable was coded as one if the registrant has an even-numbered birth year and even-numbered registration year or an odd-numbered birth year and odd-numbered registration year, zero otherwise. We include registrations that occurred from 2006 to 2016 in Oregon and from 2008 to 2018 in California. The regression included dummy variables to control for midterm and presidential year registrations, as those years have much higher overall registration numbers. The results showed significant increases in the strength of the instrument following AVR implementation in both states. Specifically, Oregonians increased the likelihood of a correspondence between their registration year and birth year from 0.7 to 1.6 percent following the implementation of AVR. Californians increased the likelihood of correspondence from 0.76 to 2.7 percent following implementation. Proportionally, these statistics suggest that 46 percent of Oregonian and 28 percent of Californian AVR registrants would have registered via motor voter policies in place in previous years.
The turnout estimates presented previously provide a LATE estimate for compliers. As such, this precludes any influence of a differential turnout rate by those individuals who would otherwise find themselves registered outside a visit to the DMV. In contrast, voters that would have registered counterfactually by pre-existing motor voter policies are included in the original turnout calculations. If this group of registrants turned out to vote at higher rates than those that would register only in the presence of AVR, it could cause an upward bias in our total turnout estimate. For this reason, it is necessary to estimate historical turnout for traditional motor voter registrants.
To gauge differential turnout of this group we again rely on historical registration and turnout data available in voter files. We limit the data to new voters with effective registration dates in each states' first year of AVR implementation as well as the previous two general elections. We reconstruct the original turnout model, relying on birth date timing within a calendar year, but interact both the instrument and pre-deadline registration indicator with a dummy variable indicating the presence of AVR. In both the California and Oregon models, the interaction term is negatively signed but insignificant (p = 0.58 in Oregon and p = 0.60 in California). Although the differences cannot be distinguished from zero with any level of traditional confidence, the marginal effects estimated for both states would suggest that motor voter registrants vote at 3.4 percent higher rates in Oregon and 1.2 percent higher rates in California, each relative to AVR registrants. To ensure the most conservative estimate, we use these estimates to calculate a lower-bound estimate of the turnout rate of voters that would register only with AVR. Given the proportion of AVR registrants that likely would have registered counterfactually by motor voter in each state, this brings the point estimates of AVR turnout down to 25.7 percent in Oregon and 37.8 percent in California.
Combining all estimates reported above, we estimate that, from May to October, Oregon registered 45,790 individuals who would not have registered by any other mean in the absence of AVR. California registered 154,462 such individuals. Given each state's AVR-specific turnout estimate, this would lead to 11,766.03 (0.39 percent of VEP) new voters in Oregon and 58,313 (0.23 percent of VEP) new voters in California.
What drives the significant variation between Oregon and California in these calculations? There are many important, substantive differences in how voters interact with AVR, motor voter, and DMV license renewal in each state. As previously noted, California is a front-end AVR system whereas Oregon is back-end. Additionally, Californians have shorter license renewal periods, five years rather than eight, which means that they will be touched by motor voter policies more frequently. At the same time, Californians have option to renew by mail or online, negating the need to physically visit the DMV and interact with a DMV agent. In Oregon, previous motor voter statute prior to AVR required that all departmental personnel verbally ask DMV visitors about whether they would like to register to vote (ORS 247.017 c.2013). In contrast, in the state of California, this query existed in written form in California's license renewal form.Footnote 24 These differences in DMV interactions and motor voter implementations could understandably have significant effects on the types of voters that get registered.
These aggregate estimates of turnout are, at best, estimates. The method described here disentangles traditional motor voter policies from AVR and accounts for voters that would find other means to register to vote. However, the entirety of all estimates is based on the population of voters that renews their licenses. Other causes of DMV visitations, such as procuring a new license, likely engage a different population with a different propensity to turnout out and/or reliance on AVR for registration. At present, it is unknown whether the causal effect of AVR on turnout is substantively different than those who visit the DMV for other purposes.
9. Conclusion
This paper uses an innovative method to estimate the causal impact of AVR on voter turnout in Oregon and California. We leverage the relationship between birth date and driver's license expiration as an exogenous variable to help isolate who is impacted by AVR. Because license expiration occurs on one's birth date, we can use this information to produce a causal estimate of the effect of AVR on registration and turnout. We compared turnout rates of registrants whose birthdays fall before and after a cut-off date for eligible voter registration using AVR (the registration deadline in California and 21 days prior to the registration deadline in Oregon).
Our findings suggest that having a birthday in the latter interval, which would allow you to be registered at the DMV in time for the registration deadline, resulted in a 29 percent increase in turnout likelihood for Oregonians in 2016, 22 percent increase for Oregonians in 2018, and 10 percent increase for Californians in 2018. However, the seemingly large discrepancy between states was shown to be a result of the fact that California's AVR system produces many more updates to registrations, as opposed to new registrations, an act with a much smaller marginal effect on turnout. Considering only new registrants, individuals who registered to vote contingently on visiting the DMV, turned out to vote 29 percent of the time in Oregon and 38 percent in California. These results were largely confirmed with a sensitivity analysis employing and alternative instrument.
The somewhat larger turnout conversion in California, however, must be taken into consideration with differences in the numbers of new registrants. Our analysis shows that Oregon's back-end system, all else equal, registers more individuals vis-à-vis California. This is true even accounting for the fact that Oregon appears to have had more robust prior motor voter registrations success, likely due to the requirement of in-person transactions. Accounting for both prior motor voter policies, differences in voter conversions, and variation in the number of registrants, we estimate that six months of AVR implementation increased turnout as a percentage of VEP by 0.39 percent in Oregon 2016 and 0.23 percent in California 2018.
Acknowledgments
The authors would like to acknowledge the support of the MIT Election Data and Science Lab (MEDSL), which awarded them a New Initiatives in Election Science grant (https://electionlab.mit.edu/engage/grants/past-recipients); the Alta S. Corbett Fund at Reed College, which funded Matthew Yancheff to work as a research assistant; and Professor Jacob Grumbach of the University of Washington and Sean McEIwee of Data for Progress, both of whom provided us invaluable advice and feedback on this research. All conclusions remain the responsibility of the authors.
Supplementary material
To obtain replication material for this article, please visit https://doi.org/10.7910/DVN/RMXATJ.


 Open access