


1. Introduction
Glaciers on the Tibetan Plateau (TP) and its surroundings are crucial sources of water for Asia’s glacier-fed catchments (Reference Cruz, Parry, Canziani, Palutikof, Van der Linden and HansonCruz and others, 2007; Reference Immerzeel, Van Beek and BierkensImmerzeel and others, 2010; Reference Kaser, Großhauser and MarzeionKaser and others, 2010) but are largely retreating and losing mass (Reference YaoYao and others, 2012; Reference GardnerGardner and others, 2013). The role of these glaciers in maintaining regional water resources, which depends principally on the glaciated proportion of catchments (Reference Kaser, Großhauser and MarzeionKaser and others, 2010), may be altered significantly by ongoing changes in glacier extent and volume (Reference Jansson, Hock and SchneiderJansson and others, 2003; Reference Casassa, López, Pouyaud and EscobarCasassa and others, 2009). In the TP, continued glacier retreat and mass loss (Reference YaoYao and others, 2012; Reference GardnerGardner and others, 2013), particularly the accelerated mass loss that has been projected (e.g. Reference Radić and HockRadić and Hock, 2011; Reference Marzeion, Jarosch and HoferMarzeion and others, 2012; Reference Hirabayashi, Zhang, Watanabe, Koirala and KanaeHirabayashi and others, 2013), have raised concerns about the sustainability of water supplies and resulting implications for water resource management and climate adaptation in these catchments.
Many current studies on assessments of glacier changes and their associated hydrological impacts in the TP have focused mainly on the Hindu Kush–Himalayan glacierized catchments (e.g. Reference Rees and CollinsRees and Collins, 2006; Reference Immerzeel, Pellicciotti and BierkensImmerzeel and others, 2013; Reference Fujita and SakaiFujita and Sakai, 2014; Reference Lutz, Immerzeel, Shrestha and BierkensLutz and others, 2014), but such research is limited for the southeastern TP. Across the southeastern TP there are a large number of maritime glaciers (Fig. 1), with a total area of 13 200 km2 (Reference Shi and LiuShi and Liu, 2000). These glaciers represent ∼22% of the total glacier area of China (Reference Shi and LiuShi and Liu, 2000) and have approximately the same area as the Southern Patagonia Icefield (Reference Rignot, Rivera and CasassaRignot and others, 2003). These maritime glaciers are more sensitive to ongoing climate warming in the TP than to changes in the amount of precipitation (Reference Shi and LiuShi and Liu, 2000; Reference Su and ShiSu and Shi, 2002; Reference FujitaFujita, 2008; Reference Zhang, Hirabayashi and LiuZhang and others, 2012) and have exhibited the most significant shrinkage of all retreating glaciers in the TP over recent decades (Reference Su, Liu, Wang and ShiSu and others, 1992; Reference PanPan and others, 2012; Reference YaoYao and others, 2012). An investigation based on comprehensive in situ data revealed that glacier length in this region decreased at a rate of 48.2 m a−1 and glacier area decreased at a rate of 0.57% a−1 from the 1970s to the 2000s, representing rates significantly higher than those in other regions of the TP (Reference YaoYao and others, 2012). One distinctive characteristic of some maritime glaciers is that they are covered by a supraglacial debris cover (Reference Li and SuLi and Su, 1996; Reference Yang, Yao, Xu, Ma, Wang and WanYang and others, 2010; Reference Zhang, Fujita, Liu, Liu and NuimuraZhang and others, 2011). Supraglacial debris cover significantly affects ice melting and spatial patterns of mass loss by altering the surface energy balance and imposing a barrier between the atmosphere and the ice (Reference ØstremØstrem, 1959; Reference Nakawo and YoungNakawo and Young, 1981; Reference Mattson, Gardner and YoungMattson and others, 1993), with important consequences for glacier runoff and its contribution to water availability. Realistic prediction of future glacier runoff and its hydrological impact at the catchment scale should therefore account for the debris-cover effect that accelerates (if debris is thin) or suppresses (if it is thick) ice melting beneath debris relative to melting of exposed snow and ice (Reference ØstremØstrem, 1959; Reference Nakawo and YoungNakawo and Young, 1981; Reference Mattson, Gardner and YoungMattson and others, 1993). However, due to lack of information on the detailed spatial distribution of debris thickness and its properties, current investigations on assessments of the hydrological consequences of future glacier changes in the glacierized catchments have neglected the debris-cover effect (e.g. Reference Bliss, Hock and RadićBliss and others, 2014) or simply addressed it by using a degree-day approach with a multiplicative reduction factor or with different melt factors (e.g. Reference Immerzeel, Pellicciotti and BierkensImmerzeel and others, 2013; Reference Lutz, Immerzeel, Shrestha and BierkensLutz and others, 2014). Additionally, the timing of other runoff components (e.g. rainfall runoff, seasonal snowmelt and base flow) is similar to that of the glacier runoff hydrograph owing to the coincident periods of the melt season and heaviest rainfall (Reference Li and SuLi and Su, 1996; Reference Su and ShiSu and Shi, 2002; Reference Cheng, Yu and ZhaoCheng and others, 2004), so these may provide an important contribution to river runoff in the catchments of this region. To better assess the degree of glacier change and subsequent change in glacier runoff in the southeastern TP, we should therefore consider the variation in the contribution of each of the various runoff components to the total runoff and its response to climate change. Nevertheless, quantifying the contribution of glacier runoff in a catchment remains a challenge, as it requires more integrative methods that can address changes in all runoff components and accurately represent the surface mass-balance distribution, complex glacier topography, and physical mechanisms of ice melt under debris mantles.
Map of the Hailuogou (HLG) catchment on the eastern side of Gongga mountain, southeastern TP, with spatial distribution of the thermal resistance of the debris layer. Seven glaciers are named from Glacier No. 1 to Glacier No. 7, and the largest (No. 3) is called HLG glacier. GAEORS denotes the Gongga Alpine Ecosystem Observation and Research Station. Circle marks the hydrological station of GAEORS for runoff observation. A, B and C are extremely continental, subcontinental and monsoonal maritime glaciers, respectively; their boundaries are extracted from Reference Shi and LiuShi and Liu (2000).

Here we integrate a catchment-scale surface energy-/ mass-balance model and a hydrological model to explore past and future trends in glacier runoff and their associated hydrological impacts in a glacierized catchment of the southeastern TP with extensive debris cover on the ablation zones. All major glacio-hydrological processes in the catchment are taken into account in the model, which, in particular, accounts for the spatial characteristic of debris cover and its influence on the melting rate of the underlying ice. This study has two objectives. We first quantify the current contribution of glacier runoff to the total runoff and its corresponding role in the present-day hydrological regime of the catchment. Second, we investigate how changes in future glacier runoff and its contribution will affect the magnitude and timing of catchment river runoff under future climate scenarios. This study provides insight into the question of whether it is necessary to account for glacier changes and their effects when assessing the impacts of climate change on water availability in the southeastern TP with coincident periods of melt season and heaviest rainfall.
2. Study Area
We chose the Hailuogou (HLG) catchment, located on the eastern slope of Gongga mountain in the southeastern TP (29.6° N, 101.9° E; Fig. 1), as our study site. It offers us the opportunity to study a maritime glacier system with debris-covered and debris-free glaciers for which long-term, specific, although incomplete, information about the glaciology, meteorology and hydrology is available (Reference Li and SuLi and Su, 1996; Reference Cheng, Yu and ZhaoCheng and others, 2004; Reference LiuLiu and others, 2010; Reference Zhang, Fujita, Liu, Liu and NuimuraZhang and others, 2011). The catchment spans ∼80.5 km2 of steep alpine topography at elevations ranging from 2755 to 7556 m a.s.l. Three debris-covered and four debris-free glaciers (Fig. 1), covering 45.3% (36.44 km2) of the catchment area, exist in the catchment. About 8.2% of the total glacier area is covered by supraglacial debris (Reference Zhang, Hirabayashi and LiuZhang and others, 2012), the thickness of which increases from several millimetres of patchy cover in the upper part of the ablation zone to >1.0 m at the glacier terminus (Reference Zhang, Fujita, Liu, Liu and NuimuraZhang and others, 2011). The mean slope of the catchment is ∼36.6° (Reference LiuLiu and others, 2010), and the glacier-free zone is covered mainly by bare rock with small areas of alpine grass vegetation and forest (Reference Li and SuLi and Su, 1996).
The climate of the catchment is characterized by the southeast monsoon in summer and westerly circulation in winter (Reference Li and SuLi and Su, 1996; Reference Su and ShiSu and Shi, 2002). The mean annual air temperature from 1988 to 2013 at the Gongga Alpine Ecosystem Observation and Research Station (GAEORS; 3000 m a.s.l.; Fig. 1) is 4.4°C, and the mean annual precipitation is ∼1.9 m. About 80% of annual precipitation occurs during May–October (Reference Li and SuLi and Su, 1996; Reference Zhang, Fujita, Liu, Liu and WangZhang and others, 2010), coincident with the main melt season, and the precipitation peak occurs in July. Precipitation in the catchment increases with altitude (Reference Cheng, Yu and ZhaoCheng and others, 2004; Reference LiuLiu and others, 2010). Runoff in the catchment shows a clear seasonal cycle, with the peak in August. About 80.2% of mean annual runoff occurs between May and October, and runoff is low in other months.
As a result of increasing air temperature, the glaciers in the catchment have been retreating considerably and losing mass during recent decades (Reference Su, Liu, Wang and ShiSu and others, 1992; Reference LiuLiu and others, 2010; Reference Zhang, Fujita, Liu, Liu and WangZhang and others, 2010, Reference Zhang, Hirabayashi and Liu2012; Reference PanPan and others, 2012). The mean annual mass balance during 2001–09 was ∼−0.79 m w.e. (Reference Zhang, Hirabayashi and LiuZhang and others, 2012), comparable to that of glaciers in other regions of the TP (Reference YaoYao and others, 2012). Accelerated thinning, at a rate of −1.61 ± 0.6 m a−1, was observed in the catchment during the period 1989–2009 (Reference Zhang, Fujita, Liu, Liu and WangZhang and others, 2010). This thinning rate is
rapid compared with rates in other regions of the TP estimated by Reference GardnerGardner and others (2013). The area reductions of seven glaciers have different rates, ranging from 0.09% a−1 to 1.8% a−1 (Reference Zhang, Hirabayashi and LiuZhang and others, 2012).
3. Methods and Data
3.1. Catchment discretization
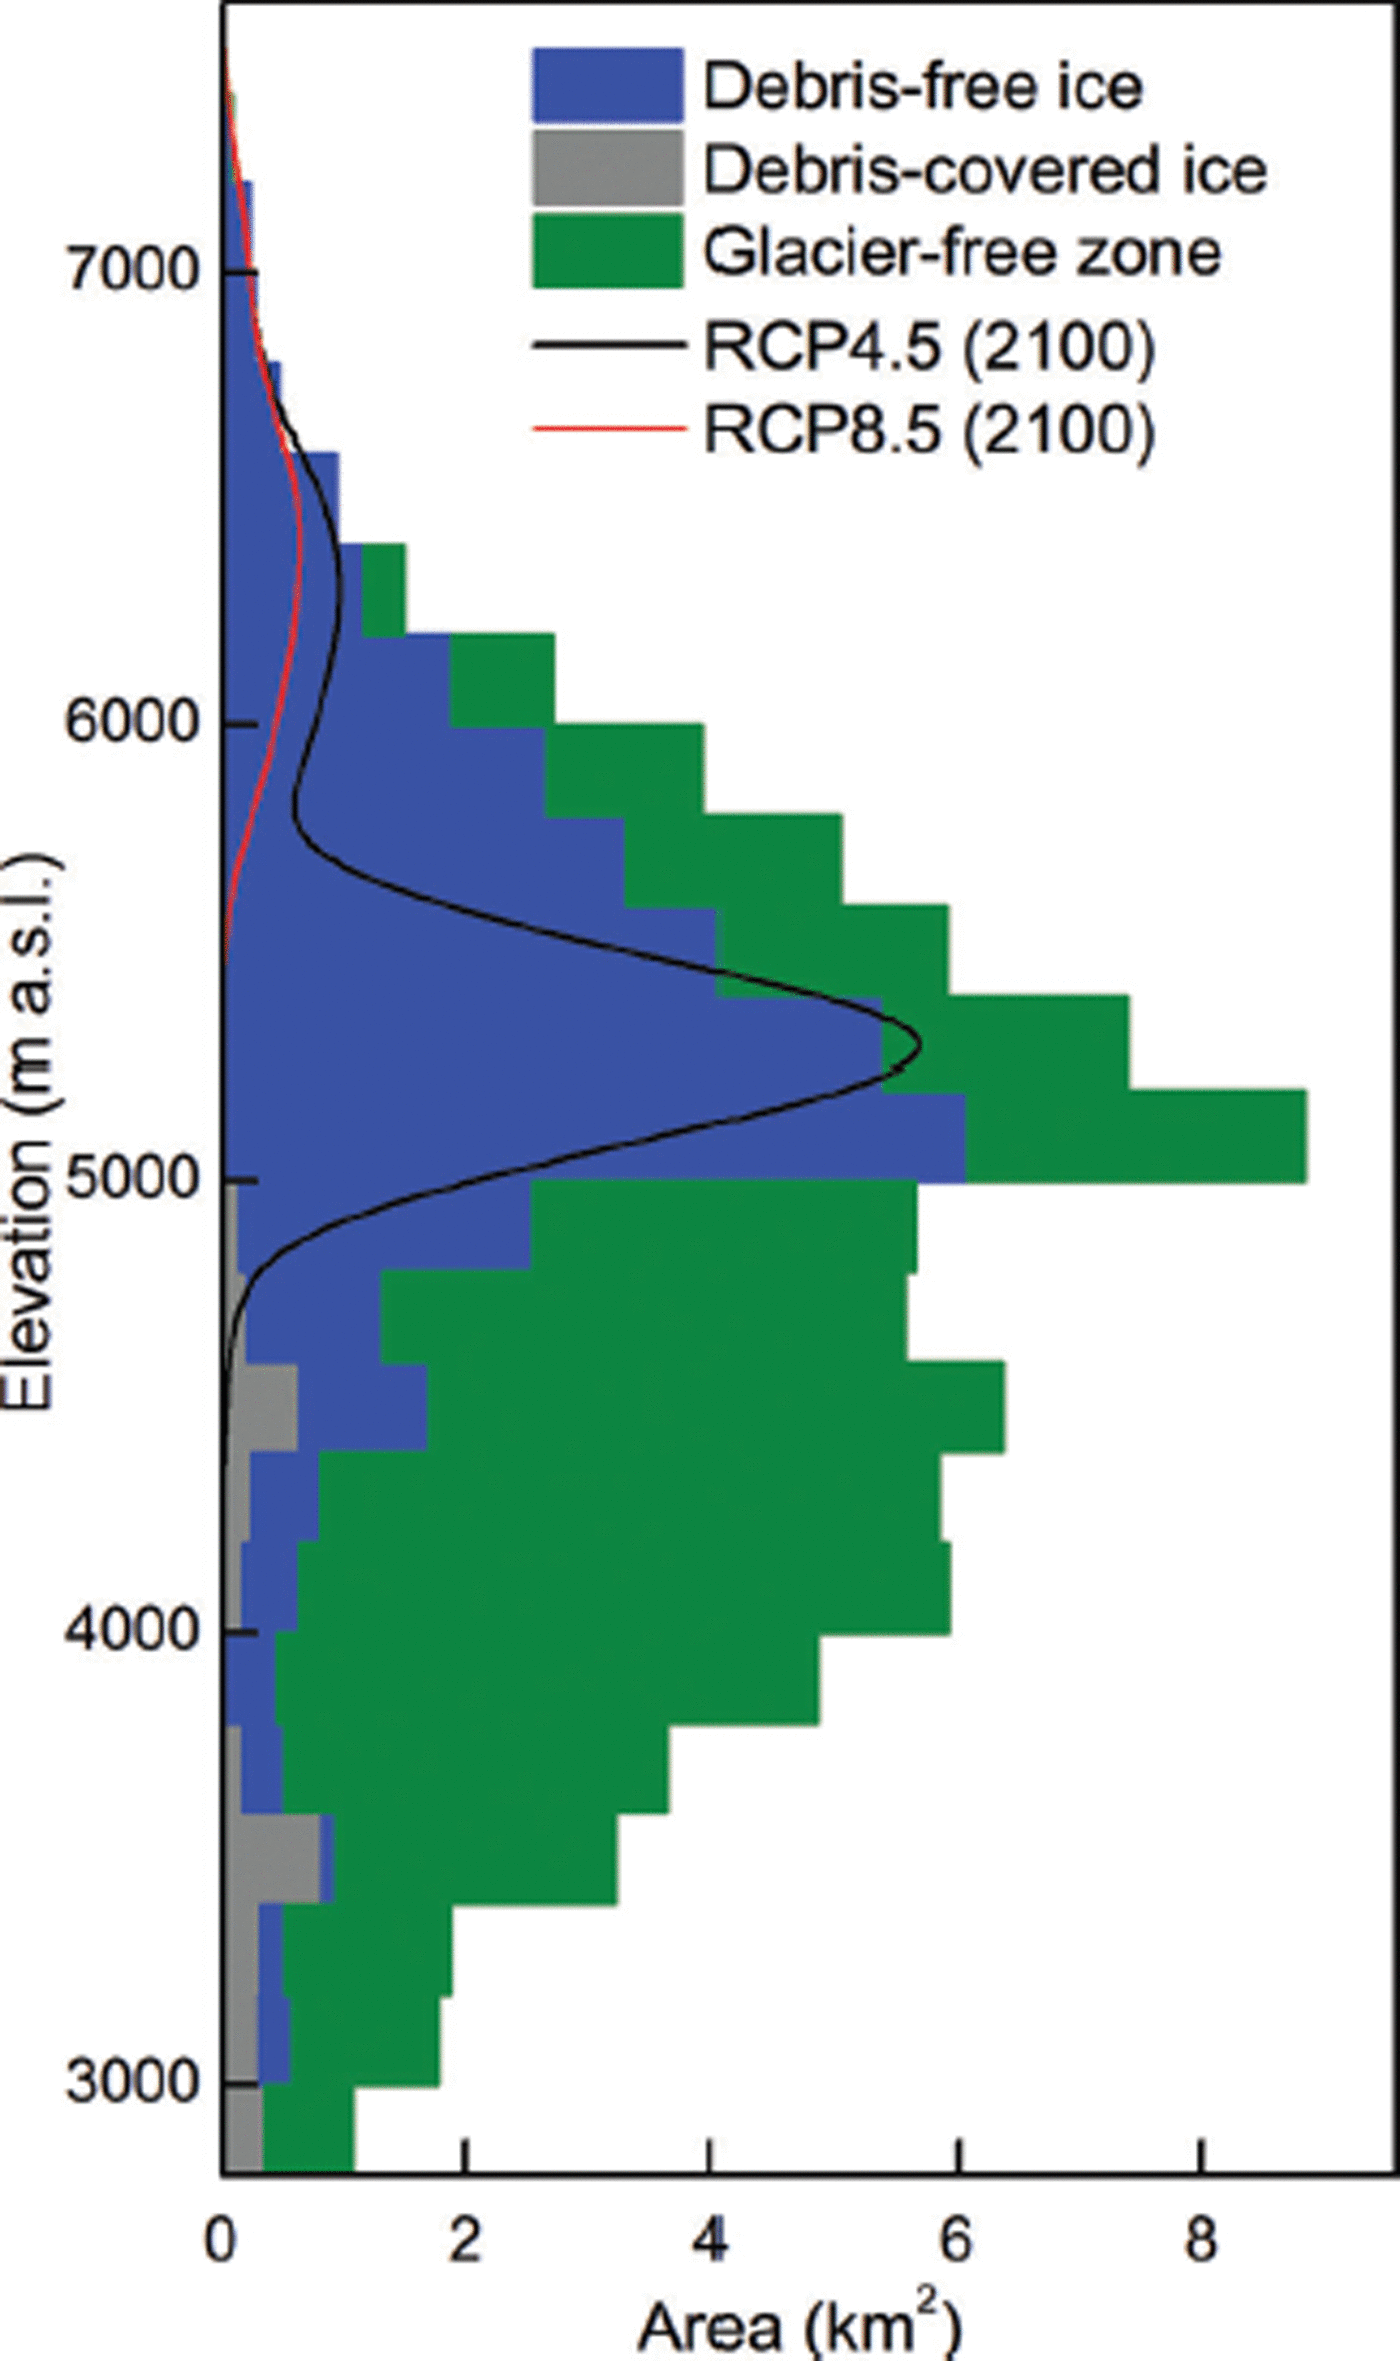
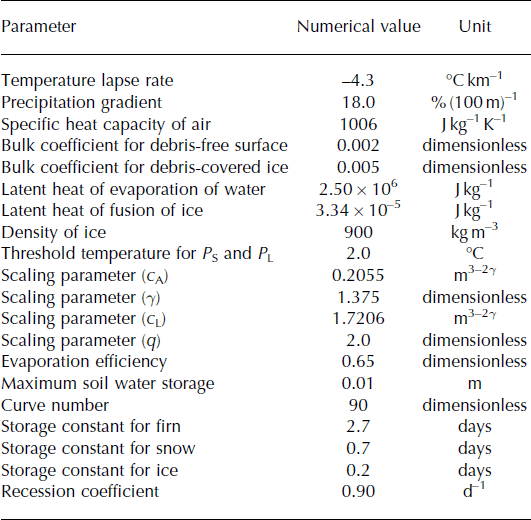
The HLG catchment is divided into glacier and glacier-free zones based on glacier outlines and a digital elevation model (DEM). The separation of the ablation zones of the three debris-covered glaciers into debris-covered and debris-free surfaces (Fig. 1) follows Reference Zhang, Hirabayashi and LiuZhang and others (2012). Their separation was based completely on the spatial distribution of the thermal resistance of the debris layer derived from remotely sensed data, because the estimated thermal resistance of a debris layer correlates reasonably well with ground-surveyed debris thickness, and its spatial pattern reflects broad-scale variations in debris extent and thickness (Reference Zhang, Fujita, Liu, Liu and NuimuraZhang and others, 2011). Each part of the catchment is subdivided at intervals of 50 m into a set of elevation bands. The area–altitude distributions of the debris-covered/debris-free surfaces along with the glacier-free zone are shown in Figure 2. The physical parameter values and units used in this study are summarized in Table 1.
Area–altitude distributions of the debris-covered and debris-free surfaces along with the glacier-free zone of the HLG catchment. Black and red lines indicate the multi-model means of projected glacier area–altitude distribution in 2100 under the RCP4.5 and RCP8.5 scenarios, respectively.
Summary of the physical parameters used in this study
3.2. Glacio-hydrological processes
Runoff from the HLG catchment consists of four possible contributing factors: glacier runoff, rainfall runoff, snowmelt and base flow. Glacier runoff consists of all runoff exiting the glacier, including all melt- and rainwater that runs off the glacierized area (Reference Radić and HockRadić and Hock, 2014). Irrespective of glacier runoff, other runoff components are from the glacier-free zone of the catchment. Rainfall runoff consists of the surface runoff from rainfall, runoff from snowmelt consists of the snowmelt released from the snowpack, and base flow is released from the groundwater storage (Reference Neitsch, Arnold, Kiniry and WilliamsNeitsch and others, 2011). We calculate these runoff components with a daily time step using a catchment-scale surface energy-/mass-balance model for glacier runoff and a simple hydrological model for runoff from the glacier-free zone. The different modelling steps are described in detail in the following.
3.2.1. Glacier runoff
Glacier runoff for each elevation band is estimated using the surface energy-/mass-balance model, which is identical to that developed by Reference Zhang, Hirabayashi and LiuZhang and others (2012). The model consists of two coupled components: a surface model that computes the energy available for melting from the exchange of energy between the debris-covered/debris-free surfaces and the atmosphere, and a subsurface model that treats processes occurring in the subsurface after meltwater percolates into the underlying layers. The model particularly accounts for the spatial characteristics of debris cover and the physical mechanisms of ice melt under debris cover. According to the separation used by Reference Zhang, Hirabayashi and LiuZhang and others (2012), glaciers of the catchment were classified into debris-covered and debris-free surfaces. The presence of debris cover on a glacier has a large impact on the surface energy balance as debris cover imposes a barrier between the atmosphere and the ice, which requires a different treatment than that for a debris-free surface. The model solves the surface energy-balance equation to determine the energy available for melting (Q M) at the debris-free surface, which is given by

where R S, R Ld, R Lu, Q S, Q L, Q R and Q G are the downward shortwave radiation flux, the downward longwave radiation flux, the upward longwave radiation flux, turbulent fluxes of sensible and latent heat, the heat flux from rain, and the conductive heat flux into the glacier surface, respectively, and is the surface albedo. At the debris-covered surface, the conductive heat flux (Q’G) is the only heat flux considered to reach the glacier ice through the debris layer with the simplifying assumption of a linear temperature profile within the debris layer and no heat storage in the debris layer. Hence, the conductive heat flux from the surface toward the debris/ice interface can be described as a function of the surface temperature, the temperature at the interface between debris and ice, and the thermal resistance of the debris layer. Therefore, the energy available for ice melting at the debris-covered surface is calculated as

where α′ is the albedo of the debris-covered surface, R is the thermal resistance of the debris layer (m2 KW−1),  is the debris surface temperature (°C), and T
I is the ice temperature at the ice–debris surface, which is assumed to be the melting point (Reference Zhang, Fujita, Liu, Liu and NuimuraZhang and others, 2011).
is the debris surface temperature (°C), and T
I is the ice temperature at the ice–debris surface, which is assumed to be the melting point (Reference Zhang, Fujita, Liu, Liu and NuimuraZhang and others, 2011).
All components of the energy balance are defined as positive toward the surface using units of W m−2, and negative away from the surface. The model computes these fluxes on a daily time step from the meteorological and topographic data. The net shortwave radiation is calculated from the downward shortwave radiation and the surface albedo. However, downward shortwave radiation data are not available for the catchment before 2005, and are estimated by applying the scheme of Reference Zhang, Hirabayashi and LiuZhang and others (2012). They found a favourable correlation between precipitation and atmospheric transmissivity of solar radiation in terms of the monthly mean values. This relationship is used to estimate the daily mean transmissivity from daily precipitation data. The downward shortwave radiation is then calculated from the estimated transmissivity and the incoming shortwave radiation at the top of the atmosphere. Details of this approach are provided by Reference Zhang, Hirabayashi and LiuZhang and others (2012). Snow and debris-covered/debris-free ice albedos are treated individually. Our snow albedo scheme follows that of Reference Yamazaki, Kondo, Sakuraoka and NakamuraYamazaki and others (1993) and Reference FujitaFujita (2007). They suggested that snow albedo is the net result of multiple reflections of broadband shortwave radiation under the assumption that snowpack consists of an ice plate and air layer in the vertical dimension. With their approach, the relevant snow physical property is snow density, which is used to calculate snow specific surface area relevant to the optical properties of snow. Special attention is paid to the maritime glaciers, on which melting and refreezing of snow are likely to be the main cause of short-term density changes through snow compaction (Reference Li and SuLi and Su, 1996). Hence, we calculate the albedo using this simplified concept of multiple scattering in an ice plate whose thickness is related to the surface snow density, which changes with snow compaction. This scheme has been validated against observations on different glaciers of the TP (e.g. Reference Fujita and AgetaFujita and Ageta, 2000; Reference Sakai, Fujita, Nakawo and YaoSakai and others, 2009; Reference Fujita and NuimuraFujita and Nuimura, 2011). The albedos of debris-covered and debris-free surfaces are set to 0.2 and 0.3, respectively, whereas that of the initial fresh snow is assumed to be 0.8 (Reference Zhang, Hirabayashi and LiuZhang and others, 2012). Downward longwave radiation is estimated from an empirical equation using air temperature, relative humidity and the ratio of solar radiation to the theoretical top-of-atmosphere radiation based on the scheme of Reference Glover and McCullochGlover and McCulloch (1958) and Reference KondoKondo (1994). Upward longwave radiation is calculated using the Stefan–Boltzmann equation and the surface temperature, assuming a black body for the snow/ice surface. The turbulent heat fluxes are determined using the bulk formulae, and the heat flux supplied by rain is calculated using an equation suggested by Reference Hay and FitzharrisHay and Fitzharris (1988). These fluxes are calculated as

where T S and T a are the temperatures of the surface and air (°C), respectively, c a and c w are the specific heat capacities of air and water, respectively, ρ a and ρ w are the densities of air and water, C is the bulk coefficient for sensible and latent heat, U is the wind speed (m s−1), l e is the latent heat of the evaporation of water, and rh is the relative humidity. T r is the rainfall temperature (which can be approximated by T a), and q is the saturated specific humidity (kg kg−1) which is calculated as a function of air temperature using the empirical equations presented by Reference KondoKondo (1994). All energy-balance components at the glacier surface, except for the shortwave radiation term, are explicitly determined from the surface temperature. Therefore, the surface temperature for the debris-free surface is solved to satisfy all heat balance equations by iterative calculation of the conductive heat flux, which is obtained by calculating the temperature profile of the snow layer and/or glacier ice. For the debris-covered surface, the surface temperature is determined numerically by an iterative approach consistent with previous studies of debris-covered glaciers (e.g. Reference Nicholson and BennNicholson and Benn, 2006; Reference Reid, Carenzo, Pellicciotti and BrockReid and others, 2012).
The precipitation phase (snow, rain or sleet) for each elevation band of the catchment is determined using the daily air temperature. A temperature of 2°C is used, at or below which precipitation falls in solid form (P S) and above which precipitation falls as rain (P L). A mixture of snow and rain is assumed within a transition zone ranging from 1 K above to 1 K below the threshold temperature. Within this temperature range, the snow and rain percentages of total precipitation are obtained by linear interpolation. This threshold is derived by Reference Liu, Zhang, Zhang and DingLiu and others (2009) using long-term in situ observations of precipitation type and air temperature in the southeastern TP. Additionally, redistribution of the original snowfall by wind transport or avalanche is not considered. Therefore, glacier runoff (D; defined as all melt- and rainwater without evaporation and refreezing) for each elevation band is obtained as

where l f is the latent heat of fusion of ice. The refreezing amount (R F) is estimated by considering the conduction of heat into glacier ice, the snow layer, and the presence of water at the interface between the snow layer and glacier ice, which is identical to the estimation developed by Reference Fujita and AgetaFujita and Ageta (2000). Refreezing during winter and during shorter cooling events is also considered by assuming a maximum water content of 5% by volume (Reference Zhang, Hirabayashi and LiuZhang and others, 2012).
Glacier runoff is routed through the glacier to the catchment outlet based on a linear reservoir model (Reference Baker, Escher-Vetter, Moser, Oerter and ReinwarthBaker and others, 1982), which has been applied widely to route water through glaciers in various regions (Reference Hock and NoetzliHock and Noetzli, 1997; Reference Escher-VetterEscher-Vetter, 2000; Reference Zhang, Liu and DingZhang and others, 2007; cf. Hock and Jansson, 2005). The approach assumes that the reservoir volume, V(t), is proportional to its runoff, Q(t), the factor of proportionality being the storage constant, k, with units of time. Storage and continuity equations for the reservoir are given by

where R(t) is the rate of water inflow to the reservoir, here equivalent to the glacier runoff of each elevation band. According to glacier surface characteristics obtained from field surveys (Reference Li and SuLi and Su, 1996), we subdivide the glaciers into three reservoirs with different storage constants: an ice reservoir, defined as the area of debris-covered and debris-free ice below the mean equilibrium-line altitude (5068 m a.s.l.; Reference Zhang, Hirabayashi and LiuZhang and others, 2012), a firn reservoir, defined as the area above 6000 m a.s.l. (Reference Li and SuLi and Su, 1996), and a seasonally variable snow reservoir, defined as the snow-covered area outside the firn reservoir.
To capture the feedback between glacier mass balance and changing glacier hypsometry (i.e. changes in volume, surface area and elevation range), volume–area and volume–length scaling (Reference BahrBahr, 1997; Reference Bahr, Meier and PeckhamBahr and others, 1997) are used to adjust glacier length and area–altitude distribution at the end of each mass-balance year. This approach has been widely used to model changes in glacier hypsometry in different studies at different scales (e.g. Reference Radić, Hock and OerlemansRadić and others, 2008; Reference Hirabayashi, Döll and KanaeHirabayashi and others, 2010, Reference Hirabayashi, Zhang, Watanabe, Koirala and Kanae2013; Reference Radić and HockRadić and Hock, 2011; Reference Luo, Arnold, Liu, Wang and ChenLuo and others, 2012; Reference Marzeion, Jarosch and HoferMarzeion and others, 2012). Changes in glacier volume (ΔV), area (ΔA) and length (ΔL) during each mass-balance year are estimated as

where B(t) is the specific mass balance during the mass-balance year, a sum of surface accumulation, ablation and refreezing, c A, c L, γ and q are scaling parameters, A S(t) and A E(t) are the surface area of the glacier at the start (1 October) and end (30 September the following year) of the mass-balance year, respectively, V(t + 1) is the glacier volume at the end of the mass-balance year and L(t) is the glacier length at the start of the mass-balance year. The change in glacier length determines the elevation range at the end of the mass-balance year, which is associated with the area–altitude distribution of the catchment. The area for each elevation band is adjusted at the end of the mass-balance year based on the updated glacier elevation range using a function of the area–altitude distribution derived by Reference Hirabayashi, Döll and KanaeHirabayashi and others (2010, Reference Hirabayashi, Zhang, Watanabe, Koirala and Kanae2013). They applied this function to estimate the past and future mass changes in global mountain glaciers and ice caps.
3.2.2. Runoff from the glacier-free zone
For each elevation band of the glacier-free zone, we use the US Soil Conservation System (SCS) curve number method (SCS, 1972), in which the curve number parameter is calibrated, to estimate rainfall runoff. We classify precipitation as rain or snow using the mean daily air temperature. Snowfall is stored at the ground surface in the form of snowpack. The initial snowpack is assumed to be zero at the end of the 1951 melt season. The snowpack will increase with additional snowfall or decrease with snowmelt or evaporation. The mass balance for the snowpack is expressed as

where SN is the water content of the snowpack (mm w.e.). The energy used for snowmelting (Q SM) is estimated from the energy balance over the snow surface, as shown in Eqn (1). Potential evaporation in the case of no snow on the glacier-free surface is calculated according to the Penman–Monteith equation (Reference Allen, Pereira, Raes and SmithAllen and others, 1998). The Penman–Monteith equation combines components that account for the energy needed to sustain evaporation, the strength of the mechanisms required to remove the water vapour, and aerodynamic and surface resistance terms (Reference Neitsch, Arnold, Kiniry and WilliamsNeitsch and others, 2011). This equation was applied to estimate the evaporation for different surfaces in the HLG catchment and adjacent regions in the 1990s, and performed well as judged by comparison of simulated and observed evaporation (Reference Cheng, Yu and ZhaoCheng and others, 2004). The equation gives a value under a reference condition, which is used as a basis to estimate the actual evaporation. Here actual evaporation is determined by multiplying potential evaporation by evaporation efficiency (Table 1).
The sum of rainfall runoff, actual evaporation, and snowmelt is then added to the soil water storage, and if the maximum soil water storage (Table 1) is exceeded, recharge to the groundwater occurs. Base flow is calculated using the base flow simulation approach in the Soil Water Assessment Tool (SWAT) model. SWAT partitions groundwater into two aquifer systems: a shallow aquifer that contributes to runoff in the watershed and a deep aquifer that contributes to runoff somewhere outside the watershed (Reference Neitsch, Arnold, Kiniry and WilliamsNeitsch and others, 2011). This method has been widely applied to different glacierized catchments in the TP (e.g. Reference Luo, Arnold, Liu, Wang and ChenLuo and others, 2012; Reference Immerzeel, Pellicciotti and BierkensImmerzeel and others, 2013; Reference Lutz, Immerzeel, Shrestha and BierkensLutz and others, 2014). SWAT generally uses a quick-reacting reservoir (shallow aquifer storage) approach to simulate base flow (Reference Neitsch, Arnold, Kiniry and WilliamsNeitsch and others, 2011). Subsequently, Reference Luo, Arnold, Liu, Wang and ChenLuo and others (2012) added a slow-reacting linear reservoir to the available quick-reacting reservoir for base flow generation in the SWAT model and applied it to simulate the runoff process in a glacier and snowmelt-dominated basin in the Tien Shan. Their results indicate that a combination of two linear reservoirs leads to the best results in reproducing the streamflow processes. Hence, our base flow scheme follows the base flow simulation scheme of Reference Luo, Arnold, Liu, Wang and ChenLuo and others (2012). The total base flow (Q b) in the scheme of Reference Luo, Arnold, Liu, Wang and ChenLuo and others (2012) is given by

where W rchrg is the amount of recharge entering the aquifers, the subscripts ‘sh’ and ‘dp’ indicate the shallow and deep aquifers, respectively, α gw is the delay time of the overlying geologic formations, t is the number of days, and Δt is the step time length. Details of the base flow approach and parameter definitions in SWAT are provided by Reference Neitsch, Arnold, Kiniry and WilliamsNeitsch and others (2011) and Reference Luo, Arnold, Liu, Wang and ChenLuo and others (2012). The delay times for the shallow and deep aquifers and soil parameters (including soil moisture content and maximum soil water storage), derived from field experiments in the HLG catchment and adjacent catchments, were given by Reference Cheng, Yu and ZhaoCheng and others (2004). Finally, the total runoff for each elevation band of the glacier-free zone is calculated as the sum of rainfall runoff, snowmelt and base flow and is routed to the catchment outlet using a recession function (Reference MartinecMartinec, 1975), in which a recession coefficient is calibrated.
3.3. Input data
The model is forced by a combination of local meteorological observations and observation-based global gridded data. The local meteorological forcing data required by the model include air temperature, precipitation, wind speed, relative humidity and the incoming solar radiation at daily time steps observed at GAEORS (Fig. 1). Daily temperature, precipitation, wind speed and relative humidity are available for the period 1988–2013, and incoming solar radiation is available for the period 2005–13. The observation-based global gridded datasets of daily precipitation and near-surface temperature are available for the period 1951–2007 at a spatial resolution of 0.5°. The temperature dataset (Reference Hirabayashi, Kanae, Motoya, Masuda and DöllHirabayashi and others, 2008) was generated based on monthly temperature and monthly diurnal temperature ranges of the Climate Research Unit version TS 2.1 data for the period 1951–2002 (CRU; Reference Mitchell and JonesMitchell and Jones, 2005) and the dataset of Reference Fan and Van den DoolFan and Van den Dool (2008) for the period 2003–07 scaled using the mean ratio of monthly temperatures of CRU and their data from 1986 to 2002. The daily precipitation dataset was created by collecting rain gauge observation data, a long-term continental-scale daily product (Reference Yatagai, Arakawa, Kamiguchi, Kawamoto, Nodzu and HamadaYatagai and others, 2009). The global gridded data were bias-corrected on a daily timescale using linear regression relations established between local observations at GAEORS and gridded data (Reference Zhang, Hirabayashi and LiuZhang and others, 2012). The bias-corrected temperature and precipitation correlate well with the corresponding observations from GAEORS, yielding correlation coefficients of 0.96 and 0.87 and root-mean-square error values of 1.5°C and 0.001 m, respectively (Reference Zhang, Hirabayashi and LiuZhang and others, 2012). This confirms that the bias-corrected gridded data correspond sufficiently well with observed temperature and precipitation from GAEORS. In this study, we directly use the bias-corrected gridded temperature and precipitation data.
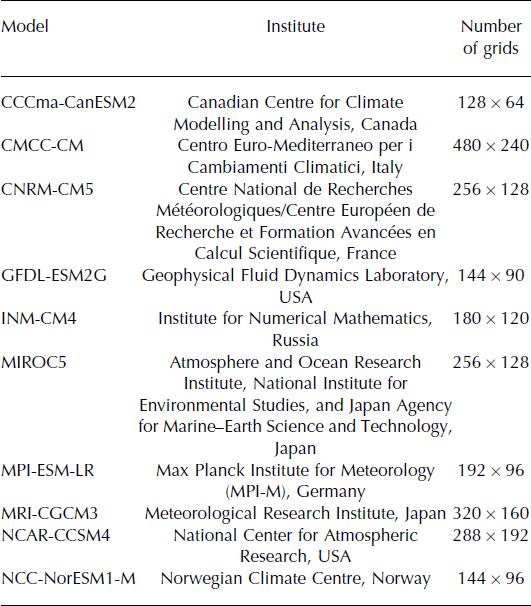
To analyse future changes in the variability of glacier runoff and other runoff components under climate change, daily air temperature and precipitation from the latest ten general circulation models (GCMs; Table 2) participating in the fifth phase of the Coupled Model Intercomparison Project (CMIP5; Reference Taylor, Stouffer and MeehlTaylor and others, 2012) are used to project changes in all runoff components of the catchment. Two CMIP5 GCM simulations are employed in this study: historical simulations (1948–2005) forced by natural (e.g. volcanic and solar) and anthropogenic (e.g. greenhouse gases and ozone) forcings and future simulations (2006–2100) forced by the representative concentration pathway (RCP) scenarios (Reference Van VuurenVan Vuuren and others, 2011). The RCPs span a range of radiative forcing from 2.6 to 8.5 W m−2, representing various possible climate outcomes (Reference MossMoss and others, 2010). Here we only use the results for the moderate RCP4.5 and the most extreme RCP8.5 scenarios.
Summary of the ten CMIP5 GCMs selected for this study. The institution and model names are taken from http://cmip-pcmdi.llnl.gov/cmip5/availability.html. Size information is extracted from data headers
For each elevation band, the air temperature and precipitation time series are interpolated according to its mean elevation using altitude-dependent lapse rates. The air temperature is assumed to decrease with increasing altitude with a constant lapse rate (Table 1), which was derived from field observations of the catchment (Reference Zhang, Hirabayashi and LiuZhang and others, 2012). Precipitation increases with altitude in the catchment, based on a precipitation gradient (Reference Cheng, Yu and ZhaoCheng and others, 2004; Reference LiuLiu and others, 2010). The precipitation gradient (Table 1) was calibrated in the same catchment by Reference Zhang, Hirabayashi and LiuZhang and others (2012). Wind speed observed from GAEORS is not interpolated and is assumed representative for the entire catchment due to its weak correlation with the melt rate (Reference OhmuraOhmura, 2001).
Monthly runoff data from the gauge station located at the river outlet of the catchment (Fig. 1) are used to evaluate the model results. Runoff records are available for the period 1994–2007. The area and length of each glacier in the catchment are derived from the Chinese Glacier Inventory (Reference PuPu, 1994), which provides pre-1966 information. To estimate the glacier area in different periods, glacier outlines for 1966, 1975, 1994 and 2007 are obtained as shape files from Reference LiuLiu and others (2010). They produced glacier outlines for different periods based on topographic maps and remotely sensed data. Information on debris thickness and the spatial distribution of the thermal resistance of the debris layer is derived from Reference Zhang, Fujita, Liu, Liu and NuimuraZhang and others (2011, Reference Zhang, Hirabayashi and Liu2012), who carried out extensive in situ surveys of debris thickness on the ablation zone of HLG glacier (Fig. 1) and estimated the spatial distribution of the thermal resistance of the debris layer on the ablation zones of three debris-covered glaciers from remotely sensed data. Additionally, a DEM at a spatial resolution of 90 m, which was produced from aerial photographs acquired in 1989 (Reference Zhang, Fujita, Liu, Liu and WangZhang and others, 2010), is used to compute the area of each elevation band and spatially distribute meteorological data.
3.4. Calibration and validation
Model calibration involves constraining model parameters to obtain the best fit between the simulated results and the available observed data. The model is initially run using the observed meteorological data from GAEORS for a total of 7 years (1994–2000) to calibrate the parameters of the storage constants for ice, snow and firn, as well as the curve number and the recession coefficient. These parameters are adjusted within ranges based on previously published values to minimize the difference between simulated and observed monthly runoff for the period 1994–2000. The parameters associated with the best agreement between observed and modelled monthly runoff in different years are chosen. After model calibration, the model is evaluated against an independent set of monthly runoff data collected for the time period 2001–07. Additionally, the approach for simulating glacier hypsometry is evaluated by comparing the modelled glacier area with satellite-based observations during different periods.
Using a single criterion in the calibration and validation processes constrains the model parameters to fit certain characteristics of the observed data and neglects the remaining features. Therefore, we adopt multiple criteria to assess the model performance: the Nash–Sutcliffe efficiency (NSE; Reference Nash and SutcliffeNash and Sutcliffe, 1970) and the per cent bias (PBIAS; Reference Moriasi, Arnold, Liew, Bingner, Harmel and VeithMoriasi and others, 2007), which are given by


where Q
obs and Q
sim are the observed and simulated runoff at month i, and  is the mean of observed runoff.
NSE is a normalized statistic that determines the relative magnitude of the residual variance compared with the measured variance (Reference Nash and SutcliffeNash and Sutcliffe, 1970). NSE ranges between −∞ and 1.0 (1 inclusive), with NSE = 1 for perfect agreement between observed and simulated. NSE values between 0.0 and 1.0 indicate acceptable performance, whereas values <0.0 indicate unacceptable performance. However, NSE tends to an overestimation of model performance during peak flows and an underestimation during low-flow conditions (Reference Legates and McCabeLegates and McCabe, 1999). PBIAS measures the average tendency of the simulated values to be smaller or larger than observed values, so it can clearly indicate poor model performance. However, over different periods PBIAS can yield an average value close to zero, indicating good model balance, even though there had been extremes (Reference Moriasi, Arnold, Liew, Bingner, Harmel and VeithMoriasi and others, 2007). PBIAS = 0 is the optimal value, with lower-magnitude values indicating more accurate model simulation. Positive values indicate model underestimation bias, and negative values indicate model overestimation bias. The two criteria are commonly used in model evaluation. As suggested by Reference Moriasi, Arnold, Liew, Bingner, Harmel and VeithMoriasi and others (2007), the modelling performance can be classified as ‘very good’, ‘good’, ‘satisfactory’ or ‘unsatisfactory’ where 0.75 < NSE ≤ 1.0, 0.65 < NSE ≤ 0.75, 0.50 < NSE ≤ 0.65 or NSE ≤ 0.50, respectively, and where PBIAS <±10%, ±10% ≤ PBIAS < ±15%, ±15% ≤ PBIAS <±25% or PBIAS ≥ ±25%, respectively.
3.5. Bias correction of the GCM data
The daily outputs of the CMIP5 GCMs from 1948–2100 were spatially interpolated from original resolutions (specified in Table 2) to 0.5° × 0.5° using a bilinear interpolation. The bilinear interpolation is preferred to a simple re-gridding method because it provides a realistic spatial gradient rather than patches of the same meteorological values from a GCM gridcell in multiple 0.5° gridcells (Reference Koirala, Hirabayashi, Mahendran and KanaeKoirala and others, 2014). Evaluation of the CMIP5 GCMs over the TP suggested that most reasonably capture the climatological patterns and spatial variations of the observed temperature and that half of the GCMs are able to reproduce the observed seasonal pattern for precipitation (Reference Su, Duan, Chen, Hao and CuoSu and others, 2013), but the GCM outputs contain biases that must be corrected prior to use at the local glacier scale. The delta change approach (e.g. Reference Hay, Wilby and LeavesleyHay and others, 2000; Reference Graham, Andréasson and CarlssonGraham and others, 2007; Reference Sperna Weiland, Van Beek, Kwadijk and BierkensSperna Weiland and others, 2010) is therefore used for bias correction of the GCM data. The approach involves adjusting the GCM daily meteorological variables by adding the difference (temperature) or ratio (precipitation) in 18 year (1988–2005) average monthly means between the GAEORS time series and the GCM time series to obtain daily meteorological variables at the gridpoint of the GCMs closest to GAEORS. For temperature and precipitation, an additive correction and a multiplicative correction are used, respectively, as

and

where T and P are the daily temperature and precipitation,  and
and  are the 18 year average monthly temperature and precipitation, and subscripts ‘OBS’, ‘GCM’ and ‘corrected’ denote observed, GCM and bias-corrected data. Applying the method as indicated in Eqn (12) results in unrealistic precipitation peaks in the bias-corrected precipitation time series due to large differences between the bias-corrected precipitation amount and the observed amount and number of wet days (Reference Van BeekVan Beek, 2008; Reference Sperna Weiland, Van Beek, Kwadijk and BierkensSperna Weiland and others, 2010). To overcome this limitation, a threshold
 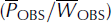 (e.g. Reference Van BeekVan Beek, 2008; Reference Sperna Weiland, Van Beek, Kwadijk and BierkensSperna Weiland and others, 2010), defined as the mean daily precipitation amount observed from GAEORS, is used. If the threshold is not exceeded for the monthly precipitation sum of the GCM or the multiplicative correction factor, the days on which precipitation occurs are calculated from a temperature limit below which a day becomes wet. Here the temperature limit (T
crit) is calculated as
(e.g. Reference Van BeekVan Beek, 2008; Reference Sperna Weiland, Van Beek, Kwadijk and BierkensSperna Weiland and others, 2010), defined as the mean daily precipitation amount observed from GAEORS, is used. If the threshold is not exceeded for the monthly precipitation sum of the GCM or the multiplicative correction factor, the days on which precipitation occurs are calculated from a temperature limit below which a day becomes wet. Here the temperature limit (T
crit) is calculated as

where T
max and T
min are the maximum and minimum temperature of the given month,  is the 18 year average number of wet days for the specific month, and N is the total number of days in the specific month. Consequently, the number of wet days of the GCM per month (W
GCM) is estimated, and the corresponding precipitation amount for these days (P
corrected_w
) is calculated as
is the 18 year average number of wet days for the specific month, and N is the total number of days in the specific month. Consequently, the number of wet days of the GCM per month (W
GCM) is estimated, and the corresponding precipitation amount for these days (P
corrected_w
) is calculated as

4. Results and Discussion
4.1. Model performance
The surface energy-/mass-balance model used in this study has been tested for its predictive capability for accurate simulation of prognostic variables (e.g. ablation, accumulation and refreezing) at the catchment scale, and in particular has demonstrated its ability to reasonably reproduce ice melt rates beneath various thicknesses of debris observed in different periods (Reference Zhang, Hirabayashi and LiuZhang and others, 2012). The integrated model performance for simulating runoff is assessed by comparing simulated with observed monthly runoff for both calibration (1994–2000) and validation (2001–07) time periods. Scatter plots of simulated versus observed monthly runoff are shown in Figure 3a and b, and time series of simulated and observed monthly runoff are presented for the entire period of analysis in Figure 3c. The results of model calibration demonstrate a close agreement between simulated and observed monthly runoff (Fig. 3a and c), yielding an NSE value of 0.86 and PBIAS value of 5% (Table 3). This implies that the model successfully replicates all key glacio-hydrological processes in the catchment using the optimal parameter sets (Table 1), with a rating of ‘very good’ on the scale of Reference Moriasi, Arnold, Liew, Bingner, Harmel and VeithMoriasi and others (2007). Therefore, these parameters are selected as the best solution for further analysis, and the calibrated model is verified against an independent set of runoff data. Although the model yields a lower NSE value (Table 3) for the evaluation period relative to the calibration period, with a PBIAS value of −7%, the calibrated model generally reproduces the observed runoff well and captures the long-term trend (Fig. 3c). Note that the calibrated model overestimates the peak summer runoff in most years (Fig. 3c), and overestimates the July–August runoff by an average of 8%. This overestimation may be associated with the glacier extent used in the simulation. The simulation is performed using constant glacier extent during a mass-balance year, and the glacier extent used is estimated at the end of the previous mass-balance year. In effect, glacier extent change is a dynamic process in the mass-balance year. Specifically, glacier extent during July–August may be minimum in the mass-balance year due to dramatic melting. Consequently, the simulation with the model-estimated glacier extent overestimates the summer runoff compared to the observed runoff originated from the actual ice extent.
Scatter diagrams of observed versus modelled monthly runoff (Q) for calibration (a) and validation (b), and time series of observed and modelled monthly runoff for the entire period 1994–2007 (c).

Model calibration and validation results for the HLG catchment
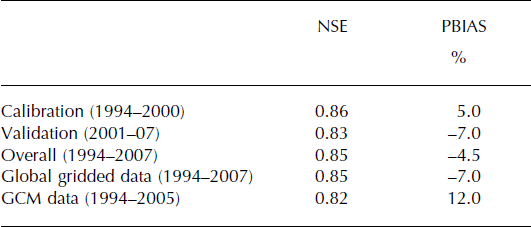
To validate the bias-corrected temperature and precipitation of the GCM and the observation-based global gridded datasets, we calculate the runoff of the catchment using the calibrated model forced by the two datasets. A comparison of simulated and observed monthly runoff for the entire analysis period (Fig. 4a) indicates that the observed runoff is reasonably reproduced by the model forced by the bias-corrected datasets. The NSE values for the bias-corrected GCM and global gridded datasets are 0.82 and 0.85, respectively, and the PBIAS values are <12% (Table 3). Overall, the bias-corrected temperature and precipitation of the GCM and the observation-based global gridded datasets can be used as input to reproduce river runoff in the catchment well. Additionally, the glacier areas in 1966, 1975, 1994 and 2007 are simulated using the calibrated model forced by the bias-corrected global gridded temperature and precipitation over the period 1951–2007. We then compare the modelled glacier area to satellite-based observations in 1966, 1975, 1994 and 2007/09 derived from Reference LiuLiu and others (2010) and Reference PanPan and others (2012), who obtained glacier boundaries for different periods from multispectral satellite data and analysed uncertainties. A comparison of the simulated and satellite-based observations during different periods (Fig. 4b) indicates that the approach used in this study provides good results for periods of glacier change and is capable of capturing the feedback between glacier mass balance and changes in glacier hypsometry.
Scatter diagrams of observed versus simulated monthly runoff calculated from the bias-corrected global gridded climate dataset (1994–2007) and GCM historical data (1994–2005) (a), and satellite-based observed and simulated glacier area in 1966, 1975, 1994 and 2007 (b). Observed 1 and 2 denote satellite-based observed glacier area in different periods obtained from Reference LiuLiu and others (2010) and Reference PanPan and others (2012), respectively.

Overall, the integrated model generally reproduces the observations well. This indicates its capability for simulating glacier mass balance and the runoff at the catchment scale well, assuming that the optimal parameters are valid for different time periods. In particular, we evaluate the use of the bias-corrected GCM and global gridded datasets for modelling in the catchment and believe that accurate estimation of catchment river runoff is possible using the model forced by the bias-corrected datasets.
4.2. Past trend in glacier runoff and its hydrological impacts
We calculate variations in runoff and its components in the HLG catchment using observed meteorological data (1991–2013) extended with observation-based global gridded data (1952–90). In the HLG catchment, river runoff is dominated by glacier runoff, which contributes ∼53.4% of total runoff during 1952–2013. Irrespective of glacier runoff, base flow contributes ∼22.8% of total runoff, rainfall runoff is ∼16.8% and snowmelt is ∼7%. A consistent trend in glacier runoff and river runoff is observed (Fig. 5c): the runoff shows a slight downward trend over the period 1952–90 but displays a significant upward trend over the period 1991–2013. During 1952–90, decreased temperature is observed (Fig. 5b), particularly in the 1980s, when the catchment is coldest, leading to a small negative mass balance (Reference Zhang, Hirabayashi and LiuZhang and others, 2012). Despite the slight increase in precipitation during this period (Fig. 5a), rainfall runoff and base flow are relatively stable, contributing 38.3% of total runoff. As a result of the decrease in temperature and limited change in precipitation, glacier runoff is reduced slightly, which is the main cause of the decreased total runoff during 1952–90. On the other hand, air temperature increases significantly (Fig. 5b) at a rate of 0.27°C (10 a)−1 since 1991 (Reference Zhang, Hirabayashi and LiuZhang and others, 2012), while the precipitation initially increases and then decreases slightly (Fig. 5b). During this period, the glaciers of the catchment show significant retreat (Reference LiuLiu and others, 2010) and large negative mass balance (Reference Zhang, Hirabayashi and LiuZhang and others, 2012), with accelerated thinning at a rate of −1.61 ± 0.6 m a−1 (Reference Zhang, Fujita, Liu, Liu and WangZhang and others, 2010). As a result of accelerated glacier wasting in the catchment, glacier runoff greatly increases (Fig. 5c). We also observe a consistent increase in runoff from the glacier-free zone. River runoff in the catchment increases by 83% during 1991–2013 compared with 1952–90. According to our estimation, one-third of the increased total runoff is derived from increased glacier runoff, and the rest comes from other runoff components. In particular, ∼47% of the increased total runoff is attributable to increased glacier runoff during the past 5 years (2009–13).
Variations (1952–2013) in annual precipitation (P; a), temperature (T; b) and runoff (Q; c) in the HLG catchment, and monthly variation in each of the components of total runoff (d). The precipitation and temperature data are derived from the bias-corrected gridded dataset (1952–90) and observed dataset from GAEORS (1991–2013).

Monthly variation in the magnitude of the contribution of each runoff component to the total runoff and its intra-annual distribution are presented for the period 1961–2013 in Figure 5d. About 94.5% of the mean annual glacier runoff is observed between May and October (Fig. 5d), and the peak occurs in August, consistent with river runoff. Runoff is low during the winter months (November–April) due to reduced precipitation, which is predominantly stored as snow. The fraction of glacier runoff approaches zero during the winter months, and runoff from the glacier-free zone of the catchment is a larger component of total runoff (>∼64.5%). With increasing temperature, the contribution from snowmelt reaches a maximum in April (∼18%) and is also significant at the end of the melt season (Fig. 5d). The contribution from glacier runoff begins to increase and reaches a maximum in August (∼65%) and is also significant during the other summer months (∼40.2–60%) (Fig. 5d). The adjacent catchments of our study site on Gongga mountain are within the monsoon-dominated rainfall regime (Reference Cheng, Yu and ZhaoCheng and others, 2004), in which the runoff peak occurs in July and is directly related to the peak in rainfall during the summer months. Despite the bulk of precipitation occurring during the summer months, glacier runoff strongly modifies the seasonal distribution of river runoff in the HLG catchment, in contrast to the adjacent catchments where river runoff varies with seasonal variations in rainfall.
As discussed above, the runoff from the HLG catchment has been dominated by glacier runoff during the past 62 years. The trend in glacier runoff, which is principally dependent on the nature of the glacier response to ongoing climate warming, is a significant control on total runoff during periods of lower catchment discharge and intensifies the upward trend of the runoff during periods of higher discharge.
4.3. Future trend in glacier runoff and its contribution to river runoff
A consistent and robust feature across GCMs is a continuation of global warming in the 21st century for all the RCP scenarios (Reference Collins and StockerCollins and others, 2013). In the HLG catchment, the temperature projections for RCP4.5 and RCP8.5 reveal a significant warming by 2100 (Fig. 6a and b). The multi-model mean temperature by 2100 is projected to increase at a rate of 0.02°C a−1 for RCP4.5 (Fig. 6a) and 0.05°C a−1 for RCP8.5 (Fig. 6b) relative to the observed period (1988–2005). The precipitation projections indicate large variability among the ten GCMs (Fig. 6c and d). On average, an upward trend in precipitation by 2100 is projected at a rate of 1.9 mm a−1 for RCP4.5 (Fig. 6c) and 3.0 mm a−1 for RCP8.5 (Fig. 6d) relative to the observed period. Relative to the observed period (1988–2005), temperature is projected to increase by 2.1°C for RCP4.5 and by 4.0°C for RCP8.5 during the period 2071–2100, with projected precipitation increasing by 3% for RCP4.5 and by 7% for RCP8.5.
Projections of annual mean temperature and annual precipitation from ten GCMs, and projected anomalies in glacier area relative to the 2007 area based on two scenarios (RCP4.5 left side, RCP8.5 right side). Black curve in each plot is the mean of the ensemble.
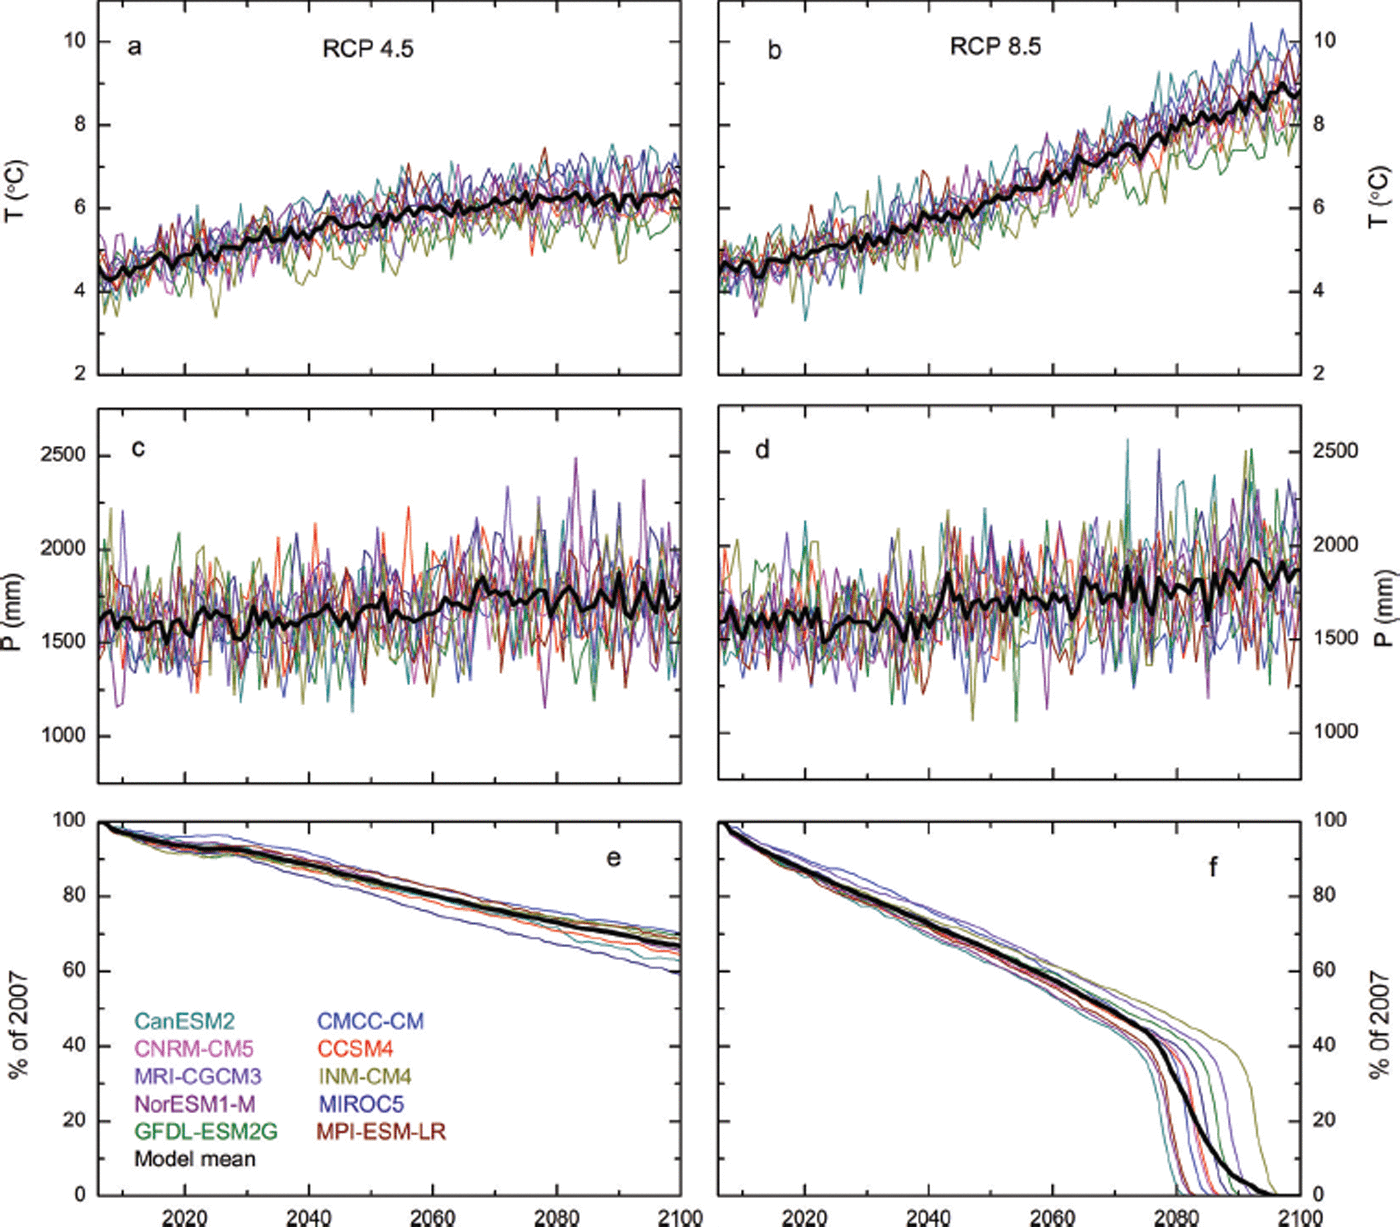
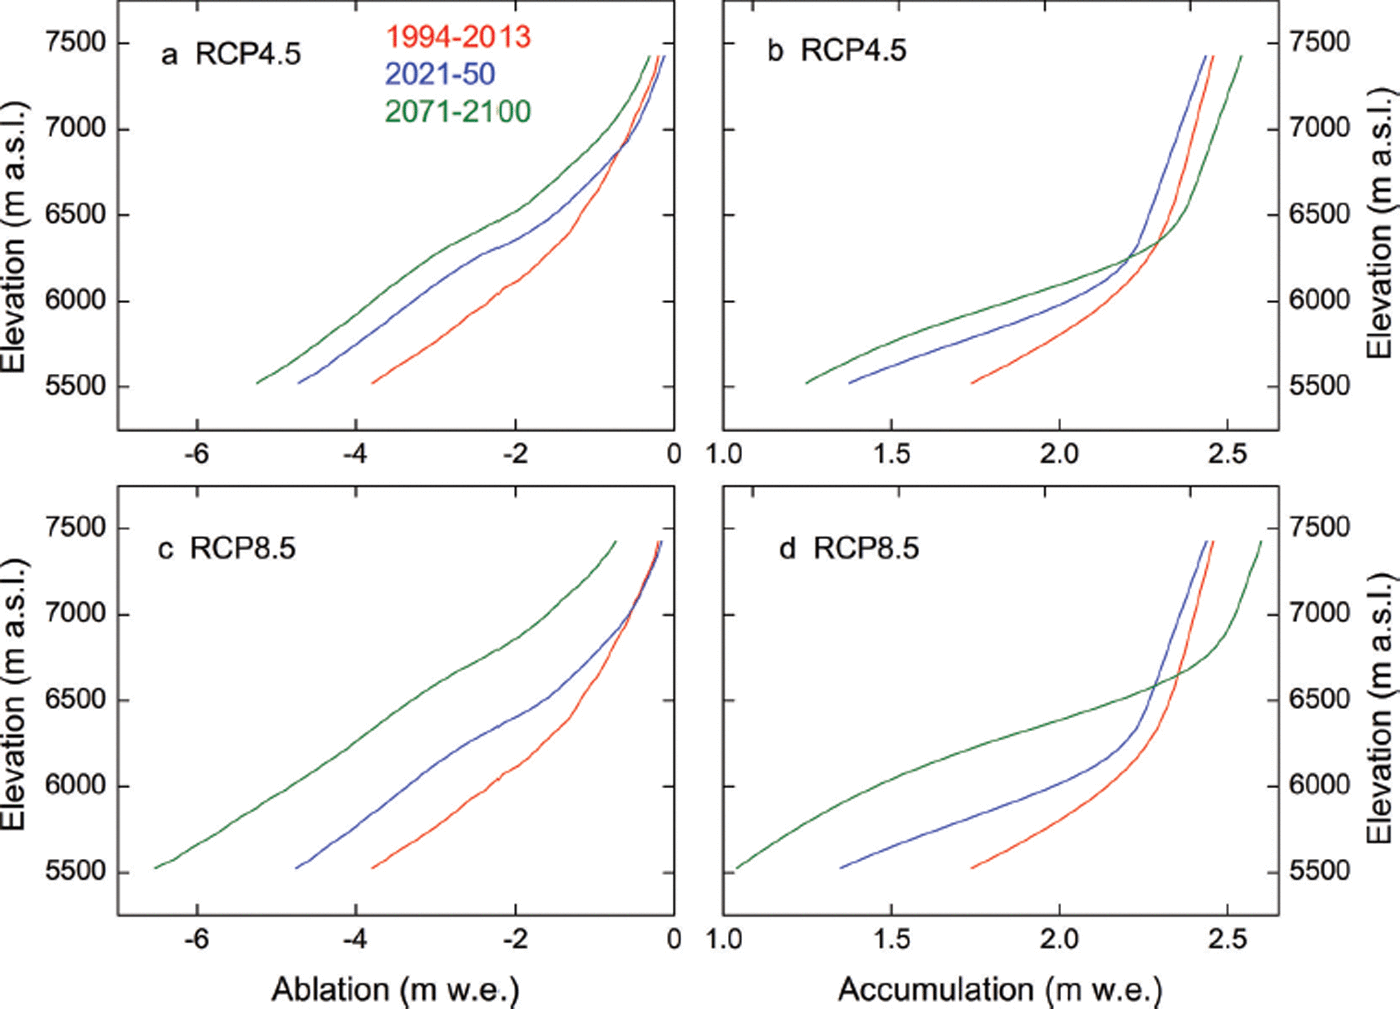
In the HLG catchment, where glacier runoff contributes significantly to total runoff, future evolution of the glacier area is crucial. As a result of increasing temperature, the ensemble of projections for the ten GCMs under RCP4.5 and RCP8.5 shows substantial glacier shrinkage in the HLG catchment (Fig. 6e and f) despite an increase in the projected precipitation (Fig. 6c and d). There are significant differences in projected glacier area between RCP4.5 and RCP8.5, and the discrepancy between the RCP scenarios is considerably larger in the second half of the 21st century. A steady decline in glacier area in the catchment is projected for RCP4.5 (Fig. 6e), whereas a rapid decline is projected for RCP8.5 (Fig. 6f). Relative to the 2007 glacier area, the glacier area of the catchment is projected to decrease by 15.6% for RCP4.5 and by 34.4% for RCP8.5 by 2050, whereas the reduction is 24% and 51%, respectively, by 2070. After 2070, glacier shrinkage is remarkably accelerated for RCP8.5 due to more ice melting and less snow accumulation (Fig. 7). Relative to 1994–2013, ice melting in the high-altitude zone is projected to increase by 30% in 2021–50 and by 59% in 2071–2100 for RCP4.5 and by 35% in 2021–50 and 122% in 2071–2100 for RCP8.5 (Fig. 7). Particularly enhanced melting occurs in the entire high-altitude zone in 2071–2100 for RCP8.5 owing to the remarkable increase in temperature (Fig. 6a and b). Snow accumulation in the high-altitude zone is projected to decrease for both RCPs as the increasing temperature and limited change in precipitation result in a shift toward more liquid precipitation (Fig. 7). Snow accumulation does not change much under RCP4.5, with only a 4.6% decrease during both 2021–50 and 2071–2100 relative to 1994–2013, whereas it decreases by 5% in 2021–50 and by 12% in 2071–2100 for RCP8.5.
Projections of ablation (a, c) and snow accumulation (b, d) in the high-altitude zone for the periods 1994–2013, 2021–50 and 2071–2100 for RCP4.5 (a, b) and RCP8.5 (c, d).
The multi-model means of projected variations in runoff for RCP4.5 and RCP8.5 are presented in Figure 8. River runoff of the catchment is projected to decrease initially for both RCPs and then to display opposite trends under the two scenarios in the following decades, with the spread between the scenarios increasing in the second half of this century. Under both RCPs, multi-model mean glacier runoff shows different trends in the catchment (Fig. 8a). Glacier runoff remains relatively stable under the RCP4.5 scenario, because enhanced meltwater as a result of temperature can compensate for the steady reduction in glacier storage with glacier shrinkage. The contribution of glacier runoff to total runoff does not change much, varying from ∼39.5% in 2021–50 to 33.4% in 2071–2100. Other runoff components generated from the glacier-free zone show a slight increase owing to an increase in precipitation and a decrease in glacierized area (Fig. 6). Thus, the total runoff of the catchment increases slightly toward the end of this century for RCP4.5 (Fig. 8a). Although the contribution of glacier runoff to total runoff, ∼37.2% during 2011–2100 for RCP4.5, decreases slightly compared with the previous contribution, glacier runoff is still an important component of total runoff until 2100. Compared to the RCP4.5 scenario, the projected temperature shows larger increase under the RCP8.5 scenario. In particular, temperature rise becomes relatively stable for RCP4.5 in the second half of this century, whereas temperature experiences significant increase for RCP8.5 (Fig. 6a and b). In responding to temperature rise, more ice meltwater is released from glacier storage under the RCP8.5 scenario, and glacier area, especially in high-altitude regions, decreases significantly, representing ∼17% of that under the RCP4.5 in 2100 (Fig. 2). Although glacier runoff is slightly enhanced before 2050 for RCP8.5 compared to that for RCP4.5 (Fig. 8a), with decreasing glacier area, glacier runoff will gradually diminish in the second half of this century as enhanced meltwater cannot compensate for the dramatic reduction in glacier area. Specifically, it may ultimately approach zero due to the remarkable reduction in glacier volume at the end of this century (Fig. 8a). Despite the significant increase in runoff generated from the glacier-free zone of the catchment for RCP8.5 due to an increase in precipitation and area of the glacier-free zone, the increased amount of water from the glacier-free zone can compensate for only ∼60% of the water deficiency from reduced glacier runoff and thus cannot offset the deficit from the reduced glacier runoff. Consequently, total runoff is projected to decrease for RCP8.5, especially after 2070 (Fig. 8). Under the RCP8.5 scenario, glacier runoff is an important component of the total runoff until 2050, contributing ∼36.4% of the total runoff in 2021–50, but then the contribution decreases and is only 5.2% in 2071–2100. Hence, the runoff generated from the glacier-free zone of the catchment gradually becomes the principal contributor to the total runoff of the catchment after 2070 for RCP8.5.
Future glacier runoff (Qg) and river runoff (Qr) for RCP4.5 and RCP8.5 (a), and monthly contribution of glacier runoff to total runoff (GR; b) in different periods of 1994–2013, 2021–50 and 2071–2100 for RCP4.5 and RCP8.5.

4.4. Discussion
4.4.1. Impact of glacier runoff on the hydrological regime
The response of glacier runoff to climate warming is a matter of timescale (Reference Jansson, Hock and SchneiderJansson and others, 2003), i.e. runoff increases initially due to enhanced melting but then decreases gradually in the long term as a consequence of reduced glacier volume. Hence, glacier runoff will peak at a certain time (Reference Jansson, Hock and SchneiderJansson and others, 2003), the timing of which is crucial to the future water supply in the glacier-fed catchments (Reference Radić and HockRadić and Hock, 2011; Reference Immerzeel, Pellicciotti and BierkensImmerzeel and others, 2013; Reference Bliss, Hock and RadićBliss and others, 2014; Reference Lutz, Immerzeel, Shrestha and BierkensLutz and others, 2014). Reference Radić and HockRadić and Hock (2011) estimated the peak around 2075 on the global scale, but significant differences in the timing of the peak are apparent from region to region (Reference Casassa, López, Pouyaud and EscobarCasassa and others, 2009; Reference Immerzeel, Pellicciotti and BierkensImmerzeel and others, 2013; Reference Bliss, Hock and RadićBliss and others, 2014; Reference Lutz, Immerzeel, Shrestha and BierkensLutz and others, 2014). A consistent increase in runoff is expected for five basins in the Himalaya until at least 2050 (Reference Immerzeel, Pellicciotti and BierkensImmerzeel and others, 2013; Reference Lutz, Immerzeel, Shrestha and BierkensLutz and others, 2014), whereas Reference Bliss, Hock and RadićBliss and others (2014) found significant decreases in annual glacier runoff over the 21st century for Central Asia and South Asia East, but no significant changes for South Asia West. For the specific conditions of the HLG catchment, which presently has extensive debris-covered and debris-free ice covering a large area and altitude range, we estimate that the peak of glacier runoff in the catchment occurs in recent years (2006–10; Figs 5 and 8). After the peak, a decrease in glacier runoff is projected in the catchment for both RCPs, but there are large differences between the two scenarios regarding the role of glacier runoff in the catchment.
As discussed above, glacier runoff is a large component of the total runoff in the HLG catchment, and its evolution can change the magnitude and timing of the annual hydrograph, with a seasonal redistribution in total runoff. The present hydrological regime of the catchment is glacier-runoff dominated, and peak flows are driven by glacier runoff. The average contribution of glacier runoff to total runoff is ∼53.4% during 1952–2013, and the monthly contribution during summer months varies from 40.2% to 65%. The average contribution from glacier runoff for RCP4.5 is 39.5% in 2021–50 and becomes 33.4% in 2071–2100, and the monthly contribution during summer months varies from 31.4% to 49.4% in 2021–50 and from 27.2% to 42.6% in 2071–2100 (Fig. 8). Glacier runoff still affects the variation in total runoff, but the contribution from glacier runoff decreases slightly. This implies that the hydrological regime of the catchment will transform from a glacial–pluvial type to a pluvial type by the end of this century. Compared with the RCP4.5 scenario, a similar contribution of glacier runoff to total runoff is projected for RCP8.5 until 2050 (Fig. 8b), but the amount of glacier runoff for RCP8.5 is larger (Fig. 8a). The average contribution of glacier runoff to total runoff for RCP8.5 decreases from 36.4% in 2021–50 to 5.2% in 2071–2100, and the monthly contribution during summer months varies from 15.5% to 51.8% in 2021–50 and from 1.8% to 9% in 2071–2100 (Fig. 8b and c). The contribution from glacier runoff may approach zero by the end of this century due to the disappearance of glaciers (Fig. 6f), and runoff generated from the glacier-free zone is expected to be the main contributor to total runoff. This implies that the hydrological regime of the catchment under the RCP8.5 scenario will be a completely pluvial type by the end of this century. Runoff from the glacier-free zone increases significantly under both scenarios by the end of the century, but the increase under the RCP8.5 scenario cannot compensate for the water deficiency from the reduction in glacier runoff. Thus, the total runoff decreases slightly for RCP8.5, whereas it increases slightly for RCP4.5. These results clearly indicate the vital role of glaciers and their runoff in the runoff variations and hydrological regime of the HLG catchment.
4.4.2. Effect of debris cover
The HLG catchment is dominated by debris-covered glaciers, which cover ∼34.8 km2. The total debris-covered area represents ∼39% of the total area of the ablation zones of the three debris-covered glaciers (Reference Zhang, Hirabayashi and LiuZhang and others, 2012). As previous studies have reported (Reference ØstremØstrem, 1959; Reference Nakawo and YoungNakawo and Young, 1981; Reference Mattson, Gardner and YoungMattson and others, 1993), dispersed and thin debris enhances ice melt rates through albedo reduction, whereas debris cover of thickness exceeding a few centimetres reduces ice melt by imposing a barrier between the ice and the atmosphere. In situ surveys of debris thickness in the HLG catchment indicate its inhomogeneous distribution in space, and the thickness varies from several millimetres in the upper part of the ablation zone to >1.0 m at the terminus (Reference Zhang, Fujita, Liu, Liu and NuimuraZhang and others, 2011). Of the surveyed area, ∼50.3% has a debris thickness <0.1 m and ∼25% has a thickness <0.03 m. Due to the inhomogeneous distribution of debris thickness, ∼67% of the ablation area on HLG glacier, the largest glacier in the catchment (Fig. 1), has undergone accelerated melting, whereas ∼19% of the ablation area has experienced inhibited melting, and the sub-debris melt rate equals the bare-ice melt in only 14% of the ablation area (Reference Zhang, Fujita, Liu, Liu and NuimuraZhang and others, 2011, Reference Zhang, Hirabayashi and Liu2012). Therefore, the accelerating effect of debris cover dominates in the catchment so that ice melt rates are higher compared to clean ice, which significantly affects glacier runoff by altering spatial patterns of ice melting, with important consequences for total runoff of the HLG catchment. To comprehensively assess the influence of debris cover on the total runoff of the catchment, we recalculate the runoff with an assumption of no debris cover on the three debris-covered glaciers. Compared with the no-debris assumption case, the mean annual glacier runoff increases by ∼22% under the plausible real surface condition during 1991–2013. As a consequence, the catchment runoff increases by ∼8.1% during this period. Based on this comparison, we argue that the debris-covered area on the three glaciers can supply significant excess meltwater to the total runoff in the catchment. This finding is similar to that estimated for Trambau Glacier, Nepal Himalaya (Reference Fujita and SakaiFujita and Sakai, 2014). Both sites are characterized by thinner debris cover in the ablation zones.
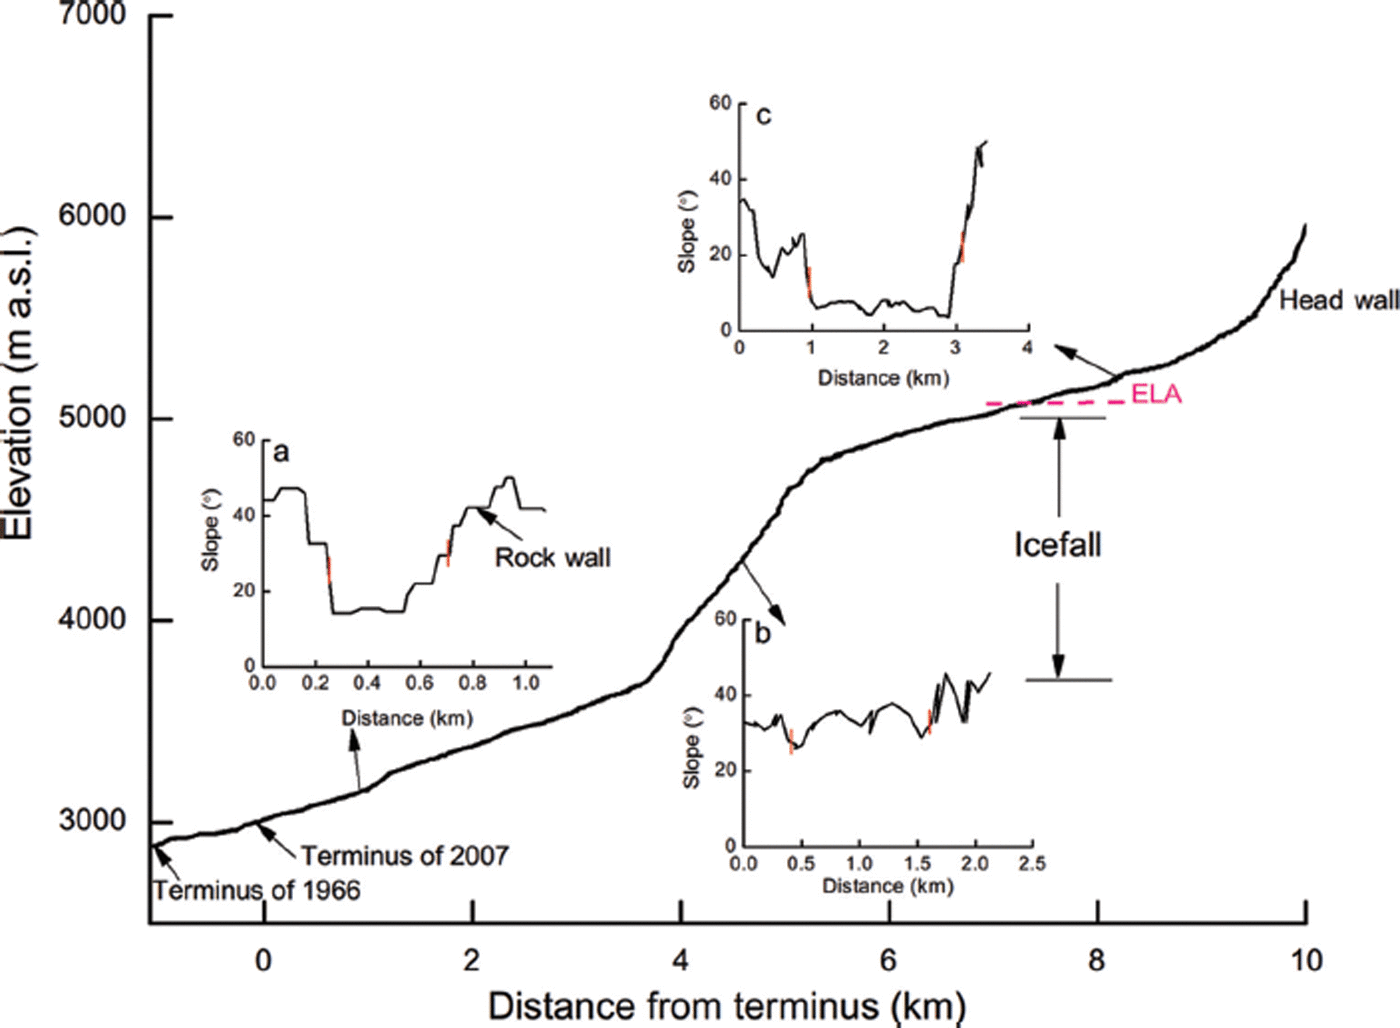
In the HLG catchment, most of the debris cover occurs below 5000 m a.s.l. (Figs 1 and 2), where a nearly 1300 m high icefall exists from 3700 to 4980 m a.s.l. (Figs 1 and 9) and the slope of surrounding rock walls is steep (Fig. 9). The topographic settings mainly control the formation conditions of debris-covered surface in the catchment, because the debris of the three glaciers is derived mainly from mixed ice/ snow/rock avalanching from the icefall and surrounding rock walls through frost-weathering processes and structural rockfalls (Reference Li and SuLi and Su, 1996). Reference Scherler, Bookhagen and StreckerScherler and others (2011) suggested that the fraction of a glacier surface covered with supraglacial debris is related to the steepness of the ice-free zone above the snowline, based on the hypothesis that steeper ice-free areas tend to cause avalanches and therefore supply more debris to the glacier. Although the ice-free zone in the accumulation zone is steep, the icefall prevents the formation of debris-covered surface in the zone above the icefall (Fig. 9). In recent decades, glacier termini in the HLG catchment have retreated significantly (Reference Su, Liu, Wang and ShiSu and others, 1992; Reference LiuLiu and others, 2010; Reference PanPan and others, 2012). For example, the termini of Glacier No. 2 and HLG glacier retreated by ∼1100 m during the period 1930–90 (Reference Su, Liu, Wang and ShiSu and others, 1992) and by ∼1878 m during the period 1930–2007 (Reference Su, Liu, Wang and ShiSu and others, 1992; Liu and others, 2007). However, the proportion of debris-covered surface area does not increase as the glaciers recede in the catchment. Specifically, there is no formation of debris-covered surface in the zone above the icefall. This phenomenon is observed by in situ surveys on HLG glacier during different periods (Reference Su, Liu, Wang and ShiSu and others, 1992; Reference Li and SuLi and Su, 1996; Reference Zhang, Fujita, Liu, Liu and NuimuraZhang and others, 2011), and is also estimated by our model under both RCP scenarios. Despite some shortcomings (discussed below), we use volume–area and volume–length scaling in our model to capture the feedback between glacier mass balance and changing glacier hypsometry. In particular, the evolution of the debris-covered area with decreasing glacier area is taken into account in the projections under the two RCP scenarios using a prescribed debris-covered proportion at each elevation band from satellite estimates. For both RCPs, glacier termini of the catchment are projected to shift upslope as glaciers shrink (Fig. 6e and f). The specific topographic conditions of the catchment may prevent the formation of a debris-covered surface in the ablation zone, leading to a decrease in area of debris-covered surface with glacier termini shifting upslope. As a result, the debris-cover effect will diminish gradually for both RCPs. To assess the influence of debris cover on the total runoff of the catchment for both RCPs, we recalculate the runoff assuming that there is no debris cover on the estimated debris-covered area in the catchment. A comparison of the simulations with the plausible real surface condition and the no-debris assumption case reveals that the effect of debris cover is not apparent under both RCP scenarios due to decreasing debris-covered area. However, when the termini of the three glaciers are projected to shift above the icefall for both RCPs (Fig. 2), our model does not consider the evolution of the debris-covered area above 5000 m a.s.l. for both RCPs. Hence, the future debris-cover effect on total runoff may be underestimated for both RCPs.
Schematic of topography and ice surface in the HLG catchment. Glacier surface elevation is derived from the DEM. Short red line segments denote glacier boundaries. Distance in (a–c) denotes the distance from the western to the eastern side.
4.4.3. Model uncertainties
To calculate the downward shortwave radiation in our simulation, we use a favourable correlation between precipitation and atmospheric transmissivity of solar radiation to estimate the transmissivity. This relationship was established by Reference Zhang, Hirabayashi and LiuZhang and others (2012) in the HLG catchment. Similar relationships have been found on different glaciers of the TP and performed well (e.g. Reference Matsuda, Fujita, Ageta and SakaiMatsuda and others, 2006; Reference Sakai, Fujita, Nakawo and YaoSakai and others, 2009). Reference Zhang, Hirabayashi and LiuZhang and others (2012) suggested that shortwave radiation fluctuations are well simulated using this approach compared to observations in the HLG catchment. To quantify the uncertainty of this approach in the runoff simulation, we recalculate the catchment runoff using the model forced by the estimated shortwave radiation for the period 2005–13, during which the observed shortwave radiation data are available in the catchment. As shown in Figure 10a, the observed runoff during 2005–07 is reasonably reproduced by the model forced by the observed and estimated shortwave radiation datasets, respectively. The NSE values for the two datasets are 0.86, and the PBIAS values are <7%. A comparison of the simulations forced by the observed and estimated shortwave radiations reveals a difference of ∼5% in the total catchment runoff and ∼10% in the July–August runoff during 2005–13 (Fig. 10b). The relationship is established based on monthly data, for which low-transmissivity data with high precipitation may not be taken into account, leading to an overestimate of the shortwave radiation on some days, which results in overestimation of the catchment runoff. Based on this comparison, we argue that the resulting uncertainty has a slight effect on the runoff estimate in the catchment (Fig. 10).
Scatter plots of observed versus simulated monthly runoff calculated from the observed and estimated shortwave radiation (SRD) datasets during 2005–07 (a) and time series of the simulations forced by the observed and estimated SRD for the period 2005–13 (b).

In addition to uncertainties in the simulation of future monsoon precipitation in the current GCMs (Reference Kripalani, Kulkarni, Sabade and ChaudhariKripalani and others, 2007; Reference Immerzeel, Pellicciotti and BierkensImmerzeel and others, 2013; Reference Su, Duan, Chen, Hao and CuoSu and others, 2013), our calculation contains several other potential uncertainties. As previous studies have shown (Reference Cheng, Yu and ZhaoCheng and others, 2004; Reference LiuLiu and others, 2010; Reference Zhang, Hirabayashi and LiuZhang and others, 2012), evaporation currently has little influence on the water balance of the HLG catchment. However, water loss from evaporation is likely to increase and become considerable toward the end of this century owing to a decrease in glacierized area and a corresponding increase in the glacier-free zone. Although our projection of evaporation considers the increase in area of the glacier-free zone, the effects of changing surface types with an increased area of vegetation are not taken into account. Additionally, the evolution of glacier area is simulated using a volume–area scale, which is a preliminary approximation with known shortcomings (Reference LüthiLüthi, 2009). This process requires a physically based ice-dynamic model, but this remains challenging due to a lack of input data (e.g. ice thickness and velocity). Although the volume–area scale has some short-comings (Reference LüthiLüthi, 2009), it can reasonably capture the feedback between glacier mass balance and changes in glacier hypsometry (Reference Radić, Hock and OerlemansRadić and others, 2008; Reference Marzeion, Jarosch and HoferMarzeion and others, 2012; Reference Hirabayashi, Zhang, Watanabe, Koirala and KanaeHirabayashi and others, 2013), which is important for a catchment in which few input data related to ice-dynamic processes are available.
5. Conclusions
The presented approach includes all major glacio-hydrological processes in a highly glacierized catchment, the HLG catchment, and especially accounts for the spatial characteristic of debris cover and its influence on the melting rate of the underlying ice. It offers the possibility to analyse the magnitude of the contribution of each runoff component (glacier runoff, rainfall, snowmelt and base flow) to river runoff under past and future climatic conditions. Past trends in the runoff components of the catchment indicate that glacier runoff has been the principal source of the total runoff in the catchment, contributing 53.4% of the total runoff during 1952–2013. The trend in glacier runoff is a significant control on the total runoff during periods of low river discharge and strongly intensifies the upward trend of total runoff during periods of high discharge. An experimental analysis in which no debris cover is assumed on the three glaciers in the catchment suggests that excess meltwater from the debris-covered area in the ablation zones of the three glaciers provides an 8.1% increase in total runoff relative to the no-debris assumption case.
The resulting quantification of the future contribution of glacier runoff to river runoff for RCP4.5 and RCP8.5 suggests that although glacier area will be reduced by the remarkable warming, the role of glacier runoff in the water supply of the catchment shows significant differences between the two RCP scenarios, and the spread between the RCPs increases in the second half of this century, with important consequences for the hydrological regime of the catchment. Under the RCP4.5 scenario, glacier runoff remains relatively stable, followed by a slight decrease, contributing ∼37.2% of the total runoff during 2011–2100, which leads to a slight increase in river runoff toward the end of this century in combination with an increase in the runoff generated from the glacier-free zone. On the other hand, glacier runoff is an important component of total runoff only until 2050 for RCP8.5, contributing ∼36.4% on average of the total runoff in 2021–50 and ∼5.2% in 2071–2100, which results in the hydrological regime transforming from glacial–pluvial to pluvial type. Such differing variations in total runoff under the two RCP scenarios underline the vital role of glaciers and related runoff in variations in river runoff and the hydrological regime in the catchment.
Acknowledgements
This work was supported by the International Science & Technology Cooperation Program (2010DFA92720-23), National Science & Technology Support Program (2012BAC19B07), and the Environment Research and Technology Development Fund (S-14) of the Ministry of the Environment, Japan, and JSPS KAKENHI Grant-in-Aid for Scientific Research (C) No. 15K06228. We thank the Gongga Alpine Ecosystem Observation and Research Station (GAEORS) of the Chinese Ecological Research Network for providing hydro-meteorological data. Two anonymous reviewers helped to improve the paper, as did the comments of the Scientific Editor, David Rippin, who is warmly acknowledged.



