


I. INTRODUCTION
Bragg–Brentano geometry is the most frequently applied design for a laboratory powder X-ray diffraction (XRD) instrument. The arrangement of optics in Bragg–Brentano geometry is schematically illustrated in Figure 1.
Arrangement of optics in Bragg–Brentano geometry.
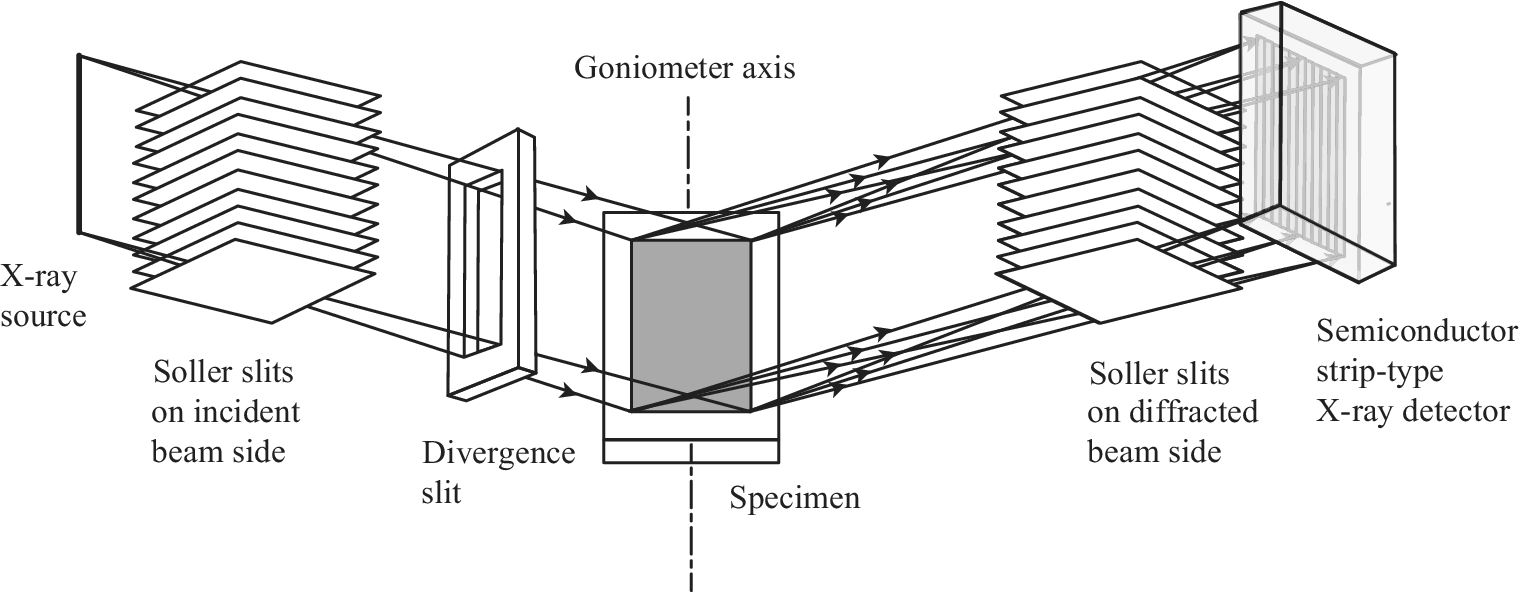
XRD data collected with a Bragg–Brentano XRD instrument are mainly affected by (1) spectroscopic profile of source X-ray, (2) axial divergence aberration, (3) equatorial aberration, and (4) sample transparency aberration. The sample transparency aberration depends on the characteristics of the specimen, which means that it is not a purely instrumental aberration, but it is possible to treat it almost similarly to other aberrations when the dimensions (width W and thickness t) and linear attenuation coefficient μ or penetration depth μ −1 of the specimen are known.
The main problems with the effects of instrumental and sample transparency aberrations are peak shifts and asymmetric deformation of peak profile. The peak locations are practically the most important information for identification, qualitative analysis, and precise estimation of lattice parameters. An asymmetric peak profile leads to ambiguity in the estimation of peak location.
It is usually assumed that the observed XRD intensity data are the convolution with the instrumental function (e.g. Jones, Reference Jones1938; Stokes, Reference Stokes1948). Cheary and Coelho (e.g. Reference Cheary and Coelho1998a, Reference Cheary and Coelho1998b) have proposed a fundamental parameters approach (FPA) to simulate the XRD peak profile as the convolution with the instrumental function defined by known instrumental and specimen parameters. In principle, application of FPA method will automatically correct the peak shift and asymmetric deformation of the peak profile.
On the other hand, it is said that the effects of the instrument can be removed by calculating the inverse Fourier transform of the quotient of the Fourier transforms of observed data and instrumental function according to the convolution theorem, and this approach is usually called deconvolution (e.g. Press et al., Reference Press, Teukolsky, Vetterling and Flannery1992). However, it is hardly expected that the deconvolution works nicely in the analysis of real powder XRD data. XRD data are associated with statistical errors, and deconvolution generally gives exaggerated errors in the deconvolved results. In fact, most of so-called deconvolution methods implicitly apply smoothing, which is identical to the convolution with the smoothing function, and it is sometimes difficult to find what kind of smoothing function is applied (e.g. Stokes, Reference Stokes1948).
The author has proposed a deconvolutional treatment (DCT) that introduces multiplication by the complex absolute value of the Fourier transform of the instrumental function, into the pure deconvolution process, which is equivalent to that the symmetrized instrumental function is used as the smoothing function (Ida and Toraya, Reference Ida and Toraya2002). This treatment keeps the effects of the even order cumulants of the instrumental function unchanged and removes the effects of the odd order cumulants, in principle. It means that the treatment keeps the integrated intensity, standard deviation, and kurtosis of the peak profile unchanged and corrects peak shift and asymmetric deformation of peak profile.
It has been suggested that it is not necessary to formulate the exact instrumental aberration function, but it is important to evaluate the exact values of the first and third-order cumulants of the aberration function, which can numerically be evaluated, for correction of peak shift and asymmetric deformation of peak profile caused by the instrumental aberration on application of the DCT method (e.g. Ida et al., Reference Ida, Ono, Hattan, Yoshida, Takatsu and Nomura2018).
In this article, the author derives formulas that can be used for the treatment of sample transparency aberration affected by interference with the specimen holder in two cases, (i) opaque and (ii) translucent sample holders. The deconvolutionally treated data of standard Si powder based on the formulation for a translucent sample holder are analyzed by an individual peak profile fitting method with the convolution of the Lorentzian function with a symmetrized instrumental function defined by the standard deviation and kurtosis (Ida, Reference Ida2021b) as a peak profile model function.
II. THEORETICAL
A. Case of opaque specimen holder
It is assumed that the width of the incident X-ray beam along the orthogonal direction to the rotation axis is given by B = RΦ DS for the formulation of sample transparency aberration, where R is the goniometer radius and Φ DS is the divergence slit open angle. The effect of sample transparency aberration depends on the apparent diffraction angle 2Θ, the width W, thickness t, and linear attenuation coefficient μ of the sample.
There are five cases (a), (b), (c), (c’), and (d) (see Figure 2) for the formulation of the sample transparency aberration, when an opaque sample holder is used. The five cases are classified by the relation between (i) the specimen width W, (ii) the irradiated width at the sample face Ω = B/sin Θ, and (iii) the width at the sample face viewed from the backside face at the viewing angle of π– 2Θ, τ = 2 t/tan Θ.
Five cases for formulation of sample transparency aberration interrupted by an opaque specimen holder. Ω 0 = W/2 + Ω/2 − τ, Ω 1 = W/2 − Ω/2, Ω 2 = W – τ, Ω 3 = W/2 + Ω/2, t 1 = (Ω 1/2)tanΘ, t 2 = (W/2)tanΘ, and t 3 = (Ω 3/2)tanΘ, as shown in the schematic illustrations.
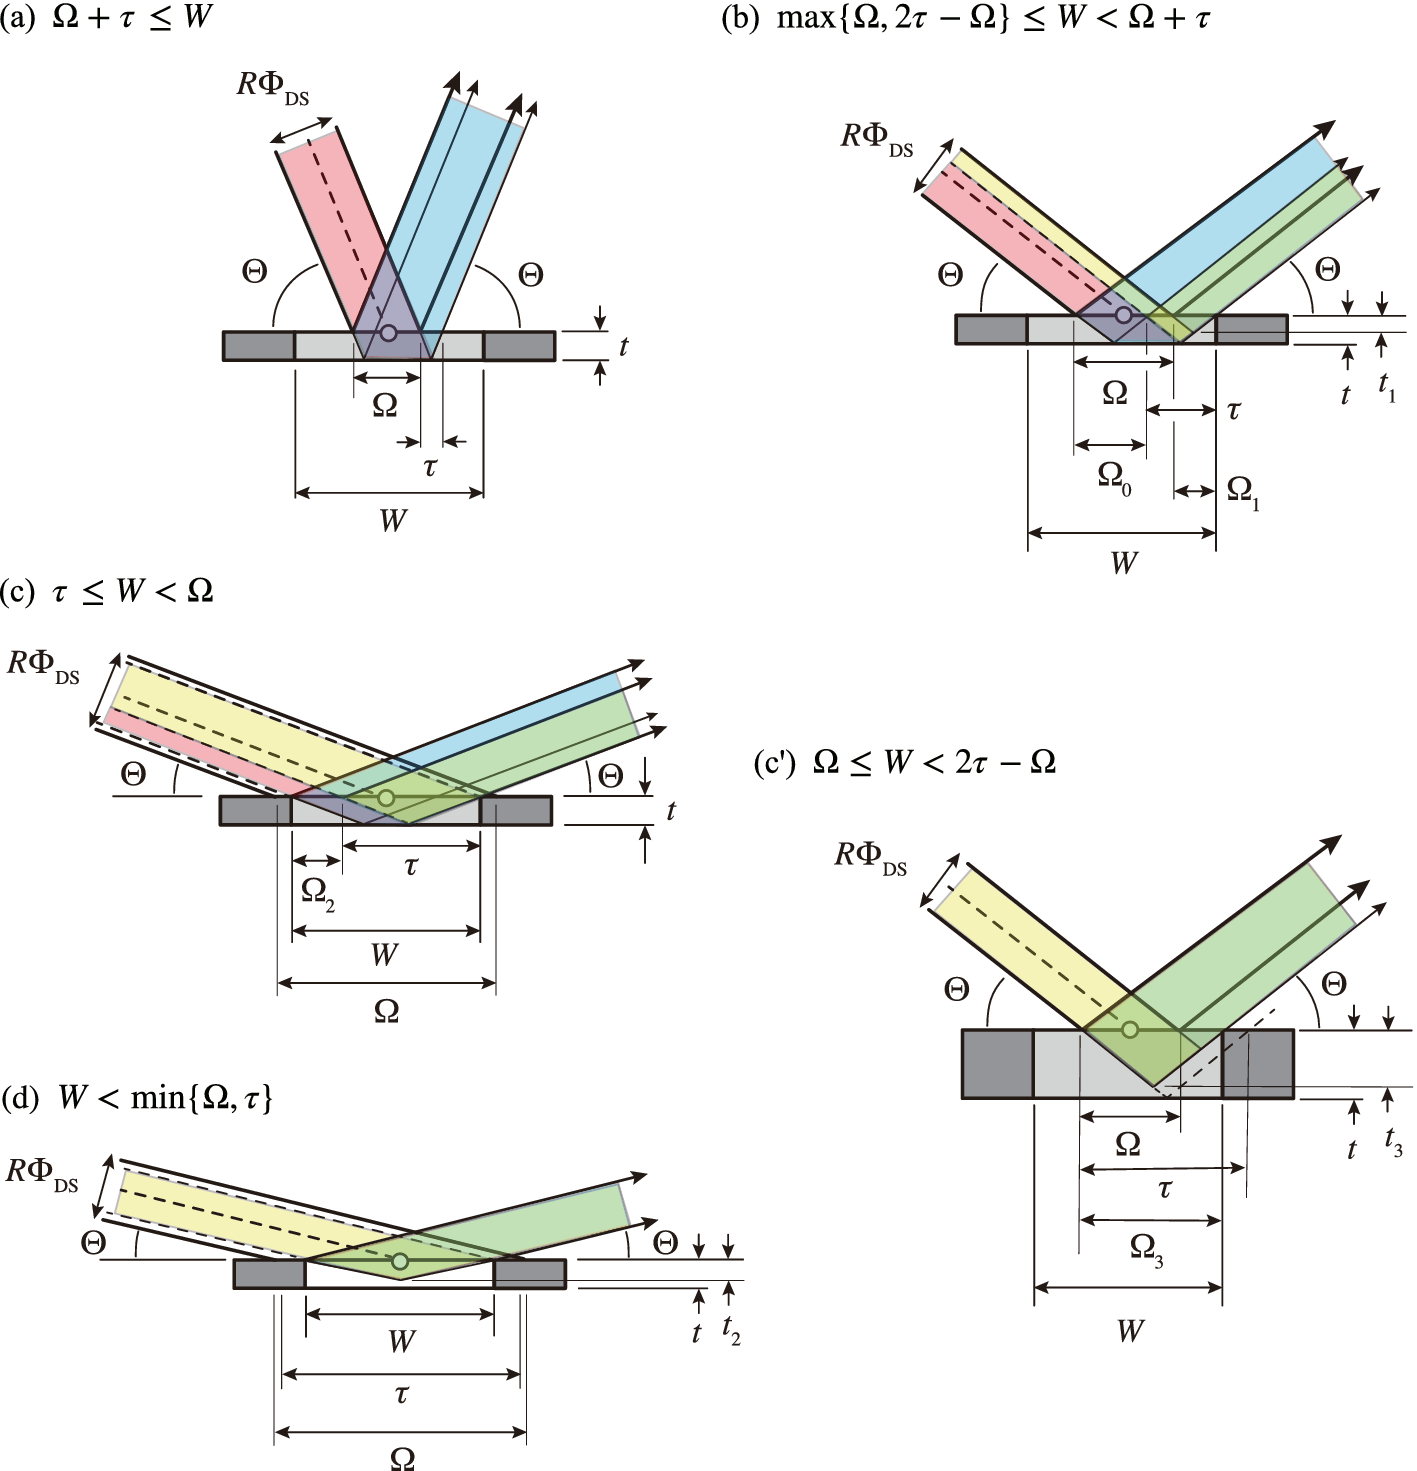
In case (a), both the incident and diffracted beams are not interrupted by the side walls of the sample holder. The incident X-ray beam is attenuated by the sample, and attenuated beam can reach the backside face of the sample. In case (b), the incident beam is not interrupted by the upstream side wall of the specimen holder, but the diffracted beam is partly interrupted by the downstream side wall of the holder. In case (c), both the incident and diffracted beams are interfered by the side walls of the sample holder, and the incident beam partly reaches the backside face of the sample. In case (c′), the incident beam is not interfered by the upstream side wall of the sample holder, but cannot effectively reach the backside face, because the diffracted beam is fully interrupted by the downstream side wall of the sample holder. In case (d), both the incident and diffracted beam are interrupted by the side walls of the sample holder, and the incident beam cannot reach the backside face.
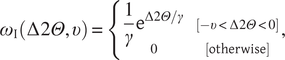
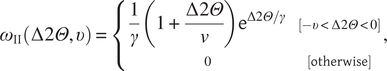
The sample transparency aberration function for the cases (a), (b), (c), (c’), and (d) can be formulated by a combination of two types of aberration functions, (I) formula for infinite width and finite thickness, ω I(Δ2Θ, υ), and (II) formula for finite width and infinite thickness ω II(Δ2Θ, υ), which are given by
 $$ {\omega}_{\mathrm{I}}\left(\Delta 2\varTheta, \upsilon \right)=\left\{\begin{array}{cc}\frac{1}{\gamma }{\mathrm{e}}^{\Delta 2\varTheta /\gamma }& \left[-\upsilon <\Delta 2\varTheta <0\right]\\ {}0& \left[\mathrm{otherwise}\right]\end{array}\right., $$
 $$ {\omega}_{\mathrm{II}}\left(\Delta 2\varTheta, \upsilon \right)=\left\{\begin{array}{cc}\frac{1}{\gamma}\left(1+\frac{\Delta 2\varTheta }{v}\right){\mathrm{e}}^{\Delta 2\varTheta /\gamma }& \left[-\upsilon <\Delta 2\varTheta <0\right]\\ {}0& \left[\mathrm{otherwise}\right]\end{array}\right., $$
where
 $$ \gamma =\frac{\sin 2\varTheta }{2\mu R}, $$
is the decay parameter. The type I function ω I(Δ2Θ, υ) has the formula of exponential function doubly truncated at Δ2Θ = −υ and Δ2Θ = 0. The type II function ω II(Δ2Θ, υ) has the formula of the first-order Laguerre function truncated at the first node Δ2Θ = −υ.
The aberration function ω (a)(Δ2Θ) for the case (a) is simply given by the type I function,
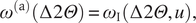 $$ {\omega}^{\left(\mathrm{a}\right)}\left(\Delta 2\varTheta \right)={\omega}_{\mathrm{I}}\left(\Delta 2\varTheta, u\right), $$
for u = 2 t cos Θ/R. The location of the truncation of the aberration function –u about Δ2Θ is equivalent with the peak shift of a specimen displaced by −t along the normal direction.
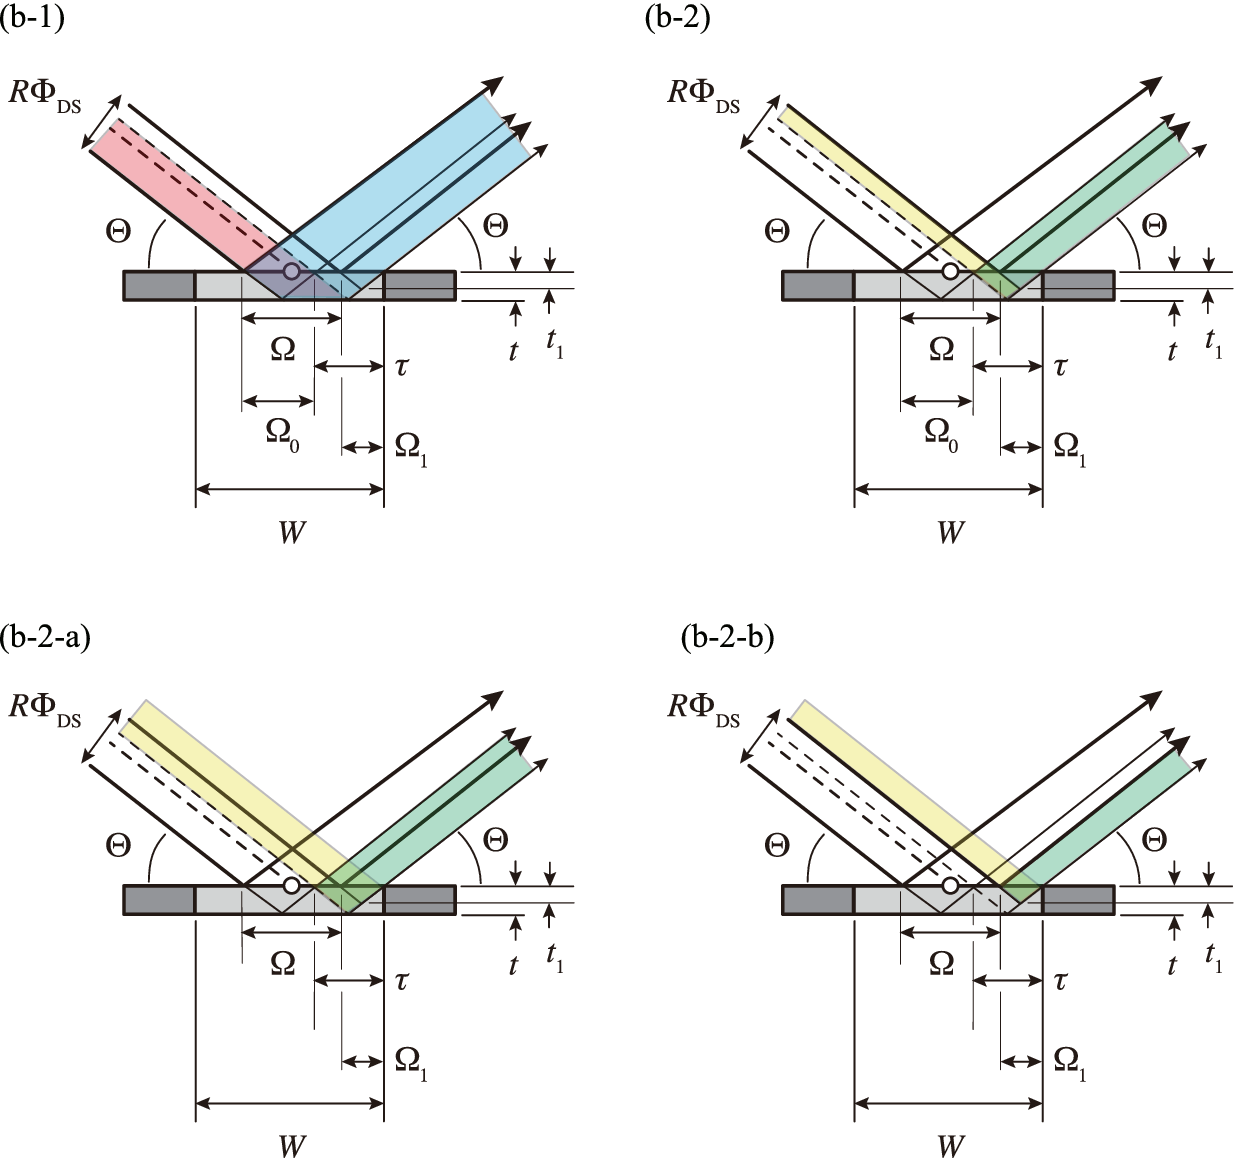
The aberration function ω (b)(Δ2Θ) for the case (b) is expressed by
 $$ {\omega}^{\left(\mathrm{b}\right)}\left(\Delta 2\varTheta \right)={\omega}^{\left(\mathrm{b}1\right)}\left(\Delta 2\varTheta \right)+{\omega}^{\left(\mathrm{b}2\mathrm{a}\right)}\left(\Delta 2\varTheta \right)-{\omega}^{\left(\mathrm{b}2\mathrm{b}\right)}\left(\Delta 2\varTheta \right), $$
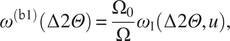 $$ {\omega}^{\left(\mathrm{b}1\right)}\left(\Delta 2\varTheta \right)=\frac{\Omega_0}{\Omega}{\omega}_{\mathrm{I}}\left(\Delta 2\varTheta, u\right), $$
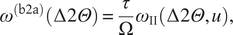 $$ {\omega}^{\left(\mathrm{b}2\mathrm{a}\right)}\left(\Delta 2\varTheta \right)=\frac{\tau }{\Omega}{\omega}_{\mathrm{II}}\left(\Delta 2\varTheta, u\right), $$
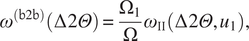 $$ {\omega}^{\left(\mathrm{b}2\mathrm{b}\right)}\left(\Delta 2\varTheta \right)=\frac{\Omega_1}{\Omega}{\omega}_{\mathrm{II}}\left(\Delta 2\varTheta, {u}_1\right), $$
for Ω = B/sin Θ, Ω 0 = W/2 + Ω/2, Ω 1 = W/2 − Ω/2, τ = 2 t/tan Θ, and u 1 = 2t 1 cos Θ/R = Ω 1 sin Θ/R. Figure 3 illustrates how the function ω (b)(Δ2Θ) is constructed.
Construction of the aberration function for the case (b). Case (b) is the sum of the components (b-1) and (b-2). The part (b-2) is equivalent with the difference of (b-2-a) and (b-2-b).
The aberration function ω (c)(Δ2Θ) for the case (c) is given by
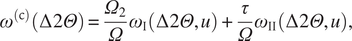 $$ {\omega}^{\left(\mathrm{c}\right)}\left(\Delta 2\varTheta \right)=\frac{\varOmega_2}{\varOmega }{\omega}_{\mathrm{I}}\left(\Delta 2\varTheta, u\right)+\frac{\tau }{\varOmega }{\omega}_{\mathrm{I}\mathrm{I}}\left(\Delta 2\varTheta, u\right), $$
for Ω2 = W − τ.
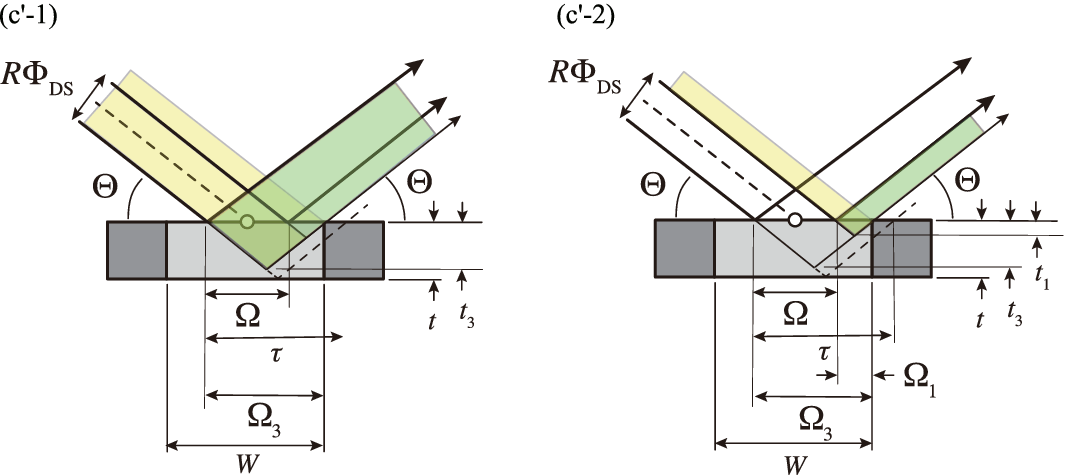
The aberration function ω (c’)(Δ2Θ) for the case (c’) is expressed by
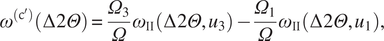 $$ {\omega}^{\left({\mathrm{c}}^{\prime}\right)}\left(\Delta 2\varTheta \right)=\frac{\varOmega_3}{\varOmega }{\omega}_{\mathrm{II}}\left(\Delta 2\varTheta, {u}_3\right)-\frac{\varOmega_1}{\varOmega }{\omega}_{\mathrm{II}}\left(\Delta 2\varTheta, {u}_1\right), $$
for Ω 3 = W/2 + Ω/2, Ω1 = W/2 − Ω/2, u 3 = Ω 3 sin Θ/R, and u 1 = Ω 1 sin Θ/R. Figure 4 illustrates how the aberration function in the case (c’) is constructed.
Construction of case (c’). Case (c’) is identical to the difference between the case (c’-1) and (c’-2).
The aberration function ω (d)(Δ2Θ) for the case (d) is simply given by the type II function:
 $$ {\omega}^{\left(\mathrm{d}\right)}\left(\Delta 2\varTheta \right)=\frac{W}{\varOmega }{\omega}_{\mathrm{II}}\left(\Delta 2\varTheta, {u}_2\right), $$
for u 2 = W sin Θ/R .
The k-th order power average of Δ2Θ for the type-I function ω I(Δ2Θ, υ), sk (I)(υ) can be calculated by a recurrence formula:
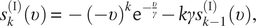 $$ {s}_k^{\left(\mathrm{I}\right)}\left(\upsilon \right)=-{\left(-\upsilon \right)}^k{\mathrm{e}}^{-\frac{\upsilon }{\gamma }}- k\gamma {s}_{k-1}^{\left(\mathrm{I}\right)}\left(\upsilon \right), $$
and the initial value of s 0(I)(υ) = 1 − e−υ/γ . The k-th order power average of Δ2Θ for the type-II function ω II(Δ2Θ, υ), sk (II)(υ), can be calculated by
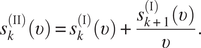 $$ {s}_k^{\left(\mathrm{I}\mathrm{I}\right)}\left(\upsilon \right)={s}_k^{\left(\mathrm{I}\right)}\left(\upsilon \right)+\frac{s_{k+1}^{\left(\mathrm{I}\right)}\left(\upsilon \right)}{\upsilon }. $$
Cumulants of any orders of the aberration functions can then be calculated through the power averages of the function sk (I)(υ).
B. Case of translucent specimen holder
It is assumed that the linear attenuation coefficient of the specimen holder is μ′. The sample transparency aberration function ω ST(Δ2Θ) is given by an integral formula:
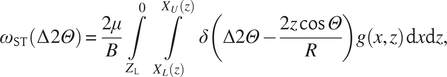 $$ {\omega}_{\mathrm{ST}}\left(\Delta 2\varTheta \right)=\frac{2\mu }{B}\int_{Z_{\mathrm{L}}}^0\int_{X_L(z)}^{X_U(z)}\delta \left(\Delta 2\varTheta -\frac{2z\cos \varTheta }{R}\right)g\left(x,z\right)\;\mathrm{d}x\mathrm{d}z, $$
where δ(x) is the Dirac delta.
The limits of the integrals, Z L, X L(z), and X U(z) are given by
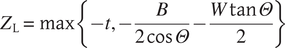 $$ {Z}_{\mathrm{L}}=\max \left\{-t,-\frac{B}{2\cos \varTheta }-\frac{W\tan \varTheta }{2}\right\} $$
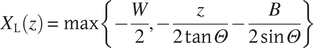 $$ {X}_{\mathrm{L}}(z)=\max \left\{-\frac{W}{2},-\frac{z}{2\tan \varTheta }-\frac{B}{2\sin \varTheta}\right\} $$
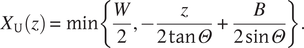 $$ {X}_{\mathrm{U}}(z)=\min \left\{\frac{W}{2},-\frac{z}{2\tan \varTheta }+\frac{B}{2\sin \varTheta}\right\}. $$
The function g(x,z) represents the effective transmittance of the incident and diffracted beams, reflected at the point (x,z), which is given by the product of the transmittance for the incident and diffracted (emitting) beams g (i)(x,z) and g (e)(x,z), as g(x,z) = g (i)(x,z) g (e)(x,z).
The transmittance for the incident beam g (i)(x,z) is given by
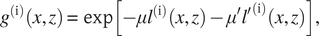 $$ {g}^{\left(\mathrm{i}\right)}\left(x,z\right)=\exp \left[-\mu {l}^{\left(\mathrm{i}\right)}\left(x,z\right)-\mu^{\prime }l{\prime}^{\left(\mathrm{i}\right)}\left(x,z\right)\right], $$
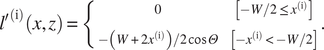
where the function l (i)(x,z) represents the path length of the incident beam inside the sample body, which is given by
 $$ {l}^{\left(\mathrm{i}\right)}\left(x,z\right)=\left\{\begin{array}{cc}-z/\sin \varTheta & \left[-W/2\le {x}^{\left(\mathrm{i}\right)}\right]\\ {}\left(W+2x\right)/2\cos \varTheta & \left[{x}^{\left(\mathrm{i}\right)}<-W/2\right]\end{array}\right., $$
where x (i) is the horizontal location of the incident point, given by x (i) = x + z/tan Θ. The function l′(i)(x,z) represents the path length of the incident beam in the sample holder, which is given by
 $$ l{\prime}^{\left(\mathrm{i}\right)}\left(x,z\right)=\left\{\begin{array}{cc}0& \left[-W/2\le {x}^{\left(\mathrm{i}\right)}\right]\\ {}-\left(W+2{x}^{\left(\mathrm{i}\right)}\right)/2\cos \varTheta & \left[-{x}^{\left(\mathrm{i}\right)}<-W/2\right]\end{array}\right.. $$
Figure 5 illustrates the geometry about the reflection interfered by the upstream side part of the sample holder.
Interference by the upstream side part of the sample holder for the reflection at the point (x, z).
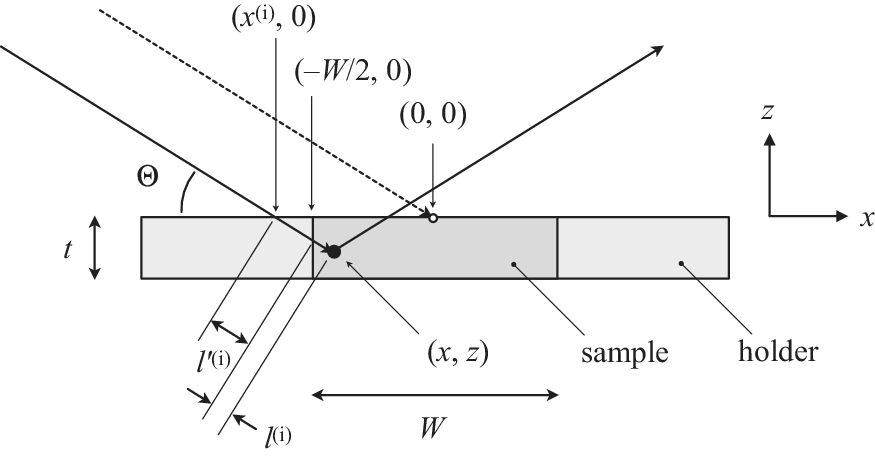
The transmittance for the diffracted (emitting) beam g (e)(x,z) is given by
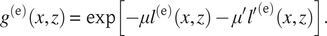 $$ {g}^{\left(\mathrm{e}\right)}\left(x,z\right)=\exp \left[-\mu {l}^{\left(\mathrm{e}\right)}\left(x,z\right)-\mu^{\prime }l{\prime}^{\left(\mathrm{e}\right)}\left(x,z\right)\right]. $$
The function l (e)(x,z) represents the path length in the sample for the diffracted beam, which is given by
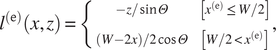 $$ {l}^{\left(\mathrm{e}\right)}\left(x,z\right)=\left\{\begin{array}{cc}-z/\sin \varTheta & \left[{x}^{\left(\mathrm{e}\right)}\le W/2\right]\\ {}\left(W-2x\right)/2\cos \varTheta & \left[W/2<{x}^{\left(\mathrm{e}\right)}\right]\end{array}\right., $$
where x (e) is the horizontal location of the emission point, given by x (e) = x – z/tan Θ. The function l′(e)(x,z) represents the path length in the sample holder for the diffracted beam, which is given by
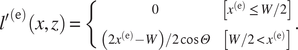 $$ l{\prime}^{\left(\mathrm{e}\right)}\left(x,z\right)=\left\{\begin{array}{cc}0& \left[{x}^{\left(\mathrm{e}\right)}\le W/2\right]\\ {}\left(2{x}^{\left(\mathrm{e}\right)}-W\right)/2\cos \varTheta & \left[W/2<{x}^{\left(\mathrm{e}\right)}\right]\end{array}\right.. $$
It is not too complicated to evaluate the values of the k-th power average and the cumulants of the aberration function by a numerical method. It should be noted that it will be better to convert the integral variable z as e2μz/sinΘ = u on the numerical evaluation of the integral because e2μz/sinΘ approximates the function g(x,z) for a sufficiently large value of W. The k-th order power average of the sample transparency aberration function is then given by
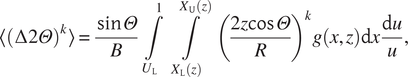 $$ \left\langle {\left(\Delta 2\varTheta \right)}^k\right\rangle =\frac{\sin \varTheta }{B}\int_{U_{\mathrm{L}}}^1\int_{X_{\mathrm{L}}(z)}^{X_{\mathrm{U}}(z)}{\left(\frac{2z\cos \varTheta }{R}\right)}^kg\left(x,z\right)\mathrm{d}x\frac{\mathrm{d}u}{u}, $$
where the lower limit of the integral about u is given by
 $$ {U}_{\mathrm{L}}={e}^{2\mu {Z}_L/\sin \Theta}, $$
C. Comparison of models for opaque and translucent sample holders
The k-th power average of the sample transparency aberration function for a translucent sample holder is evaluated by a Gauss–Legendre quadrature with the number of sampling points n along the u (z)-direction and m along the x-direction. The zeroth order power average s 0, which represents the integrated intensity of the aberration function, is normalized by multiplying B/W sin Θ for the diffraction angles B/sin Θ > W, to avoid doubly counting the spill-over (finite specimen width) effect, when the automatic recovery of the intensity lost by finite width of the sample is applied on the deconvolutional process about equatorial aberration. The values expressed by W sin Θ/B may be regarded as the relative intensities for a hypothetical transparent sample holder, where the interference of the sample holder is completely neglected.
Figure 6 shows the values of effective transmittance s’0 of sample transparency about opaque and translucent sample holders, calculated for the goniometer radius R = 150 mm, divergent slit open angle Φ DS = 1.25°, specimen width W = 20 mm, specimen thickness t = 0.618 mm, penetration depth of the sample powder μ −1 = 0.218 mm, and penetration depth of the sample holder μ′−1 = 0.138 mm, as will be described in the experimental section of this study. No significant difference has been detected by increasing the number of sampling points of Gauss–Legendre quadrature more than 20 × 20.
Values of effective transmittance evaluated for an opaque sample holder, and a translucent sample holder on variation of number of sampling points of Gauss–Legendre integrals. Vertical lines indicate the locations of the boundaries between the cases (a), (b), (c), and (d), for an opaque sample holder.
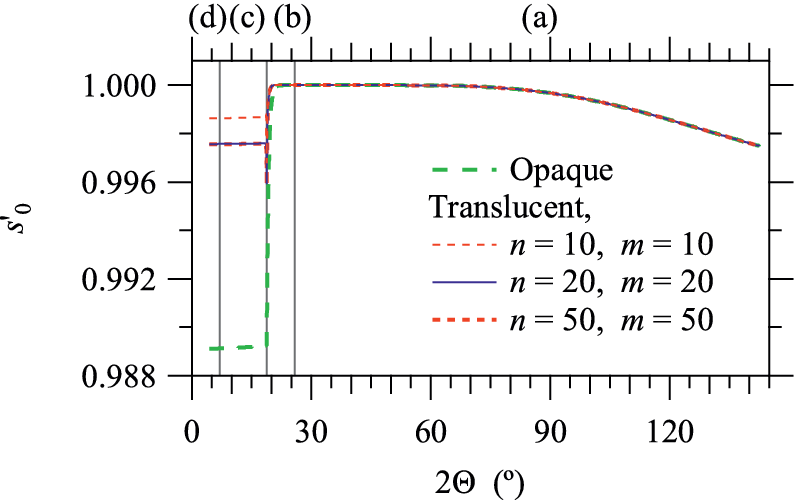
The values of the effective transmittance s′0 for an opaque holder approach to 1 − μ −1/W = 0.9891 for 2Θ → 0, as expected, while the values numerically calculated for the translucent holder show almost constant values s′0 = 0.9976 in the low angle region.
Figure 7 shows a magnified plot about the irregular behavior of the normalized effective transmittance about the results of calculation about opaque and translucent sample holders. The behavior of the normalized transmittance calculated for a translucent sample holder shows slight irregularity, which is clearly caused by the normalization, where the intensities calculated for the translucent sample holder are divided by the intensity expected for a transparent sample holder. As the amount of irregular change caused by the formula for a translucent sample holder is less than 0.2%, it will not cause severe problem on analysis of experimental data.
Magnified plot about irregular behaviors in the normalized effective transmittance calculated for opaque and translucent sample holders.
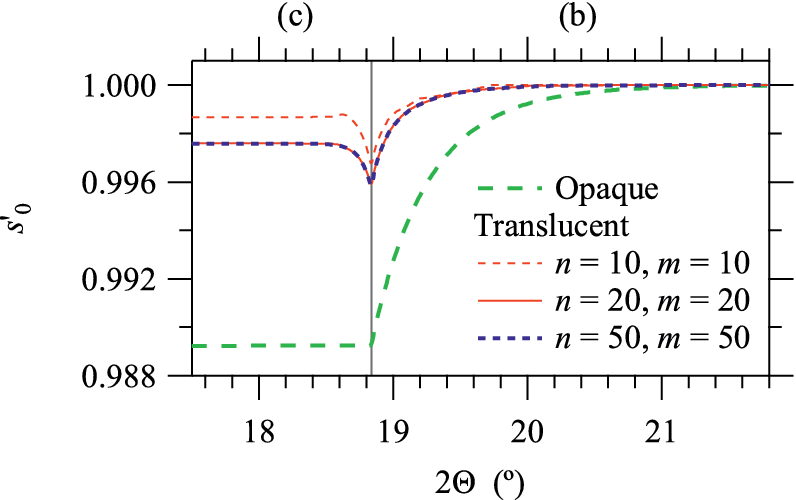
Figure 8 shows the values of the first-order cumulant (average peak shift) κ 1 = ⟨Δ2Θ⟩ and the reduced third-order cumulant (asymmetry parameter), defined by κ 3(1/3) = sign(⟨(Δ2Θ)3⟩)|⟨(Δ2Θ)3⟩|1/3, of the sample transparency aberration function, for opaque and translucent sample holders. The values on a conventional assumption for an infinitely wide and thick specimen (W = ∞, t = ∞) are also shown in Figure 8. The difference in the results for opaque and translucent sample holders are less significant than that found in the effective transmittance, while the difference from the conventional assumption appears at higher angles, where the effect of finite thickness of the specimen becomes significant. It is suggested that the finite thickness of the sample should properly be accounted for simulation or DCT of XRD data of a typical inorganic material with the penetration depth of μ −1 = 0.218 mm, while the effects of transparency of the sample holder may be negligible.
The first-order and the reduced third-order cumulants of the sample transparency aberration function for opaque and translucent sample holders. Values calculated based on a conventional assumption are also plotted in the figure.
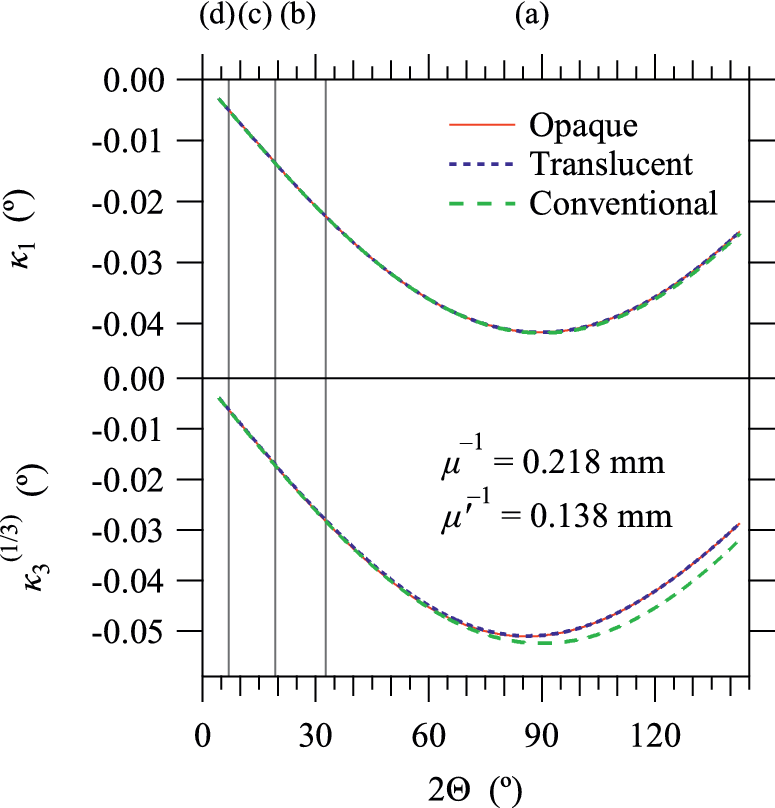
On the conventional assumption, both the first-order cumulant κ 1 and the reduced third-order cumulant κ 3(1/3) of the sample transparency aberration function should be proportional to sin 2Θ, and the ratio κ 3(1/3)/κ 1 should be 21/3 ≈ 1.26, corresponding with that the aberration function of the conventional model is expressed by an exponential function truncated at the origin, Δ2Θ = 0.
The author would like to note that implementation of the formulas for a translucent sample holder to evaluate the effective transmittance and cumulants of the sample transparency aberration is rather easier than that for an opaque holder, while the cost for computation may become slightly more expensive.
III. EXPERIMENTAL
Standard Si powder (NIST SRM640d) was used as obtained. The Si powder was filled into the hollow of a glass sample holder. The volume of the hollow was 0.245 mL, and the average depth was t = 0.618 mm. The bulk density of the powder sample was 0.719 g/cm3, and the penetration depth of the Si powder for Cu Kα X-ray was estimated at μ −1 = 0.218 mm. The density of the glass holder was estimated at 2.02 g/cm3, which suggests that the glass is made of borosilicate, and the penetration depth of the holder was estimated at μ′ −1 = 0.138 mm, on the assumption that the chemical composition of the glass is not much different from SiO2. Specimen width was W = 20 mm.
XRD data of the Si powder were collected with a Bragg–Brentano type instrument (Rigaku, MiniFlex 600-C), equipped with a Si strip (1D) (PIN photodiode array) X-ray detector (Rigaku, D/teX Ultra-2). The radius of the goniometer was R = 150 mm. Cu target X-ray tube (Canon Electron Tubes & Devices, A-21 Cu) was operated at 40 kV and 15 mA. The focus area on the Cu target was nominally 1 × 10 mm2, and the X-ray beam emitted at the take-off angle of 6° from the Cu target was used in the line-focus direction. The position of the X-ray tube was adjusted by a method proposed by the manufacturer. The Soller slits angles were Φ (i)SS = 1.25° on the incident beam side and Φ (d)SS = 1.18° on the diffracted beam side. A divergence slit with the open angle of Φ DS = 1.25° was used. The number and interval of the detector strips were 128 and 0.1 mm. View angle of the 1D detector along the equatorial direction was estimated at 2Ψ = 4.89°. Ni foil with a nominal thickness of 0.023 mm was used as the attenuator for Cu Kβ X-ray.
XRD intensity data for the apparent diffraction angles 2Θ: 4.38°–142.47° were collected in a continuous-scan integration method, called “real-time multistrip technology” (RTMT) by a manufacturer (Panalytical), and “time delay integration” (TDI) by another manufacturer (Rigaku), with the step interval of 0.01° and scan rate of 10°/min, for 10 times. No significant difference was found in the intensity data of the 10 scans. The sum of the 10-scan intensity data was used for further analysis. The room temperature was kept at 23.0 °C ± 0.5 °C during the measurement. The accuracy of the 2Θ angles certified by the manufacturer of the XRD instrument (Rigaku) was 0.01°.
IV. ANALYTICAL
A. DCT
Spectroscopic profile of the source X-ray, based on the model proposed by Deutsch et al. (Reference Deutsch, Förster, Hölzer, Härtwig, Hämäläinen, Kao, Huotari and Diamant2004), has been deconvolved, and hypothetical singlet Lorentzian located at Cu Kα1 (K-L3) wavelength (λ = 1.54059 Å) with the full width at half maximum (FWHM) of Δλ/λ = 0.00035 has been convolved on the logarithmic sine scale, χ X = ln sin Θ. Axial divergence and equatorial aberrations have been treated by a method previously proposed (Ida, Reference Ida2021a).
The cumulants of sample transparency aberration for the goniometer radius R = 150 mm, divergent slit open angle Φ DS = 1.25°, specimen width W = 20 mm, specimen thickness t = 0.618 mm, the penetration depth of the sample powder μ −1 = 0.218 mm, and penetration depth of the sample holder μ′−1 = 0.138 mm are calculated by 20 × 20-sampling point Gauss–Legendre quadrature. The “root_legendre()” method in “special” module in SciPy library is used to find the sample points and weights of Gauss–Legendre quadrature.
Sample transparency aberration function is modeled by the double convolution of a truncated exponential function f (TE)(x) and a rectangular function f (R)(x), defined by
 $$ {f}^{\left(\mathrm{TE}\right)}(x)\equiv \left\{\begin{array}{cc}{e}^x& \left[x<0\right]\\ {}0& \left[0\le x\right]\end{array}\right. $$
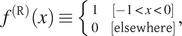 $$ {f}^{\left(\mathrm{R}\right)}(x)\equiv \left\{\begin{array}{cc}1& \left[-1<x<0\right]\\ {}0& \left[\mathrm{elsewhere}\right]\end{array}\right., $$
The first-order and the third-order cumulants of the functions are k 1(TE) = −1, k 3(TE) = −2, k 1(R) = −0.5, and k 3(R) = 0, respectively. When the third-order cumulant of the sample transparency aberration is given by κ 3(2Θ), the scale transform χ (TE)(2Θ) suitable for the DCT about the truncated exponential function should be given by
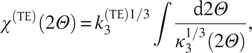 $$ {\chi}^{\left(\mathrm{TE}\right)}\left(2\varTheta \right)={k}_3^{\left(\mathrm{TE}\right)1/3}\int \frac{\mathrm{d}2\varTheta }{\kappa_3^{1/3}\left(2\varTheta \right)}, $$
to satisfy the requirement for scale invariance of the cumulant, expressed by κ 1 ∝ κ 21/2 ∝ κ 31/3 ∝ …It is assumed that the first-order cumulant of the sample transparency aberration is given by κ 1(2Θ). The scale transform χ (R)(2Θ) for the rectangular function is then evaluated by solving the differential equation:
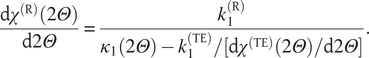 $$ \frac{\mathrm{d}{\chi}^{\left(\mathrm{R}\right)}\left(2\varTheta \right)}{\mathrm{d}2\varTheta }=\frac{k_1^{\left(\mathrm{R}\right)}}{\kappa_1\left(2\varTheta \right)-{k}_1^{\left(\mathrm{TE}\right)}/\left[\mathrm{d}{\chi}^{\left(\mathrm{TE}\right)}\left(2\varTheta \right)/\mathrm{d}2\varTheta \right]}. $$
to satisfy the requirement for additivity of cumulants on convolution.
The expression given by Eq. (29) is numerically unstable because the denominator on the right side of the Eq. (29) easily approaches to zero, for a thick specimen case, where the conventional assumption of infinitely thick sample (t → ∞) works well. An alternative expression with an arbitrary small number ε
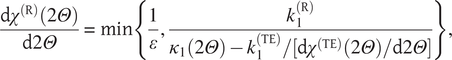 $$ \frac{\mathrm{d}{\chi}^{\left(\mathrm{R}\right)}\left(2\varTheta \right)}{\mathrm{d}2\varTheta }=\min \left\{\frac{1}{\varepsilon },\frac{k_1^{\left(\mathrm{R}\right)}}{\kappa_1\left(2\varTheta \right)-{k}_1^{\left(\mathrm{TE}\right)}/\left[\mathrm{d}{\chi}^{\left(\mathrm{TE}\right)}\left(2\varTheta \right)/\mathrm{d}2\varTheta \right]}\right\}, $$
is used for implementation of the DCT about the finite thickness of a sample. The value of the small number selected in this study is ε = 0.0001°. It would force additional and artificial DCT about the rectangular function with the width of 0.0001°, but it is not likely that it will cause a serious problem for practical use.
The DCT about spectroscopic profile, axial divergence and equatorial aberrations, and sample transparency aberration for a translucent sample holder are implemented in Python codes for handling NumPy (Harris et al., Reference Harris, Millman, van der Walt, Gommers, Virtanen, Cournapeau, Wieser, Taylor, Berg, Smith, Kern, Picus, Hoyer, van Kerkwijk, Brett, Haldane, Fernández del Río, Wiebe, Peterson, Gérard-Marchant, Sheppard, Reddy, Weckesser, Abbasi, Gohlke and Oliphant2020) and SciPy (Virtanen et al., Reference Virtanen, Gommers, Oliphant, Haberland, Tyler Reddy, Cournapeau, Burovski, Peterson, Weckesser, Bright, van der Walt, Brett, Wilson, Millman, Mayorov, Nelson, Jones, Kern, Larson, Carey, Polat, Feng, Moore, VanderPlas, Laxalde, Perktold, Cimrman, Henriksen, Quintero, Harris, Archibald, Ribeiro, Pedregosa and van Mulbregt2020) libraries, and applied to the XRD data of Si powder through Jupyter Notebook 7.0.8/Anaconda 3 on Apple macOS 14.3.1/Apple Macbook Pro 2020 edition. Total CPU time for the DCT reported by the user interface of Jupyter Notebook was 4.29 s.
B. Peak profile fitting analysis
Individual peak profile fitting (IPPF) analysis is applied to the data treated by the deconvolutional method. A symmetric model peak profile function defined by the convolution of the Lorentzian function and a mathematical model for a symmetrized instrumental function determined by the second and fourth-order cumulants (standard deviation and kurtosis) (Ida, Reference Ida2021b) is used for the IPPF analysis. Constant background intensity b, integrated peak intensity I, peak position 2Θ peak, and the half width at half maximum (HWHM) w of the Lorentzian component are optimized to fit the peak intensity profile in the DCT data. The standard deviation σ and kurtosis k of the symmetrized instrumental function were treated as fixed parameters.
The contributions of the instrumental broadening caused by the finite widths of the source X-ray, w X = 0.01 mm, and the interval of the detector strip w D = 0.01 mm are accounted as σ X = (w X/R)/121/2 = 0.0011° and σ D = (w D/R)/121/2 = 0.0011° for the standard deviations, and κ X(1/4) = −(w X/R)/1201/4 = −0.0012° and κ D(1/4) = −(w X/R)/1201/4 = −0.0012° as the reduced fourth order cumulants, on assumption that the intensity distribution is modeled by the continuous uniform distribution.
The “leastsq()” method, which is based on the Levenberg–Marquardt algorithm (e.g. Press et al., Reference Press, Teukolsky, Vetterling and Flannery1992), of the module “optimize” in SciPy library (Virtanen et al., Reference Virtanen, Gommers, Oliphant, Haberland, Tyler Reddy, Cournapeau, Burovski, Peterson, Weckesser, Bright, van der Walt, Brett, Wilson, Millman, Mayorov, Nelson, Jones, Kern, Larson, Carey, Polat, Feng, Moore, VanderPlas, Laxalde, Perktold, Cimrman, Henriksen, Quintero, Harris, Archibald, Ribeiro, Pedregosa and van Mulbregt2020) is used with default settings for the IPPF analysis. It is assumed that the statistical errors of the deconvolved data are equal to the square root of the intensity in the unit of photon counts, though it may not fully be justified.
V. RESULTS
Eleven diffraction peaks of Si, 111, 220, 311, 400, 331, 422, 511/333, 440, 531, 620, 533 reflections in the DCT data of NIST SRM640d Si powder sample have been analyzed by the IPPF method.
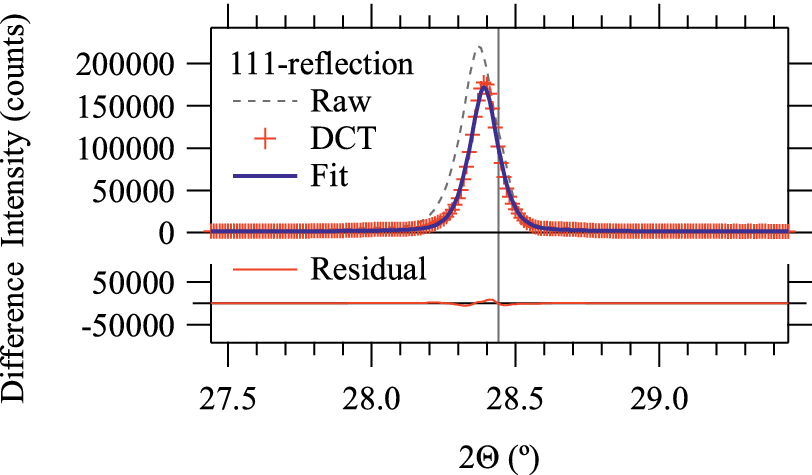
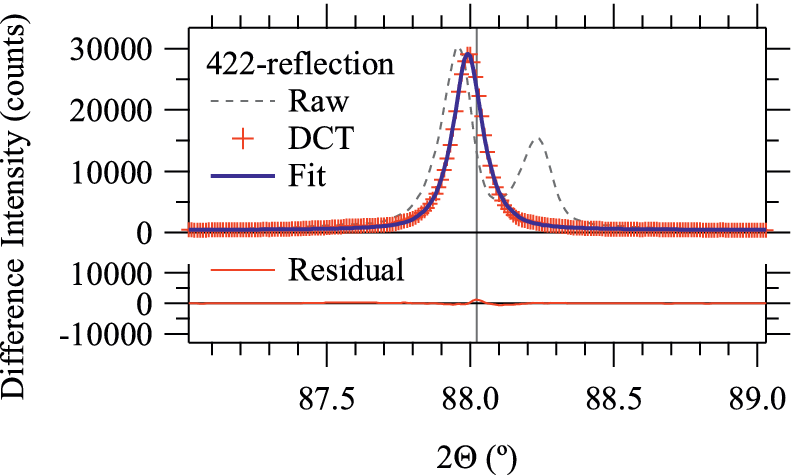
Figures 9, 10, and 11 show the raw data, DCT data, and results of IPPF analysis for Si 111, 422, and 533 reflections. DCT data certainly show more symmetric peak profiles, as compared with the raw data.
Observed intensity profile (raw), DCT data, fit curve, and residuals of the fitting for Si 111-reflection peak. The vertical line indicates the peak location listed in the certificate of NIST SRM640d.
Observed intensity profile (raw), DCT data, fit curve, and residuals of the fitting for Si 422-reflection peak. The vertical line indicates the peak location listed in the certificate of NIST SRM640d.
Observed intensity profile (raw), DCT data, fit curve, and residuals of the fitting for Si 533-reflection peak. The vertical line indicates the peak location listed in the certificate of NIST SRM640d.
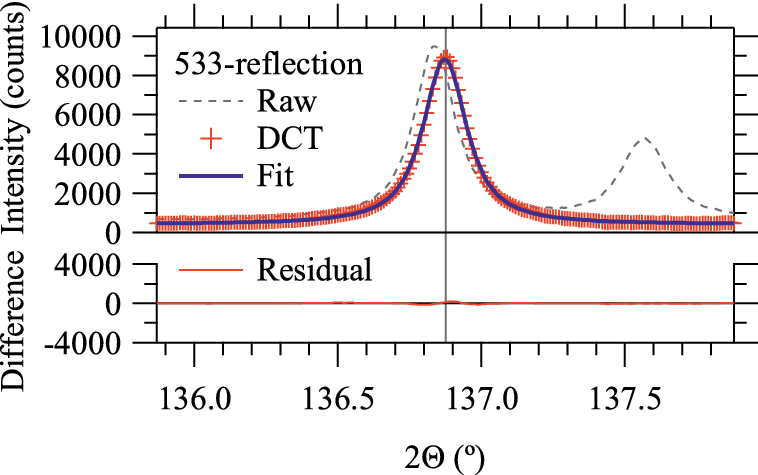
Table I lists the optimized values of the background intensity b, integrated peak intensity I, peak location 2Θ peak, and HWHM w of the Lorentzian component. The standard deviation σ and the kurtosis k of the symmetrized instrumental function, treated as fixed parameters, are also listed in Table I. The kurtosis k of the overall instrumental function approaches to 3 at 2Θ = 90°, which is consistent with that the effect of sample transparency aberration is expected to be dominant in the current measurement condition, especially for the angular range around 2Θ ≈ 90°.
Optimized values of background intensity b, integrated peak intensity I, peak location 2Θ peak, half width at half maximum (HWHM) w of the Lorentzian component, and fixed values of the standard deviation σ and kurtosis k of the symmetrized instrumental function, for hkl reflections of Si. Numbers in parentheses represent the square root of the diagonal elements of the covariance matrices about the adjusted parameters.

The difference between the optimized peak locations from the values listed in the certificate of NIST 640d, Δ2Θ, is plotted in Figure 12. A curve fitting method based on a naive model for the peak shift is applied to the values of Δ2Θ. The model is given by
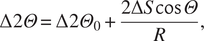 $$ \Delta 2\varTheta =\Delta 2{\varTheta}_0+\frac{2\Delta S\cos \varTheta }{R}, $$
where Δ2Θ 0 is the offset error of the apparent diffraction angle 2Θ, and ΔS is the specimen displacement along the normal (upward) direction. The optimized values are Δ2Θ 0 = 0.0172(2)° and ΔS = −0.0863(3) mm. The optimized value of the displacement looks a little too large for a carefully prepared powder specimen, and the fitting residuals clearly show systematic behavior on the variation of the apparent diffraction angle 2Θ. However, it is difficult to deny the validity of the naive model and the optimized values because the fitting residuals are within the accuracy of 0.01° certified by the manufacturer of the XRD instrument.
Difference of the peak locations optimized by an IPPF method from the values listed in the certificate of NIST SRM640d.
Figure 13 shows the Williamson–Hall (W–H) plot (Williamson and Hall, Reference Williamson and Hall1953) for the integral breadth B = πw of the optimized Lorentzian component of the profile model. The linear regression expressed by B cos Θ = B 0 + B 1 sin Θ has been optimized at the values B 0 = 0.0394(2)° and B 1 = 0.0559(3)°.
Williamson–Hall plot about the integral breadth B = πw of the optimized Lorentzian component. Fit line is given by B cos Θ = B 0 + B 1 sin Θ, optimized at B 0 = 0.0394(2)° and B 1 = 0.0559(3)°. The slope expected for the relative Lorentzian FWHM Δλ/λ = 0.00035 is drawn as a broken line.

The slope B 1 of the W–H plot is not far from, but slightly smaller than the value 0.063° expected for the relative Lorentzian FWHM Δλ/λ = 0.00035, intentionally convolved on the DCT process about the spectroscopic profile of the source X-ray. The slope of the W–H plot is not assigned to the strain broadening, but is mainly attributable to the convolved Lorentzian width. A slightly more gentle slope of the W–H plot than the expected value suggests that the current DCT method is missing or underestimating such an instrumental broadening effect that has weaker dependence upon 2Θ than tan Θ.
The diameter of the sphere with the equivalent volume-weighted average volume of the crystallites, which should be expressed by ⟨D⟩V ≡ ⟨D 4⟩/⟨D 3⟩ = 4λ/3B 0, is estimated at about 300 nm, and the value is an order of magnitude smaller than the typical particle diameter of 4.1 μm reported for NIST SRM640d powder. It also suggests that there should be a missing or underestimated instrumental broadening effect weakly or not depending on 2Θ.
The effects of finite sizes of the source X-ray and detector strips should cause constant instrumental broadening not dependent on 2Θ. It is likely that the intensity distribution of the source X-ray or sensitivity distribution of the detector is not uniform. It is suggested that the current analytical method could be utilized for texture (size and strain broadening) analysis, if more accurate information about the instrument was supplied by the manufacturer.
VI. CONCLUSION
Sample transparency aberration in Bragg–Brentano geometry affected by interference with opaque and translucent sample holders has been formulated. The formulation for an opaque sample holder should be classified into five cases, depending on the apparent diffraction angle, beam width, specimen width, and specimen thickness. The cumulants of the aberration function for a translucent sample holder with an arbitrary linear attenuation coefficient can numerically be evaluated by a Gauss–Legendre quadrature. The use of a function defined by the convolution of truncated exponential and rectangular functions has been tested as the model for the aberration function. A double DCT designed to cancel the effects of the first and third-order cumulants of the aberration function has been applied to the XRD data of Si standard powder, NIST SRM640d.
The diffraction peak profile in the data treated by the DCT method has certainly shown improved symmetry. The main features of the symmetrized peak profile in the DCT data have been simulated by instrumental and specimen parameters.
It is suggested that the effect of the finite size of the source X-ray focal line or the detector strips is underestimated in the current analysis. It is expected that the method could effectively be utilized for texture (size and strain broadening) analysis, if more accurate information about the instrument was supplied by the manufacturer.


 Open access