

1. INTRODUCTION
Icebergs calved from marine-terminating glaciers currently account for up to half of the ~400 Gt of ice lost annually from the Greenland ice sheet (Enderlin and others, Reference Enderlin2014). Some large calving events (~1 Gt of ice) cause glacial earthquakes of seismic magnitude M SW ~5 (Ekström and others, Reference Ekström, Nettles and Abers2003). Globally detectable seismic signals are generated when icebergs that extend the full thickness of the calving front rotate and accelerate away from a near-grounded glacier terminus (Amundson and others, Reference Amundson2008; Nettles and others, Reference Nettles2008; Tsai and others, Reference Tsai, Rice and Fahnestock2008; Nettles and Ekström, Reference Nettles and Ekström2010; Veitch and Nettles, Reference Veitch and Nettles2012; Murray and others, Reference Murray2015a). The iceberg acceleration produces a horizontal force on the solid Earth in a direction approximately perpendicular to the calving face (Tsai and Ekström, Reference Tsai and Ekström2007; Nettles and Ekström, Reference Nettles and Ekström2010; Veitch and Nettles, Reference Veitch and Nettles2012), while a pressure drop behind the calving iceberg produces a small upward-directed force (Murray and others, Reference Murray2015a).
The glacial-earthquake record provides a uniquely long-term and year-round time series of calving at Greenland's glaciers. Many glaciers lack field observations entirely, and even field campaigns at the best-studied glaciers collect data over a limited number of seasons. Satellite images offer incomplete records of large calving events due to the low time resolution of repeat imagery and to data gaps associated with cloud cover and winter darkness. By contrast, the continuous glacial-earthquake record provides information about changes to the geometry of a glacier's terminus between satellite image acquisitions and closely constrains the timing of rotational calving events. The glacial-earthquake record also complements other types of observations by providing information on the forces that are active during rotational calving events and by identifying a glacier's grounded state.
Over the past two decades, the region over which glacial earthquakes occur has expanded northward in Greenland (Veitch and Nettles, Reference Veitch and Nettles2012) and the number of earthquakes has increased by a factor of six (Ekström and others, Reference Ekström, Nettles and Tsai2006; Nettles and Ekström, Reference Nettles and Ekström2010), consistent with other observations of increased calving, mass loss and glacier thinning around Greenland (Howat and others, Reference Howat, Joughin and Scambos2007; Howat and Eddy, Reference Howat and Eddy2011; Moon and others, Reference Moon, Joughin, Smith and Howat2012; Murray and others, Reference Murray2015b; Harig and Simons, Reference Harig and Simons2016). Patterns at individual glaciers correspond to independently observed changes in glacier dynamics: glacial-earthquake occurrence typically increases as a glacier accelerates, thins, and retreats (Veitch and Nettles, Reference Veitch and Nettles2012).
Glacial earthquakes can be modeled as a single force using an approach developed for seismic analysis of landslides (Kawakatsu, Reference Kawakatsu1989; Ekström and others, Reference Ekström, Nettles and Abers2003; Tsai and Ekström, Reference Tsai and Ekström2007; Veitch and Nettles, Reference Veitch and Nettles2012). In this study, we use the methods employed by Tsai and Ekström (Reference Tsai and Ekström2007) and Veitch and Nettles (Reference Veitch and Nettles2012) to model waveforms for 145 glacial earthquakes that occurred between 2011 and 2013 (Fig. 1). Our results increase the glacial-earthquake catalog by 46% and allow us to assess the recent behavior of individual glaciers and analyze regional trends. We investigate patterns in glacial-earthquake production and cessation and changes in earthquake force orientation, comparing our results with constraints from satellite remote-sensing data.
Map showing locations of glacial earthquakes in Greenland between 2011 and 2013 (red dots). Gray dots show locations of two glaciers that previously produced glacial earthquakes (Tsai and Ekström, Reference Tsai and Ekström2007; Veitch and Nettles, Reference Veitch and Nettles2012) but did not produce events in 2011–13: Daugaard-Jensen Glacier (DJ) and Rolige Bræ (RB).

2. DATA AND METHODS
2.1. Glacial-earthquake detection
We identify glacial earthquakes using the approach of Ekström (Reference Ekström2006), which uses intermediate-period (35–150 s) Rayleigh waves to identify seismic events. The long source durations (~50 s) of the earthquakes result in seismograms depleted in high-frequency energy and make the events imperceptible to standard short-period body-wave detection algorithms (Ekström and others, Reference Ekström, Nettles and Abers2003). Detections are made using seismic data recorded by the IRIS-USGS Global Seismographic Network (GSN), GEOFON, GEOSCOPE, and MedNet Networks, and the Greenland Ice Sheet Monitoring Network (GLISN). The long wavelengths of the surface waves used by the detection algorithm (a 50-s Rayleigh wave has a wavelength of ~200 km) lead to initial detection locations with uncertainties of 50–80 km (Ekström, Reference Ekström2006; Veitch and Nettles, Reference Veitch and Nettles2012). We use the detection locations and times as inputs for waveform modelling for all events.
The event detector is run in near-real time and again several months later to include delayed seismic data. All events detected using the full dataset, including those initially detected in near-real time, are labeled ‘standard’ detections. A few events are identified only during the initial near-real-time processing; we label these ‘NRT’ detections. We perform waveform analysis on both standard and NRT detections and present the solutions for both types in the interest of catalog completeness. However, because NRT detections are not available for the earliest years of the catalog, we include only the standard detections in our discussion of spatiotemporal trends, consistent with previously published results (Tsai and Ekström, Reference Tsai and Ekström2007; Veitch and Nettles, Reference Veitch and Nettles2012). At the beginning of 2014, changes to the event detector altered the magnitude threshold for glacial-earthquake detection. We present data in this study only through the end of 2013 in order to allow direct comparison of the numbers of glacial earthquakes in 2011–13 with the previously published catalog of events from 1993–2010.
2.2. Waveform modelling
Following previous authors (Tsai and Ekström, Reference Tsai and Ekström2007; Veitch and Nettles, Reference Veitch and Nettles2012), we use a centroid-single-force (CSF) approach (Kawakatsu, Reference Kawakatsu1989; Ekström and others, Reference Ekström, Nettles and Abers2003) to model the forces active during glacial earthquakes. We estimate six source parameters: the centroid time shift from the original detection time, the centroid latitude and longitude, and the three components of the force vector. A summary measure of the earthquake size, M CSF, analogous to the seismic scalar moment for tectonic earthquakes, is derived by integrating the force-time history twice. Though glacial earthquakes occur at Earth's surface, previous experiments confirm that modeling results are only weakly sensitive to the choice of source depth above 15 km (Veitch and Nettles, Reference Veitch and Nettles2012). We calculate source excitation in the preliminary reference Earth model (PREM; Dziewonski and Anderson, Reference Dziewonski and Anderson1981), and fix the source depth at 4 km to take into account the 3-km-thick ocean layer in that model.
We filter the seismograms to ground velocity in the period band 50–150 s or to displacement in the period band 40–100 s. Stations within 50° epicentral distance of the events generally show the highest-quality seismograms, and we handpick ~30 of these stations to use for each event, aiming for good azimuthal coverage. Vertical-, transverse-, and longitudinal-component seismograms are considered and all three are used when possible. We perform full-waveform inversions using the CSF approach for all events in our dataset. Consistent with previous studies (Ekström and others, Reference Ekström, Nettles and Abers2003; Tsai and Ekström, Reference Tsai and Ekström2007; Veitch and Nettles, Reference Veitch and Nettles2012), we specify a force-time function with a duration of 50 s such that a constant force acts on the Earth for 25 s as the iceberg accelerates and then reverses sign for an additional 25 s as the iceberg decelerates. We evaluate our inversion results based on the fit of synthetic seismograms to the data, stability of the source parameters, and residual variance of the solution, using criteria similar to those of the GCMT (Global Centroid-Moment-Tensor) project (Ekström and others, Reference Ekström, Nettles and Dziewoński2012).
3. RESULTS
We analyzed a total of 145 glacial earthquakes in Greenland during 2011–13: 105 standard detections (Fig. 2), one poorer-quality standard detection, and 39 NRT detections. We obtained satisfactory solutions for all but six of the events. The source parameters are listed in Table 1 and are available electronically on our website, www.globalcmt.org. As in previous studies, our centroid locations lie systematically closer to glacier calving fronts than the initial detection locations, which allows us to identify the source glacier for each glacial earthquake. The events in our dataset have CSF amplitudes ranging from 0.13 × 10¹⁴ to 1.1 × 10¹⁴ kg m with a median value of 0.31 × 10¹⁴ kg m. These amplitudes are very similar to those found by Veitch and Nettles (Reference Veitch and Nettles2012). We observe glacial-earthquake force vectors generally oriented normal to the calving front (Fig. 3). In Table 1 and throughout the text, we present all force azimuths in degrees east of north.
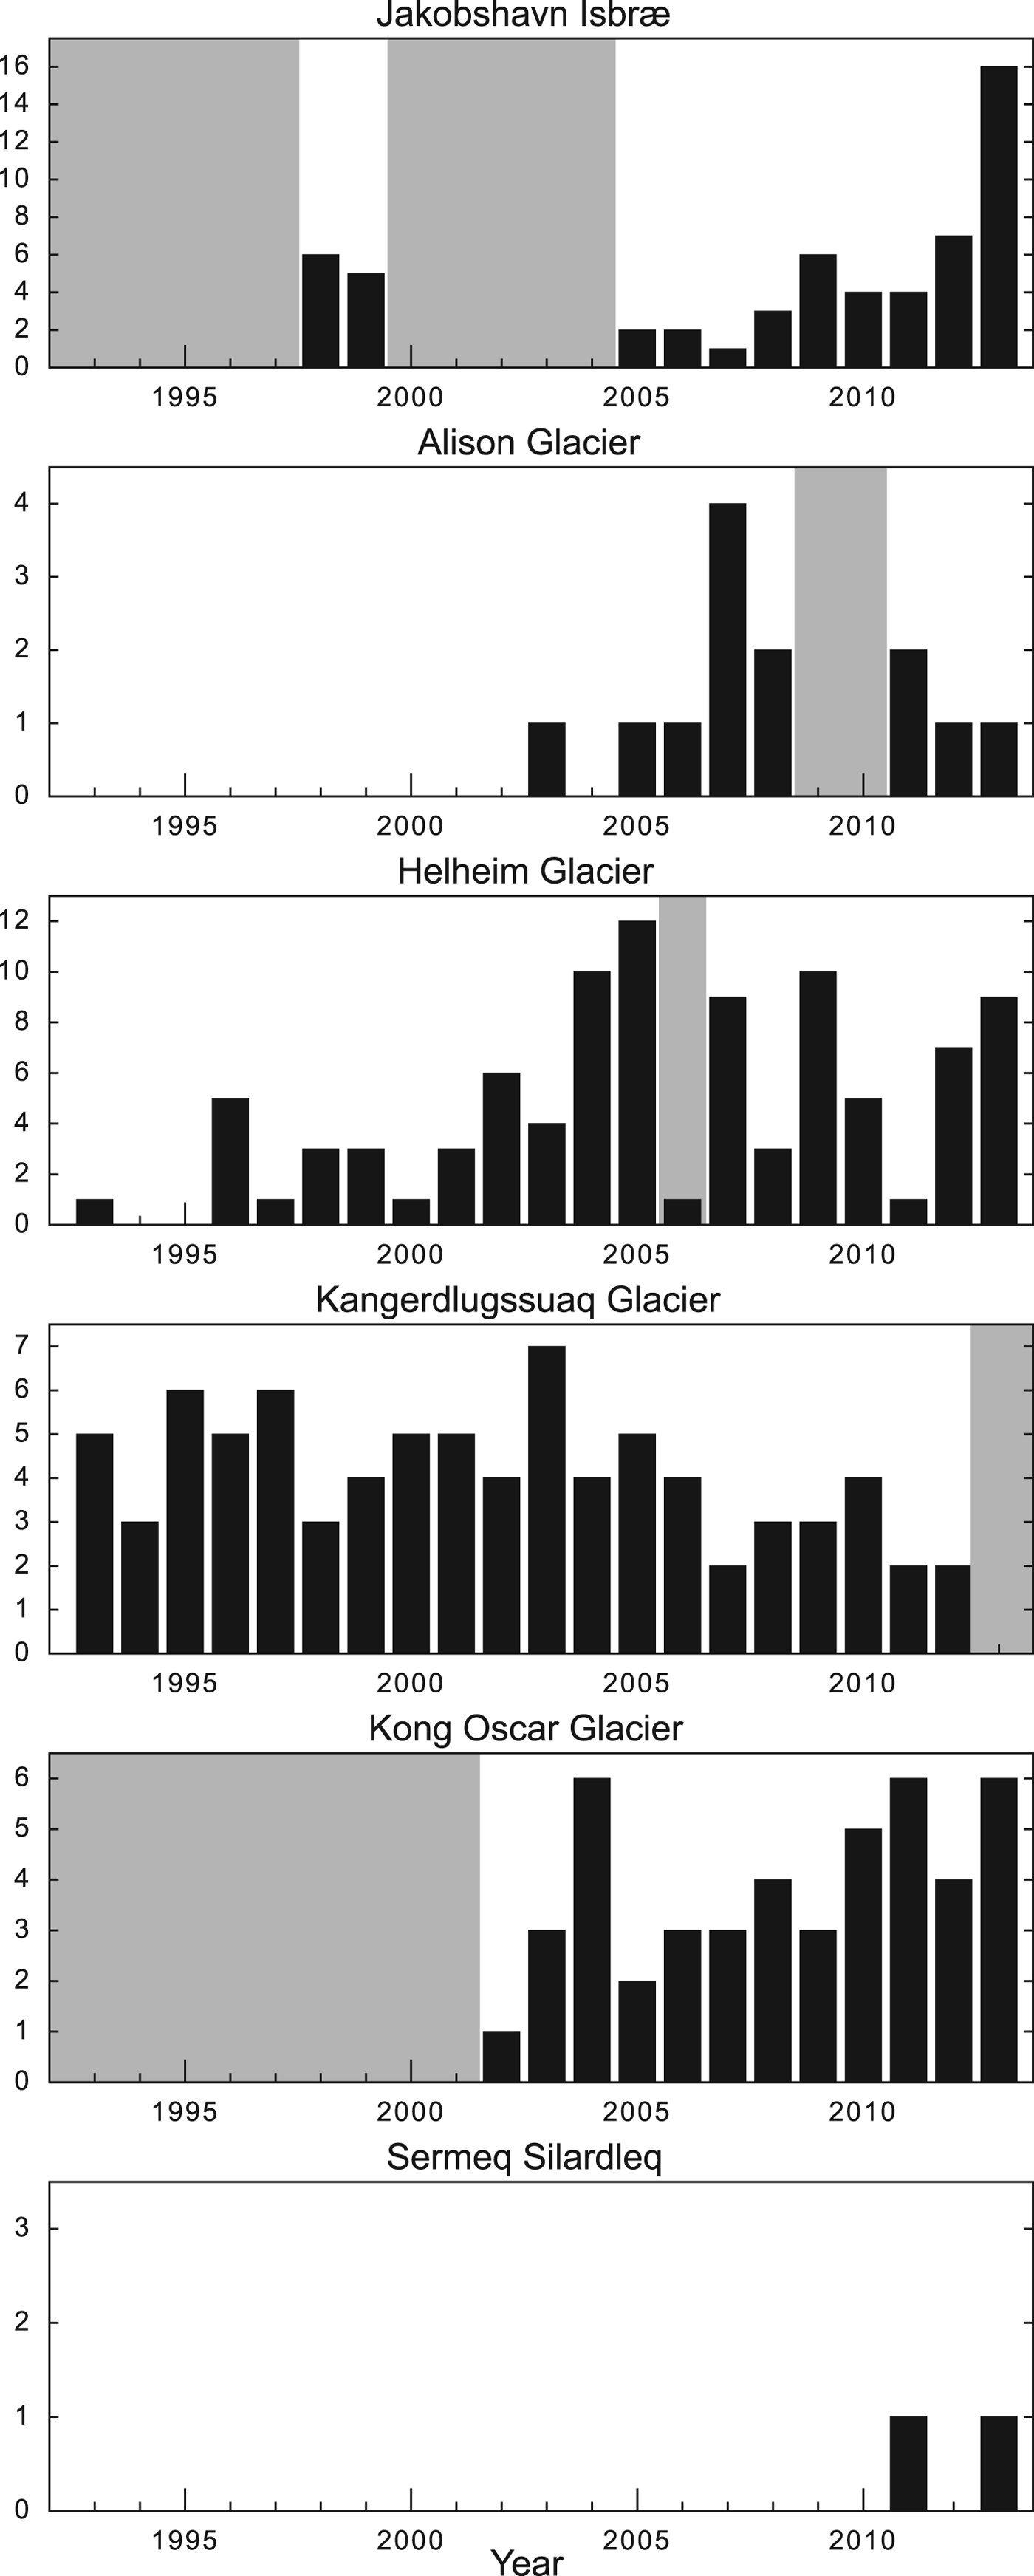
Glacial-earthquake occurrence in Greenland, 1993–2013. Top: Number of glacial earthquakes detected annually. Bottom: Annual earthquake detections by region. Gray bars identify the 3 years of new data analyzed in this study.

Glacial-earthquake force azimuths for the complete catalog, 1993–2013. Red sticks show events from this study, and blue sticks show published solutions from Tsai and Ekström (Reference Tsai and Ekström2007) and Veitch and Nettles (Reference Veitch and Nettles2012). Names of glaciers are given in Figure 1.

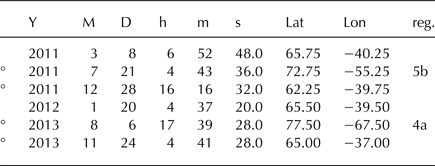
Centroid-single-force solutions for 139 earthquakes in this study. Columns give event number; centroid time with standard error; centroid time shift from detection time (δt0); centroid latitude with standard error (error of .00 means error is smaller than two decimal places); shift in latitude from detection location (δλ 0); centroid longitude with standard error (error of .00 means error is smaller than two decimal places); shift in longitude from detection location (δϕ 0); scaling exponent for CSF amplitude and vector; CSF amplitude M CSF, in units of kg m, to be scaled by exponent given in the previous column (for event 1, M CSF = 3.3 × 10¹³ kg m); CSF vector in geographic coordinates r, θ, ϕ (up, south, east), with standard errors, to be scaled by the Scale Factor; plunge of CSF vector with respect to horizontal; azimuth of CSF vector with respect to north; and source glacier. Source glacier identifiers are consistent with Veitch and Nettles (Reference Veitch and Nettles2012) with the addition of glacier 9: 1: Kangerdlugssuaq Glacier; 2: Helheim Glacier; 3: Southeast Greenland; 4a: Tracy Glacier; 4b: Kong Oscar Glacier; 4c: Sverdrup Glacier; 4d: Hayes Glacier; 4e: Alison Glacier; 5a: Giesecke Bræer; 5b: Upernavik Isstrøm; 6: Rink Isbræ; 7: Jakobshavn Isbræ; 9: Sermeq Silardleq. Circles beside event numbers denote NRT detections. * denotes a poorer-quality standard detection

The majority of the glacial earthquakes we analyze occur at twelve previously documented source glaciers around Greenland (Tsai and Ekström, Reference Tsai and Ekström2007; Veitch and Nettles, Reference Veitch and Nettles2012). Over 65% of the events produced each year between 2011 and 2013 occurred at glaciers on Greenland's west coast (Fig. 2). We document two events at Sermeq Silardleq, a glacier on Greenland's west coast where glacial earthquakes have not previously been recorded. We do not observe any events at Rolige Bræ or Daugaard-Jensen Glacier, both of which are located on Greenland's east coast and previously produced glacial earthquakes (Fig. 1; Tsai and Ekström, Reference Tsai and Ekström2007; Veitch and Nettles, Reference Veitch and Nettles2012).
Noisy data prevent good solutions for two of the glacial-earthquake detections, at Tracy Glacier and Upernavik Isstrøm. We are also unable to obtain satisfactory CSF solutions for four events on the southeast coast of Greenland. For these events, we are unable to identify the source glacier confidently, though the events appear to occur in the region bounded by Helheim Glacier and Køge Bugt. We have manually inspected the detection stacks for all six events and confirmed that the detections represent earthquake signals, very likely originating from glacial earthquakes. Detection parameters for these events are included in Table 2.
Detection parameters for the six earthquakes for which we were unable to obtain robust CSF solutions. Columns give detection time; detection location; and source glacier (where known). Source glacier identifiers are as in Table 1: 4a: Tracy Glacier; 5b: Upernavik Isstrøm. The four events listed without source glaciers have detection locations along Greenland's southeast coast. Circles denote NRT detections
4. DISCUSSION
4.1. Glacial-earthquake distribution patterns
The annual number of glacial earthquakes has increased significantly since 1993 (Tsai and Ekström, Reference Tsai and Ekström2007; Veitch and Nettles, Reference Veitch and Nettles2012), and 2011–13 was the most prolific 3-year period of glacial-earthquake production on record. Most of the increase in earthquake numbers is due to increased production on the west coast. The years 2011–13 produced the largest number of glacial earthquakes in western Greenland ever recorded, continuing a trend of increased production at west-coast glaciers that began in 2000. During this period, three times as many glacial earthquakes occurred on Greenland's west coast as on the east coast (Fig. 2). Seven glaciers each produced twice as many glacial earthquakes as in the preceding 3 years. All of these glaciers are located in western Greenland: Jakobshavn Isbræ, Upernavik Isstrøm, Alison Glacier, Tracy Glacier, Rinks Glacier, Hayes Glacier, and Giesecke Bræer. In addition, we record two glacial earthquakes at a previously quiescent glacier on Greenland's west coast.
4.2. Links between glacier dynamics and glacial earthquakes
The ongoing production of glacial earthquakes, primarily at glaciers with previously documented earthquakes, is consistent with continued retreat and calving at these glaciers (e.g., Carr and others, Reference Carr, Vieli and Stokes2013) and ongoing mass loss from western Greenland (Velicogna and others, Reference Velicogna, Sutterley and van den2014). In the remainder of this section, we focus on six glaciers where the glacial earthquakes show unexpected or unusual behavior that allows us to examine particular aspects of the link between glacial earthquakes and glacier dynamics. We consider changes in earthquake occurrence rate in the context of a proposed grounding-condition control on these events, motivated in part by increasing interest in determining the grounded state of a glacier terminus (e.g., Hogg and others, Reference Hogg, Shepherd, Gourmelen and Engdahl2016). Previous observations have linked the occurrence of glacial earthquakes to conditions at the glacier terminus, with glacial earthquakes occurring only at glaciers with near-grounded termini (Veitch and Nettles, Reference Veitch and Nettles2012; Murray and others, Reference Murray2015c).
The association between a nearly grounded terminus and earthquake occurrence is likely explained primarily by the control the grounding condition exerts on calving style: floating termini generally calve large, tabular icebergs that do not rotate and do not generate earthquakes (Amundson and Truffer, Reference Amundson and Truffer2010; Veitch and Nettles, Reference Veitch and Nettles2012), and nearly grounded termini calve smaller, tall icebergs that capsize (Amundson and others, Reference Amundson2008; Veitch and Nettles, Reference Veitch and Nettles2012; Murray and others, Reference Murray2015c). Murray and others (Reference Murray2015a,Reference Murrayc) have argued for a close link between a buoyant-flexure calving mechanism and the glacial earthquakes, with the same buoyancy force that drives formation of basal crevasses and leads to calving causing the iceberg capsize that generates the earthquake signal.
We also evaluate changes in glacial-earthquake force azimuths to assess the variability that may occur at individual glaciers. Observed force azimuths generally agree well with the normal to the section of the terminus that produced the calving iceberg (Veitch and Nettles, Reference Veitch and Nettles2012, Reference Veitch and Nettles2017; this study). We consider force azimuths that deviate from long-term trends at several glaciers to evaluate links to changes in glacier geometry and calving style. Figure 4 shows time series of glacial earthquakes at the six glaciers we examine in detail, and Figure 5 shows the geometries of these glaciers' calving fronts along with force azimuths of recent glacial earthquakes.
Number of glacial earthquakes detected at the six glaciers discussed in detail in the text. Gray shading identifies years when a glacier is known to have maintained a floating ice tongue. In 2006, Helheim Glacier maintained a floating ice tongue for most of the year and its single glacial earthquake occurred on 23 August 2006. Floating condition is unknown for years shown with neither glacial earthquake counts nor gray shading.
Geometry of calving fronts and glacial-earthquake force azimuths for the six glaciers discussed in detail in the text. Yellow lines show glacier terminus positions digitized from background Landsat images, all from 2015. Circular inset shows force azimuths for glacial earthquakes at each glacier from 2011 to 2013. Black stick placed on each calving front represents the mean azimuth of the events at each glacier that fall within the green shading. A detailed plot of variation in azimuth at Alison Glacier is shown in Figure 6. The variation in azimuths at Kong Oscar Glacier is discussed in the text and a subset of events is shown in more detail in Figure 8.

4.3. Jakobshavn Isbræ
Jakobshavn Isbræ, Greenland's largest outlet glacier, has alternated between years when it maintained a floating ice tongue and did not produce recorded glacial earthquakes (1993–97 and 2000–04) and years when the calving margin was near a grounding line or pinning point and the glacier produced glacial earthquakes (1998–99 and 2005–13; Veitch and Nettles, Reference Veitch and Nettles2012; this study). From 1998 through 2012, Jakobshavn Isbræ produced no more than seven glacial earthquakes in any one year (Fig. 4). In 2013, Jakobshavn produced 16 events, more than 50% of the total number of events on Greenland's west coast and 38% of the total number of glacial earthquakes in Greenland that year.
The ice dynamics, geometry, and position of Jakobshavn's calving front in 2013 illustrate the ideal conditions for glacial-earthquake production. Increased ice velocities have previously been linked to increased glacial-earthquake production (Veitch and Nettles, Reference Veitch and Nettles2012). Ice velocities near Jakobshavn's terminus increased by 50% between summer 2011 and 2012, and summer velocities in 2012 and 2013 included the fastest ice speeds, up to 17 km a−1, ever recorded at an outlet glacier or ice stream in Greenland (Joughin and others, Reference Joughin, Smith, Shean and Floricioiu2014). In 2013, the glacier occupied the most-retreated terminus position observed there (Joughin and others, Reference Joughin, Smith, Shean and Floricioiu2014). During 2013, Jakobshavn's terminus was very close to flotation, and therefore in a position favorable for buoyancy-driven calving (James and others, Reference James, Murray, Selmes, Scharrer and O'Leary2014), which produces glacial earthquakes (Murray and others, Reference Murray2015a). During the three winters prior to 2013, Jakobshavn's terminus advanced less than it had during any of the preceding ten winters (Cassotto and others, Reference Cassotto, Fahnestock, Amundson, Truffer and Joughin2015). Reduced readvance and a diminished floating ice tongue would be expected to hasten the onset of glacial earthquakes in the spring. We speculate that the high numbers of glacial earthquakes produced in 2013 compared to 2011 and 2012 were caused by an earlier onset of mélange breakup in 2013. In 2013, glacial-earthquake production began in March and continued through September, in contrast to the previous 2 years when the summer onset of glacial earthquakes occurred in June. The presence of a strong ice mélange in contact with Jakobshavn's terminus has been observed to inhibit calving events (Amundson and others, Reference Amundson2010; Cassotto and others, Reference Cassotto, Fahnestock, Amundson, Truffer and Joughin2015). The early onset of glacial earthquakes in 2013 suggests that Jakobshavn lacked a strong, rigid mélange that spring, possibly due to unusually warm sea-surface temperatures like those observed in the fjord during the winters of 2010, 2011, and 2012 by Cassotto and others (Reference Cassotto, Fahnestock, Amundson, Truffer and Joughin2015).
Most glacial-earthquake force azimuths at Jakobshavn Isbræ are consistent with calving at the glacier's southern terminus. The Jakobshavn terminus is unusually broad, being fed by two separate regions of fast-flowing ice, which now terminate in two separate calving fronts (Fig. 5). The terminus widened to its current geometry in 2004, when it retreated beyond the confines of its rock-bounded fjord (Dietrich and others, Reference Dietrich2007). Veitch and Nettles (Reference Veitch and Nettles2017) show that glacial-earthquake force orientations between 2005 and 2010 are consistent with sources on the southern calving front, which is associated with the faster-flowing of the two ice streams. With one exception, all glacial earthquakes between 2011 and 2013 also have force azimuths consistent with the southern calving front (~130°, Fig. 5), suggesting that this remains the source of recent glacial earthquakes. The single earthquake with an anomalous force azimuth, of 8°, occurred in 2011. This azimuth falls within the range of calving-front-normal orientations found along the fast-flowing portion of the northern section of the calving front. No glacial earthquakes with this force orientation have previously been documented, though the northern section of the calving front is known to calve actively, and had ice velocities of ~2.5 km a−1 from 2011 to 2013 (Joughin and others, Reference Joughin2008b, Reference Joughin, Smith, Shean and Floricioiu2014).
4.4. Alison glacier
After 25 years with a stable terminus position, Alison Glacier on Greenland's northwest coast began a rapid retreat in the summer of 2001 (Carr and others, Reference Carr, Vieli and Stokes2013). From 2001to 2006, the glacier retreated ~8.5 km (McFadden and others, Reference McFadden, Howat, Joughin, Smith and Ahn2011; Carr and others, Reference Carr, Vieli and Stokes2013) and produced its first glacial earthquakes: one each year in 2003, 2005, and 2006 (Veitch and Nettles, Reference Veitch and Nettles2012). During 2007 and 2008 the terminus position stabilized again (McFadden and others, Reference McFadden, Howat, Joughin, Smith and Ahn2011). The glacier produced four earthquakes in 2007 and two earthquakes in 2008 (Veitch and Nettles, Reference Veitch and Nettles2012). Through 2008, all glacial earthquakes at Alison had force azimuths oriented perpendicular to the northern portion of the glacier's calving margin (Veitch and Nettles, Reference Veitch and Nettles2012; see also Fig. 6). No glacial earthquakes occurred in 2009 or 2010, though the terminus continued to retreat (Carr and others, Reference Carr, Vieli and Stokes2013). Landsat images from the summer calving seasons in these years show large, tabular icebergs in the fjord, consistent with the aseismic calving expected from a floating glacier tongue. The hiatus in glacial-earthquake production from 2009 to 2010 despite continued retreat suggests that Alison Glacier may have dynamically thinned to flotation during these years.
Calving-front locations and glacial-earthquake force azimuths at Alison Glacier. Top: Colored calving fronts show summer terminus positions digitized from Landsat images during years when glacial earthquakes occurred. Background image is from 1 October 2013. Bottom: Colored lines show calving fronts as in top figure, but with an arbitrary separation in the horizontal direction. Colored sticks show the force azimuths of glacial earthquakes. Force azimuths are plotted on the calving front at the location where they are most nearly perpendicular to the calving front. Dates are given for the two events that occurred in the summer of 2011.

Glacial earthquakes resumed at Alison Glacier in the summer of 2011 and we observe a distinct change in glacial-earthquake force orientation between June and July of that year. A glacial earthquake at Alison Glacier on 29 June 2011 had a force azimuth of 55°, perpendicular to the northernmost portion of the calving front and similar to all previously documented glacial-earthquake force orientations at this glacier (Fig. 6). One month later, on 27 July 2011, a glacial earthquake occurred with a force azimuth oriented 143°, nearly perpendicular to the orientation of the preceding event. Three subsequent glacial earthquakes recorded at Alison Glacier in 2012 and 2013 have force orientations similar to the July 2011 event and ~105° from the mean orientation of all pre-2011 events. No further events with force azimuths aligned with the pre-2011 events were recorded through 2013 (Fig. 5).
During the 2 weeks prior to the change in glacial-earthquake force orientation in July 2011, Landsat imagery shows the northernmost portion of Alison Glacier retreating to a rock outcrop, where it remained fixed through the end of 2013. In contrast, the central and southern portions of the terminus continued to retreat through 2013. The four events occurring from 27 July 2011 onwards all had force azimuths consistent with calving from the southern portion of the terminus. We interpret the observed change in force azimuths as reflecting a change in the portion of the calving margin responsible for seismogenic calving events, as well as reflecting the overall change in calving-front orientation that occurred between 2008 and 2011.
4.5. Helheim glacier
Helheim Glacier has produced glacial earthquakes every year since 1996, but has exhibited significant year-to-year variability in the number of events produced (Fig. 4). During the early 2000s, Helheim produced increasing numbers of glacial earthquakes (Tsai and Ekström, Reference Tsai and Ekström2007) as it thinned, accelerated, and retreated. The glacier reached a minimum position in its fjord in summer 2005 after retreating 4 km between August 2004 and August 2005 (Howat and others, Reference Howat, Joughin, Tulaczyk and Gogineni2005). During 2006, the terminus position advanced (Joughin and others, Reference Joughin2008a) and re-stabilized (Bevan and others, Reference Bevan, Luckman and Murray2012). The annual number of glacial earthquakes has been variable since that time (Veitch and Nettles, Reference Veitch and Nettles2012; this study). During 2011–13 Helheim produced one, seven, and nine events. The glacier maintained a relatively stable calving-front position throughout 2011, 2012, and the first half of 2013, before advancing ~3 km during the end of 2013 and beginning of 2014 (Kehrl and others, Reference Kehrl, Joughin, Shean, Floricioiu and Krieger2017).
The force orientations of glacial earthquakes at Helheim have evolved over time (Veitch and Nettles, Reference Veitch and Nettles2012, Reference Veitch and Nettles2017; Fig. 7). Through 2005, the mean force azimuth was 96°. After the advance and stabilization of the terminus in 2006, force azimuths at Helheim Glacier changed markedly, with a mean of 120° for earthquakes in 2006–13. Comparison between glacial-earthquake force orientations and calving-front orientations by Veitch and Nettles (Reference Veitch and Nettles2017) suggest that the source of seismogenic calving events at Helheim Glacier shifted from the southern portion of the calving front to the northern portion in 2005. Consistent with this interpretation, observations from summer 2013 show flexion zones only on the north side of the glacier terminus (Murray and others, Reference Murray2015c). Flexion zones are linked with basal crevasses and the future detachment location of capsizing icebergs, and their presence along the northern portion of the calving margin suggests that this portion of the ice experiences the forces required for buoyancy-driven rotational calving. The absence of flexion zones along the southern portion of the calving front suggests that this portion of the terminus may not calve through the same mechanism (Murray and others, Reference Murray2015c), explaining a lack of glacial earthquakes on the southern side of the glacier. The mean force orientation of glacial earthquakes between 2011 and 2013 (Fig. 5) is within two degrees of the mean value from 2006 through 2010, suggesting that the northern portion of the calving front remained the source of glacial earthquakes from 2011 through 2013. The synchronous change in force azimuths and terminus position before and after the rapid retreat in 2005 suggests that the position of the glacier's terminus within the fjord is the main control on terminus geometry and glacial-earthquake orientation (Fig. 7).
Force azimuths and terminus positions at Helheim Glacier. Grey dots show force azimuths for all glacial earthquakes at Helheim Glacier, 1993–2013. Dashed line shows mean force azimuth. Blue dots show terminus position, from Bevan and others (Reference Bevan, Luckman and Murray2012). Inspection of Landsat images shows that terminus positions remained within the 2008–10 range during 2011–13.

4.6. Kangerdlugssuaq glacier
Kangerdlugssuaq Glacier was one of the most active producers of glacial earthquakes from 1993 through 2012 (Veitch and Nettles, Reference Veitch and Nettles2012; this study). No glacial earthquakes were detected during 2013, for the first time since 1993 (Fig. 4). The glacier maintained a relatively steady mean calving-front position through 2004, before retreating ~5 km during 2004–05 (Seale and others, Reference Seale, Christoffersen, Mugford and O'Leary2011). By 2006, the glacier had stabilized and resumed steady seasonal cycles of advance and retreat (Seale and others, Reference Seale, Christoffersen, Mugford and O'Leary2011), with earthquakes occurring during the retreat phase. During the first half of 2013, Kangerdlugssuaq advanced and produced a floating ice tongue, moving the calving front ~6 km down the fjord (Kehrl and others, Reference Kehrl, Joughin, Shean, Floricioiu and Krieger2017). Satellite imagery of Kangerdlugssuaq in 2013 indicates that, during the glacier's advance, no large icebergs of any kind were produced. When retreat began late in the year, tabular icebergs made up the largest fraction of icebergs produced by the glacier, and few nontabular icebergs were observed (Kehrl and others, Reference Kehrl, Joughin, Shean, Floricioiu and Krieger2017). The lack of seismicity in 2013 is consistent with our understanding that a glacier's calving margin must be near its grounding line to produce the kind of nontabular, capsizing icebergs that are responsible for glacial earthquakes, while a floating glacier tongue will not produce glacial earthquakes.
4.7. Kong Oscar glacier
The terminus position at Kong Oscar Glacier has been one of the most stable in the region since 2002, when the glacier is believed to have grounded and glacial earthquakes began to occur (Fig. 4; Veitch and Nettles, Reference Veitch and Nettles2012). Excluding five events with unusual azimuths discussed by Veitch and Nettles (Reference Veitch and Nettles2017), the mean orientation of previously documented glacial earthquakes at Kong Oscar Glacier is ~50°. This orientation is well aligned with the eastern portion of Kong Oscar's calving front through 2010 (Veitch and Nettles, Reference Veitch and Nettles2017). We analyze 16 glacial earthquakes at Kong Oscar Glacier, of which six have azimuths that differ significantly from the majority of previously published force azimuths. The remaining 2011–13 events have a mean orientation of ~30° (Fig. 5). This azimuth is consistent with continued calving from the eastern portion of the terminus.
The events with unusual azimuths in 2011–13 have force azimuths of 101° (one event) or 166°–183° (five events). Satellite observations from 2011 to 2013 show active retreat at both the western and eastern edges of the calving front. During these years, the westernmost 2 km of Kong Oscar's calving front was aligned approximately east–west, consistent with production of glacial-earthquake force azimuths oriented ~180°. We therefore attribute the five glacial earthquakes with force azimuths of 166°–183° to calving events along the western portion of the calving front. There is one previously published event at Kong Oscar with an azimuth comparable to these events (Tsai and Ekström, Reference Tsai and Ekström2007). There is no clear explanation for the event in 2011 with a force azimuth of 101°, or for two previously published events at Kong Oscar Glacier in 2007 with similar force azimuths (Veitch and Nettles, Reference Veitch and Nettles2017). The solutions for all three of these glacial earthquakes appear robust. We examined Landsat imagery at the times of these events in detail and are unable to identify an actively calving terminus region that would be expected to generate seismic forces with this orientation.
A set of four glacial earthquakes at Kong Oscar in late September and early October 2013 demonstrate the possibility of rapid variation in force azimuths at a single glacier. The earthquakes occurred over a 9-day period, and had orientations of 22°, 173°, 62°, and 162°, respectively (Fig. 8). We interpret this sequence as a series of calving events alternating between the western and eastern portions of the terminus. We visually inspect three Landsat images that capture the terminus position during this calving sequence. An image taken on 27 September 2013 shows the orientation of Kong Oscar's calving front before the sequence of four earthquakes. The first earthquake in the sequence occurred on 29 September 2013 with a force orientation of 22°. A Landsat image taken <2 h after this calving event shows ice missing from the western portion of the calving front compared to the previous image. The next glacial earthquake occurred on 3 October 2013, with a force azimuth of 173°. Comparison of this event with a Landsat image taken on 6 October 2013 shows that this event and the next calving event, on 5 October 2013, removed ice from the eastern portion of the terminus. The final earthquake in this sequence occurred on 7 October 2013, with a force azimuth of 162°. The force azimuth of this event is consistent with calving from the western portion of the terminus.
Force azimuths at Kong Oscar Glacier. Top: Colored calving fronts show terminus positions digitized from Landsat images in September and October, 2013; colors are as in bottom figure. Background image is from 6 October 2013. Bottom: Colored lines show the calving fronts as in top figure, but with an arbitrary separation in the vertical direction; dates at left give time of image. Colored sticks show glacial-earthquake force azimuths, plotted on the calving front at the location where they are most nearly perpendicular to the calving front. The normal to the 27 September 2013 front is ~ 30°. Dates of each earthquake in 2013 are given in black.

Previous studies have documented multiple seismogenic calving events at a single glacier in close succession (Nettles and others, Reference Nettles2008; Walter and others, Reference Walter2012; Sergeant and others, Reference Sergeant2016), suggesting that one calving event may trigger a second, and a wide glacier terminus might calve by progressive failure along the width of the front. The close alignment of glacial-earthquake force azimuths with subsections of the calving front at Kong Oscar Glacier illustrates the utility of glacial-earthquake azimuth data in identifying the subsection of a calving margin that generated a glacial earthquake, and in tracking the progression of failure across a glacier's terminus. During 2011–13, we observe ten additional pairs of glacial earthquakes in Greenland that occurred on the same day at a single glacier. Multiple-earthquake sequences, such as the sequence of four events in late September–early October 2013 at Kong Oscar, suggest that failure of one section of the calving front may alter the local stress regime enough to influence other portions of the calving front hours to days later.
4.8. Sermeq Silardleq
We document two glacial earthquakes at Sermeq Silardleq (Figs 4, 5), a previously quiescent glacier that terminates in Uummannaq Bay on Greenland's west coast. Sermeq Silardleq is 3.3 km wide at its terminus (Jensen and others, Reference Jensen, Box and Hvidberg2016), which makes it the smallest glacial-earthquake-producing glacier in Greenland. Between 2000 and 2010, Sermeq Silardleq experienced ~3 km of retreat, then maintained a stable terminus position during 2011–13 (York and others, Reference York, Frey and Das2016). The events we observe occurred in 2011 and 2013. The pattern of retreat, followed by the onset of glacial earthquakes, is consistent with that seen at numerous other glaciers around Greenland. The stable terminus position from 2011 to 13, along with the onset of glacial earthquakes, suggests that the calving front was close to grounded during all three of those years. Warm Atlantic water is a possible cause of the retreat to the grounding line. This water is known to enter Uummannaq Bay along a bathymetric trough in the continental shelf (Rignot and others, Reference Rignot2016). Such water has been a driver of sub-glacial melting at other glaciers in Uummannaq Bay close to Sermeq Silardleq (Chauché and others, Reference Chauché2014) and of acceleration at nearby Jakobshavn Isbræ (Holland and others, Reference Holland, Thomas, De Young, Ribergaard and Lyberth2008).
5. CONCLUSIONS
We analyzed three years of seismic data, 2011–13, and obtained source parameters for 139 glacial earthquakes. Our results extend the glacial-earthquake catalog to 21 years and increase the number of events in the catalog by nearly 50%. Our study period is the most prolific three-year period of glacial earthquakes on record. Much of the increase in earthquake productivity is due to glaciers on Greenland's northwest coast, seven of which generated twice as many glacial earthquakes during 2011–13 as during the preceding three years. These seven glaciers accounted for 60% of all glacial earthquakes between 2011 and 2013, compared with only 39% of total glacial-earthquake production during 2008–10. Jakobshavn Isbræ alone was responsible for one third of the glacial earthquakes on Greenland's west coast from 2011 to 13. Despite the increase in glacial-earthquake activity at glaciers along Greenland's northwest coast, the seismic events remain confined to glaciers south of 78° N. We expect this geographical limitation to persist as long as the large glaciers along Greenland's north and northeast coast drain into floating ice tongues or ice shelves, which do not produce glacial earthquakes.
The expanded glacial-earthquake catalog we produce allows us to explore individual glacier behavior in detail. We identify changes in calving behavior at several glaciers and provide high-precision timing constraints on those changes. The presence of a glacial earthquake establishes the glacier's grounded state, as these seismic events occur only when a glacier's terminus is near its grounding line. At Kangerdlugssuaq Glacier we use earthquake data to document the transition from a near-grounded terminus to a floating ice tongue in 2013. Glacial earthquakes also provide detailed information about the geometry and region of the calving front active during a calving event. Sequences of glacial earthquakes can track the timing of progressive failure across a single calving front, as we document at Kong Oscar Glacier, and the evolution of calving-front orientations, as we document at Helheim and Alison Glaciers. The seasonality of glacial earthquakes is linked to seasonal ice-front advance and retreat, including modulation by the strength of ice mélange in the proglacial fjord. At Jakobshavn Isbræ, the number of glacial earthquakes dramatically increased in 2013, following several years of unusually warm sea surface temperatures and inferred weak mélange conditions in the fjord.
Large calving events continue to contribute significantly to mass loss of the Greenland ice sheet. Glacial earthquakes are an increasingly effective remote-observation tool for understanding dynamic processes and ice–ocean interactions at glacier margins. Continued documentation and analysis of these events will be a valuable addition to our understanding of the behavior of the Greenland ice sheet, as will future work to understand better the physics of the glacial-earthquake source.
ACKNOWLEDGMENTS
This work was supported by NSF grants EAR–1249167 and ARC–1304346 and an NSF Graduate Research Fellowship to K. Olsen. We acknowledge the use of seismic data from the IRIS–USGS Global Seismographic Network, GEOSCOPE, GEOFON, MedNet, and the Greenland Ice Sheet Monitoring Network, retrieved from the archive at the IRIS DMC. We thank S. Bevan and A. Luckman for providing terminus-position data for Helheim Glacier. Comments from two anonymous reviewers and Scientific Editor H. Fricker improved the manuscript.


 Open access