


Introduction
The UK's future relationship with the EU is the single most important risk facing the economy. The formal negotiations to exit the EU started in June and progress so far is slow. The UK was hoping to shift the focus of the discussion to the future trading relationship by now, but the EU has insisted that negotiations cannot do so until issues related to the Irish border, EU citizens' rights and the divorce bill have been settled. These are complex negotiations – the political uncertainty that has characterised the UK over the past four years has only served to widen the range of possible economic outcomes, but more worryingly it also leaves the UK vulnerable. The odds for an early election in the UK stand at more than two thirds according to the average of the three largest betting companies.
The Prime Minister's Florence speech helped clarify the UK's negotiating stance in a number of key areas. The UK will exit from the EU in March 2019, but the PM is looking to negotiate an implementation period of up to two years to allow businesses and government agencies to prepare for the new trading relationship. That new trading relationship however, must be agreed by March 2019 and, given the long lead time required for European Council and parliamentary approvals, substantive completion must be achieved by September next year. It appears that the UK is prepared to make contributions to the EU budget for the two-year transition period. There is, of course, no guarantee of a trade deal and a transition arrangement.
The conditioning assumptions behind our forecasts will evolve as the negotiations progress. For now though, we assume that the UK will succeed in negotiating a two-year implementation period with the EU in line with the Prime Minister's Florence speech, during which the UK remains part of the single market and the customs union and for that access the UK continues to make budgetary contributions at existing levels.

The most important changes to our forecast relate to our view on whole economy productivity and to monetary policy. We now expect a more gradual recovery in whole economy productivity over the next two years compared with our previous forecast. Productivity growth since the financial crisis has been poor not only compared with history, but also relative to other advanced economies. But it is worth reminding ourselves that this period of disappointing productivity growth coincides with the period when the labour market has repeatedly surprised on the upside. Labour participation has risen, as has employment, and unemployment has dropped to record low levels. It is, therefore, entirely possible that high levels of employment have come at the cost of low productivity. In other words, there is a strong case to evaluate the productivity puzzle together with developments in the labour market.
We have revised our forecast for GDP growth lower. We expect GDP growth to average around 1½ per cent over the next five years, around ¼ percentage point lower than our previous forecast. Embedded within these headline GDP growth forecasts is a trade-led recovery. As before, we see net trade making a substantial contribution to GDP growth over the next three years, as UK exporters benefit from the recovery in the Euro Area and also the 20 per cent depreciation in sterling. Official data and business surveys point to a recovery in export volumes and wider profit margins. Consumer spending strengthens as well, but its contribution to GDP growth is smaller than the historical average.
The Institute has highlighted, e.g. in Chadha (2017), the importance of the narrative of risks around a central forecast. Our model (NiGEM) is able to produce stochastic forecasts from its structural model that account for the extent of these potential risks. This portrayal of risk is achieved by bootstrapping historical forecast errors around the forward path of the variables. The resultant fan charts are displayed in figures 2 and 4. Our central forecast shows that GDP growth will remain broadly flat through to 2018 and CPI will fall within the Bank of England remit with risks tilted to the downside. But we have relatively narrow forecast errors for GDP and broader ones for CPI inflation.
Real GDP growth (per cent per quarter)

GDP growth fan chart (per cent per annum)

We are now also able to undertake a benchmarking exercise where we can compare our structural model-based risk estimates to those produced by Warwick Business School's (WBS) statistical model combination approach (see Box A). WBS combine a collection of state of the art statistical models weighted solely upon the forecasting performance of each individual model. Their distributions broadly coincide with those produced from NiGEM. We highlight particular scenarios related to macroeconomic stories that colour the risks, scenarios and sources of these potential risks. For example, it might be that our GDP bands are tighter because a structural model can allow for policy to respond to shocks and help stabilise the economy. Equally, we might have wider bands for inflation because we do not place such a high weight on recent performance. It is, however, not possible to understand the differences fully until we do more work on the WBS outputs and we shall return to this benchmark in future Reviews.
We introduced a 25 basis point rate increase in February 2018 in our previous forecast, the first in eleven years. Since then, the Bank of England has strongly hinted at an early increase in Bank Rate and the financial markets have accordingly priced that in for November. We go further this time by incorporating a rate increase every six months starting in November, such that the policy rate reaches 2 per cent by mid-2021. CPI inflation is forecast to settle at the 2 per cent target with this higher Bank Rate profile.
Household disposable income remains under pressure, mainly because of weak productivity growth. Household disposable incomes have risen by just 10 per cent in the decade since the financial crisis, compared with 30 per cent in the decade prior to that. The government is under pressure to ease the fiscal consolidation plan by reversing the planned cuts to the welfare budget and to raise the cap on public sector pay. The government is also committed to a rapid increase in the National Living Wage to 60 per cent of the median wage by 2020. According to forecasts by the Low Pay Commission, the National Living Wage will cover more than 3 million, or around 10 per cent of workers, by 2020.Footnote 1 Any material spillover from public sector wages into private sector wages or from those that will directly benefit from a higher minimum wage to others will likely encourage the Bank of England to raise Bank Rate further.
There have been substantial revisions to the national accounts data since our last publication. The most significant of these relates to the household saving rate which was revised higher. These revisions suggest that household finances are in a better state than previously thought and certainly not as precarious. According to the preliminary estimate, GDP growth in the third quarter was estimated at 0.4 per cent, which was in line with our previous forecast as well as our monthly GDP estimates.
Monetary policy
At the time of the August forecast, we recommended that the Monetary Policy Committee reverse one of the three policy measures that the Bank introduced in response to the EU referendum result last year by raising Bank Rate by 25 basis points. The conditions are now appropriate for the Bank of England to go further and embark on a gentle and persistent path to normalisation. Consistent with that view, we assume a 25 basis point increase in Bank Rate every six months, starting this month, such that the policy rate reaches 2 per cent by mid-2021.
The most proximate reason for our recommendation to start the normalisation process is the recent performance of the economy. Economic growth has been stronger than the Bank's August 2016 (post-referendum) forecast and unemployment has been lower. Furthermore, CPI inflation is set to rise above the 3 per cent threshold in the final quarter of this year. In that event the Governor will have to send a letter to the Chancellor to explain the overshoot and also the steps that the MPC is taking to ensure that inflation returns to the target rate of 2 per cent.
The additional rate increases that we have introduced into our latest forecast are primarily in response to a more pessimistic view on whole economy productivity growth (see Supply Conditions section for more details). Our policy rate recommendation is predicated on a steady economic growth path that is broadly consistent with the lower productive capacity of the economy and inflation expectations that are anchored at a level consistent with the target.
There are a number of upside and downside risks to this view. The most important of these relates to the outlook for productivity growth itself. That uncertainty not only reflects the well-known puzzle evident in the productivity data so far, but looking ahead, also the direct impact of Brexit on business investment and therefore the capital stock. The longer-term consequences on total factor productivity of a less open economy should the UK fail to achieve free trade arrangements to replace existing agreements with the EU is also unknown.
Another risk relates to the impact of the rate increases on aggregate demand. If indeed, the MPC raises the policy rate in November, this would be the first increase in Bank Rate since 2007 and, given the length of time, it is fair to assume that a large proportion of UK mortgage holders will not have experienced an increase in the cost of servicing secured debt. The impact of a rate increase might, however, be more gradual than before, because almost 90 per cent of new mortgage loans are secured on fixed rates compared with around 45 per cent in 2008. The forthcoming Budget also presents a near term risk to this profile of monetary policy. Real disposable incomes have been stagnant for more than a decade and against a backdrop of austerity fatigue, there is pressure on the Chancellor to increase spending on welfare, health, investment, housing, education and public sector pay (see section on public finances). Any additional government spending that is unfunded might require the Bank of England to respond with tighter monetary policy.
Forecasting with a benchmark: the Warwick Business School forecasting system
We provide benchmark forecasts to help understand and contextualise the forecasts presented in this Review. The box presents density forecasts for UK GDP annual growth and inflation, and reports the probabilities of a range of output and inflation events occurring, from the Warwick Business School Forecasting System (WBSFS).Footnote 1
To reflect the uncertainties inherent in economic forecasting, and following the practice of NIESR and other forecasters such as the Bank of England and OBR, the WBSFS provides probabilistic forecasts. The WBSFS forecasts are produced by explicitly combining density forecasts from a set of 24, statistically motivated univariate and multivariate econometric models commonly used in the academic literature. The use of combination forecasts or model averaging reflects the view, supported by research (e.g., see Reference Bates and GrangerBates and Granger, 1969; Reference WallisWallis, 2011; Reference Geweke and AmisanoGeweke and Amisano, 2012; Reference Rossi, Elliott and TimmermannRossi, 2013), that because any single model may be mis-specified there may be gains from the use of combination forecasts. An alternate interpretation is that combination forecasts may allow the use of more information for a given forecasting problem. The weights on the different models in the WBSFS are allowed to vary over time to reflect their recent forecasting performance.
Comparisons of the Institute's forecasts with the probabilistic forecasts from the WBSFS may be interpreted as providing an approximate indicator of the importance of expert judgement, which may include views on the underlying structure of the macroeconomy. This is because the WBSFS forecasts are computed by exploiting regularities in past data with the aid of automated time-series models; they do not take an explicit, structural or theoretical view about how the macroeconomy works; and they do not rely on (subjective) expert judgement to the same degree as those presented by the Institute. The forecasts from the WBSFS are not altered once produced; they are deemed ‘simply’ to represent the data's view of what will happen to the macroeconomy in the future.
Figure A1 presents WBSFS's latest (as of 13 October 2017) probabilistic forecasts for real GDP growth and inflation – defined as year-on-year growth rates for 2017Q4 and 2018Q4 – as histograms.
WBSFS forecast probabilities for real GDP growth and inflation, year-on-year 2017Q4 and 2018Q4

To aid visualisation, output growth forecast outcomes greater than 1 per cent are coloured grey, red otherwise. For inflation, grey outcomes are defined as inflation within the Bank of England's target range of 1–3 per cent, such that the Governor does not have to write a letter of explanation to the Chancellor; forecast outcomes outside the target range are coloured red.
Table A1 extracts from these histogram forecasts the probabilities of specific output growth and inflation events. The events considered are the probability of output growth being less than 0 per cent, 1 per cent and 2 per cent, and of inflation lying outside the 1–3 per cent target range (i.e., the probability of the Bank of England's Governor having to write a letter explaining how and why inflation has breached its target range). Also reported are the individual probabilities of inflation being less than 1 per cent and greater than 3 per cent, to indicate which side of the target range is most likely to be breached.
Inspection of the histograms suggests that the most likely range for year-on-year output growth in 2017Q4 and 2018Q4 is moderate growth of between 1 per cent and 2 per cent. Because we are less uncertain about 2017Q4 than 2018Q4 values, the probability of moderate growth is 50 per cent in 2017Q4 and about 30 per cent in 2018Q4. The downside risks associated with low growth (less than 1 per cent) are approximately the same in both periods – at around 30 per cent. An inflation rate between 3 per cent and 4 per cent is the most likely outcome in 2017Q4, with a 47 per cent probability. But the WBSFS predicts that inflationary pressures dissipate in 2018Q4 with the most likely range falling to 2–3 per cent, with a probability of about 30 per cent of inflation between 1 per cent and 2 per cent. As a result, the probability of inflation falling in the 1–3 per cent target range increases from 41 per cent in 2017Q4 to 60 per cent in 2018Q4.

Notes
1 WBSFS forecasts for UK output growth and inflation have been released every quarter since November 2014. Details of the releases are available at https://www2.warwick.ac.uk/fac/soc/wbs/subjects/emf/forecasting/ and a description of the models in the system and of the indicators employed is available at https://www2.warwick.ac.uk/fac/soc/wbs/subjects/emf/forecasting/summary_of_wbs_forecastng_system.pdf.
Of the various pressures on the Chancellor, arguably the most relevant for monetary policy is the cap on public sector pay. The outlook for wages, after all, is a key upside risk for monetary policy, especially with inflation expected to remain above the target level for the next five quarters.
Survey evidence points to a subdued outlook for wages and that is very much in line with our forecast, but our research shows that an exogenous shock to public sector wages can spill over into the private sector. On our calculations, a 1 percentage point increase in public sector wages raises private sector wage growth by up to 0.1 percentage points in the short term and that in turn could trigger a response from the Bank of England.
The global forecast that underpins the UK outlook is one of gentle economic growth across a broad range of countries and regions and subdued inflation. The global economy is set to expand by 3½ per cent in the medium term, which is lower than the average rate of growth in the ten years to 2008, but in spite of that we see the overall risks to that outlook to be tilted to the downside. A change to that view and especially to the performance of the EU presents an important risk to UK monetary policy prospects.
Since the publication of our August forecast, the MPC has hinted at an early increase in Bank Rate. The September MPC meeting minutes specifically state that, “A majority of MPC members judge that, if the economy continues to follow a path consistent with the prospect of a continued erosion of slack and a gradual rise in underlying inflationary pressure then, with the further lessening in the trade-off that this would imply, some withdrawal of monetary stimulus is likely to be appropriate over the coming months in order to return inflation sustainably to target”. Thereafter, Bank of England Governor Carney reiterated that view, citing the negative impact of Brexit on productivity prospects. At a lecture at the IMF he said, “some withdrawal of monetary stimulus is likely to be appropriate over the coming months in order to return inflation sustainably to target”.Footnote 2 The financial markets have interpreted that guidance as a 25 basis points rate increase in November.
The Bank of England record on forward guidance has been challenged by a number of economists.Footnote 3 The committee's communication record will be exposed to criticism again should the MPC hold monetary policy unchanged in the coming months in spite of recent strong guidance for a rate increase, unless, of course, events or data emerge that significantly alter the economic outlook.
The MPC has stated that it will continue to reinvest the proceeds from maturing bonds bought under its Asset Purchase Facility until the policy rate reaches 2 per cent. On our forecast, this occurs in mid-2021, at which point we would expect the Bank's balance sheet to shrink as bonds mature and are not reinvested, rather than selling back to the market.
Prices and earnings
The annual rate of CPI inflation increased to 3 per cent in September from 2.6 per cent in June, marking the eighth consecutive month that inflation has exceeded the Bank of England's 2 per cent target. As can be seen in figure 3, inflation is at its highest level since 2012. We expect inflation to peak at a little over 3 per cent in the fourth quarter, triggering an open letter from the Governor of the Bank of England to the Chancellor of the Exchequer. Beyond this year, our forecast suggests that inflation will remain above the Bank of England's target.
CPI inflation rate fan chart (per cent per annum)

Unemployment rate fan chart (per cent of labour force)

Bank policy rates

At the micro level, the price of every division of the consumption basket increased in September. The fastest was alcoholic beverages and tobacco at 4.3 per cent per year, while the slowest was miscellaneous goods and services at 1.4 per cent. The widespread increase in prices across the full spectrum of the consumption basket suggests that inflation is being driven by broad macroeconomic factors, as opposed to idiosyncratic shocks to the prices of specific goods and services.
There are multiple factors that have contributed to above-target inflation. The first factor is the pass-through from higher import prices to consumer prices following the depreciation of sterling after the referendum in June 2016. Over the following months, sterling depreciated by 16 per cent on a trade-weighted basis. The rising cost of imported inputs must either be absorbed by firms' markups or passed on to consumers as higher prices. Indeed, input prices paid by producers increased by 8.4 per cent in September compared to the previous year, while output prices at the factory gate rose by 3.3 per cent.
A second factor is that slack in the economy has continued to decline. In some models of inflation, a fall in slack leads to a rise in inflation. The latest figures show that unemployment has fallen to 4.3 per cent, which is the lowest level since 1975. Similarly, figure 17 shows that our measure of underemployment has declined to near pre-crisis levels.
A third is the continued increase in unit labour costs calculated as the ratio of compensation per labour input over labour productivity. Unit labour costs, which are closely linked to firms' marginal costs and thus to inflation, declined in 2014, but have been rising each year since. We forecast unit labour costs to increase by almost 3 per cent in 2017.
A fourth and related factor is the elevated level of inflation expectations. Current expectations of future inflation can affect actual inflation today through the behaviour of households and firms in setting wages and prices. The latest Bank of England Inflation Attitudes Survey shows that median household inflation expectations are 2.8 per cent for the next twelve months and 3.4 per cent at the five-year horizon. Similarly, the Bank's survey of other forecasters also indicates that expectations are currently above target until the third quarter of 2020.
There are a number of risks to our inflation forecast. First, as discussed above, the exchange rate has been an important influence on inflation. If there were to be another significant revaluation of sterling, this would affect the inflation outlook. Second, should the Autumn Budget contain any alteration to the rate of VAT, this too would have implications for prices. Third, the public sector pay cap is currently an important political issue. As we highlight in Box B, should the cap be lifted, this may lead to spillovers into the private sector, which would affect marginal costs.
The latest figures for nominal regular pay (excluding bonuses and arrears) suggest that earnings increased by 2.2 per cent in August relative to the previous year. However, the ONS' preferred deflator, the Consumer Prices Index including owner occupiers' housing costs (CPIH), increased by 2.7 per cent in August. This implies that real wages fell by 0.5 per cent, marking the seventh consecutive month in which real wages have fallen. The stagnation of real wages is connected to the UK's well-known ‘productivity puzzle’. In light of recent data outturns we have revised our productivity growth forecast down, implying lower real wage growth. We expect real wages to fall slightly this year and next with a slow recovery over the remaining forecast horizon. Adjustments to the public sector pay cap or the National Living Wage pose upside risks to this forecast.
Components of demand
The UK economy continues rebalancing from domestic demand to net trade, but output growth remains relatively weak. In the third quarter of 2017, GDP grew by 0.4 per cent according to the ONS's preliminary estimate. This is in line with our nowcast, published at the start of October, and only somewhat faster than during the first two quarters.
We have revised down our forecast for GDP growth. The main reason for the downward revision this year is back data revisions by the ONS. Looking ahead, GDP growth of 1½ to 2 per cent is around ¼ percentage point lower in 2018 and 2019 compared to our August forecast, mainly because of our more cautious view on productivity growth. Accordingly, we have nudged down our forecast for household disposable income growth and consumer spending. Our forecasts are also conditioned on a higher path for the policy rate.
Lifting the cap? The importance of interactions between public and private sector wage growth in the UK
Political pressure is mounting to lift the cap on public sector pay. Since pay restraints were introduced in 2010, real personal disposable income has been squeezed and the gap between public and private sector wage growth has widened. A key question is what the effects of a public pay increase will be on the wider economy, in particular on inflation and monetary policy. To gauge these effects, it is crucial to understand the interactions between public and private sector wages. An ongoing research project at NIESR analyses this feedback mechanism in more detail.
In our last Review, we discussed the details of wage determination in the public sector relative to private sector bargaining. Pay rises will benefit workers in the public sector, where average rates of pay have fallen in real (RPI-deflated) terms by 10 per cent since 2009. Higher pay will also help alleviate hiring difficulties that have developed in some parts of the public sector. On the other hand, even a small increase in public sector pay has the potential to put substantial pressure on the government's fiscal position (Reference CribbCribb, 2017). If lifting the public sector pay cap had sizeable spillover effects on private sector wages, it could revive currently anaemic wage dynamics but would add to inflationary pressure in the current low-productivity, low-unemployment environment. The monetary response would be stronger than if spillovers were absent.
We analyse which sector acts as the wage leader in the UK and whether an exogenous shock to public sector wages has the potential to spill over into the private sector. We reach two conclusions:
1. In the long term (around five years), the level of wages in the UK economy as a whole is determined in the private sector, reflecting productivity growth and changes to the international terms of trade.
2. In the short term however (within one year), changes to public sector pay have a statistically significant effect on private sector earnings.
Following the literature (Reference Lindquist and VilhelmssonLindquist and Vilhelmsson, 2006; Reference Lamo, Pérez and SchuknechtLamo et al., 2012), we estimate the determinants of wage growth in both sectors and test for convergence to an equilibrium defined by the relative wage level (error correction) and spillovers in the short run from one sector to the other (Granger causality). Using non-seasonally adjusted data at monthly frequency allows us to estimate spillovers directly for different months of the year.
Figure B1 depicts the deviation of the level of public sector wages from an equilibrium defined by private sector wages and a constant wedge, which captures differences in the skills composition across sectors. It shows that, after the financial crisis, public sector wages rose above the historically defined equilibrium as private sector wage growth fell sharply during the recession. After 2014, however, public sector wage growth increasingly fell behind that of the rest of the economy. As of 2017, we estimate the deviation from equilibrium to be more than 3 per cent in absolute terms – higher than what has been observed over the past fifteen years. This implies that if pay restraints were lifted and public sector wages were allowed to be determined by the dynamics of the economy, substantial catch-up would take place.
Deviation of public sector wages from the long-run equilibrium

Figure B2 provides estimates for spillover effects from the public to the private sector. On average, we estimate that an increase in annual public sector wage growth of 1 percentage point translates into monthly private sector wage growth of between 0.03 and 0.12 per cent during the following month. This is a sizeable effect given that only 17 per cent of all employees are employed in the public sector. Figure A2 also shows that the timing of spillovers varies significantly over the course of the year, with the largest effects being estimated for January, when wages are typically being re-negotiated in parts of the private sector. It also illustrates that results depend on whether bonus payments, which drive large variations in earnings in the private sector, are taken into account.
Short-run spillovers from public sector wages to the private sector

What are the implications for our forecasts? Taking both results together, we find that public sector wages may have to increase by around 3 per cent more than private sector wages if the historical equilibrium relationship is to be restored. In the long term, the equilibrium level of wages in both sectors will depend crucially on productivity and the global price level. However, if pay restraints on public sector wages were to be lifted completely, we would expect additional spillover effects on wages in the private sector. This would revive wage dynamics in the whole economy. If wage increases were not accompanied by productivity growth, we would expect inflationary pressure to build up. With headline inflation above target, the Bank of England is monitoring wage dynamics closely, for which, as we show, interactions between public and private sector wage growth are of high importance.
Given that our analysis is based on the historical relationship between aggregate wages, a number of caveats need to be highlighted. Spillovers may vary strongly across sub-sectors of both the private and public sector, and aggregate results may be underestimated. In an extended analysis we will study wage interactions at the micro level. In addition, our sample stretches from 1990 to 2017 and therefore only captures a period of moderate wage growth. Furthermore, the historical relationship between both sectors may have changed more fundamentally after the financial crisis and during the period in which public pay was frozen or constrained, which could lead to an overestimation of spillover effects and the deviation of public sector wages from equilibrium.
This box was prepared by Arno Hantzsche.Figure 6 illustrates that while domestic demand, in particular consumption and investment, is being squeezed, economic growth is more dependent on the trade sector. UK exporters continue to benefit from the currency depreciation and also from improved growth prospects in the Euro Area which remains the UK's largest trading partner.
Contributions to GDP growth

While real consumer expenditure has made the largest positive contribution to growth between 2012 and 2016, we expect this contribution to halve this year, and again next year. After growth of 2.8 per cent in 2016, we forecast real consumer expenditure growth to drop to 1½ per cent in 2017 and to be around 1 per cent per year in 2018–23. The softening of household spending can to some extent be attributed to a decline in transport expenditure, after car purchases were brought forward before the Vehicle Excise Duty came into force in April. However, most of the weakening in consumer expenditure is due to the squeeze in real disposable incomes associated with inflation above the Bank of England's target, weak productivity and low wage growth. An upside risk to our consumer expenditure forecast is the potential rise in household income due to higher public sector earnings, which may spill over to the rest of the economy, as discussed in Box B.
Gross fixed capital formation (GFCF) increased by 2.4 per cent in the second quarter of 2017 relative to the same quarter one year earlier. Since the third quarter of 2016, GFCF growth has been positive in each quarter, averaging 3.3 per cent year-on-year. This increase has been largely driven by business investment. As can be seen in figure 7, indicators of investment intentions are positive. However, according to the Bank of England's Decision Maker Panel, uncertainty poses a risk, particularly Brexit-related uncertainty. On balance, we expect business investment growth of about 2 per cent a year over the forecast horizon.
Business investment growth and investment surveys

Export volume growth and export surveys

Our Brexit assumptions
The UK's future relationship with the EU is potentially the single most important risk facing the economy. The UK will leave the EU in March 2019 and an exit plan will need to be approved by the European Council, the British parliament as well as other sovereign parliaments across the EU to avoid a cliff edge scenario where existing trading relationships break down. That parliamentary process is likely to take at least six months and therefore, the bulk of the negotiations will have to be completed by September 2018.
The formal process for negotiating the exit from the EU started on 19 June. Since our last forecast, the UK's position has changed. Prime Minister May has asked the EU to consider an implementation period of up to two years after March 2019 to help businesses and government agencies to smooth the transition to exit. The UK is prepared to make a financial contribution in return.
More fundamentally, the Prime Minister also made clear that she is looking for a trade relationship that is bespoke for the UK, one that is as deep and broad as the European Economic Area, but without the requirement automatically to adopt EU rules. The Free Trade Agreement with Canada does not require automatic adoption of EU rules, but the trade relationship is not as deep as the EEA.
There is no guarantee that the Prime Minister's request for a two-year implementation period will be acceptable to the EU, let alone a bespoke subsequent trading relationship. Against a backdrop of such uncertainty, our overarching assumption in this forecast is that the UK will be granted a two-year implementation period, during which it will remain part of the single market and customs union. That period will end in the first quarter of 2021. Although an abrupt end to the trading relationship after 2021 is possible, that is not our central case. We instead build into our forecast a gradual increase in uncertainty that primarily bears down on trade and investment spending. This implies the following for our forecast:
UK exports: will face two countervailing forces. The 20 per cent depreciation of sterling since mid-2015 has made UK exporters more competitive and consistent with that survey data points to a strengthening in export volumes. Exporters' profit margins have also expanded. On the negative side, the uncertainties around a future trading relationship will likely bear down on trade volumes to the EU. This could reflect potential disruptions to existing supply chain arrangements in manufacturing, non-tariff barriers linked to the services sector, including financial services and a prolonged period of uncertainty until the UK establishes a new trading relationship with non-EU regions and countries. We have applied a negative residual to the export and import volume equations but, overall, our forecast continues to point to a rebalancing of the economy in the short term towards trade and away from domestic demand.
Business investment: We expect business investment to grow by just over 2 per cent on average over the next five years. In spite of that, the risks to our business investment forecast are tilted to the downside, mainly because we do not explicitly allow for the loss in investment from diminished foreign direct investment (FDI). To place the risks in perspective, Reference Ebell and WarrenEbell and Warren (2016)Footnote 1 had assumed a 24 per cent reduction in their Brexit scenario and that corresponded to a 3.5 per cent reduction in private sector investment.
Productivity: Lower trade volumes and investment spending are almost certain to drive productivity lower. Although the impact can be large, we have not explicitly introduced a Brexit related productivity shock into our forecast. The downward revision to the productivity outlook in this forecast is primarily driven by the revised ONS historical data and a judgement to place greater weight on recent performance. Reference Ebell and WarrenEbell and Warren (2016) estimate that a permanent 5 per cent fall in labour productivity in NIGEM causes GDP to fall by 5.1 per cent relative the baseline scenario. Other studies suggest that a 20 per cent reduction in trade tends to reduce productivity by 5 per cent in the long run.Footnote 2
Fiscal: The Prime Minister said that the UK is prepared to continue making contributions to the EU budget over the transition period. The size of that contribution is subject to agreement as is any bullet payment that might be required as a settlement for future commitments. We assume in our forecast that existing financial arrangements related to budgetary contributions will continue until the end of the two-year transition period at a level that is broadly in line with the 2019 contribution. That extended contribution has been modelled as an increase in budgetary payments and receipts and an increase in balance of payments transfers to reflect the difference between payments and receipts. Those contributions come to an end after the transition period in the first quarter of 2021 and consistent with that the balance of payments position improves. We also assume that the extra budgetary space is spent by the government in line with Reference Ebell and WarrenEbell and Warren (2016).
Migration: Our forecast explicitly excludes the impact of reduced net migration that will most likely result from the UK exiting the EU. Our standard practice is to incorporate population data and projections from the ONS. The new forecasts will be introduced in the next forecast. The risks to economic growth from lower migration are again tilted to the downside.
Notes
1 Ebell, M. and Warren, J (2016), ‘Modelling the long-run economic impact of leaving the European Union’, Economic Modelling, 59, pp. 196–209.
2 Feyrer, J. (2009), ‘Trade and income – exploiting time series in geography’, NBER Working Paper No. 14910.
Real government consumption has made a positive contribution to growth since 2012 and we expect contributions of 0.1–0.2 percentage points to GDP growth in each of the next four years. We base the forecast on the OBR's projections for the government's spending envelope, which were last published alongside the Spring Budget this year. Any changes that may be announced in November's Autumn Budget constitute a risk to our government consumption projections.
Net trade is likely to make a positive contribution to GDP growth in 2017 for the first time since 2011. We expect a contribution of net trade of around half a percentage point, which increases to just below 1 percentage point in 2018. We attribute most of this development to growth in export volumes, which, in turn, is driven by the depreciation of sterling and improved growth prospects in the Euro Area (figure A3).
An important channel through which movements in the effective exchange rate affect the volume of exports are export prices (see also Box C). Exporters face a trade-off between an adjustment of their market share through the prices of exports or, by keeping export prices rigid, a change in margins. Figure 9 shows that following large movements in the effective sterling exchange rate, export prices relative to those of the UK's competitors tend not to adjust one-to-one. This holds both for appreciations of sterling, as in 1997 when exporters saw their margins squeezed because export prices did not adjust upwards, as well as during depreciations, such as during the financial crisis and following the announcement of the Brexit referendum, when export margins expanded. Export price rigidity varies across industries and export prices tend to react less to the exchange rate than import prices. Additionally, firms producing higher quality goods, high productivity exporters and firms that are less financially constrained tend to adjust prices by less in response to exchange rate movements. We would expect a stronger rebalancing of the economy if aggregate export prices were more flexible.
Export price rigidity

The flipside to the gain in export price competitiveness is the rise in import prices, which not only contributed to the rise in inflation but also led to a slowdown in import volume growth. We expect import volumes to grow by 1–2 per cent in 2017 and 2018, down from above 4 per cent in 2016, further increasing the contribution of net trade to output growth in 2017.
Household sector
Real personal disposable income (real income henceforth) remains under pressure. The latest official data for the second quarter shows that real income has fallen compared with a year ago.
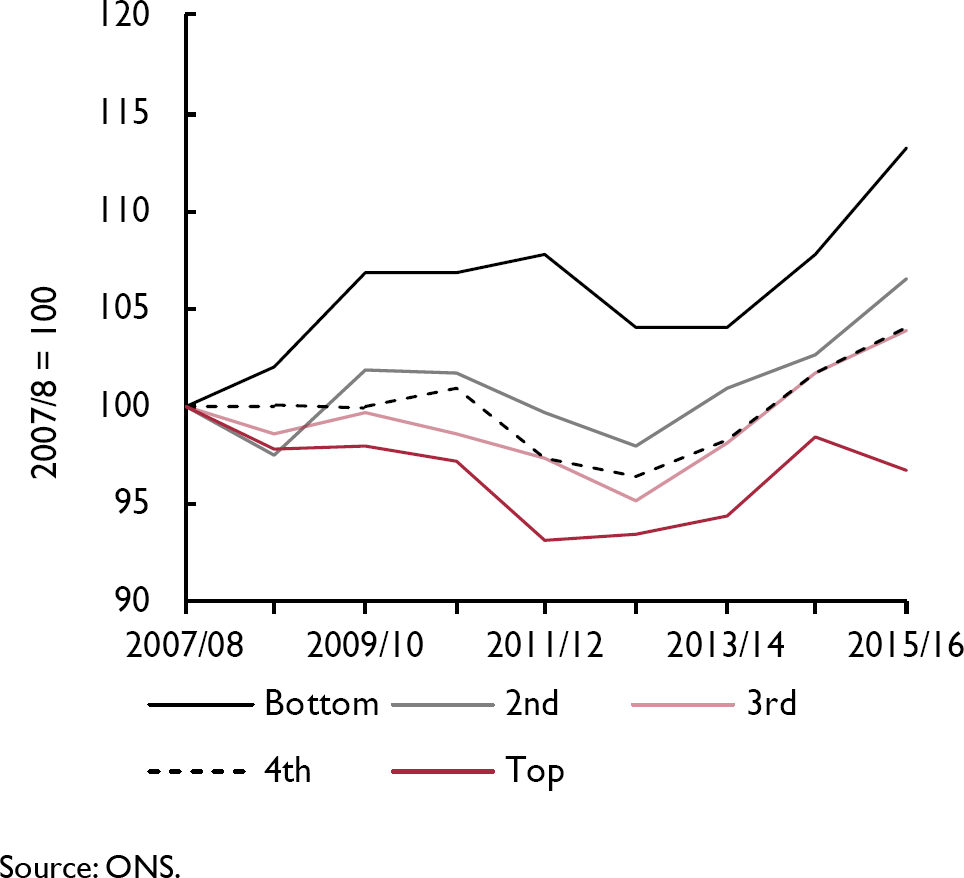
Real income is some 10 per cent higher today compared with the 2007 level. This growth rate is low compared with the decade until the start of the global financial crisis when real income increased by 30 per cent. Although disposable income growth overall has been lacklustre, official data on household income and inequality from the ONS shows that the poorest quintile of households have seen a bigger increase in disposable income since 2008 (figure 10). Inequality, as measured by the Gini coefficient, has, as a result, eased over this period.
Growth in median equivalised household disposable income by quintile
House price to earnings ratio

Regardless, there is political pressure on the government to do more for public sector employees as well as workers at the lower end of the income distribution. There has been a 1 per cent cap on public sector wage growth since 2010, resulting in a large gap between private and public sector pay growth. The government has not as yet officially lifted the cap, but it has allowed ministers some flexibility on the 1 per cent cap. Although just one in six employees work for the public sector and as such a small increase in public sector wages may not be of material consequence to the broader economy, there is a risk that an increase in public sector wages will have echo effects into the private sector. These spillovers could be significant if the gap between public and private sector wages starts to close in a short period of time. Box B discusses the relationship between public and private sector pay.
The National Living Wage was introduced in April 2016 at a rate of £7.20 per hour for workers aged 25 and over and increased to £7.50 as of 1 April 2017. In the coming months, the Low Pay Commission will be issuing its annual recommendation. However, the government has previously announced that the target for the National Living Wage is to reach 60 per cent of median wages by 2020. The number of workers covered by the minimum wage has already increased substantially to around 1 million workers in 2015, and the National Living Wage is forecast by the Low Pay Commission to cover more than 3 million workers by 2020.Footnote 4
That is the direct impact of raising the minimum wage, but there is every chance of a spillover into the wage rates of those just above that minimum wage threshold. Work by Butcher et al. (2012)Footnote 5 establishes that under the old lower National Minimum Wage rates, minimum wage increases might spillover up to the 25th percentile of the wage distribution. As the share of workers on the National Living Wage has already increased, and is expected to rise further, however, the reach of those spillovers might also extend further up the wage distribution.
Looking ahead, we expect a modest recovery in household income next year as inflationary pressures start to ease. On our forecast, real income growth recovers from current levels but remains below 2 per cent. The most proximate reason for the subdued outlook is productivity which has been revised lower in this forecast.
House prices in the UK rose by 5.0 per cent in the year to August on the ONS House Price Index measure. House price inflation according to this measure peaked at just over 9 per cent in 2014 and has steadily eased since June last year. The Halifax and Nationwide house price indices, which measure prices at the mortgage approval stage and act as leading indicators, show a similar pattern.
These aggregate numbers, however, mask notable geographical divergences. Prices have increased by more than 6 per cent over the past year in the North West, East Midlands, the East and the South West, whereas prices in London have increased by just over 2 per cent according to official data. We expect house price inflation to fall further in the coming months because of higher borrowing costs.
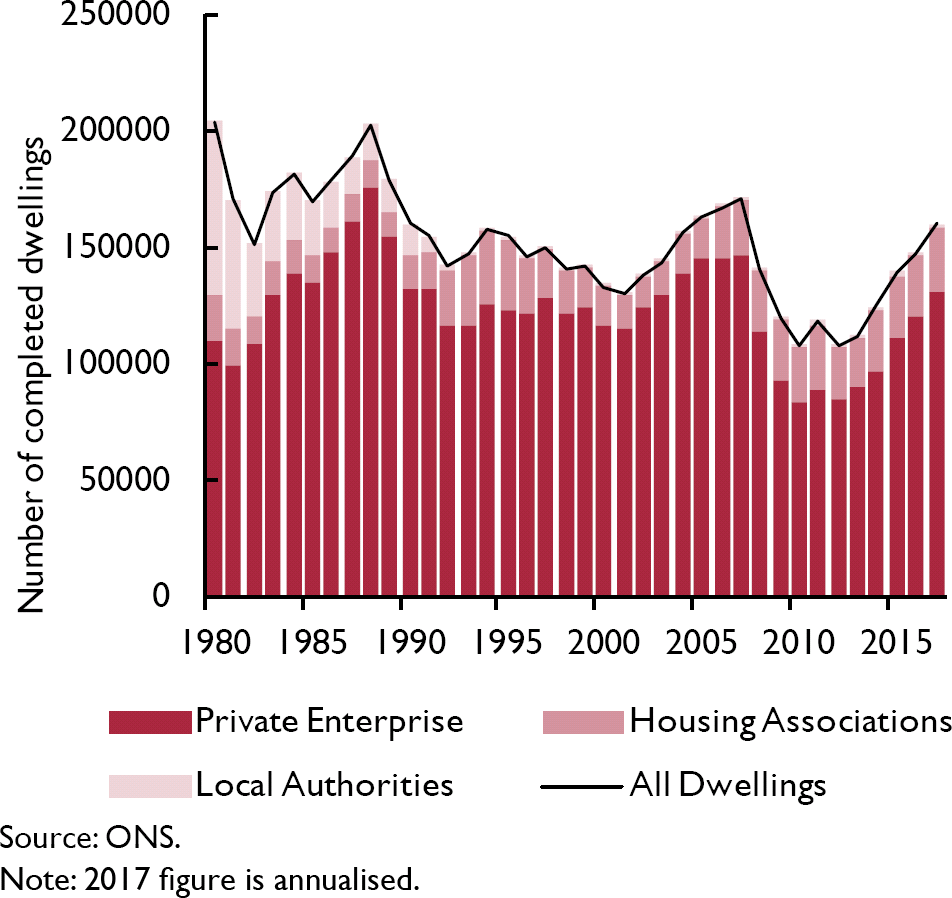
House building picked up in 2017. Completions in England have averaged 40,000 in the first two quarters of this year, compared with 35,000 last year. Although higher, completions are below the average levels achieved in the 1980s even though the population has grown since then. This is mainly because local authorities have stopped building homes. Figure 12 shows the contribution from various segments of the market. It is clear from the figure that the gap created by the local authority sector has not been filled by private enterprise.
Permanent houses completed in England (per year)
Household saving rates and debt to income ratio

The household saving ratio increased to 5.4 per cent in the second quarter of 2017 from 3.8 per cent in the previous quarter. The saving ratio data has been revised substantially by the ONS since the publication of our August forecast. In the previous vintage of data, the saving ratio averaged 5.0 per cent in 2016, whereas in the latest release the saving ratio has averaged 7.1 per cent. The most noteworthy revision, however, was to the first quarter, which was revised up from 1.7 per cent to 4 per cent.
The ONS had previously assumed that dividend income received by households was a fixed proportion of its income. The ONS no longer makes that assumption and instead uses data and forecasts from HMRC. The change in methodology has helped capture dividend income better, particularly because households appear to be earning a higher portion of their income through dividends. That change has emerged recently as a consequence of a shift in employment contracts. Individuals increasingly offer their services to employers through single-director companies instead of employment contracts. The employee pays the company for services that are provided by the single director and the single director pays themself a dividend income instead of a salary. The ONS estimate of household disposable income has increased as a result of this change and that in turn has raised the saving ratio.
Although the saving ratio has been revised higher, UK households continue to save less than the rest of Europe. The average saving ratio in the EU was 12.6 per cent in 2016, compared with 7 per cent in the UK. Household debt in the UK also remains elevated at 130 per cent of income. While lower than the pre-crisis peak of just under 150 per cent, it remains high by historical standards and, as a result, UK households are vulnerable to negative shocks. Bunn and Rustom (2016) show that highly indebted households reduced consumption spending more aggressively than others in response to adverse economic shocks.
Supply conditions
Whole economy output per hour declined slightly in the second quarter of 2017. Productivity according to this measure briefly surpassed its pre-recession peak in the final quarter of 2016 before dropping back below it in the following quarter. Output per hour in the services sector has performed better, exceeding the pre-recession peak by 1.4 per cent, while output per hour in production remains 3.3 per cent below its comparable peak.
Recent data outturns and ONS national accounts data revisions have prompted us to revise down our forecast for productivity growth. We now assume weaker growth of output per hour throughout our forecast period (figure 14). This is associated with stronger growth in employment and hours worked per employee per quarter. The more robust employment profile is the result of an upwardly revised participation rate forecast in light of strong recent data outturns, while our population projections remain unchanged. We have not made any additional assumptions about productivity related to the UK leaving the EU.
Revisions to our productivity forecast

What does the data say about the trend of rate of Total Factor Productivity (TFP) growth?
Robert Solow's 1957 insight that long-run growth of real output is ultimately driven via technological change was seminal. This insight initiated the growth accounting literature. Here one aims to measure technological change via the decomposition of growth into parts that can be attributed to observable factors, such as capital and labour, and apportioning the residual – often called the Solow residual or Total Factor Productivity – to technological progress.
To help frame our thinking on productivity within the UK we conduct a two part exercise. First, we recover TFP from a standard growth accounting exercise. Secondly, in order to smooth the variation in underlying TFP from quarter to quarter, we model it as a noisy unobserved series. That is, we fit an unobserved component model in order to learn about the underlying state of TFP via a Kalman filter. This filter provides a method for estimating the unobserved state based upon noisy measurements in a recursive fashion, which updates period by period for previous forecast errors. In our case, we choose to model TFP as a random walk with first order autoregressive measurement error.Footnote 1
We first recover TFP from a standard growth accounting exercise. From real gross value-added output we subtract our estimated share of real gross capital stock and the total number of hours worked. We are then left with a shift factor in the production function that captures technical progress and productive efficiency. That is, if we totally differentiate the production function with respect to time, and assume perfect competition in factor markets and a homothetic production function, the growth rate of output can be decomposed into the sum of the growth rates of each input, weighted by their relative factor share plus the growth in TFP.
Data is taken from the Institute's database from 1972Q2 until 2015Q4 for which we have a full panel. The capital share of labour is estimated over this time to take a value of 0.32. We compare these raw results with those obtained by the Bank of England's three millennia project (TFPGUKA is taken from http://www.bankofengland.co.uk/research/Pages/datasets/default.aspx#threecenturies database) and find that they broadly coincide for the period studied. Note, we have quarterly data and hence it is more volatile than the BoE series which is annual.
Raw calculated TFP vs BoE millenia TFP

Secondly, to smooth the volatile underlying TFP series we fit a random walk unobserved component model – often referred to as a local linear model – with first order autoregressive errors in the measurement equation. The one step ahead forecast is the optimal recursive forecast at each point in time using only the data up until that point in time whilst the ‘smoothed’ is the optimal estimate of the underlying state using all available data, see Harvey (1989) for further details.
Smoothing the underlying TFP process indicates that TFP growth has slowed over the decades since the 1970s. The bar chart below makes this difference easier to discern, showing that average TFP growth has slowed from just under 2 per cent per annum in the 1970s to around 1 per cent in the 2010s. If we take the end of sample smoothed estimate and average across 2015, the last year for which we have a full dataset, average TFP growth measures approximately 1 per cent – significantly below the decennial averages before.
Average TFP growth

However, a large caveat is in order when interpreting raw TFP measured in this manner. Solow's original article acknowledged the need to adjust capital for “the fact of idle capacity” hinting at non-technological factors that affect measured TFP. For example, Reference Basu, Fernald and KimballBasu, Fernald, and Kimball (2006) show that unmeasured fluctuations in factor utilisation, effects of non-constant returns to scale or imperfect competition all affect measured TFP. Recently, work on mis-measurement whether it be intangible assets or quality adjustments not accounted for in deflators help reveal a cleaner measure of underlying productivity. One should thus be careful if interpreting the observed raw TFP slowdown as a reduction in underlying technological productivity.
Note
1 The same model is used for the U.S. in the Review article by Crafts and Mills “Predicting Medium-Term TFP Growth in the United States: Econometrics vs. ‘Techno-Optimism”.
Figure 15 shows the year-on-year growth rates of whole economy gross value added (GVA). Our forecast for GVA growth has been revised down compared to our August Review. While we are expecting GVA growth to pick up from recent average levels, we forecast it to be some way below the average for the pre-crisis period. The observed path for GVA is consistent with the slowdown in total factor productivity growth over the past decade, see Box D for further discussion.
Gross value-added growth

Lack of investment is a key factor behind this weak productivity growth. Figure 16 shows that business investment relative to GDP was lower in the UK compared to other advanced economies even before the crisis, but what is also notable is the very weak growth since the final quarter of 2015. ONS data have been revised to show business investment declining by 0.4 per cent in 2016, an upward revision of 1.1 percentage points. Combined with modest growth in the first half of 2017, we have accordingly revised upward our forecast for business investment for 2017 to a growth rate of 2.3 per cent, from a contraction of 0.8 per cent in our August Review. This remains relatively weak considering the persistently weak investment in recent history and the fact that the economy is in recovery.
Business investment

The CBI Investment Intentions Survey lists the main factors limiting investment as uncertainty over future demand and low net return, cited by 47 and 46 per cent of firms respectively. These factors have historically been cited by a large number of firms and these figures do not represent a departure from normality. Cost and availability of finance were each cited by just 2 per cent of firms, a slight decrease compared to the average over the past few years. More interesting is the increase in the past year in the number of firms citing labour shortages, up to 17 per cent in the third quarter compared to an average of just under 8 per cent since 2000. The Bank of England's Agents' Summary of Business Conditions also indicates that recruitment difficulties have increased this year.
The unemployment rate of those aged 16 and over has edged down further, reaching 4.3 per cent in the three months to August, its lowest level since 1975. Economic activity of those aged 16 to 64 reached a record high of 78.8 per cent in the three months to July, before falling slightly to 78.6 in the three months to August. We expect unemployment to fall further, averaging 4.4 per cent this year and next.
An alternative measure of labour market slack is the underemployment rate. Our index of underemployment, constructed according to the methodology of Reference Bell and BlanchflowerBell and Blanchflower (2013), has also fallen (figure 17).
Unemployment and underemployment (16+)
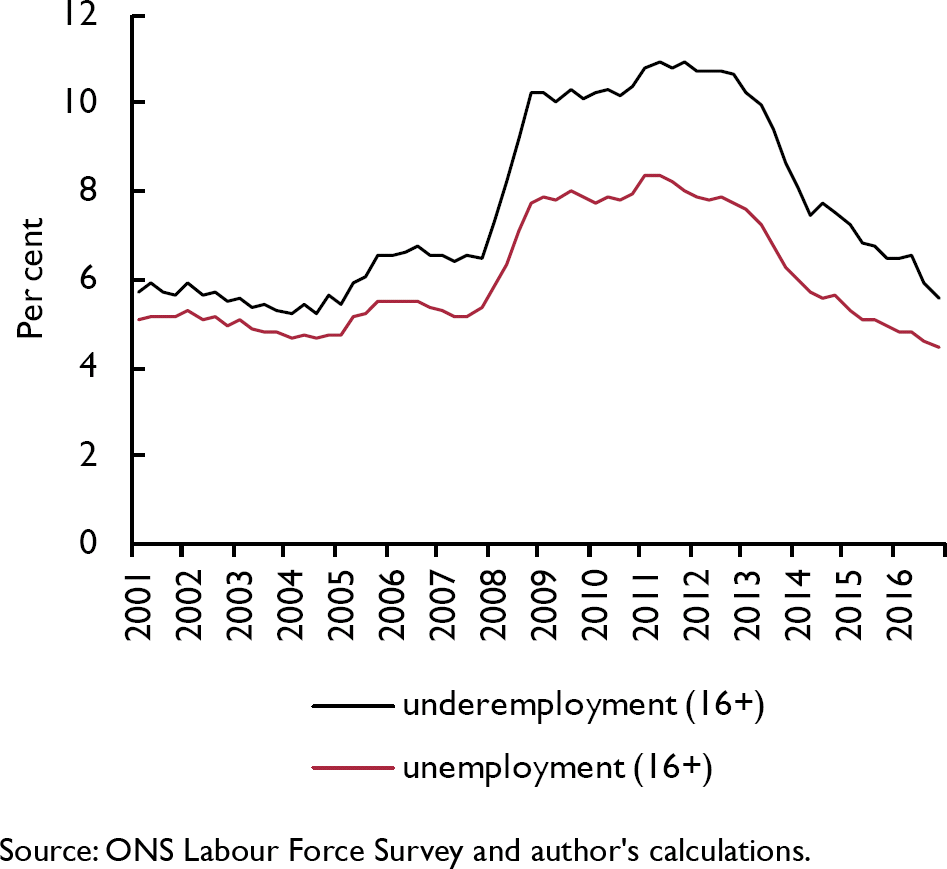
This measures the number of surplus hours available by summing the expected number of hours that the unemployed would work if they found employment and the difference between preferred hours and actual hours worked by the employed. These surplus hours are then expressed as a percentage of total hours available. Both unemployment and underemployment have fallen considerably since 2013. While unemployment, at 4.4 per cent in the second quarter of 2017, is some way below its post-2001 trough of 4.7 per cent, underemployment, at 5.5 per cent in the second quarter of 2017, remains above its nadir of 5.2 per cent since the start of our series in 2001. This indicates that there may be greater slack in the labour market than implied by the very low unemployment figures.
If there is additional slack, it may be a contributing factor in the surprising lack of upward wage pressure, given the apparent tightness in the labour market. Data for August show a decline of 0.5 per cent in real average weekly earnings, both including and excluding bonuses, compared to the same month one year earlier. This was the seventh consecutive month in which real earnings declined year-on-year. Another candidate explanation is that newly created jobs are disproportionately insecure forms of employment, including zero hours contracts and self-employment in the ‘gig economy’, in which workers have lower bargaining power. Furthermore, labour productivity, which is the ultimate driver of real wage growth, has been impaired by capital shallowing as firms have substituted relatively cheap labour for capital, perpetuating the cycle.
Net migration in the year to March 2017 was 246 thousand, a reduction of 81 thousand compared to the previous year (figure 18). This can be attributed to an increase in emigration by EU citizens and an overall decrease in immigration. These figures indicate that the result of the EU referendum may have influenced people's relocation decisions. Since the majority of EU nationals who relocate to the UK do so to take up a job offer or to look for work, this decline in EU net migration raises concerns, particularly in the context of labour shortages discussed above. We assume that the population grows in line with the ONS's principal projection. Further reductions in net migration present a downside risk to our employment and output forecasts.
Net migration by country of origin

Public finances
On 22 November, the Chancellor will deliver the first Autumn Budget which replaces the Autumn Statement and in the future will be the only fiscal event at which major tax changes will be announced. While fiscal outturns to date have been a little better than projections by the Office for Budget Responsibility (OBR), the upcoming budget will have to address a number of risks.
The OBR's projections serve as the background against which the budget is announced. In its last Economic and Fiscal Outlook from spring 2017, the OBR predicted annual growth of real GDP to reach 2 per cent in 2017, which it will likely have to revise down in its autumn publication. However, nominal GDP, which is the more relevant measure for fiscal data as tax receipts and spending tend to move with inflation, will likely see an upward revision given stronger-than-expected inflation outturns, which offset the decline in real output growth. Public sector net borrowing between March and September accumulated to £32.5 billion, 7.2 per cent below the level accumulated over the same period last year. The OBR's forecast for the whole fiscal year lies at £58.3 billion, which is £12.6 billion higher than the current outturn estimate for the financial year ending in March 2017 and corresponds to 2.9 per cent of GDP. Net debt as a percentage of GDP in September stood at 87.2 per cent, 1.6 percentage points below the OBR's forecast for the full financial year and 1.6 percentage points above last year's outturn estimate.
Our central forecast
Following our standard practice, our baseline fiscal projections are based on official taxation and spending plans, published in the 2017 Spring Budget. Tax receipts, interest payments and the dynamics of the rest of the economy are endogenously determined within our forecasting model. For the fiscal year 2017–18, we forecast public sector net borrowing to lie just below 3 per cent of GDP, in line with the OBR's projection and slightly lower than expected in the last Review. Looking ahead, we expect the fiscal deficit to decline gradually and, under current plans, see a good chance that the Chancellor's aim to balance the government's budget by the middle of the next decade, clarified at the Mansion House speech of June 2017, is within reach. Similar to the OBR, we expect the net debt-to-GDP ratio to peak in 2017–18 at just under 90 per cent and fall thereafter. However, we see three main risks that may lead us to revise these projections significantly once the Autumn Budget has been published.
Spending risks
We perceive heightened austerity fatigue as a major risk to the fiscal position. The Chancellor faces mounting demands to increase government spending in the Autumn Budget in a number of areas, after commitments made in the previous Spring Budget had been relatively small:
1) As discussed in Box B, there is mounting political pressure to relax pay restraints on public sector workers that were put in place in 2010. Given a wage bill of £179 billion in 2016, lifting the public sector pay cap would substantially increase government expenditure, unless public sector employment were to be drastically reduced.
2) Difficulties with the rollout of Universal Credit, which replaces a number of benefit and tax credit schemes, make the reduction of welfare spending from 10.9 per cent of GDP in the current fiscal year to 10.3 per cent by 2021–22 unlikely.
3) In addition, members of the government have already promised to raise infrastructure investment, ramp up the Help to Buy mortgage guarantee scheme, make changes to student funding, increase spending on Northern Ireland, among other commitments.
We estimate that this may accumulate to a more than £10 billion increase per year of government spending. Given that our baseline fiscal projections are based on the taxation and spending plans from spring 2017, we look at an alternative scenario that considers such a fiscal expansion. As expansionary fiscal measures feed back into the economy through the fiscal multiplier, we use the National Institute's Global Econometric Model (NiGEM) to simulate a shock to government consumption, welfare transfers and government investment of around £10 billion in 2018–19 which gradually increases thereafter. Figure 19 shows that this would increase the public deficit by around half a percentage point relative to GDP and also raise the debt-to-GDP ratio by around 1 percentage point by 2020–21 (figure 20). Compared to the overall risks around the fiscal position, implied by the historical distribution of fiscal shocks (fan charts), the impact, however, is small.
Probability distribution of public sector net borrowing

Productivity risks
The OBR explains in its Forecast Evaluation Report that potential productivity growth had repeatedly been over-estimated after the Great Recession, relative to an average outturn of 0.2 per cent over the past five years. The OBR will lower its estimate of productivity growth in its upcoming projections. The decline in productivity is also discussed in Box D. To illustrate how different assumptions about productivity impact the fiscal forecast, we assume a future path of the growth rate of output per hour that is similar to the one adopted by the OBR in its last projections to produce an alternative, high-productivity scenario. Figures 19 and 20 show that more optimistic assumptions about productivity would lead to a somewhat sharper decline in deficit and debt forecasts. This implies that a downward revision of productivity assumptions by the OBR, similar to those that underlie our baseline forecast, will reduce the fiscal space of the government. However, data outturns for employment and hours worked have been higher than projected by the OBR, which partly offsets overly optimistic productivity assumptions and their effects on fiscal forecasts. Higher employment would benefit public finances as it increases tax revenue and reduces welfare spending.
Probability distribution of public sector net debt

Brexit risks
The OBR acknowledges that Brexit could compound other risks to the fiscal position. In particular, it considers Brexit as a downside risk to productivity, but additional risks may materialise. Our forecasts do not assume a one-off financial transfer to the European Union (divorce bill) as long as no agreement is made. Following the Prime Minister's Florence speech, we now assume that regular contributions to the EU budget are made until the end of an implementation period of two years in the first quarter of 2021, after which we assume an improvement to the balance of payments and increase in government spending of around £7 billion annually, which corresponds to average contributions made to the EU in the past. The government may also have to increase departmental spending to prepare for the implementation of Brexit. Ultimately, the form of trading relationships after Brexit, their implementation and the effect of both on the economy are likely to pose a more substantial downside risk to public finances forecasts than direct contributions to the EU budget (see also Box C).
We recommend that the government therefore uses some of its fiscal space in the Autumn Budget for investments to improve productivity and alleviate some of the potential adverse effects of Brexit on the UK economy.
Saving and investment
Table A9 shows the financial position of the three broad sectors of the economy: private, public and external. The private sector is further split into household and corporate. If investment is greater than saving for a sector, then this sector is a net borrower. The aggregation of these three sectors is the current account balance, which, if in deficit, implies that borrowing from the rest of the world is required in order to fund domestic investment plans. It is not possible to infer the optimality of the levels of capital from the current account but rather just the immediate financing needs of the economy.
Household saving rebounded from a historic low of 2.8 per cent of GDP in the first quarter of 2017 to 4.1 per cent in the second quarter. It followed a period of continuous decline that started in the third quarter of 2015 when household saving was at 7 per cent of GDP. The recent pickup of saving in the second quarter is the result of personal disposable income increasing for the first time since 2015, by 1.9 per cent, while consumption increased by only 0.2 per cent. The whole series was revised up by the ONS as a result of methodological changes; in particular the separation of households and non-profit institutions serving households, and changes in the measurement of dividend income of the self-employed.
We forecast household saving to stay at the current level of about 4 per cent of GDP throughout the remainder of this year. Compared to our August forecast, this is an upward revision from 1.9 to 3.7 per cent of GDP for 2017 that can be mostly accounted for by the methodological changes described above. By 2022, we forecast households to save approximately 6 per cent of GDP, still lower than the long-term average of 7 per cent.
Household investment, since its trough in 2009 of 2.9 per cent of GDP, rose steadily until 2014 when it stabilised at around 4 per cent of GDP and has remained at this level since. We expect household investment to be at 4.2, in both 2017 and 2018, down from 5 per cent in both years from the August Review. From 2019 onwards, we expect household investment to increase in each subsequent year. By 2021, we forecast household investment to be 5 per cent of GDP.
The saving and investment positions of the household sector imply that in 2017 households will require 0.5 per cent of GDP in borrowing from the rest of the economy, the first time the household sector is a net borrower since at least 1987 (figure 21). As household saving picks up, we expect households to return to being net savers in 2018 and by 2022 to lend up to 1 per cent of GDP to the rest of the economy. Risks to our forecast for the household net position centre around household saving. Should consumption expenditures grow at stronger levels than we have envisaged in our forecast, then household saving would be expected to be lower and the amount of lending by households smaller. Conversely, events such as a sharp increase in unemployment, which could lead to an increase in uncertainty surrounding employment prospects could trigger a greater increase in household saving. Higher earnings, triggered by the public sector or from the phasing in of the National Living Wage, could also raise the saving ratio.
Sectoral balances

Corporate saving gradually increased from its nadir of 4.4 per cent of GDP in the last quarter of 2015 to 7.8 per cent in the first quarter of 2017. The second quarter saw a small consolidation at 7.3 per cent. Corporate investment declined since the third quarter of 2016 from 11.3 per cent of GDP to 9.5 per cent in the second quarter of 2017. We forecast corporate investment as a share of GDP to be stable at around 9½ per cent from 2017 to 2022. Following the ONS methodological changes, the whole series of corporate saving was revised down, and the revision for 2016 as a whole was 3.1 per cent of GDP. A direct consequence of this revision is that the corporate sector is now a net borrower, which is what economic theory predicts. We forecast the corporate sector will require 1.7 per cent of GDP of borrowing from the rest of the economy in 2017. In the following years, we forecast the corporate sector to borrow a bit more from the rest of the economy, up to 2½ per cent of GDP in 2020–2, as corporate saving decreases from 7.9 per cent of GDP in 2017 to between 7 and 7½ per cent in 2019–22.
Since government sector dis-saving reached a peak in the third quarter of 2009 of 5.9 per cent of GDP, fiscal consolidation has reduced dis-saving, until it returned to positive saving of 1.5 per cent in the first quarter of 2017. The level of saving in the first quarter was the temporary consequence of an increase in tax receipts emanating from a change in taxes on income and wealth. In the second quarter, government saving retracted to a more modest 0.2 per cent of GDP. We expect the government sector to return to moderate dis-saving in the third quarter which decreases in the fourth quarter and returns to balance at the beginning of 2018. Thereafter, we expect government saving to increase throughout the rest of our forecast period reaching around 2.7 per cent by 2022.
Since 2013, government investment as a percentage of GDP has been around 2.5 per cent. Official projections show that it will remain close to this level in both 2017 and 2018, and slowly increase thereafter, reaching 2.8 per cent of GDP in 2022. This implies that the government will require around 2.1 per cent of GDP of borrowing from the rest of the economy in 2017, falling to 2 per cent in 2018, and continuing to fall thereafter, until it reaches balance in 2022.
In aggregate, this implies that the economy will be a net borrower from the rest of the world of about 4.3 per cent of GDP in 2017 and 3.2 per cent in 2018, reducing throughout the rest of the forecast period. By 2022, we forecast the UK still to be a net borrower, requiring 1.6 per cent of GDP of finance from the rest of the world.
The ONS revised significantly its estimates of the primary account balance and the international investment position following some methodological changes explained in their Pink Book 2017. The primary income deficit for 2016, which was initially estimated at £23 billion, was revised up at £50 billion mainly because of some changes in corporate bonds interest computations. As a consequence, the current account balance, which aggregates the balances from trade, primary and secondary accounts was also revised from a deficit of £85 billion to one of £115 billion in 2016.
Turning from flows to stocks, the Net International Investment Position NIIP) was also revised down. A change in the computation of bond and share holdings by foreign agents led to ownership of more UK assets being assigned to the rest of the world. Whereas the NIIP was previously estimated to have reached a record surplus of £469 billion in 2016, it was revised to a small deficit of £21 billion, which is in essence very close to a balanced position. Although the NIIP has been revised lower, on the latest vintage of data, the NIIP has in fact improved since the depreciation of sterling. This is because most foreign assets owned by UK agents are denominated in foreign currency whereas domestic assets owned by foreigners are denominated in sterling.
Medium term projections
In table A10, we outline our view on how the UK economy transitions from its current disequilibrium. The nature of the trading relationship between the UK and the European Union is likely to be the key determinant of the long-run equilibrium of the economy. The UK will leave the EU in March 2019 and an exit plan will need to be approved by the European Council, the British parliament as well as other sovereign parliaments across the EU, to avoid a cliff edge scenario where the trading relationship switches from the existing single market/ customs union arrangement to the more restrictive WTO rules. That parliamentary process is likely to take at least six months and thus the bulk of the negotiations will have to be completed by September 2018. We condition our forecast on the assumption that the UK will succeed in negotiating a two-year implementation period, during which the UK remains part of the single market and the customs union and continues to contribute to the EU budget at existing levels. In the long run, our modal forecast centres on an EFTA type agreement (see Reference Ebell and WarrenEbell and Warren, 2016, for further details). As the negotiation process unfolds and the relative positions of the UK and EU become clearer we will update our assumptions accordingly.
Alongside the uncertainty surrounding the nature of the final equilibrium, the path we take to get there is also uncertain, as shocks, which are by definition unpredictable, will buffet the economy away from its trajectory. We illustrate this uncertainty in the form of fan charts. Figure 2 shows that the probability of average growth of less than 1.4 per cent this year is 10 per cent, as is the probability of average growth greater than 1.7 per cent.
The most significant change between our current forecast and that published in August concerns our view on whole economy productivity and monetary policy. We now expect a more gradual recovery in whole economy productivity over the next two years compared with our previous forecast. Productivity growth since the financial crisis has been poor not only compared with history, but also relative to other major European economies.
Additionally, we have altered our assumptions regarding monetary policy since our August Review. Previously, we expected a rate increase of 25 basis points in February 2018, which we considered to be a reversal of part of the extra easing enacted by the BoE following the referendum, given the better than expected performance of the UK economy in the subsequent quarters. Now, we expect the normalisation process to begin before the stated conclusion of the negotiations. We have brought forward the first 25 basis point interest rate rise to the fourth quarter of 2017, followed by two subsequent rate hikes of 25 basis points each in 2018. Interest rates are then assumed to increase gradually throughout our forecast period at an average of 50 basis points a year. Between 2022 and 2026, Bank Rate will average approximately 3 per cent per annum.
In NiGEM, bilateral exchange rates are determined by interest rate differentials, adjusted for risk premia. In the absence of any change to the expected interest rate paths of the Federal Reserve or European Central Bank, it would be expected that tighter interest rates would lead to an appreciation of sterling in trade-weighted terms. As a result, although sterling on a trade-weighted basis will still depreciate by around 5.3 per cent this year in our forecast, we expect it to rebound by 0.5 per cent next year, compared to a 0.1 per cent appreciation in our August forecast, before remaining relatively constant from 2019 until 2025.
Our forecasts for CPI inflation are broadly unchanged with this higher Bank Rate profile. The annual rate of CPI inflation increased to 3.0 per cent in September from 2.6 per cent in June. We expect inflation to peak at 3.2 per cent in the fourth quarter of 2017. Our forecast suggests that inflation will remain above the Bank of England's target until the latter half of 2019. Compounding the near-term inflationary impact of the relative depreciation of sterling is a strengthening in our oil price profile. This is led by OPEC member states adhering to their production quotas, in addition to Iraqi and Kurdish tensions. Compared to our previous forecast, oil prices are around 2½ dollars higher in 2017 and around 3 dollars higher from 2019 onwards.
GDP growth is expected to be below its long-run potential rate which we estimate to be around 2 per cent per annum, moderating marginally to 1.6 per cent this year, from 1.8 per cent in 2016. Significantly, GDP growth in the medium term has been revised downwards from 1.9 per cent per year to 1.6. This is primarily driven by our downwards revision to productivity growth. In addition, this is reinforced by the slowdown in private consumption expenditure as inflation erodes the purchasing power of households. This is, however, offset by a positive contribution to GDP from net trade as more robust demand conditions in Europe lead to a pick-up in export growth, while weaker domestic demand conditions lead to lower import growth.
The improvement in net trade alongside the gradual return to surplus of the primary income account implies an improvement in the current account balance. We expect the average deficit of the current account to be 4.3 per cent this year and to continue to improve throughout our forecast horizon, returning to surplus in 2032. A key contribution to our forecast for the current account balance emanates from household consumption: should this turn out to be more robust than we envisage, we would expect higher income growth, and subsequently a larger current account deficit.
Our fiscal forecasts are based on assumptions outlined in the OBR's latest Economic and Fiscal Outlook. Public sector net borrowing is set to decrease from 2.6 per cent of GDP this year, through to 0.3 per cent in 2022, before increasing again to around 1.5 per cent from 2030 onwards. This implies that the public sector net debt stock peaks next year at 87 per cent of GDP before gradually falling thereafter. Between 2022 and 2026, we forecast public sector net debt to average around 63 per cent of GDP.
Since the peak of unemployment in 2011, the performance of the labour market has been exceptionally robust, with unemployment falling to 4.4 per cent in the second quarter of 2017. This continued strong performance has led us to revise down our projections for the unemployment rate to 4.4 per cent this year and 4.3 per cent next year, down from 4.7 per cent and 4.8 per cent reported in the August Review. We expect average earnings growth to increase slightly this year to 2.4 per cent, up from 1.7 in the last, before growing at approximately 3 per cent between 2019 and 2024 versus 2.9 previously. Overall, this translates into an unemployment rate of around 4.6 per cent over the same period, unchanged from our previous Review.
Appendix – Forecast details


Household inflation expectations for the year ahead have flattened

Private and public sector nominal wage growth remain subdued


Goods exports volumes to the EU have surpassed levels last seen in 2007

Per capita consumer spending is expected to reach its pre–recession peak in 2020 (2007Q4=100)


Household income gearing

We expect households' propensity to save to rise over the medium term (per cent of gross disposable incomes)


Productivity in the UK is close to pre-recession levels

National saving rates (per cent of GDP)


In 2017Q3 GDP was 9.8 per cent higher than its pre-crisis peak and employment is estimated to be 8.3 per cent higher

The Beveridge curve



