


Introduction
Cattle feed yards routinely collect, track, and manage large amounts of operational data. While the specific variables collected and managed by each feed yard can vary, much of the data collected is consistent across feed yards. Operational data tracks each animal from arrival to sale providing details of a calf’s specific journey while at the feed yard. This detailed record and data management can be time-consuming and costly. The continued practice of data collection signals that the information contained in such data must provide expected benefits to management outweighing the costs. Through monitoring operational data, management can often identify trends and anomalies that are cause for concern and may warrant corrective action. Operational data has also proven useful in many scholarly research projects intended to improve feed yard efficiency and profitability (Rojas et al. Reference Rojas, White, Amrine and Larson2022; Feuz, Feuz, and Johnson Reference Feuz, Feuz and Johnson2021; Moya et al. Reference Moya, Silasi, McAllister, Genswein, Crowe, Marti and Schwartzkopf-Genswein2015; Amrine, White, and Larson Reference Amrine, White and Larson2014; and Theurer et al. Reference Theurer, White, Larson, Holstein and Amrine2014). There are many components affecting profitability in the cattle feeding industry, not the least of which is a feed yard’s mortality rate (Irsik et al. Reference Irsik, Langemeier, Schroeder, Spire and Roder2006). The cost of each calf is an investment for a feed yard and death loss eliminates an individual calf’s expected return on investment. If a feedlot manager were able to predict mortality, then this loss could be partially avoided through premature culling and subsequent sale of the calf in the railer market.
The objective of this study is to use machine learning classification algorithms (classifiers) to create mortality predictive models and estimate through simulation the average expected change in net return per head when using the classifier predictions of mortality as a culling decision aid. The change in net return will be simulated using the predictions of the classifier that is shown to have the highest expected net return on average across the nine feed yards and 4 years of observational data used in the study. In data science, a classifier is a type of machine learning algorithm used to assign a class label to a data input. In the case of our objective, the classifier uses inputs from the operational feed yard data to make predictions of mortality before the end of the feeding period for an animal.
Relevant literature
There have been many important research projects which have relied on observational feed yard data. Cha et al. (Reference Cha, Sanderson, Renter, Jager, Cernicchiaro and Bello2017) used structural equation models with operational feed yard data with a focus on health outcomes related to bovine respiratory disease (BRD). Their model demonstrated indirect effects of arrival weight on average daily gain (ADG) mediated by BRD-related treatment costs. Irsik et al. (Reference Irsik, Langemeier, Schroeder, Spire and Roder2006) estimated marginal effects of increased mortality on the feed conversion ratio, ADG, and added feed costs in a pen of cattle. Babcock et al. (Reference Babcock, White, Dritz, Thomson and Renter2009) used generalized linear mixed models with operational feed yard data and determined that the timing of initial BRD treatment is associated with performance and health outcomes. Decreased ADG, greater hot carcass weight, and more total treatments were associated with cattle with more weeks on feed between BRD treatment and slaughter compared with cattle treated closer to slaughter. Babcock et al. (Reference Babcock, Cernicchiaro, White, Dubnicka, Thomson, Ives, Scott, Milliken and Renter2013) used a mixed effects multivariable negative binomial regression model to quantify effects of cohort-level risk factors for combined mortality and culling losses in feed yard cattle cohorts.
These types of studies (Cha et al. Reference Cha, Sanderson, Renter, Jager, Cernicchiaro and Bello2017; Irsik et al. Reference Irsik, Langemeier, Schroeder, Spire and Roder2006; Babcock et al. Reference Babcock, White, Dritz, Thomson and Renter2009; Babcock et al. Reference Babcock, Cernicchiaro, White, Dubnicka, Thomson, Ives, Scott, Milliken and Renter2013) are all part of a large body of research using operational feed yard data that could be described as retrospective. The data are used after cattle have finished the production cycle and knowledge gained from the research is used to adjust future production to increase the efficiency and profitability of the cattle finishing industry.
There are a smaller number of studies that could be described as prospective, as their objectives are to use operational data to make predictions and adjust management decisions concerning current animals within the feed yard. The most applicable prospective study for the purposes of the objective of this paper is Feuz, Feuz, and Johnson (Reference Feuz, Feuz and Johnson2021). This study used operational feed yard data from a 2-year Noble Research Institute sustainability project. Their objective was to construct mortality predictive models and evaluate whether the models were accurate enough to ensure a positive financial impact when used as a culling decision aid. There are other notable prospective studies including Rojas et al. (Reference Rojas, White, Amrine and Larson2022); Amrine, White, and Larson (Reference Amrine, White and Larson2014); Moya et al. (Reference Moya, Silasi, McAllister, Genswein, Crowe, Marti and Schwartzkopf-Genswein2015); and Theurer et al. (Reference Theurer, White, Larson, Holstein and Amrine2014). Rojas et al. (Reference Rojas, White, Amrine and Larson2022) used operational feed yard data to construct predictive models for BRD risk classification (high or low). They demonstrated that feed yards using the predictive models to make treatment decisions may see positive economic value as compared to using traditional methods of BRD risk classification. Amrine, White and Larson (Reference Amrine, White and Larson2014) evaluated the ability of different classification algorithms using feed yard operational data to predict a calf’s outcome based on data available at first diagnosis of and treatment for BRD. They focused on predicting animals that were treated for BRD with an antimicrobial, but ultimately did not finish (DNF) the production cycle with their cohort. Moya et al. (Reference Moya, Silasi, McAllister, Genswein, Crowe, Marti and Schwartzkopf-Genswein2015) used feeding behavior pattern recognition techniques to predict morbidity in newly arrived feed yard cattle. Theurer et al. (Reference Theurer, White, Larson, Holstein and Amrine2014) used operational feed yard data to evaluate associations of rectal temperature at first treatment for BRD and the probability of not finishing the production cycle.
Feuz, Feuz, and Johnson (Reference Feuz, Feuz and Johnson2021) and Rojas et al. (Reference Rojas, White, Amrine and Larson2022) are separated from the other noted prospective studies in their objectives to not only create predictive models, but also evaluate the economic consequences of using the model predictions as a management decision aid. However, Feuz, Feuz, and Johnson (Reference Feuz, Feuz and Johnson2021) are the most relevant to the current study as their models focused on mortality prediction to be used as a decision aid to cull railers. Cattle culled and marketed prematurely are commonly referred to as realizers or railers. These cattle are typically sold at sizable discounts to railer buyers who periodically visit feed yards. The discounts to price are appropriate as railers are often comprised of the lame or chronically sick. Managers readily accept the steep discounts for railers, as the alternative would be a complete loss of revenue in the event of premature death. Feuz, Feuz, and Johnson (Reference Feuz, Feuz and Johnson2021) rightly note that “if a feedlot manager were able to predict which calves were going to die before the end of the feeding period, then naturally the manager would look to alter their management practices or market these animals prematurely in order to recoup a portion of the investment” (242). They ultimately concluded through simulation that the net return would increase on average by $14.01 per head for calves having been treated at least once for any health incident if the best-performing classifier (logistic) were used as a culling decision aid. Through using cost-sensitive learning, that average change in net return per head increased to $45.27 per head.
These results showed promise for using classifier predictions as a culling decision aid. However, noted weaknesses in their study warrant continued exploration of this method. Chief among the noted weaknesses is the sample size. Feuz, Feuz, and Johnson (Reference Feuz, Feuz and Johnson2021) relied on one feed yard over 2 years with the study population data set (SPD) containing 847 observations. They relied on k-fold cross-validation to train and test the model. This is a reasonable choice with such a limited sample size but may not accurately reflect the true performance of the model when tested on previously unseen animals. To ensure robustness of the findings (economic benefit) and evaluate the scalability of the method, the sample size must be greatly increased in terms of both raw cattle numbers as well as additional feed yards over additional production years. This allows us to avoid using data from the same animal in both the training of the model and the testing of the model by separating the data by year and using previous years’ data to train the predictive model for the current year. Using such an expanded sample, this study identifies the classifier with the highest average expected change in net return per head and, after simulation, presents the expected change in net return per head when using the classifier predictions as a culling decision aid.
Data and methods
The operational feed yard data for this study was provided by a consulting veterinary group. The data is comprised of retrospective, individual animal-level data collected from nine U.S. feed yards across 4 years (2016–2019). One of the feed yards is located in Colorado, two in Nebraska, and six in Texas. The SPD for this study is the subset of the total animals in the feed yards that were pulled at least once for BRD as determined by feed yard personnel. Diagnosis at initial treatment was determined by feedlot personnel responsible for daily health management of the cattle. Cases were identified based on standard industry procedures including evaluation of animal appearance, demeanor, and body temperature. Outliers in the data were partially addressed by removing observations with treatment temperatures <101 and >108 degrees Fahrenheit (2,178 animals) and treatment weights <300 and >1,700 lbs. (558 animals)Footnote 1 . After removal of these outliers, the SPD is comprised of 184,032 individual animals pulled collectively 250,217 occasions for BRD. Table 1 contains summary statistics for the nine feed yards used in this study. The SPD for this study containing only BRD-related health incidents is a notable difference from Feuz, Feuz, and Johnson (Reference Feuz, Feuz and Johnson2021) in that their SPD was a subset of animals pulled at least once for any health-related incident. In large part, this change is made to greatly increase the sample size while still using consistent data across all feed yards. The type of data collected for BRD pulls among the feed yards was found to be consistent and allows for a dataset of large enough size to begin to evaluate the scalability of using classifier predicted mortality as a culling decision aid.
Summary Statistics for Feed Yards Included in the Study Population Data set

Note: Numbers were assigned to feed yards based on their respective number of unique head in the SPD with one having the smallest and nine having the largest.
a Feed yard size is categorized into small, medium, or large to protect the anonymity of the feed yards within the data set. Size category based on average monthly head count with small:<15,000 hd.; medium: 15,000–40,000 hd.; and large: >40,000 hd.
b The total number of ‘pulls’ for BRD as diagnosed by feed yard personnel responsible for health management of animals within a feed yard from 2016 to 2019.
c The number of unique animals pulled at least once in a given feed yard for BRD from 2016 to 2019.
d Average number of unique animals pulled at least once in a given feed yard for BRD within a single year.
e Average BRD morbidity rate is calculated as the “average unique head per year” as a percentage of average annual production.
f The average mortality rate from 2016 to 2019 of animals pulled at least once for BRD calculated as the average number of deaths per year as a percentage of the “average unique head per year”.
The feed yard observational data contained many variables used directly as features within the classifiers such as initial weight, treatment weight, treatment temperature, medication administered, sex, etc. Additional features were also created from the operational data and used for classification following Feuz, Feuz, and Johnson (Reference Feuz, Feuz and Johnson2021) and Amrine, White, and Larson (Reference Amrine, White and Larson2014). The features used for classification are summarized in Table 2.
Features Used in Classification Algorithms
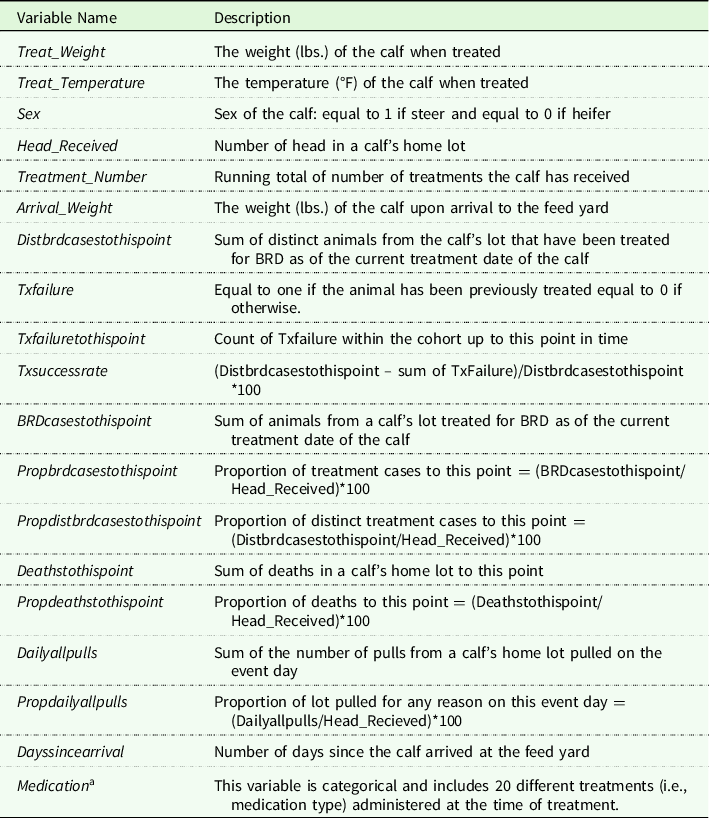
a For all classifiers, the Medication was converted into 20 categorical variables for each specific treatment administered. Each categorical variable was equal to 1 if the medication was administered and 0 otherwise.
Within Feuz, Feuz, and Johnson (Reference Feuz, Feuz and Johnson2021), a logit model was found to be the classifier with the largest expected change in net return when used as a culling decision aid among the five classification algorithms examined for their dataset comprised of a single feed yard. However, given that the current SPD for this study contains multiple feed yards, we would not necessarily expect that the Logit classifier would have the highest expected change in net return. Using a similarly defined SPD (animals pulled at least once for BRD across multiple feed yards), Amrine, White, and Larson (Reference Amrine, White and Larson2014) demonstrated how classifier accuracy could vary with the ‘best performing’ classifier often differing between feed yards. They concluded that by pairing the correct classifier with the data available, accurate predictions could be made. Thus, after data collection and feature creation, we evaluated many classifiers (e.g., linear models, ensembles, non-parametric tree-based, neural networks) together with various techniques (e.g., class weighting, boosting, and scaling distributions) to improve expected economic return from using the classifier predictions as a culling aid. As the objective of this study centers on the economic viability of using classifier predictions of mortality among the SPD as a culling decision aid, simply identifying the classifier that maximizes predictive accuracy would not be sufficient to ensure maximum expected economic return. When evaluating diagnostic testing accuracy, we must also consider both sensitivity and specificity. Sensitivity refers to the proportion of truly positive cases the classifier identifies as ‘test positive’. Whereas specificity refers to the proportion of truly negative cases the test identifies as ‘test negative’. Both Theurer et al. (Reference Theurer, White, Larson and Schroeder2015) and Feuz, Feuz, and Johnson (Reference Feuz, Feuz and Johnson2021) demonstrated that while an increase in the change in net return per animal can be expected with an increase in either sensitivity or specificity, increases in specificity are expected to have a significantly larger marginal effect.
Maximization of specificity or sensitivity would not be sufficient to determine which classifier would lead to the best improvement in economic performance, as the two must be considered jointly. A high specificity would allow for all ‘finish’ predictions, due to the imbalanced nature of the dataset, leading to a relatively high accuracy rate but low or negative expected change in net return when following the classifier predictions to make culling decisions. Conversely, sensitivity does not consider false positives — the minimization of which has been shown to result in relatively larger positive effects as compared to minimization of false negatives when using the classifier predictions as a culling aid (Feuz, Feuz, and Johnson Reference Feuz, Feuz and Johnson2021). Instead, to identify the ‘best’ performing classifier, we identified the classifier that maximized an estimate of expected net return for each feed yard when using the predictive outcomes to make culling decisions. To do so, we used average simulated net return values of the predictive outcomes in the confusion matrix (true positive, false positive, true negative, false negative) from Feuz, Feuz, and Johnson (Reference Feuz, Feuz and Johnson2021). We compare the performance of five classifiers in terms of the estimated net return: Logistic Regression, Decision Tree, Naive Bayes, Random Forest, and Neural Network. The performance of each classifier was evaluated by calculating the estimated net return from each feed yard when using the classifier to make culling decisions. The classifier that yielded the highest estimated net return on average across all feed yards was selected as the classifier to use within the economic simulation analysis of the individual feed yards.
Although each classifier has distinct advantages and disadvantages, we found that the neural network produced higher expected average net return for the majority (66%) of the nine feed yards. The neural network was composed of nodes using Leaky Rectified Linear Units (LeakyReLU) as activation functions to combat vanishing gradients often known as the “dying ReLU” problem (Maas, Hannun, and Ng Reference Maas, Hannun and Ng2013). Additionally, we employed a randomized dropout layer to prevent overfitting and increase accuracy. This is a technique used within a neural network where the nodes are randomly excluded (i.e., dropped out) from a layer of the neural network during the training process. This has the effect of introducing additional noise into the learning process and driving the network to react accordingly. It can be thought of as a way to simulate an ensemble of multiple neural networks without incurring the associated increase in training resources required to train an ensemble neural network. When configured this way, the neural network produced the highest estimated net return across the different feed yards compared to the other classifiers evaluated.
Economic analysis procedure
The primary objective of this paper is to estimate through simulation the average expected change in net return per head (for BRD diagnosed cattle) when using the classifier predictions of mortality as a culling decision aid. The training and testing of the classifier were carefully structured to create a realistic scenario in which the data was segregated by year so that no information on an animal in the test dataset was ever seen in the training dataset. This was accomplished by using a holdout approach. The prediction model trained on 3 years of data from a yard and then tested on unseen data from the remaining fourth year of data. This process was repeated four times; each time allowing for a new year to be treated as the test data set with the other 3 years used for training. This helps ensure robustness of the results. Given nine yards, the hold-out method produced four models per yard (one for each of the 4 years), resulting in 36 total tests. We further repeated the training and testing process 10 additional times, each time re-initializing the neural network with random starting weights. This led to a total of 360 confusion matrices, 40 for each yard.
Critical post-processing steps were required before conducting yard-specific economic analysis. A calf may have been pulled more than once resulting in more than one classifier prediction for an individual calf. We reduced the resulting confusion matrix for each test to contain one prediction per unique animal. We assumed that the first time the classifier predicts mortality for a given calf, the feed yard management would have taken steps to cull and market the calf as a railer. If the same animal appeared later in the dataset for an additional treatment/prediction, that instance was ignored as the calf would have been culled following the initial prediction of mortality. If at each treatment date a calf was predicted to finish, then feed yard management would have continued to treat the calf and the final prediction for the calf was assigned as ‘Finish’. The predicted outcomes were further adjusted to allow for a fallout period of 7 days. For a calf to be given a final predicted outcome of ‘DNF’, we verified that the calf survived in the feed yard for at least 7 days following the treatment day when the initial DNF prediction was made. This helps ensure adequate time for a railer buyer to periodically visit the feed yard and have the opportunity to purchase culled cattle. If a calf died within the feed yard prior to the seventh fallout day, the final prediction for that calf was updated to ‘Finish’ to indicate that the prediction came too late to be acted upon. Finally, the predicted outcome of Finish or DNF was compared to the actual observed feed yard outcome to categorize each calf into one of four diagnostic categories: True Positive (TP), False Positive (FP), True Negative (TN), and False Negative (FN). Reference Table A1 in the appendix for a more complete description of the diagnostic categories. The diagnostic category prevalence percentages were averaged for each feed yard across the four years and the 10 training/test repetitions (40 confusion matrices). Summary statistics for the 40 confusion matrices are included in Table 3. Note that the low and high prevalence of FPs and TNs, respectively (Table 3), suggests a high degree of test specificity and is a strong indication that the classifier has been tuned appropriately. Increases in specificity have been shown to have higher marginal effects on the expected change in net return (Feuz, Feuz, and Johnson Reference Feuz, Feuz and Johnson2021).
Mean and Standard Deviation of Diagnostic Category Prevalence Percentages for the 40 Confusion Matrices of Each Feed Yard

Notes: Values listed are the average prevalence percentages with the standard deviation in parenthesis for the 40 confusion matrices of each feed yard.
The average diagnostic outcome prevalence percentages (Table 3) were used as weights to calculate the weighted average expected net returns per animal in the SPD when using the classifier predictions as a culling decision aid as in
 $$NR\_{C_i} = NR\_T{P_i}\left( {\% T{P_i}} \right) + NR\_T{N_i}\left( {\% T{N_i}} \right) + NR\_F{P_i}\left( {\% F{P_i}} \right) + NR\_F{N_i}\left( {\% F{N_i}} \right)$$
where $NR\_{C_i}$
is the expected net return ($/head) for the
$NR\_{C_i}$
is the expected net return ($/head) for the $i$
th feed yard for cattle pulled at least once for BRD when adhering to classifier predictions in making culling decisions,
$i$
th feed yard for cattle pulled at least once for BRD when adhering to classifier predictions in making culling decisions, $\% T{P_i}$
,
$\% T{P_i}$
, $\% T{N_i}$
,
$\% T{N_i}$
, $\% F{P_i}$
, and
$\% F{P_i}$
, and $\% F{N_i}$
are the average diagnostic outcome prevalence percentages (Table 3),
$\% F{N_i}$
are the average diagnostic outcome prevalence percentages (Table 3), $NR\_T{P_i}$
,
$NR\_T{P_i}$
, $NR\_T{N_i}$
,
$NR\_T{N_i}$
, $NR\_F{P_i}$
, and
$NR\_F{P_i}$
, and $NR\_F{N_i}$
are the average expected net returns ($/head) across all years for TP, TN, FP, and FN cattle, respectively, for the
$NR\_F{N_i}$
are the average expected net returns ($/head) across all years for TP, TN, FP, and FN cattle, respectively, for the $i$
th feed yard.
$i$
th feed yard.
The expected net returns ($/head) for TP, TN, FP, and FN cattle are calculated as in
 $$NR\_T{P_i} = \left( {R{W_i} \cdot RP} \right) - \left( {\left( {I{W_i} \cdot SP} \right) + \left( {FC \cdot DOF\_{P_i}} \right) + TC\_{P_i}} \right)$$
 $$\;NR\_{N_i} = \left( {DP \cdot CW} \right) - \left( {\left( {I{W_i} \cdot SP} \right) + \left( {FC \cdot DOF\_TN} \right) + TC\_T{N_i}} \right)$$
 $$NR\_F{P_i} = NR\_T{P_i} - \left( {NR\_T{N_i} - NR\_T{P_i}} \right)$$
 $$\matrix{
{NR\_F{N_i} = - \left[ {\left( {I{W_i} \cdot SP} \right) + \left( {FC \cdot DOF\_F{N_i}} \right) + TC\_F{N_i}} \right] - [NR\_T{P_i} + (\left( {I{W_i} \cdot SP} \right)} \hfill \cr
{\quad \quad \quad \quad \quad + \left( {FC \cdot DOF\_F{N_i}} \right) + TC\_F{N_i})]} \hfill \cr } $$
$$\matrix{
{NR\_F{N_i} = - \left[ {\left( {I{W_i} \cdot SP} \right) + \left( {FC \cdot DOF\_F{N_i}} \right) + TC\_F{N_i}} \right] - [NR\_T{P_i} + (\left( {I{W_i} \cdot SP} \right)} \hfill \cr
{\quad \quad \quad \quad \quad + \left( {FC \cdot DOF\_F{N_i}} \right) + TC\_F{N_i})]} \hfill \cr } $$
where $NR\_T{P_i}$
,
$NR\_T{P_i}$
, $NR\_T{N_i}$
,
$NR\_T{N_i}$
, $NR\_F{P_i}$
, and
$NR\_F{P_i}$
, and $NR\_F{N_i}\;$
are as defined in equation (1),
$NR\_F{N_i}\;$
are as defined in equation (1), $R{W_i}$
is the railer weight (lbs.),
$R{W_i}$
is the railer weight (lbs.), $RP$
is the railer price ($/lb.),
$RP$
is the railer price ($/lb.), $I{W_i}$
is the initial weight (lbs.),
$I{W_i}$
is the initial weight (lbs.), $SP$
is the stocker price ($/lb.),
$SP$
is the stocker price ($/lb.), $FC$
is the feed costs ($/hd./day) including feed, yardage, and interestFootnote
2
,
$FC$
is the feed costs ($/hd./day) including feed, yardage, and interestFootnote
2
, $DOF\_TN$
,
$DOF\_TN$
, $DOF\_{P_i}$
and
$DOF\_{P_i}$
and $DOF\_F{N_i}$
are the days on feed for TN, positives (TP or FP), and FN calves, respectively,
$DOF\_F{N_i}$
are the days on feed for TN, positives (TP or FP), and FN calves, respectively, $TC\_T{N_i}$
,
$TC\_T{N_i}$
, $TC\_{P_i},$
and
$TC\_{P_i},$
and $TC\_F{N_i}$
are the treatment costs ($) for treating a TN, positive (TP or FP), and FN calf, respectively,
$TC\_F{N_i}$
are the treatment costs ($) for treating a TN, positive (TP or FP), and FN calf, respectively, $DP$
is the dressed price ($/lb.), and
$DP$
is the dressed price ($/lb.), and $CW$
is the carcass weight (lbs.).
$CW$
is the carcass weight (lbs.).
Simulating net returns per head using model predictions
Variables within equations (2-5) were made stochastic to allow for simulation. Fitted distributionsFootnote 3 using the data provided by the individual feed yards were used for all variables other than stocker price, dressed price, treatment costs, days on feed for TN, railer price, and carcass weight. For stocker price and dressed price, historical price data for Kansas from the Livestock Marketing Information Center (LMIC, 2019a; LMIC, 2019b) was used. Kansas prices were used for all feed yards to hold constant the effect of price volatility across the various feed yards. Kansas is a state that is central to the feed yards used in this study. To estimate total treatment cost for TP and FP, TN, and FN we used a triangle distribution to select a direct cost per treatment of BRD multiplied by the number of treatments assumed for each diagnostic outcome. The triangular distribution of direct cost per treatment relied on the USDA Animal and Plant Health Inspection Service’s (2013) estimate of the average cost of treatment for a single case of respiratory disease of $23.60 as the most common and maximum value with a minimum value of $4.00. The minimum value was set based on the author first-hand knowledge of similar BRD treatment costs within a number of the feed yards in the dataset. The number of treatments for each diagnostic category was also stochastically determined using triangle distributions fit to the number of treatments for each diagnostic category within each feed yard. In addition to these direct treatment costs, the treatment cost for TN cattle also included indirect costs to account for performance (quality and yield grade) decreases associated with BRD treatment. The indirect costs were added to the direct costs and were equal to $23.23, $30.15, and $54.01 for cattle treated on one, two, or at least three occasions, respectively, for BRD (Schneider et al., Reference Schneider, Tait, Busby and Reecy2009). By considering these increases in treatment cost (both direct and indirect) as a function of number of pulls, we were able to effectively account for presumed increases to treatment costs associated with yards that are known to pull more aggressively (increased frequency). The distributions for feed cost per head per day, days on feed for TN, railer price, and carcass weight relied on the same distributions of Feuz, Feuz, and Johnson (Reference Feuz, Feuz and Johnson2021) as the current dataset for this study did not include data for these variables. Efforts were made to ensure the use of these distributions were appropriate for analysis using the current dataset. The distribution for feed costs was evaluated and found to be in line with the industry average. The distributions for the days on feed for TNs as well as the carcass weight from Feuz, Feuz, and Johnson (Reference Feuz, Feuz and Johnson2021) were also found to be adequate representations for the current data. To provide this assurance, we verified that the distributions of initial weights between the datasets were similar and that both the cattle in the Feuz, Feuz, and Johnson (Reference Feuz, Feuz and Johnson2021) study as well as this current study were fed to industry average finished weights. The distribution for railer price was an adequate representation of railer prices for the current dataset, as the location of the feed yards was regionally similar as well as the years the cattle were fed. While railer prices were not recorded within our dataset, the authors first-hand knowledge of the yards confirms that the railer price distribution used is an adequate representation of the railer prices received by the yards in this study.
Within the simulations, correlations were appropriately assigned to several key variables to ensure correlations as would be expected within a feed yard. The distribution of initial weight was negatively correlated with the distributions of both stocker price and days of feed (TN) while the distribution of days on feed (positives) was positively correlated with the distributions of both railer weight and number of treatments (positives). The specific values of the correlation coefficients are contained within the notes of Tables A2–A11 in the appendix.
Simulating the status quo
The net return per animal in the SPD if the manager were to retain the status quo culling protocol was calculated and simulated as in Feuz, Feuz, and Johnson (Reference Feuz, Feuz and Johnson2021). We assumed that under current culling protocol every animal was treated as a negative by the feed yard and either survived until finishing (TN) or died prematurely (FN). In reality, an unknown number of cattle would have been railed (positive prediction) by the yard suggesting some level of positive predictions within the status quo would be appropriate. However, railers were not recorded within our dataset and therefore all cattle were treated as negative predictions within the status quo. This suggests that a relatively small number of railer animals have been incorrectly assigned the true negative diagnostic outcome both within the status quo and classifier predicted mortality model. Discussions with professionals within the feedlot industry have informed us that feedlots target somewhere in the range of 4:1 to 10:1 ratio of railers to deads depending on current market conditions. If death percentages for feedlots are assumed to be in the range of 1–3%, then the railer percentage would typically be somewhere between 0.1 and 0.75%. Thus, the overall impact of the unknown outcome for railed animals as either true or false positives is limited, and its effect has been held constant within the simulation of net returns for both the status quo and classifier predicted mortality model. Equation (1) was updated to weight the net returns to fit the status quo protocol as in
 $$NR\_S{Q_i} = NR\_T{N_i}\left( {1 - \% mortalit{y_i}} \right) + NR\_F{N_i}\left( {\% mortalit{y_i}} \right)$$
where $NR\_S{Q_i}$
is the expected net return ($/head) for the
$NR\_S{Q_i}$
is the expected net return ($/head) for the $i$
th feed yard when following the status quo culling practices,
$i$
th feed yard when following the status quo culling practices, $\% mortalit{y_i}$
is the average percentage of the SPD that died prior to finishing in the
$\% mortalit{y_i}$
is the average percentage of the SPD that died prior to finishing in the $i$
th feed yard across all years, and
$i$
th feed yard across all years, and $NR\_T{N_i}$
and
$NR\_T{N_i}$
and $NR\_F{N_i}$
are as outlined in equation (1).
$NR\_F{N_i}$
are as outlined in equation (1).
The simulated difference $\Delta N{R_i} = NR\_{C_i} - NR\_S{Q_i}$
is the average change in expected net return per head of cattle treated at least once for BRD for the
$\Delta N{R_i} = NR\_{C_i} - NR\_S{Q_i}$
is the average change in expected net return per head of cattle treated at least once for BRD for the $i$
th feed yard when using the classifier predictions as a decision aid versus keeping the status quo culling protocol in place. If
$i$
th feed yard when using the classifier predictions as a decision aid versus keeping the status quo culling protocol in place. If $\Delta N{R_i}$
is positive, feed yard managers would expect a net benefit to using the classifier predictions in making culling decisions. The
$\Delta N{R_i}$
is positive, feed yard managers would expect a net benefit to using the classifier predictions in making culling decisions. The $\Delta N{R_i}$
was simulated over 10,000 iterations using Palisades @Risk Decision Tools Suite (2019). Analyzing the simulated results of
$\Delta N{R_i}$
was simulated over 10,000 iterations using Palisades @Risk Decision Tools Suite (2019). Analyzing the simulated results of $\Delta N{R_i}$
for each feed yard and averaged across feed yards accomplishes the objective of this study.
$\Delta N{R_i}$
for each feed yard and averaged across feed yards accomplishes the objective of this study.
Results
Summary statistics for the simulation results for the nine feed yards are included in Table 4. The average $\Delta N{R}$
across all nine feed yards in our study is $6.31/hd. with a standard deviation of $7.75/hd. This indicates if the classifier predictions are used as a culling decision aid a feed yard could expect the net return per head of each animal pulled at least once for BRD to increase by $6.31 on average as compared to keeping the current culling protocol in place. Feed yard 3 has the lowest mean expected
$\Delta N{R}$
across all nine feed yards in our study is $6.31/hd. with a standard deviation of $7.75/hd. This indicates if the classifier predictions are used as a culling decision aid a feed yard could expect the net return per head of each animal pulled at least once for BRD to increase by $6.31 on average as compared to keeping the current culling protocol in place. Feed yard 3 has the lowest mean expected $\Delta NR$
with −$1.61, while feed yard 4 has the highest with $19.46. Cumulative distribution functions (CDF) of simulated
$\Delta NR$
with −$1.61, while feed yard 4 has the highest with $19.46. Cumulative distribution functions (CDF) of simulated $\Delta NR$
for feed yards 3 and 4 are graphed together in Figure 1, allowing for a simple comparison of the expected probabilities associated with the change in net return over the range of expected values. While feed yard 4 does have the highest expected mean
$\Delta NR$
for feed yards 3 and 4 are graphed together in Figure 1, allowing for a simple comparison of the expected probabilities associated with the change in net return over the range of expected values. While feed yard 4 does have the highest expected mean $\Delta NR$
, it also has the greatest standard deviation ($14.86). Even with the increased standard deviation, a closer examination of the CDF for feed yard 4 (Figure 1) suggests that
$\Delta NR$
, it also has the greatest standard deviation ($14.86). Even with the increased standard deviation, a closer examination of the CDF for feed yard 4 (Figure 1) suggests that $\Delta NR$
would be expected to be positive with a probability greater than 0.9.
$\Delta NR$
would be expected to be positive with a probability greater than 0.9.
Results Summary: Simulation of Change in Net Return ($/head) by Feed Yard

a The average results across all nine feed yards included in the sample.
b Values as taken from the simulated CDF from each yard at the 5% level.
c Values as taken from the simulated CDF from each yard at the 95% level.
Cumulative Distribution Functions of Simulated Change in Net Return ($/hd.) from Using Model Predictions as Culling Decision Aid as Compared to Status Quo Culling Protocol.

In general, the results demonstrate that using the classifier predictions as a culling decision aid would be expected to result in an increase in net return per head on average for seven of the nine feed yards within the study. This expected positive financial result provides continued motivation for further exploration of using similar methodology to aid in making culling decisions within feed yards. With feed yards routinely characterized by thin profit margins, however, there is little room for error in using this methodology to make culling decisions. Two of the feed yards in the study have an expected negative change in net return per head with a third (feed yard 1) only having an approximate $2/hd. expected mean change in net return. This suggests that further evaluation of key drivers into the simulation results as well as characterization of the feed yards is necessary to better understand in what circumstances a feed yard could expect a positive change in net return when using classifier predictions to make culling decisions.
Feed yards 1, 2, and 3 have the lowest expected $\Delta NR$
. These three yards are also the smallest yards in terms of average monthly head count and number of unique head in the SPD (unique calves pulled for BRD) as compared to the other six feed yards. Thus, the first observation we make in comparing the different feed yards is that larger feed yards (average monthly head count) with more observations in the SPD (unique head in SPD) are preferred relative to smaller and fewer when relying on classifier predictions to aid in culling decisions. Average monthly head count and unique head in SPD are both positively correlated with expected
$\Delta NR$
. These three yards are also the smallest yards in terms of average monthly head count and number of unique head in the SPD (unique calves pulled for BRD) as compared to the other six feed yards. Thus, the first observation we make in comparing the different feed yards is that larger feed yards (average monthly head count) with more observations in the SPD (unique head in SPD) are preferred relative to smaller and fewer when relying on classifier predictions to aid in culling decisions. Average monthly head count and unique head in SPD are both positively correlated with expected $\Delta NR$
with Pearson correlation coefficients of 0.771 and 0.161, respectively. The second observation we make is that the six feed yards with the expected highest
$\Delta NR$
with Pearson correlation coefficients of 0.771 and 0.161, respectively. The second observation we make is that the six feed yards with the expected highest $\Delta NR$
are all located within Texas. The three yards with the lowest expected
$\Delta NR$
are all located within Texas. The three yards with the lowest expected $\Delta NR$
previously identified are in Colorado and Nebraska. This may point to some level of spatial dependence in the economic results. However, we find it more probable that the results are closely related to the current feed yard management practices. One, aspect of management that appears to be closely related to expected
$\Delta NR$
previously identified are in Colorado and Nebraska. This may point to some level of spatial dependence in the economic results. However, we find it more probable that the results are closely related to the current feed yard management practices. One, aspect of management that appears to be closely related to expected $\Delta NR$
, is the aggressiveness of pulling practices within the yard. Each feed yard is subject to different internal protocols and methods by which they identify and pull morbid animals. Some may pull more aggressively while others take a more conservative approach. These types of protocol differences are difficult to identify within our data but limited observations within the data analysis can be strengthened through anecdotal observation. Personal observations and experiences in working with the feed yards included in this study suggest that feed yards 1, 2, and 3 pull more aggressively as compared to the six Texas feed yards. This anecdotal observation is supported by comparing the average BRD morbidity rates in Table 1. Feed yards 1, 2, and 3 have much higher morbidity rates—7.5%, 14.2%, and 7%, respectively, as compared to the Texas yards, which average around 3.5%. This would suggest that feed yards 1, 2, and 3 have a higher pull rate compared to the other six feed yards. This indicates either actual increased levels of morbidity or an increased overall level of “pulling aggression”. The change in net return has a strong negative correlation (r=−0.734) with the average BRD morbidity of the feed yards. Additional insight is gained when comparing the mortality rates of the nine feed yards in relation to their respective expected
$\Delta NR$
, is the aggressiveness of pulling practices within the yard. Each feed yard is subject to different internal protocols and methods by which they identify and pull morbid animals. Some may pull more aggressively while others take a more conservative approach. These types of protocol differences are difficult to identify within our data but limited observations within the data analysis can be strengthened through anecdotal observation. Personal observations and experiences in working with the feed yards included in this study suggest that feed yards 1, 2, and 3 pull more aggressively as compared to the six Texas feed yards. This anecdotal observation is supported by comparing the average BRD morbidity rates in Table 1. Feed yards 1, 2, and 3 have much higher morbidity rates—7.5%, 14.2%, and 7%, respectively, as compared to the Texas yards, which average around 3.5%. This would suggest that feed yards 1, 2, and 3 have a higher pull rate compared to the other six feed yards. This indicates either actual increased levels of morbidity or an increased overall level of “pulling aggression”. The change in net return has a strong negative correlation (r=−0.734) with the average BRD morbidity of the feed yards. Additional insight is gained when comparing the mortality rates of the nine feed yards in relation to their respective expected $\Delta NR$
. The Pearson correlation coefficient of mortality rate within the SPD of each yard and the
$\Delta NR$
. The Pearson correlation coefficient of mortality rate within the SPD of each yard and the $\Delta NR$
is 0.968. This observation of high correlation is expected as a higher mortality rate among the SPD provides more opportunities for the classifier to identify TPs and improves the balance in the data set, which can greatly aid in increasing the classifier’s performance (Das, Krishnan, and Cook Reference Das, Krishnan and Cook2015; Feuz and Cook Reference Feuz and Cook2017).
$\Delta NR$
is 0.968. This observation of high correlation is expected as a higher mortality rate among the SPD provides more opportunities for the classifier to identify TPs and improves the balance in the data set, which can greatly aid in increasing the classifier’s performance (Das, Krishnan, and Cook Reference Das, Krishnan and Cook2015; Feuz and Cook Reference Feuz and Cook2017).
It is clear that using the classifier predictions to make culling decisions has a greater net benefit when the feed yard has a higher mortality rate within cattle pulled at least once for BRD. A higher mortality rate among the SPD does not necessarily suggest a higher overall mortality rate within a feed yard. The mortality rate within the SPD of feed yards that pull aggressively may be relatively low because of the aggressive nature of the treatment. However, pulling aggressively may also lower the mortality rate within the SPD through increased pulling of relatively healthy cattle (false positive BRD diagnosis). We performed a sensitivity analysis surrounding the mortality rate used in the status quo to determine the breakeven level of mortality rate that would result in the expected change in net return to be equal to $0 when using the classifier predictions versus the status quo. Simulated results demonstrated that the mortality rate within the status quo is positively related to the $\Delta NR$
for all feed yards. Thus, for yards with an expected negative
$\Delta NR$
for all feed yards. Thus, for yards with an expected negative $\Delta NR$
the mortality rate of the status quo would have to be lowered to find the breakeven rate while yards with a positive
$\Delta NR$
the mortality rate of the status quo would have to be lowered to find the breakeven rate while yards with a positive $\Delta NR$
the rate would be increased. We estimated the average breakeven mortality rate of the SPD to be 8.43% across all feed yards. Additionally, we calculated the average marginal effect of the mortality rate on the expected
$\Delta NR$
the rate would be increased. We estimated the average breakeven mortality rate of the SPD to be 8.43% across all feed yards. Additionally, we calculated the average marginal effect of the mortality rate on the expected $\Delta NR$
. This was done by repeated simulation of the
$\Delta NR$
. This was done by repeated simulation of the $\Delta N{R_i}$
changing the mortality rate in increments of one percent at each new simulation. Then the change in the
$\Delta N{R_i}$
changing the mortality rate in increments of one percent at each new simulation. Then the change in the $\Delta N{R_i}$
was calculated for each new simulation and averaged over all the feed yards. We estimated the marginal effect of mortality rate within the SPD to be $16.54/hd. This suggests that with each 1% increase in the mortality rate of BRD-positive animals, feed yards should expect that the
$\Delta N{R_i}$
was calculated for each new simulation and averaged over all the feed yards. We estimated the marginal effect of mortality rate within the SPD to be $16.54/hd. This suggests that with each 1% increase in the mortality rate of BRD-positive animals, feed yards should expect that the $\Delta NR$
would increase by $16.54/hd. when using the classifier predictions of mortality to make culling decisions.
$\Delta NR$
would increase by $16.54/hd. when using the classifier predictions of mortality to make culling decisions.
For each positive prediction of the classifier: 1) the prediction is either correct (TP) which decreases the prevalence percentage of FN as compared to the status quo or 2) the prediction is incorrect (FP) which decreases the prevalence percentage of TN as compared to the status quo. Each FP prediction decreases the expected $\Delta NR$
as compared to the status quo by the difference
$\Delta NR$
as compared to the status quo by the difference $\alpha = NR\_FP - NR\_TN$
. Whereas each TP prediction increases the expected
$\alpha = NR\_FP - NR\_TN$
. Whereas each TP prediction increases the expected $\Delta NR$
as compared to the status quo by the difference
$\Delta NR$
as compared to the status quo by the difference $\beta = NR\_TP - NR\_FN$
. The ratio
$\beta = NR\_TP - NR\_FN$
. The ratio $ - \alpha /\beta $
can then be interpreted as the number of correctly predicted positives (TP) required for every one incorrectly predicted positive (FP) for the expected
$ - \alpha /\beta $
can then be interpreted as the number of correctly predicted positives (TP) required for every one incorrectly predicted positive (FP) for the expected $\Delta NR$
to be equal to $0. We averaged the simulation net return mean values of the four diagnostic categories (TN, TP, FN, and FP) across the nine feed yards and found NR_TN= −$12, NR_TP= −$685, NR_FN= −$1,665, and NR_FP= −$1,358. The average ratio
$\Delta NR$
to be equal to $0. We averaged the simulation net return mean values of the four diagnostic categories (TN, TP, FN, and FP) across the nine feed yards and found NR_TN= −$12, NR_TP= −$685, NR_FN= −$1,665, and NR_FP= −$1,358. The average ratio $ - \alpha /\beta $
is then equal to
$ - \alpha /\beta $
is then equal to $ - \left( { - \$ 1,358 - \left( { - \$ 12} \right)} \right)/\left( { - \$ 685 + \$ 1,665} \right) = 1.37$
. Thus, when using classifier predictions as a culling decision aid, as long as for every one incorrect positive prediction (FP) the classifier correctly predicts positives (TP) at a rate of 1.37, we would expect feed yard net return per head in the SPD on average to be no worse off than when following the status quo culling protocol.
$ - \left( { - \$ 1,358 - \left( { - \$ 12} \right)} \right)/\left( { - \$ 685 + \$ 1,665} \right) = 1.37$
. Thus, when using classifier predictions as a culling decision aid, as long as for every one incorrect positive prediction (FP) the classifier correctly predicts positives (TP) at a rate of 1.37, we would expect feed yard net return per head in the SPD on average to be no worse off than when following the status quo culling protocol.
Limitations
One major limitation of the current study is the absence of consideration of medication withdrawal requirements. We assumed a 7-day opportunity to rail cattle upon initial ‘positive’ classification (7-day fallout). This helps to ensure the availability of a railer buyer to purchase and pick up railed animals. However, cattle with low days on feed (DOF) when pulled and classified as a positive may still have withdrawal periods due to initial processing regimentsFootnote 4 (vaccine, dewormer, antibiotic, etc.). Additionally, positively classified cattle may have been pulled previously, classified as a negative, treated with a medication, and still face withdrawal periods at the time of positive classification. Drug withdrawal is not a binding constraint for cattle at the end of the feeding period. Additional research is needed to account for the processing withdrawal periods needed to apply to real-world situations to further refine the economic advantage of implementing classifier predictions of mortality as a culling aid in the field.
Incorporating medication withdrawal times into the analysis would be analogous to adjusting the ‘fallout’ period from 7 days to match each animals required days to meet withdrawal requirements and be picked up by a railer buyer. This change would have the same effect as increasing the number of animals that the model correctly predicts as TP but ultimately die before clearing the fallout/withdrawal date. However, this increase would at least in part be offset if this methodology was applied in reality. Consider the portion of animals classified as a positive that died before expiration of the 7-day fallout period. Within this group, some animals would not have been treated previously or would have already cleared the withdrawal period of a previously administered medication. This suggests that these animals could have been railed and sold any time after positive classification had a railer buyer been available prior to the assumed 7-day fallout. Thus, some percentage of this group is being counted as FN (no revenue) within this analysis when in fact they could have been sold to a railer buyer for some recouperation of revenue had a buyer been available prior to the assumed maximum 7-day fallout expiration. Thus, the limitation surrounding the lack of a medication withdrawal constraint would be partially offset from this unknown percentage of animals. Even still, we expect the inclusion of withdrawal assumptions in the analysis would further constrain the model and would most likely decrease the magnitude of the estimated change in net return values. However, we feel that such a change would be unlikely to impact the results qualitatively.
Conclusions
Using operational feed yard data to construct mortality predictive models to be used as a culling decision aid has previously been shown to improve expected feed yard profitability within a small sample size in one feed yard over 2 years (Feuz, Feuz, and Johnson Reference Feuz, Feuz and Johnson2021). To evaluate scalability and ensure robustness of those findings, we greatly expanded the sample size to 250,217 total observations consisting of 184,032 unique calves treated at least once for BRD among nine individual feed yards across four production years. This expanded sample size allows us to avoid using data from the same animal in both the training and test sets of the model by separating the data by year and using previous years’ data to train the predictive model for the current year. A neural network using LeakyReLU as activation functions was determined to be the classifier on average across all yards and years that maximized the expected net return. The neural network predictions were then used to simulate the average $\Delta N{R_i}$
. The minimum and maximum
$\Delta N{R_i}$
. The minimum and maximum $\Delta N{R_i}$
are −$1.61 (feed yard 3) and $19.46 (feed yard 4), respectively. The average expected change in net return per head for animals treated at least once for BRD across all nine feed yards is $6.31 with standard deviation of $7.75. This positive change in net return suggests that we would expect feed yard profitability to increase when using the classifier predictions to make culling decisions versus keeping the status quo culling protocol in place. The results for
$\Delta N{R_i}$
are −$1.61 (feed yard 3) and $19.46 (feed yard 4), respectively. The average expected change in net return per head for animals treated at least once for BRD across all nine feed yards is $6.31 with standard deviation of $7.75. This positive change in net return suggests that we would expect feed yard profitability to increase when using the classifier predictions to make culling decisions versus keeping the status quo culling protocol in place. The results for $\Delta NR$
are not as positive as Feuz, Feuz, and Johnson (Reference Feuz, Feuz and Johnson2021) and the large standard deviation suggests there is sizable variation in the
$\Delta NR$
are not as positive as Feuz, Feuz, and Johnson (Reference Feuz, Feuz and Johnson2021) and the large standard deviation suggests there is sizable variation in the $\Delta NR$
per head. However, as a positive
$\Delta NR$
per head. However, as a positive $\Delta NR$
is estimated for seven of the nine feed yards included in this study, the results provide additional support for continued research and exploration of using operational feed yard data within mortality predictive models to aid in making culling decisions. Additional research efforts should build on this study and the other prospective studies cited previously, by evaluating this methodology in a field setting. Only then can the true impact to net return be evaluated when using classifier predictions of mortality as a culling decision aid as a field study at a collaborating feed yard would eliminate all model assumptions.
$\Delta NR$
is estimated for seven of the nine feed yards included in this study, the results provide additional support for continued research and exploration of using operational feed yard data within mortality predictive models to aid in making culling decisions. Additional research efforts should build on this study and the other prospective studies cited previously, by evaluating this methodology in a field setting. Only then can the true impact to net return be evaluated when using classifier predictions of mortality as a culling decision aid as a field study at a collaborating feed yard would eliminate all model assumptions.
The average change in net return is shown to be positively correlated with average monthly head count (r=0.771), unique head in SPD (r=0.161), and the mortality rate within the SPD of each yard (r=0.968). The average marginal effect of mortality rate within BRD-positive animals on the $\Delta NR$
is estimated to be $16.54/hd. This indicates that as the mortality rate increases by 1 percent, feed yards should expect the
$\Delta NR$
is estimated to be $16.54/hd. This indicates that as the mortality rate increases by 1 percent, feed yards should expect the $\Delta NR$
would increase by $16.54/hd. when using the classifier predictions of mortality to make culling decisions. Additionally, the
$\Delta NR$
would increase by $16.54/hd. when using the classifier predictions of mortality to make culling decisions. Additionally, the $\Delta NR$
is expected to decrease for yards that pull aggressively for presumed BRD morbidity. This is demonstrated by
$\Delta NR$
is expected to decrease for yards that pull aggressively for presumed BRD morbidity. This is demonstrated by $\Delta NR$
having a strong negative correlation (r=−0.771) with the average BRD morbidity rate. All these noted correlations considered together suggest that using classifier predictions to make culling decisions is expected to have more positive financial impacts when a feed yard is large, has lower morbidity/pulls less aggressively, and has a relatively high mortality rate within cattle pulled at least once for BRD. Managers of feed yards fitting these characteristics would be ideal candidates for further evaluation by using mortality predictive models to make culling decisions. As further research proceeds in this field, researchers and feed yard management must aim for correctly predicting positive DNFs at a rate greater than 1.37 for every one incorrectly predicted positive DNF to ensure a positive financial impact from using classifier predictions to make culling decisions.
$\Delta NR$
having a strong negative correlation (r=−0.771) with the average BRD morbidity rate. All these noted correlations considered together suggest that using classifier predictions to make culling decisions is expected to have more positive financial impacts when a feed yard is large, has lower morbidity/pulls less aggressively, and has a relatively high mortality rate within cattle pulled at least once for BRD. Managers of feed yards fitting these characteristics would be ideal candidates for further evaluation by using mortality predictive models to make culling decisions. As further research proceeds in this field, researchers and feed yard management must aim for correctly predicting positive DNFs at a rate greater than 1.37 for every one incorrectly predicted positive DNF to ensure a positive financial impact from using classifier predictions to make culling decisions.
Data Availability Statement
The data that support the findings of this study are available from the corresponding author, [RF], upon reasonable request.
Funding Statement
This research received no specific grant from any funding agency, commercial, or not-for-profit sectors.
Competing Interests
Ryan Feuz, Kyle Feuz, Jeffery Gradner, Miles Theurer, and Myriah Johnson declare none.
Appendix
Classification Model Predictions, Ground Truth, Diagnostic Outcomes, and Management Decision

Feed Yard 1 Summary of Distributions Used within Change in Net Return Simulations

Feed Yard 2 Summary of Distributions Used within Change in Net Return Simulations

Feed Yard 3 Summary of Distributions Used within Change in Net Return Simulations

Feed Yard 4 Summary of Distributions Used within Change in Net Return Simulations

Feed Yard 5 Summary of Distributions Used within Change in Net Return Simulations

Feed Yard 6 Summary of Distributions Used within Change in Net Return Simulations

Feed Yard 7 Summary of Distributions Used within Change in Net Return Simulations

Feed Yard 8 Summary of Distributions Used within Change in Net Return Simulations

Feed Yard 9 Summary of Distributions Used within Change in Net Return Simulations

Summary of Distributions Used within Change in Net Return Simulations for All Feed Yards

Note: all of the distributions for the variables within this table were used in the simulation of change in net return for all of the nine feed yards.


 Open access