

42.1 Introduction
Auditory disabilities affect a substantial portion of the global population, and the World Health Organization estimates that close to 2.5 billion people will live with some degree of hearing loss (HL) by 2050 (World Health Organization, 2023). Many listeners with mild HL may struggle to understand speech in noisy situations, and those with moderate HL experience difficulties with speech perception even under ideal listening conditions. Individuals, however, can share identical audiometry, meaning that their hearing thresholds – estimated by an audiologist using pure tone stimuli across standard frequency bands – are similar, yet they achieve very different functional hearing outcomes. For example, imagine that two listeners with HL follow speech in quiet relatively well, but one person has substantially greater difficulty than the other in understanding speech in noise, such as when dining in a busy restaurant. This discrepancy highlights the complexities and individuality of HL not captured by audiometry: The other listener’s relatively preserved speech in noise perception might be related to any number of factors, including lip-reading skill, working memory capacity, educational background, or awareness of contextual cues (Akeroyd, Reference Akeroyd2008; Aydelott et al., Reference Aydelott, Leech and Crinion2010; Dryden et al., Reference Dryden, Allen, Henshaw and Heinrich2017). Individual differences in temporal processing, such as sensitivity to temporal structure, is one cognitive trait that could be associated with listening outcomes in the context of audiological difference and disability (Füllgrabe et al., Reference Füllgrabe, Moore and Stone2015; Hidalgo et al., Reference Hidalgo, Zécri and Pesnot-Lerousseau2021); yet, HL may also impact which aspects of temporal processing are available to listeners. This could in turn limit the extent to which individuals are able to benefit from temporal cues or predictable speech rhythms, for instance.
In this chapter, I review an interdisciplinary literature investigating the perception of speech timing and rhythm – which I define here as temporal patterns and/or structures – in the context of HL, as well as listening via an auditory prosthesis, the cochlear implant (CI). I first introduce some of the etiologies that can result in hearing disability, as well as the main medical and rehabilitative interventions for HL. I then survey the clinical and experimental data that shed light on how speech rhythm and prosody are processed by people with HL. This includes data regarding group and individual differences in temporal perception, and how these differences may have implications for, or be modulated by, HL. Although speech rhythm is the focus of this chapter, as a point of comparison, I also briefly survey the scientific picture surrounding musical rhythm perception and production with regards to HL.Footnote 1 The preceding sections are organized according to the timing of HL onset: pre-lingual, or before language acquisition (i.e., primarily affecting infants and children); and post-lingual, or after language acquisition (i.e., primarily affecting adolescents and adults). I conclude the chapter by describing open questions and possible directions for interventions.
42.2 The Many Sides of HL
At the outset, it is important to distinguish between deafness, which refers to the state of having HL, and Deafness, which conveys belonging to a Deaf linguistic and cultural identity (Obasi, Reference Obasi2008). Someone who is Deaf may see HL as a matter of social difference, rather than a disorder or medical problem in need of intervention – noting that a person can be hearing, or use a CI, and also be culturally Deaf. The lines between groups who identify as Deaf, deaf, or hearing are porous, may not necessarily align with use of spoken or signed language, and have been subject to a complex social history. Here, I focus exclusively on HL as it is experienced by someone who uses spoken language to communicate. I will use HL and auditory disability to refer to those with reduced access to auditory speech information, while acknowledging that different individuals may identify with other terms to describe their hearing status. This chapter also omits extended discussion of rhythm in sign language, which should be incorporated when accounting for functional roles of rhythm in human communication more generally (MacIntyre, Reference MacIntyre2018).
42.2.1 Causes of HL
There are a variety of ways in which HL can occur (World Health Organization, 2018). Causes include exposure to very loud sounds, physical trauma, hereditary syndromes, side effects of medications and other treatments, infection, chronic illnesses (e.g., diabetes), and normal ageing. Congenital HL, present at birth, may be caused by genetic variation, complications during birth, or viral infection, among other factors. Although HL can stem from problems with the outer and middle ear (e.g., a perforated eardrum), many of the aforementioned conditions affect the inner ear wherein cochlear hair cells, the sensory receptors of the auditory system, are damaged. HL can also arise from issues affecting the auditory nerve (Kaga, Reference Kaga2016). HL can advance very gradually, especially for age-related HL, meaning that someone may not notice a difference until their HL can be characterized as moderate or poorer. At this point, changes in central auditory processing, including cognitive and behavioral adaptations to cope with the reduced or degraded sensory input, have likely already occurred (Herrmann and Butler, Reference Herrmann and Butler2021; Mitchell and Maslin, Reference Mitchell and Maslin2007; Slade et al., Reference Slade, Plack and Nuttall2020).
42.2.2 Hearing Devices
Whether HL is treatable depends on the underlying cause, but cochlear damage is usually irreversible. In the case of mild to moderate permanent HL, a listener can make use of a hearing aid (HA) to amplify the acoustic signal and compensate the audibility of specific frequencies; however, when HL is severe to profound, a CI may help to restore a sense of hearing. A CI is an auditory prosthesis that bypasses the inner ear (Carlyon and Goehring, Reference Carlyon and Goehring2021; Fan-Gang Zeng et al., Reference Zeng, Rebscher, Harrison, Sun and Feng2008; Loizou, Reference Loizou1999). It consists of an array of electrodes surgically implanted within a person’s cochlea, which receive a signal originating from the external components of the system. Briefly, the CI pipeline from sound source to auditory percept is as follows: First, sounds in the environment are sampled by an external microphone (or multiple microphones). An external processor then divides this signal into its component frequencies, emulating the frequency selectivity of the inner ear. Other signal processing techniques, such as noise reduction, may also be implemented at this step. The processed signal, now converted into discretized pulses, is transmitted via radio waves to an internal receiver, which conveys the signal onward to the stimulator implanted within the cochlea. Here, each signal component activates a specific electrode, thereby directly interfacing with the auditory nerve. Whereas acoustic hearing entails thousands of individual cochlear hair cells, CIs normally contain around 22 individual electrodes or fewer – in practice, the number of useable electrodes is often even lower, depending on the health of the auditory nerve and/or interaction between channels due to electrical current spread within the cochlea (Goehring et al., Reference Goehring, Archer-Boyd, Arenberg and Carlyon2021). Despite limited spectro-temporal resolution, however, many people with CIs have excellent speech reception in quiet, and some are furthermore able to communicate via voice calls in the complete absence of nonauditory cues (e.g., lip-reading). CI listening should be considered as a perceptual representation of sound that is distinct from typical acoustic hearing, and in particular, CI users who received their implant later in life usually require time, patience, effort, and support to make the most of their device (Boisvert et al., Reference Boisvert, Reis, Au, Cowan and Dowell2020; Tang et al., Reference Tang, Thompson and Clark2017).
42.3 Psychophysical and Cognitive Aspects of HL and the Perception of Speech Rhythm
42.3.1 Influences of HL at the Auditory Periphery
Even when accounting for differences in audibility and perceptual thresholds, people with moderate to severe HL may also experience other changes regarding their sensitivity to, and processing of, sounds. For example, people with HL show reduced frequency selectivity (Moore, Reference Moore1985, Reference Moore1996). This increases the threshold at which contrasts in spectral quality are perceived, which can affect the discrimination of vowel sounds. HL is also associated with poorer dynamic range, possibly due to a reduction in the compression performed at the basilar membrane, caused by damage or loss of the outer hair cells that would normally selectively amplify vibration and sharpen frequency tuning (Moore, Reference Moore1996). The consequence is that softer sounds may become inaudible, while louder ones are perceived similarly to typically hearing listeners – or, in some cases, as intolerably loud. This may influence temporal processing relatively early in the auditory system. For instance, in silent gap detection tasks, experimental participants with HL require longer gap duration values, in comparison to their typically hearing counterparts, when the stimuli in which the gap occurs consist of narrowband noise (Glasberg and Moore, Reference Glasberg and Moore1992). This effective reduction in temporal resolution may be related to the amplitude fluctuations inherent to noise: With reduced dynamic range, randomly occurring peaks and troughs within the noise amplitude modulation patterns may be perceptually exaggerated, making true gaps more difficult to detect. Another temporal consequence of cochlear damage relates to how certain acoustic features, such as perceived pitch or loudness, are processed over time at the sub-second level. Specifically, for typically hearing listeners, increases in stimulus duration tend to accompany a change in thresholds required to perceive the feature of interest (Kidd et al., Reference Kidd, Mason and Feth1984). For instance, a short tone following the presentation of a longer tone will need to have a relatively higher sound pressure level in order to be perceived as identically loud. This process is referred to as temporal integration, and is theorized to reflect how sensory information is sampled and/or accumulated over time (Florentine et al., Reference Florentine, Fastl and Buus1988). Hence, HL may lead to weaker or less stable representations of sustained sounds at short timescales, which could in turn affect the processing of temporal structure at longer timescales, as in speech or music (Moore, Reference Moore2003).
42.3.2 HL and Central Auditory Processing
At the auditory periphery, the aforementioned HL-related differences in temporal processing operate at the timescale of tens of milliseconds or fewer. These differences could in turn affect speech processing at the timing of syllables or phonemes by potentially distorting or obscuring salient temporal cues (e.g., the roughly 70 milliseconds of voice onset time that distinguish ta from da). However, HL is often accompanied by more central changes that could also impact the perception of speech rhythm at slower timescale, i.e., at the level of words and phrases. In this section, I will survey the empirical literature investigating how people with HL perceive and reproduce temporal patterns and structure in speech with a focus on cognitive and other higher-level aspects of sensory processing. I begin by discussing congenital and early HL, and examine how perception and production of speech rhythm, as well as other aspects of temporal and prosodic processing, develop in children who use CIs and HAs for speech communication. I then address post-lingual HL in adults, before turning to focus on the interaction between HL and cognitive changes associated with normal ageing, especially with relevance to speech in noise perception.
42.3.2.1 HL and Speech Rhythm Perception and Production during Development
42.3.2.1.1 Perception of Speech Rhythm by Children with HL
Before the advent of regular newborn hearing screening, one indicator of auditory disability was the atypical speech produced by children with HL. In 1936, educator Charles G. Rawlings noted that the speech of pre-lingually Deaf children was often “arrhythmic,” but that “If the deaf child could be … trained from his first years in school to speak with a normal rhythm even at the cost of perfect articulation, his speech would be far more natural and intelligible to the general public” (Rawlings, Reference Rawlings1936:143). Such differences in production could indicate limited perceptual access to rhythmic properties in speech. For example, researchers report that children with HL (including those fitted with HAs and/or CIs) have poor sensitivity to lexical and syllabic stress (Holt et al., Reference Holt, Demuth and Yuen2016; Kalathottukaren et al., Reference Kalathottukaren, Purdy and Ballard2017; Konadath et al., Reference Konadath, Raveendran and Yeshoda2021; Lyxell et al., Reference Lyxell, Wass and Sahlén2009; Most and Peled, Reference Most and Peled2007; Segal et al., Reference Segal, Houston and Kishon-Rabin2016), which in natural speech are conveyed as variations in intensity, duration, intonation, or a combination of these. This reduction in sensitivity is already apparent when comparing infants (12–33 months old) with CIs to typically hearing infants (Segal et al., Reference Segal, Houston and Kishon-Rabin2016), although the overall pattern of developing a neural response to verbal stress appears to be similar across infants with CIs and those with typical hearing (Vavatzanidis et al., Reference Vavatzanidis, Mürbe, Friederici and Hahne2016). The fine-grained representation of auditory cues, however, are also likely to differ according to hearing device: Children (8–15 years old) who wear HAs have been found to have superior intonation and stress perception in comparison to children with CIs (Most and Peled, Reference Most and Peled2007). Recently, longitudinal experiments have shown that, for children (5–9 years old) with better residual hearing, the combination of HAs and CIs in contralateral ears may lead to improved speech prosody perception outcomes, presumably due to the low-frequency audibility provided by HAs (Davidson et al., Reference Davidson, Geers, Uchanski and Firszt2019). In the same cohort, prosody perception was determined to be uniquely predictive of later achievement in other linguistic areas including reading and phoneme perception (Grantham et al., Reference Grantham, Davidson, Geers and Uchanski2022). Hence, although children with HL tend to encounter difficulties in prosody perception, there is a wide range of ability that likely depends on hearing history, mode of amplification, and many other factors (see Wenrich et al., Reference Wenrich, Davidson and Uchanski2017, for a more in-depth discussion).
42.3.2.1.2 Production of Speech Rhythm by Children with HL
Scientific efforts to quantify the subjectively “arrhythmic” character of speech produced by children with HL generally cohere with Rawlings’ qualitative observation (Reference Rawlings1936). That is, there is consensus for “errors of prosody (e.g., errors of intonation, stress, and/or phrasing)” (Parkhurst and Levitt, Reference Parkhurst and Levitt1978). Children with HL tend to produce atypical patterns of stressed and unstressed syllables (Gold, Reference Gold1980; Lenden and Flipsen, Reference Lenden and Flipsen2007; Murphy et al., Reference Murphy, McGarr and Bell-Berti1990; Osberger and Levitt, Reference Osberger and Levitt1979; Sundström et al., Reference Sundström, Löfkvist, Lyxell and Samuelsson2018) – not only by misapplying stress within multisyllabic words but sometimes also by failing to differentiate or mark any stress at all, resulting in “staccato” speech with roughly equal syllabic weighting (McGarr and Osberger, Reference McGarr and Osberger1978; Osberger and Levitt, Reference Osberger and Levitt1979). Similarly, some analyses suggest that speech by children with HL is disrupted by the unusual placement of pauses (Bochner et al., Reference Bochner, Barefoot and Johnson1987; Gold, Reference Gold1980; McGarr and Osberger, Reference McGarr and Osberger1978; Osberger and Levitt, Reference Osberger and Levitt1979; Rawlings, Reference Rawlings1936). Children (6–10 years old) who use CIs are also less able to correctly imitate syllabic and stress patterns in both pseudo-words (Carter et al., Reference Carter, Dillon and Pisoni2002) and real words (Grandon et al., Reference Grandon, Vilain and Gillis2019), in comparison to typically hearing children.
Presumably, deficits in children with HL’s speech production originate in absent or degraded sensory input during speech perception, including auditory sensorimotor feedback of one’s own voice. Where the link, within-child, between speech prosody perception and production has been formally tested, some studies found a significant association (e.g., Klieve and Jeanes, Reference Klieve and Jeanes2001; Konadath et al., Reference Konadath, Raveendran and Yeshoda2021), although not all (e.g., Kalathottukaren et al., Reference Kalathottukaren, Purdy and Ballard2017). Objective and ratings-based measures of speech prosody production by children with HL have been found to correlate with other aspects of their linguistic development, including vocabulary and word recognition skills (Carter et al., Reference Carter, Dillon and Pisoni2002; Lyxell et al., Reference Lyxell, Wass and Sahlén2009). The reasons for this are unclear, although some possible mechanisms are addressed in the following section. Timing issues during speech communication can emerge as early as infancy: Dyads consisting of a mother and a CI-recipient child (one–two years old, observed three and nine months post-implant) produce longer between-speaker pauses relative to within-speaker pauses, contrary to the pattern associated with typically hearing children (Kondaurova et al., Reference Kondaurova, Smith, Zheng, Reed and Fagan2020). In addition, when compared to typically hearing peers, children with CIs (seven years and older) show reduced speech rate-matching during interactions with a clinician, and continue to demonstrate such delays well into adolescence (Freeman and Pisoni, Reference Freeman and Pisoni2017).
42.3.2.1.3 Auditory Deprivation and the Development of Rhythmic-Sequential Ability
Some authors argue that HL disrupts the development of cognitive faculties important for speech, particularly sequence learning, which is “the ability to encode and represent the order of discrete elements occurring in a sequence” (Conway and Christiansen, Reference Conway and Christiansen2001:539). Sequential learning has been shown to be reduced in children and adults with HL – even when using nonauditory paradigms (Conway et al., Reference Conway, Pisoni, Anaya, Karpicke and Henning2011; Lévesque et al., Reference Lévesque, Théoret and Champoux2014). Why would this be? One theory is that because sound is an inherently temporal signal, its analysis relies on attention, working memory, and the processing of serial order; hence, lack of experience with sound would deprive the developing child of crucial experience with temporal processing more generally (Conway and Christiansen, Reference Conway and Christiansen2005, Reference Conway and Christiansen2009). This coheres with evidence linking sequence learning to perceptual sensitivity for nonverbal auditory rhythms in typically hearing populations (François and Schön, Reference François and Schön2011; MacIntyre et al., Reference MacIntyre, Lo, Cross and Scott2022). Moreover, sequence and rhythm processing appear to share some neural correlates (Bednark et al., Reference Bednark, Campbell and Cunnington2015; Janata and Grafton, Reference Janata and Grafton2003). In the context of speech rhythm, insensitivity to stress and pauses could interfere with sequential processing by, for instance, obscuring syntactic boundaries (e.g., “fruit salad and milk” versus “fruit, salad, and milk”), a cue that is frequently missed by children with HL (Fortunato et al., Reference Fortunato-Tavares, Schwartz, Marton, de Andrade and Houston2018; Kalathottukaren et al., Reference Kalathottukaren, Purdy and Ballard2017). This may also bear some relationship to observed correlations between aberrant rhythm processing and developmental difficulties with grammar and syntax in the typically hearing population (Gordon et al., Reference Gordon, Jacobs, Schuele and McAuley2015; Ladányi et al., Reference Ladányi, Persici, Fiveash, Tillmann and Gordon2020; Lee et al., Reference Lee, Ahn, Holt and Schellenberg2020; Nitin et al., Reference Nitin, Gustavson and Aaron2023; see also Chapters 25 and 39), the latter of which disproportionately affect children with HL (Delage and Tuller, Reference Delage and Tuller2007; Friedmann and Szterman, Reference Friedmann and Szterman2006; Kawar, Reference Kawar2021; Moeller et al., Reference Moeller, Tomblin, Yoshinaga-Itano, Connor and Jerger2007; Nittrouer and Lowenstein, Reference Nittrouer and Lowenstein2021; Szterman and Friedmann, Reference Szterman and Friedmann2014; but see also Briscoe et al., Reference Briscoe, Bishop and Norbury2001).
Critics of the proposed link between HL and sequential learning, however, counter that the “sequence learning deficit in children with CI may be closely tied to the nature of the task” (Torkildsen et al., Reference von Koss Torkildsen, Arciuli, Haukedal and Wie2018:127). For example, some paradigms employing visual stimuli may nonetheless lend themselves to verbal rehearsal, thereby conflating domain-general sequential learning with phonological processing. In a sequential learning task deliberately designed to avoid this, children with CIs did not differ in performance from typically hearing peers (Torkildsen et al., Reference von Koss Torkildsen, Arciuli, Haukedal and Wie2018). This accords with evidence that children with CIs show selective impairments in verbal, compared with spatial, working memory tasks (Davidson et al., Reference Davidson, Geers, Uchanski and Firszt2019). An additional source of ambiguity stems from the challenge of decoupling auditory from linguistic exposure. For instance, children with HL who acquire sign language from birth perform similarly to typically hearing children in tests of sustained attention (Dye and Hauser, Reference Dye and Hauser2014). Early experience with sign language also appears to benefit linguistic development in children with CIs who go on to communicate orally in later life (Lyness et al., Reference Lyness, Woll, Campbell and Cardin2013). Linking back to rhythm, Deaf adults who use sign language can synchronize to a visual rhythmic stimulus as well as hearing adults do to an auditory rhythmic stimulus, with hearing adults performing comparatively poorly in visual-motor rhythmic synchronization tasks (Iversen et al., Reference Iversen, Patel, Nicodemus and Emmorey2015). Hence, active engagement with temporally dynamic patterns, whether visual or auditory, may in fact be key to the development of sequential, and possibly also rhythmic, processing. Further work is needed to disentangle modality-specific from domain-general deficits, as well as rhythm from possibly related cognitive faculties, such as verbal working memory (Saito, Reference Saito2001; Saito and Ishio, Reference Saito and Ishio1998).
42.3.2.1.4 Rhythm-Based Interventions in Speech Therapy
If rhythm processing is not strictly reliant on auditory experience, it may be that difficulties with speech rhythm observed in children with HL are more indicative of the limitations of speech prosody rehabilitation (Hargrove et al., Reference Hargrove, Anderson and Jones2009; Peppé, Reference Peppé2009) than of some innate deficit per se. Specifically, it is unclear whether children “do not know the stress patterns of the language or whether they do not have the articulatory co-ordination that would permit them to produce an intended pattern correctly” (Tye-Murray and Folkins, Reference Tye‐Murray and Folkins1990:2675). Some researchers propose that deficits in speech “flow” experienced by children with HL may be partly due to the “teaching of articulation of individual isolated elements rather than longer, more meaningful units of speech” (Gold, Reference Gold1980:408; see also Howard, Reference Howard2007; Tye-Murray and Woodworth, Reference Tye‐Murray and Woodworth1989). This could also help to explain why coarticulation – how the production of consecutive speech segments contextually affect each other – is reduced in HL, in comparison with typically hearing children (Okalidou and Harris, Reference Okalidou and Harris1999; Waldstein and Baum, Reference Waldstein and Baum1991). Yet, speech rhythm rehabilitation for children with HL may be facilitated by nonauditory sensorimotor experience – for instance, by demonstrating model prosodic patterns via finger tapping (Tye-Murray and Folkins, Reference Tye‐Murray and Folkins1990). Some research groups have explored this idea by using active rhythm training to enhance sensitivity to speech temporal features (see León Méndez et al., Reference del Carmen León Méndez, Fernández García and Daza González2023, and Pesnot Lerousseau et al., Reference Pesnot Lerousseau, Hidalgo and Schön2020, for reviews). For instance, it was found that a short, rhythm-focused training session, rather than the usual speech therapy session, was associated with more rhythmically stable speech production during a subsequent verbal turn-taking task for children with HAs and/or CIs (5–9 years old) (Hidalgo et al., Reference Hidalgo, Falk and Schön2017). The authors further demonstrated using electroencephalography (EEG) that the mismatch negativity, a neural correlate of prediction error, in response to rhythmically irregular trials was modulated by rhythmic training in children with HL (Hidalgo et al., Reference Hidalgo, Pesnot-Lerousseau, Marquis, Roman and Schön2019). These speech-focused studies concur with a similar experiment using musical stimuli, which found that active motor engagement with temporal structure enhanced the ability to identify songs in children with CIs (4–12 years old) (Vongpaisal et al., Reference Vongpaisal, Caruso and Yuan2016). Finally, in another speech rhythm priming study, the authors report that the presentation of a nonverbal rhythm, the structure of which was shared with the following utterance to be produced, improved phonological accuracy in children with various hearing devices (mean age 8.72 years old, SD 2.19; Cason et al., Reference Cason, Hidalgo, Isoard, Roman and Schön2015). It remains to be seen whether the benefits observed in any of these interventions persist over time or are rather limited to the immediate post-intervention period, and the results should be replicated with enhanced control conditions and blinding procedures – including, where possible, blinding of therapists and others administering the rhythm training (Hargrove et al., Reference Hargrove, Anderson and Jones2009; McKay, Reference McKay2021).
42.3.2.1.5 Musical Rhythm Perception and Production by Children with HL
In one study, children with CIs demonstrated poorer musical pitch and timbre perception, but not rhythm perception, when compared to typically hearing children; however, many of the children with CIs (9–13 years old) were involved in external music lessons (Innes-Brown et al., Reference Innes-Brown, Marozeau, Storey and Blamey2013). Another study reports marginally better performance for temporal, rather than pitch-based, recognition of melodies in children with CIs (5–7 years old) (Volkova et al., Reference Volkova, Trehub, Schellenberg, Papsin and Gordon2014). Other authors emphasize that children with HL who wear CIs and/or HAs (5–10 years old) are less accurate than typically hearing children when tapping in synchrony to both simple and complex rhythms, despite similar levels of motor variability when freely tapping (Hidalgo et al., Reference Hidalgo, Zécri and Pesnot-Lerousseau2021). In another study, children with CIs (median age 11.25 years old, IQR 5.58) performed at chance in a nonverbal rhythm discrimination task on average, but individual scores did not correlate with other auditory skills, nonverbal intelligence, nor grades in music class (Stabej et al., Reference Stabej, Smid and Gros2012). Taken together, it appears that temporal cues in nonverbal rhythmic stimuli are at least partially available to children with HL but that aspects of rhythmic processing are nonetheless impeded or delayed in comparison to typically hearing children – in particular, when rhythmic stimuli are more complex or incorporate changes in pitch (Darrow, Reference Darrow1984; Roy et al., Reference Roy, Scattergood-Keepper and Carver2014). Data from EEG reveal a similar pattern of results: When perceiving temporal deviations in musical rhythmic stimuli, children and adolescents with CIs produce a mismatch negativity, but it is reduced in magnitude and appears at a slower latency in comparison with typically hearing children (Petersen et al., Reference Petersen, Weed and Sandmann2015; Torppa et al., Reference Torppa, Salo and Makkonen2012). The heterogeneity of the samples in these studies and the varying levels of complexity and naturalism of the stimuli employed, however, preclude firm conclusions, and I will discuss further evidence regarding nonverbal rhythm perception in adults with HL in the next section (see also Shukor et al., Reference Shukor, Han, Lee and Seo2021, for a systematic review of musical interventions for children with HL).
42.3.2.2 Post-Lingual HL and Speech Rhythm Perception and Production in Adults
This section focuses on adults who primarily lost their hearing post-lingually, meaning that they had at least some experience with audible prosody and speech rhythm prior to their HL onset; however, acquired HL is associated with extensive changes to the neural architecture that supports central auditory processing, both within canonical auditory areas and across the entire brain (Glick and Sharma, Reference Glick and Sharma2017; Griffiths et al., Reference Griffiths, Lad and Kumar2020; Peelle and Wingfield, Reference Peelle and Wingfield2016). Hence, the availability and/or perceptual weighting of previously salient speech rhythm cues is likely to change over the lifetime of an individual with HL, and this probably also varies between individuals who differ in their hearing history and underlying etiology. I begin, as in the previous section, by discussing the perception of speech rhythm in adults with HL. I continue with production, although relatively few studies have investigated changes in vocal prosody or rhythm in adults with post-lingual HL. I then discuss the complementary literature on musical rhythm perception in HL, before turning to the final section, which deals with ageing-specific aspects of speech rhythm processing.
42.3.2.2.1 Perception of Speech Rhythm by Adults with Post-lingual HL
In an experiment using controlled, isolated stress contrasts, adult CI users did not differ from typically hearing controls when discriminating syllabic stress based on duration cues; however, they did perform significantly worse when stress cues consisted of changes in intonation or intensity (Meister et al., Reference Meister, Landwehr, Pyschny, Wagner and Walger2011). In the same study, the participants then completed a stress identification task with naturally produced stimuli in sentence form – for this more complex and realistic task, the CI users showed significantly poorer discrimination than the controls, and sensitivity to duration did not correlate with performance; however, there was an advantage for CI listeners who could better discriminate stress using a combination of intonation and intensity cues (Meister et al., Reference Meister, Landwehr, Pyschny, Wagner and Walger2011). Another study found that adults with CIs require substantially larger changes in fundamental frequency (F0) to identify pitch accents in multisyllabic words in comparison to adults with typical hearing (Dincer D’Alessandro and Mancini, Reference Dincer D’Alessandro and Mancini2019). Device-related differences in intonation perception are similar to those seen in children, such that adults who use both a CI and an HA have better perception of intonation, syllable stress, and emphatic stress than when using a CI alone (Most et al., Reference Most, Harel, Shpak and Luntz2011). Finally, adults with uncorrected HL (i.e., no CI or HA use) were found to better identify syllabic stress when the target was surrounded by speech envelope-modulated noise, as opposed to in the original, unprocessed sentence or when presented in isolation (Barac-Cikoja and Revoile, Reference Barac-Cikoja and Revoile1996). This study is intriguing in that it suggests a facilitating effect of prosodic context, but a cost of fine-grained phonetic and/or semantic processing, for adults with HL when they explicitly attend to speech rhythm cues.
The effects of specific properties of rhythm in speech have also been studied in the context of HL. For instance, similarly to typically hearing control participants, adults with CIs benefit from predictable patterns of syllabic stress, known in the literature as metrical patterns, during speech in noise perception (Perry and Kwon, Reference Perry and Kwon2015; Spitzer et al., Reference Spitzer, Liss, Spahr, Dorman and Lansford2009). Older adults with and without HL appear to use metrical rhythmic patterns similarly to younger adults when perceiving speech in noise (Woodfield and Akeroyd, Reference Woodfield and Akeroyd2010). There may be a relationship, at least in typically hearing adults, between the ability to perceive speech in noise and sensitivity to metric cues (Borrie et al., Reference Borrie, Baese-Berk, Van Engen and Bent2017). Awareness of pitch-based syllabic stress is associated with greater speech in noise perception among CI and typically hearing listeners (Dincer D’Alessandro and Mancini, Reference Dincer D’Alessandro and Mancini2019). In fact, sensitivity to rhythm more generally has also been linked with speech in noise perception. For instance, nonverbal rhythm – but not pitch or timbre – processing ability significantly predicted speech in noise perception by adults with CIs (Leal et al., Reference Leal, Shin and Laborde2003). Nonverbal rhythm perceptual ability also correlates with superior speech in noise understanding in typically hearing adults (Slater et al., Reference Slater, Kraus and Woodruff Carr2018; Slater and Kraus, Reference Slater and Kraus2016; Yates et al., Reference Yates, Moore, Amitay and Barry2019).
42.3.2.2.2 Production of Speech Rhythm by Adults with Post-lingual HL
Adults who acquire HL later in life may show changes in produced speech rhythm that include excessive lengthening of vowels and abnormal stress patterns (Cowie and Douglas-Cowie, Reference Cowie, Douglas-Cowie, Lutman and Haggard1983; Lane and Webster, Reference Lane and Webster1991; Plant and Hammarberg, Reference Plant and Hammarberg1983). Case studies suggest that, after cochlear implantation, objectively measured and listener-rated speech rhythmic patterns, such as the differentiation between stressed and unstressed syllables, improve (Economou et al., Reference Economou, Tartter, Chute and Hellman1992; Leder et al., Reference Leder, Spitzer and Milner1986; Tartter et al., Reference Tartter, Chute and Hellman1989). The basis of these changes is poorly understood, but CI users with post-lingual HL provide a unique opportunity for researchers to understand the role of auditory feedback in speech production more generally (Perkell, Reference Perkell2012; Ubrig et al., Reference Ubrig, Goffi-Gomez and Weber2011). Although CIs are thought to transmit temporal, in comparison to spectral, speech properties quite well, post-lingual CI listeners still have poorer temporal resolution, as measured via gap detection, than typically hearing listeners (Blankenship et al., Reference Blankenship, Zhang and Keith2016; Cesur and Derinsu, Reference Cesur and Derinsu2020; Duarte et al., Reference Duarte, Gresele and Pinheiro2016) – if better temporal resolution than pre-lingual CI recipients (Wei et al., Reference Wei, Cao, Jin, Chen and Zeng2007). Hence, CI speakers’ variable articulatory strategies may reflect not only the absence of auditory feedback during the pre-implantation period but the temporally degraded nature of the information provided by their device post-implantation.
42.3.2.2.3 Musical Rhythm Perception and Production by Adults with HL
As with the literature concerning children, the evidence for a general deficit in musical rhythm perception in adults with HL is mixed. Some studies report similar performance in rhythm perception across typically hearing and CI-listener groups (e.g., Brockmeier et al., Reference Brockmeier, Fitzgerald and Searle2011; Limb et al., Reference Limb, Molloy, Jiradejvong and Braun2010). A study comparing adults with post-lingual HL who used either HAs or CIs found them to perform similarly in a rhythm discrimination task (Looi et al., Reference Looi, McDermott, McKay and Hickson2008). Another experiment compared CI listeners to typically hearing listeners, although the control group in this case was much younger and more musically trained than the CI group (Kong et al., Reference Kong, Cruz, Jones and Zeng2004). There was no difference in performance on the basis of tempo discrimination but mixed results for CI listeners in rhythmic pattern identification, with particular difficulty associated with complex melodic rhythmic stimuli (Kong et al., Reference Kong, Cruz, Jones and Zeng2004). In another study examining production, adult CI users were observed to synchronize their movements to non-pitched drum rhythms as well as they could to a simpler, recurring tone, as well as a visual timing cue (Phillips-Silver et al., Reference Phillips-Silver, Toiviainen and Gosselin2015). Their sensorimotor timing was poorer than typically hearing controls, however, and they also tended to struggle more with more complex rhythmic stimuli that also incorporated changes in pitch.
It is sometimes assumed that timing information (e.g., the beat in music) is adequately available to most CI listeners (McDermott, Reference McDermott2004); however, an important limitation to the current literature on nonverbal rhythm perception with CIs is that stimuli complexity is rarely parameterized or formally compared within experiments. As a recent review notes, “many of the studies regarding CIs and rhythm perception utilize relatively simple perception tasks, such as basic pattern reproduction or sound stimuli that isolate rhythmic information” (Jiam and Limb, Reference Jiam and Limb2019:26). The few studies that have included both simple as well as more complex stimuli report performance differences across these conditions within CI listeners (Gfeller et al., Reference Gfeller, Woodworth, Robin, Witt and Knutson1997; Kong et al., Reference Kong, Cruz, Jones and Zeng2004; Phillips-Silver et al., Reference Phillips-Silver, Toiviainen and Gosselin2015). For example, adult CI listeners achieved scores similar to typically hearing controls in a simple rhythm perception task, but had significantly poorer performance in a more complex temporal patterning task that the authors suggest may better convey “aspects of musical experience such as phrasing, accent, and complex rhythmic structure” (Gfeller et al., Reference Gfeller, Woodworth, Robin, Witt and Knutson1997:259). Unlike the studies of young CI users mentioned previously, EEG studies investigating musical rhythm perception in adult CI users have not found a robust mismatch negativity to temporal deviants (Sandmann et al., Reference Sandmann, Kegel and Eichele2010; Timm et al., Reference Timm, Vuust and Brattico2014). Given this measure was present in children and adolescents, albeit reduced in comparison to typically hearing participants, the adult data may reflect differences in device advances and age of implantation, musical enjoyment and listening habits, or life experience as a result of changing attitudes towards HL and musical participation. Together, these inconsistencies across studies make it difficult to assess which temporal cues are or aren’t well conveyed by CIs, let alone what commonalities may be found across verbal versus nonverbal rhythm perception. Future work should clarify whether and how musical rhythm perception changes after HL, but if rhythm sensitivity can be trained in adults, it may serve as a specific, operationalizable target for speech-focused interventions as an alternative to general music or dance training, for example.
42.3.2.3 Speech Rhythm and Ageing
Age-related HL is associated with changes throughout the auditory system, from the periphery to the cortex (Peelle and Wingfield, Reference Peelle and Wingfield2016), and some aspects of temporal processing may diminish independently of sensorineural HL (Ajith Kumar and Sangamanatha, Reference Ajith Kumar and Sangamanatha2011; Füllgrabe et al., Reference Füllgrabe, Moore and Stone2015). As many older adults are likely to have some degree of HL, especially at higher frequencies, it is important to consider the interaction between HL and changes to central temporal processing associated with older populations. For example, psychophysical experiments show that temporal resolution – typically measured using silent gap detection tasks – as well as sensitivity to dynamic temporal properties, such as amplitude modulation, decline with age (see Walton, Reference Walton2010, for a review).
There are also ageing-related differences in the neural response to nonverbal rhythmic or temporally structured sounds (Henry et al., Reference Henry, Herrmann, Kunke and Obleser2017; Herrmann et al., Reference Herrmann, Maess and Johnsrude2023; Herrmann and Butler, Reference Herrmann and Butler2021; Parthasarathy et al., Reference Parthasarathy, Bartlett and Kujawa2019). For instance, the neural response in older, typically hearing adults to temporally regular, amplitude-modulated noise (4 Hz) is heightened in comparison to younger adults (Herrmann et al., Reference Herrmann, Buckland and Johnsrude2019). This hyper-responsiveness was observed in cortical areas associated with low-level auditory processing; yet, when examining a different neural marker that is associated with the higher-order representation of temporal structure, the authors found it to be suppressed in comparison to younger adults (Herrmann et al., Reference Herrmann, Buckland and Johnsrude2019). This may suggest that difficulties with temporal processing in ageing are not strictly related to a degraded representation of the target temporal structure but rather the susceptibility to irrelevant or intrusive maskers. For example, older and younger typically hearing adults performed a task wherein a prosody-like rhythmic pattern of modulated noise was identified against randomly modulated distractor noise with matched temporal statistics; despite typical hearing, the older adults were less accurate than the younger adults, except for in a control condition wherein targets were presented in isolation without distracting noise – in which case, the groups did not differ (Divenyi and Brandmeyer, Reference Divenyi and Brandmeyer2003). Hence, one possible function of speech rhythm for enhancing speech intelligibility in noise could be related to the top-down inhibition of unwanted noise related to over-responsive sensory processing, as opposed to the allocation of neural-cognitive resources towards anticipated, perceptually salient events in the future (Henry and Herrmann, Reference Henry and Herrmann2014). The balance between these listening strategies could shift with ageing and/or the temporal predictability of the target versus distractor. Explicit attention and task demands likely also have some part to play (Henry et al., Reference Henry, Herrmann, Kunke and Obleser2017). For example, a recent study using EEG found that the neural response to deviations in syllabic stress was larger in older in comparison to younger adults; however, in that study, participants were instructed to ignore auditory stimuli and were visually distracted by an unrelated, silent film (Giroud et al., Reference Giroud, Keller, Hirsiger, Dellwo and Meyer2019). More work is needed to understand how target-tracking versus noise-inhibiting mechanisms may interact, and whether they can be experimentally dissociated in the context of attentive speech rhythm perception.
42.4 Discussion
42.4.1 Future Directions for the Rehabilitation of Speech Rhythm in HL
For individuals with HL, engagement with speech rhythm depends on complex, intersecting factors. These factors can include the underlying cause of the HL, its onset relative to language acquisition, and which forms of amplification are used (if any), in addition to numerous other determinants. What is clear is that there is no singular experience of HL. As this chapter has discussed, HL may affect the perception of speech timing from the inner ear to the cortex, and individual differences in sensitivity to temporal cues and rhythmic structure could also help to explain why outcomes in functional hearing differ so much across listeners, irrespective of audiometry. Finally, HL can be further complicated by ageing, which is accompanied by cascading changes throughout the central nervous system that also affect temporal processing. In general, the empirical evidence surveyed in this chapter suggests that many people with HL encounter difficulties involving the perception and production of speech rhythm, but this is unlikely to be caused by the complete absence of timing information, particularly for listeners with CIs. Rather, in accordance with the literature examining musical rhythm perception, it appears that the greatest challenges for people with HL arise under ecological conditions, namely, when temporal patterning and structure represent just one facet of a multidimensional, sensorially rich percept – take, for example, multi-party conversational speech in a busy café. Hence, it is crucial that researchers make every effort to incorporate realism into experimental stimuli moving forward.
42.4.1.1 Multimodal Cues for Speech Rhythm
Despite the aforementioned complexity and inter-individual differences in HL, preliminary interventions involving rhythm training show some promise for improving speech and language in children and adolescents (León Méndez et al., Reference del Carmen León Méndez, Fernández García and Daza González2023), and the observed correlations between nonverbal rhythm processing and speech in noise perception in adults (e.g., Slater et al., Reference Slater, Kraus and Woodruff Carr2018) invite further study. The possibility that improving rhythm skills could support functional hearing is exciting, but substantial work is needed to clarify the nature of incidentally found relationships, to establish causality, and to show that rhythm-based interventions will generalize across untrained materials as well as over time. Other forms of rehabilitation could also incorporate speech timing more explicitly; for instance, co-speech gesture may represent a rich source to facilitate speech perception in HL, especially for speech in noise understanding. Although gesture has been identified as a potential target for training or intervention (Sparrow et al., Reference Sparrow, Lind and van Steenbrugge2020), rhythm and prosodic aspects of gesture have received comparatively less attention than their semantic or representational content (Prieto et al., Reference Prieto, Cravotta, Kushch, Rohrer and Vilà-Giménez2018). Previous research into audiovisual speech suggests prosodic processing, as well as speech intelligibility, is enhanced when rhythmic visual cues are also present (Dohen and Loevenbruck, Reference Dohen and Loevenbruck2009; Krahmer and Swerts, Reference Krahmer and Swerts2007; Peña et al., Reference Peña, Langus, Gutiérrez, Huepe-Artigas and Nespor2016). Moreover, adults with CIs benefit more than typically hearing adults from visual input in intonation perception (Lasfargues-Delannoy et al., Reference Lasfargues-Delannoy, Strelnikov, Deguine, Marx and Barone2021). This suggests that, together with lip-reading and other dynamic visual cues, gesture awareness could possibly benefit listeners by, for instance, guiding auditory rhythmic expectations, or providing additional prosodic information to repair misunderstandings. Similarly, vibro-tactile stimulation may also enhance access to speech rhythm as a complementary perceptual representation (Guilleminot and Reichenbach, Reference Guilleminot and Reichenbach2022).
42.5 Conclusion
HL is one of the most common disabilities globally, and with the proportion of older adults increasing, its incidence is projected to grow (Haile et al., Reference Haile, Kamenov and Briant2021). As scientific research into speech rhythm develops and expands, the scholarly community should account for differences – audiological, cognitive, and developmental, among others – across listeners, as well as inequalities in access to hearing care and devices. This is critical when we consider that rhythm is cross-modal and multisensory, making it amenable, as a domain, to different forms of sensory disability and underscoring its promise as a target or tool for rehabilitation. Yet, much more can be done to understand how rhythm is processed and experienced across individuals, and how best to rehabilitate speech rhythm perception and production remains an open question. The challenge, therefore, lies with speech rhythm researchers to consider the full breadth of human hearing ability and individual listener experiences when planning our programs for the future.
Summary
HL affects many people worldwide, but how speech rhythm is perceived and produced by people with HL remains poorly understood. This chapter draws from an interdisciplinary literature spanning psychology, neuroscience, linguistics, and clinical studies to form a broad overview of speech rhythm in auditory disability.
Implications
Empirical evidence suggests that expressive and receptive experiences of speech rhythm differ on the basis of hearing status, and this variation may also interact with other changes in central temporal processing, such as those associated with ageing. Researchers should, therefore, account for these forms of disability and difference when modelling and developing new theories concerning speech rhythm.
Gains
Speech rhythm in the context of HL has received relatively little attention, and the relevant empirical evidence is yet to be fully integrated and synthesized across disciplinary boundaries. Understanding how speech rhythm is perceived and produced by people with HL will help speech and hearing scientists to better understand its functional role, and may pave the way for future rhythm-based clinical interventions.
43.1 Overview
Melodic intonation therapy (MIT) is a music-based treatment for aphasia that has been in use for about 50 years, implemented in numerous languages and adapted in a variety of ways (Albert et al., Reference Albert, Sparks and Helm1973; Van der Meulen et al., Reference Van der Meulen, Van De Sandt-Koenderman, Heijenbrok, Visch-Brink and Ribbers2016; Zhang et al., Reference Zhang, Yu and Teng2021; Zumbansen et al., Reference Zumbansen, Peretz and Hébert2014a). Research addressing the efficacy of MIT has mostly consisted of case studies, case series, and other single-subject designs, but there are also a small number of randomized controlled trials (RCTs) as well as some systematic reviews and meta-analyses (Haro-Martínez et al., Reference Haro-Martínez, Pérez-Araujo, Sanchez-Caro, Fuentes and Díez-Tejedor2021; Popescu et al., Reference Popescu, Stahl and Wiernik2022; Van der Meulen et al., Reference Van der Meulen, Van De Sandt-Koenderman and Ribbers2012, Reference Van der Meulen, Van De Sandt-Koenderman, Heijenbrok, Visch-Brink and Ribbers2014, Reference Van der Meulen, Van De Sandt-Koenderman, Heijenbrok, Visch-Brink and Ribbers2016; Zumbansen and Tremblay, Reference Zumbansen and Tremblay2019). Despite the evidence, it is still not clear which of the numerous elements of the treatment are important, for whom they work best, and how much improvement can be expected for a given person with aphasia (PWA) when MIT is implemented. This chapter provides a brief review of what MIT is and the evidence for its effectiveness, and then addresses why and for whom it works. The main focus of the chapter is on MIT’s treatment ingredients, with particular attention to the rhythm and timing aspects of the treatment. Finally, a framework is presented for systematically considering the ingredients of MIT, both in clinical practice and research.
43.2 What Is MIT?
MIT was first presented in the early 1970s as a treatment for severe nonfluent aphasia. Based on the long-standing clinical observation that people with aphasia can often produce more words when singing than when speaking, MIT was developed to support patients in singing short phrases in a simplified way (Albert et al., Reference Albert, Sparks and Helm1973; Sparks et al., Reference Sparks, Helm and Albert1974). The standard MIT protocol incorporates basic musical elements – including singing on a limited number of pitches (intoning), a simplified rhythm, and tapping the left hand along with the rhythm – to facilitate the production of target utterances. The treatment protocol consists of a structured series of steps, with decreasing clinician support over time. For each target utterance, the PWA progresses from watching and listening while the clinician hums and then intones the utterance, to intoning in unison with the clinician, and through a series of steps that ends with the PWA intoning the utterance in response to a question from the clinician. Throughout these steps, the clinician guides the PWA to tap their left hand to the rhythm of the utterance (Sparks and Holland, Reference Sparks and Holland1976). Eventually, the PWA would be encouraged to transition from intoning to using exaggerated prosody, and then regular spoken language. The original goal of MIT was improved propositional speech, an increased ability to use spoken language in a functional and communicative way (Helm-Estabrooks and Albert, Reference Helm-Estabrooks and Albert2004; Sparks, Reference Sparks and Chapey2008).
43.2.1 Effectiveness Evidence: Does It Work?
For decades after MIT was developed, the research studies evaluating its effectiveness were virtually all case studies or case series. Some of the early studies identified factors that differentiated treatment responders from nonresponders, showing improvement in at least some of the participants (Naeser and Helm-Estabrooks, Reference Naeser and Helm-Estabrooks1985; Sparks et al., Reference Sparks, Helm and Albert1974). Later small-sample and case studies continued to show treatment effects of MIT, demonstrating effects on trained utterances, generalized improvement on standardized measures of language function, or generalization to propositional speech tasks such as conversation or picture description (e.g., Curtis et al., Reference Curtis, Nicholas, Pittmann and Zipse2020; Hough, Reference Hough2010; Wilson et al., Reference Wilson, Parsons and Reutens2006; Zipse et al., Reference Zipse, Norton, Marchina and Schlaug2012; Zumbansen et al., Reference Zumbansen, Peretz and Hébert2014b). However, these studies were often not well controlled, and some were conducted in the subacute phase, when spontaneous neurological recovery was likely a contributing factor to the observed improvements (Popescu et al., Reference Popescu, Stahl and Wiernik2022).
In more recent years, research studies considered to be higher-level evidence, including RCTs, systematic reviews, and meta-analyses, have addressed the efficacy of MIT. Van der Meulen et al. conducted two RCTs including participants with severe nonfluent aphasia, the first with PWAs in the subacute phase and the second with PWAs in the chronic phase (Reference Van der Meulen, Van De Sandt-Koenderman, Heijenbrok, Visch-Brink and Ribbers2014, Reference Van der Meulen, Van De Sandt-Koenderman, Heijenbrok, Visch-Brink and Ribbers2016). In the subacute phase, PWAs treated with MIT showed significantly more improvement on repetition of both trained and untrained utterances compared to deferred-treatment control participants, and they also showed evidence of better generalization to functional communication. In the chronic phase, the participants treated with MIT showed more improvement on trained utterances than the no-treatment control group but did not show robust evidence of generalization to other utterances or tasks, and gains were not maintained at a six-week follow-up. In a systematic review of four RCTs, Haro-Martínez et al. (Reference Haro-Martínez, Pérez-Araujo, Sanchez-Caro, Fuentes and Díez-Tejedor2021) found that MIT results in improved repetition but not auditory comprehension, and there is less robust evidence that it leads to improved functional communication. In the most comprehensive meta-analysis to date, Popescu et al. (Reference Popescu, Stahl and Wiernik2022) considered both group-level data from RCTs as well as individual participant data from case reports. They found that MIT produces small positive effects, mostly on repetition tasks, with greater effects for trained than untrained utterances. The authors concluded that MIT alone may not substantially improve everyday communication.
In summary, the evidence for MIT is rather modest. However, a noteworthy finding from the analysis conducted by Popescu et al. (Reference Popescu, Stahl and Wiernik2022) is that the treatment effect sizes are substantially larger for single-subject design studies than for RCTs, and effect sizes are larger for modified treatment protocols compared to the original protocol. The authors very reasonably interpret this as illustrating the importance of well-controlled studies to account for spontaneous recovery and other factors. Another possible interpretation, though, is that these results highlight the importance of adjusting the MIT protocol to the individual PWA. In contrast to the more rigid protocols typically used in RCTs, single-subject designs allow more flexibility for the clinician to respond to the behavior and preferences of the clients, as in clinical practice. This responsiveness is likely critical when treating complex behavior in a heterogeneous population.
43.2.2 Target Population: For Whom Does It Work?
Aphasia varies widely across individuals in terms of subtype, severity, etiology, and time post-onset. Other comorbid conditions also affect how aphasia is managed and which treatments are considered appropriate. Although there has not been extensive research on the factors associated with a meaningful treatment response to MIT, good treatment candidates are considered to be PWAs with a single left-hemisphere lesion resulting in nonfluent aphasia with severely limited verbal output, poor repetition even at the single-word level, relatively good auditory comprehension, poor articulation, good emotional stability, and adequate attentional capacity (American Academy of Neurology, 1994; Sparks, Reference Sparks and Chapey2008). Consistent with this, most treatment studies have focused on people with nonfluent aphasia, particularly moderate to severe Broca’s aphasia, though a minority of studies have included a wider variety of PWAs (García-Casares et al., Reference García-Casares, Barros-Cano and García-Arnés2022; Haro-Martínez et al., Reference Haro-Martínez, Pérez-Araujo, Sanchez-Caro, Fuentes and Díez-Tejedor2021). However, the response to MIT is variable even across individuals who fit the treatment criteria (Van der Meulen et al., Reference Van der Meulen, Van De Sandt-Koenderman, Heijenbrok, Visch-Brink and Ribbers2016).
One critical variable is whether a PWA also has apraxia of speech (AOS), a motor speech-planning disorder that manifests in slow, distorted speech with atypical prosody, and sometimes audible or visible articulatory groping. In contrast to aphasia, a disorder of language, AOS affects the planning and programming of the motor commands for speech articulation. While this is a reasonably clear distinction in theory, in practice the two conditions can be challenging to differentiate, particularly when aphasia results in phonemic errors, and the conditions often co-occur (Basilakos et al., Reference Basilakos, Yourganov and Den Ouden2017; Strand et al., Reference Strand, Duffy, Clark and Josephs2014). The developers of MIT initially reported that good responders exhibited “restricted but clearly articulated stereotype-like speech,” indicating that these initial patients may not have had AOS (Sparks et al., Reference Sparks, Helm and Albert1974, p. 312). The researchers did note, though, that this particular criterion should be interpreted with caution due to the small sample size in their study, and the treatment criteria have evolved over time to specify that the best candidates show “diminished articulatory agility and effortful initiation of speech production” – a description that applies to AOS (American Academy of Neurology, 1994, p. 566). It is noteworthy that at the time MIT was developed, “apraxia of speech” was a new term, coined by Darley et al., and AOS was not widely accepted as a disorder separate from aphasia (Darley et al., Reference Darley, Aronson and Brown1969). It therefore was not considered as a factor for treatment eligibility.
To date, most studies evaluating music-based treatments for aphasia more broadly include PWAs with a concomitant motor speech disorder, usually AOS (Zumbansen and Tremblay, Reference Zumbansen and Tremblay2019). In fact, the odds of a music-based intervention resulting in improved speech outcomes is approximately 21 times higher, and the odds of the treatment resulting in improved language outcomes about four times higher, in people with aphasia and a motor speech disorder compared to those with aphasia alone (Zumbansen and Tremblay, Reference Zumbansen and Tremblay2019). Furthermore, many of the elements included in MIT are commonly used in treatments for AOS, including slow rate, regular rhythm, and tapping or other means to enact pacing (Ballard et al., Reference Ballard, Wambaugh and Duffy2015; Wambaugh et al., Reference Wambaugh and Martinez2000). Adaptations of the standard MIT protocol, even when being used with the rationale of treating aphasia, often include additional elements suited to treating AOS, such as articulatory-kinematic approaches and/or the use of automated phrases to induce a correct production of a target word (e.g., Zhang et al., Reference Zhang, Yu and Teng2021). It seems, then, that having both AOS and aphasia may make one a particularly good candidate for MIT, although this depends on how exactly the treatment is used.
43.2.3 Outcome Measures: What Does “Working” Mean?
In addition to determining individual patient factors, it is also important to consider what “working” means. Across the literature, MIT has been used with different treatment goals and outcome measures. MIT was created as a treatment to stimulate the language system, with the aim of improving spontaneous, propositional language production (Sparks and Holland, Reference Sparks and Holland1976). It has also been used to train specific utterances, with the aim of creating a set of almost automatic phrases the PWA can use in functional ways; Zumbansen et al. have referred to this as “palliative” use (Reference Zumbansen, Peretz and Hébert2014a; also see Section 43.3.8.2). Indeed, a number of research studies have taken this approach, quite likely because it offers advantages in terms of research design and experimental control (e.g., Hough, Reference Hough2010; Stahl et al., Reference Stahl, Henseler, Turner, Geyer and Kotz2013). A third approach is to teach MIT as a strategy: The music-based elements are taught as a facilitation technique the PWA can use when they experience difficulty in everyday communication (see Zumbansen et al., Reference Zumbansen, Peretz and Hébert2014a, for an in-depth consideration of different treatment goals). This third approach is used in a French adaptation of MIT, thérapie mélodique et rhythmée (TMR) (Van Eeckhout and Bhatt, Reference Van Eeckhout and Bhatt1984).
These different treatment goals are reflected in different outcome measures (Van der Meulen et al., Reference Van der Meulen, Van De Sandt-Koenderman, Heijenbrok, Visch-Brink and Ribbers2016). For example, if MIT is being used to improve propositional language or as a compensatory technique to circumvent difficulties, outcomes should be evaluated with a measure that reflects improvement of functional communication. This may include analyses of language samples (using correct information units, CIUs, or similar, as in Schlaug et al., Reference Schlaug, Marchina and Norton2008) or self or caregiver report of functional changes. Alternatively or in addition, some studies have used standard language measures to evaluate improvement in naming, repetition, auditory comprehension, or other core language functions (e.g., Belin et al., Reference Belin, Van Eeckhout and Zilbovicius1996; Sparks et al., Reference Sparks, Helm and Albert1974). An important consideration is that standardized language assessments are typically developed to diagnose and classify aphasia rather than to document change, and they may not offer adequate sensitivity for this latter purpose. For studies evaluating MIT for palliative use, performance on trained phrases may be the primary outcome measure. Finally, some studies use measures at multiple levels – repetition of trained phrases, repetition of untrained phrases, and measures of functional language use (e.g., Curtis et al., Reference Curtis, Nicholas, Pittmann and Zipse2020; Zipse et al., Reference Zipse, Norton, Marchina and Schlaug2012). This last approach is the most thorough for documenting improvement at any level and evaluating generalization.
43.2.4 Treatment Theory: How Does It Work?
The developers of MIT proposed that exaggerated speech melody and left-hand tapping would engage the right hemisphere, since the right hemisphere was viewed as responsible for processing music and prosody, and since left-hand tapping requires activation of right-hemisphere motor areas. The right-hemisphere engagement would reduce reliance on the lesioned left hemisphere, but ultimately support recovery of left-hemisphere control of spoken language (Albert et al., Reference Albert, Sparks and Helm1973; Helm-Estabrooks and Albert, Reference Helm-Estabrooks and Albert2004; Sparks et al., Reference Sparks, Helm and Albert1974). This idea was bolstered by an early finding that good responders to MIT did not have right-hemisphere lesions, while poor responders sometimes did (Naeser and Helm-Estabrooks, Reference Naeser and Helm-Estabrooks1985).
More recently, it has been debated quite extensively in the literature whether neuroplastic changes in the right or the left hemisphere are correlated with MIT-induced behavioral changes. There is evidence for both structural and functional changes in the right hemisphere of PWAs who have responded to MIT, which the researchers interpreted as lending support to the idea that MIT spurs increased right-hemisphere involvement in spoken language production (e.g., Schlaug et al., Reference Schlaug, Marchina and Norton2008; Tabei et al., Reference Tabei, Satoh and Nakano2016; Wan et al., Reference Wan, Zheng, Marchina, Norton and Schlaug2014). However, other neuroimaging studies have found no increase in right-hemisphere activation and an increase in left-hemisphere activation, especially perilesional areas, during repetition of phrases using MIT techniques (Belin et al., Reference Belin, Van Eeckhout and Zilbovicius1996; Breier et al., Reference Breier, Randle, Maher and Papanicolaou2010; Laine et al., Reference Laine, Tuomainen and Ahonen1994). This has been viewed as evidence that spared left-hemisphere tissue supports MIT’s treatment effect. A recent systematic review concluded that the neural underpinnings of MIT-based improvement are complex and varied across individuals (García-Casares et al., Reference García-Casares, Barros-Cano and García-Arnés2022). It seems likely that neuroplastic changes are determined in part by how much left hemisphere is spared. If enough left-hemisphere tissue remains, the perilesional tissue may support MIT-mediated recovery, while if the lesion is very large, homologous right-hemisphere areas may offer the only potential for recovery (Wan et al., Reference Wan, Zheng, Marchina, Norton and Schlaug2014; Zumbansen et al., Reference Zumbansen, Peretz and Hébert2014a). (The idea that the neural basis of aphasia recovery depends on lesion size has previously been discussed in the context of other treatment approaches, e.g., Crosson et al., Reference Crosson, Moore and Gopinath2005.)
In addition to theories that address neuroplastic reorganization, other mechanisms for MIT-induced language recovery have been suggested (see Merrett et al., Reference Merrett, Peretz and Wilson2014, for an excellent review). These include activation of shared features of language and music, engagement of the mirror neuron system, and improvements to mood and motivation. These various theories are not necessarily distinct; for example, activating musical elements that overlap with aspects of language may drive neuroplastic change, recalling Luria’s idea of intersystemic reorganization (Reference Luria1970), where a damaged neural system is coupled with an intact one to promote improvement of the weaker system. The idea that MIT leverages prosody as a link between music and language is perhaps the most discussed theory, whether framed in terms of neurophysiology or cognitive models.
Within the field of rehabilitation more broadly, there have been efforts in the past decade to specify treatments in terms of their ingredients and how these ingredients effect change. Conceptual models of treatment theory and specification, and their application in clinical practice, are active areas of scholarship with implications for how clinicians conceive of, describe, apply, and measure the outcomes of interventions (Hart et al., Reference Hart, Dijkers and Whyte2019; Whyte et al., Reference Whyte, Dijkers and Hart2014; Zanca et al., Reference Zanca, Turkstra and Chen2019; also see Section 43.4.1). Accordingly, the following section considers the various treatment ingredients of MIT and how each of these may work to facilitate spoken-language production and promote aphasia recovery.
43.3 The Treatment Ingredients of MIT
Speculation about why and how MIT works has abounded because the treatment has many different elements, making multiple mechanisms of action possible. Some elements may work in parallel, synergistically, or even at odds with one another. Understanding these ingredients is of critical importance for tailoring the treatment to a particular individual. In the following sections, key treatment ingredients of MIT are discussed, including variations in how they are used and why they may work. Throughout, it is important to keep in mind the difference between the immediate effects of these techniques to promote language production in the moment versus generalization to spoken-language production beyond the treatment encounter – that is, facilitation effects versus treatment effects (Zumbansen et al., Reference Zumbansen, Peretz and Hébert2014a).
43.3.1 Rhythm
There is growing evidence that rhythm is a particularly important aspect of MIT. Using a beat-based rhythm as a facilitating technique, Stahl et al. (Reference Stahl, Kotz, Henseler, Turner and Geyer2011) concluded that PWAs do not benefit from singing more than from rhythmic speech during a repetition task, while Kershenbaum et al. (Reference Kershenbaum, Nicholas, Hunsaker and Zipse2019) found that rhythmic speech was more facilitating than singing in their sample of PWAs. Rhythm also seems to enhance treatment effects. In a scripted sentence-learning paradigm that shared some features of MIT, Quique et al. (Reference Quique, Evans, Ortega-Llebaría, Zipse and Dickey2022) demonstrated that sentence learning was improved by the addition of rhythmic beats to the audio track (all conditions were spoken, with none sung or intoned). Studies comparing melodic (sung) treatment conditions to rhythmically spoken ones have found comparable gains in trained utterances across the two conditions (Stahl et al., Reference Stahl, Henseler, Turner, Geyer and Kotz2013; Zumbansen et al., Reference Zumbansen, Peretz and Hébert2014b; also see Boucher et al., Reference Boucher, Garcia, Fleurant and Paradis2001, for a related finding). However, generalization to functional communication may be better with melodic than with rhythmically spoken treatment. Zumbansen et al. (Reference Zumbansen, Peretz and Hébert2014b) used a within-subjects design to compare three treatment conditions: melodic (rhythmically intoned, with hand tapping), rhythmically spoken (with hand tapping), and normally spoken. All participants made significant gains on trained phrases with all three treatments, but generalization to functional communication was only found after the melodic treatment.
Of course, “rhythmic” production can be realized in different ways. Early versions of MIT used quarter and eighth notes, respectively, for stressed and unstressed syllables (Sparks, Reference Sparks and Chapey2008). Later descriptions by the originators of MIT specified that productions should follow the “stress and rhythm patterns associated with normal speech” (Helm-Estabrooks and Albert, Reference Helm-Estabrooks and Albert2004, p. 224). TMR, a French version of MIT, uses two durations: longer for naturally stressed syllables and syllables of function words (which tend to be omitted in people with Broca’s aphasia), and shorter for all other syllables (Van Eeckhout and Bhatt, Reference Van Eeckhout and Bhatt1984; Zumbansen et al., Reference Zumbansen, Peretz and Hébert2014b). In contrast, some instantiations of MIT present all syllables with equal duration, lending the utterance a steady, metronomic quality (e.g., Curtis et al., Reference Curtis, Nicholas, Pittmann and Zipse2020). Many studies, though, do not comment on the rhythm used. (See Chapters 30, 33, and 40 for a consideration of how the rhythmic class of a language affects spoken-language learning in speakers without aphasia.)
Even when slightly more complex rhythms are used, the utterances likely adhere to a metrical pattern because each target utterance is repeated multiple times, both within and across steps. For example, the PWA has multiple attempts to intone the utterance in unison with the clinician (unison step). If successful, the PWA moves on to the next step, where they intone in unison with the clinician, who “fades out” and leaves the PWA to complete the utterance on their own (unison fade; Helm-Estabrooks and Albert, Reference Helm-Estabrooks and Albert2004). Across these two steps, the target utterance is typically repeated several times. When a motor action is cyclically repeated, it tends to adhere to a hierarchical timing structure, creating metrical levels (Cummins and Port, Reference Cummins and Port1998; Murton et al., Reference Murton, Zipse, Jacoby and Shattuck-Hufnagel2017).
Rhythmic production, repetition, and the meter that emerges result in expectation. Indeed, London has defined meter as “a stable and recurring pattern of hierarchically structured temporal expectations” (Reference London2002, p. 529). Regular timing of stressed syllables, adhering to a metrical structure, helps listeners predict when these syllables will occur and direct their attention accordingly (Pitt and Samuel, Reference Pitt and Samuel1990). This predictability makes it easier for listeners to entrain to the stimulus, aligning their motor actions – in this case, speech – with an external stimulus. In fact, speech stimuli that follow a simple metrical structure have been shown to facilitate accurate spoken-language production in people with aphasia and/or AOS (Aichert et al., Reference Aichert, Lehner, Falk, Späth and Ziegler2019; Kershenbaum et al., Reference Kershenbaum, Galassi, Shattuck-Hufnagel, Bachan and Zipse2024). At a neurophysiological level, rhythmically regular speech input may promote the entrainment of intrinsic neural oscillatory activity to the speech signal, allowing for the coupling of perception and production (Haegens and Zion Golumbic, Reference Haegens and Zion Golumbic2018; Large and Jones, Reference Large and Jones1999; see Chapters 3, 5, and 6). This may help with the organization of motor commands, perhaps targeting AOS in particular. Notably, treatments using metronome pacing, hand tapping, and other rhythmic elements have been described for AOS (Brendel and Ziegler, Reference Brendel and Ziegler2008; Mauszycki and Wambaugh, Reference Mauszycki and Wambaugh2008). A metrically regular context may also serve to prime words with lexical stress that fits the pattern, aiding retrieval of phonological word forms – an area of impairment across all subtypes of aphasia. This facilitation is analogous to how lyrics are better recalled when sung than when spoken (Kasdan and Kiran, Reference Kasdan and Kiran2018).
43.3.2 Rate
Rhythm is one way in which timing can be manipulated in MIT, and rate is another. The originators of MIT specified that a slow rate should be used (Helm-Estabrooks and Albert, Reference Helm-Estabrooks and Albert2004; Sparks, Reference Sparks and Chapey2008). Singing naturally tends to slow the rate of articulation (Racette, Reference Racette2006; Stahl and Kotz, Reference Stahl and Kotz2014). Laughlin et al. (Reference Laughlin, Naeser and Gordon1979) compared the number of phrases correctly produced during MIT under three conditions: spoken syllables < one second in duration, intoned syllables 1.5 seconds in duration, and intoned syllables two seconds in duration. The best results were observed with the slowest rate, a much slower rate than typically reported in MIT treatment studies. Rates reported in the literature include one second/syllable (Merrett et al., Reference Merrett, Tailby, Jackson and Wilson2019), 750 ms/syllable (Curtis et al., Reference Curtis, Nicholas, Pittmann and Zipse2020), and 600 or 1,200 ms, for unstressed non-functor syllables versus stressed syllables or functors (Zumbansen et al., Reference Zumbansen, Peretz and Hébert2014b). Many studies, however, do not specify the rate used.
A slow rate is helpful because it allows for more processing time for perceiving the model utterance, as well as for planning and executing articulatory commands (Stahl and Kotz, Reference Stahl and Kotz2014). This extra time may be beneficial when the right hemisphere is more involved in controlling spoken-language production, since this hemisphere is thought to operate at a slower timescale than the left (Poeppel, Reference Poeppel2003; Zatorre, Reference Zatorre2001). A slow rate may affect both language processing and speech planning, though the latter may be particularly important: A number of studies that use a slow rate with good effects, either as a treatment or facilitation technique, have outcome measures that evaluate speech accuracy, such as percentage of syllables correct (Boucher et al., Reference Boucher, Garcia, Fleurant and Paradis2001; Kershenbaum et al., Reference Kershenbaum, Nicholas, Hunsaker and Zipse2019; Laughlin et al., Reference Laughlin, Naeser and Gordon1979; Stahl et al., Reference Stahl, Kotz, Henseler, Turner and Geyer2011). Furthermore, along with a regular rhythm, a slowed rate has been shown to increase articulatory accuracy in people with AOS, who typically also have aphasia (Mauszycki and Wambaugh, Reference Mauszycki and Wambaugh2008; Wambaugh and Martinez, Reference Wambaugh and Martinez2000).
43.3.3 Tapping
Another timing-related element of MIT is tapping. In the standard MIT protocol, the clinician sits across from the PWA, with their right hand over the PWA’s left hand, so that the clinician can pick up the patient’s hand and tap it on the tabletop. Protocols differ in whether tapping is once for each syllable, or only on stressed syllables (Helm-Estabrooks and Albert, Reference Helm-Estabrooks and Albert2004; Sparks and Holland, Reference Sparks and Holland1976). As the PWA advances through the MIT levels and learns the procedure, the clinician may discontinue guiding the patient’s tapping and simply monitor that they continue to tap correctly (Sparks, Reference Sparks and Chapey2008). Other variations of MIT (e.g., TMR) allow for tapping with other parts of the body or do not include tapping at all (Zumbansen et al., Reference Zumbansen, Peretz and Hébert2014a). No-tapping variations of MIT were developed in response to observations of individual patients; there is preliminary evidence that tapping may not always be beneficial in MIT, and some PWAs respond better without it (Curtis et al., Reference Curtis, Nicholas, Pittmann and Zipse2020; Hough, Reference Hough2010). As with rate and rhythm, many studies do not provide a description of how tapping was implemented.
Tapping is thought to work by activating motor regions in the right hemisphere. In particular, the cortical representation of the articulators is near regions representing the hand. Tapping may prime a sensorimotor network that integrates perception and action and is useful for producing spoken language (Gentilucci and Dalla Volta, Reference Gentilucci and Dalla Volta2008; Norton et al., Reference Norton, Zipse, Marchina and Schlaug2009; Schlaug et al., Reference Schlaug, Marchina and Norton2008). Related to this, tapping to an isochronous or otherwise predictable rhythm may act to promote pacing, shown to have benefits for motor speech disorders (Brendel and Ziegler, Reference Brendel and Ziegler2008). Furthermore, tapping can be viewed as a simplified gesture, specifically beat gesture, and gestural planning is closely related to prosodic planning (Rohrer et al., Reference Rohrer, Delais-Roussarie and Prieto2023). Emphasizing prosody with gesture may promote spoken-language production.
43.3.4 Pitch Modulation
Pitch modulation has often been viewed as the core feature of MIT (Norton et al., Reference Norton, Zipse, Marchina and Schlaug2009). As noted above, though, the rhythmic elements of the treatment have been more strongly linked to the facilitation associated with MIT-based techniques. Pitch modulation has been used in various ways in different adaptations of MIT, with the most common versions using either two notes or simple melodies. Specified intervals for the two-note variations have included a minor third or a fourth (Norton et al., Reference Norton, Zipse, Marchina and Schlaug2009; Zumbansen et al., Reference Zumbansen, Peretz and Hébert2014b). In English, stressed syllables are produced on the higher pitch and unstressed on the lower, while the dominant French adaptation of MIT, TMR, uses the higher pitch to highlight functor words (typically omitted by people with Broca’s aphasia) as well as stressed syllables (Albert et al., Reference Albert, Sparks and Helm1973; Van Eeckhout and Bhatt, Reference Van Eeckhout and Bhatt1984). Another key consideration related to pitch modulation is whether and how Sprechgesang (“speech song”) is implemented. This technique uses an exaggerated rhythm but speech-like intonation and is introduced in the later stages of MIT (Level III or IV, depending on the protocol used), as a way to transition from intoning to normal speech (Helm-Estabrooks and Albert, Reference Helm-Estabrooks and Albert2004; Sparks, Reference Sparks and Chapey2008; Sparks and Holland, Reference Sparks and Holland1976). Some MIT treatment studies use Sprechgesang (Hough, Reference Hough2010; Van der Meulen et al., Reference Van der Meulen, Van De Sandt-Koenderman, Heijenbrok, Visch-Brink and Ribbers2014, Reference Van der Meulen, Van De Sandt-Koenderman, Heijenbrok, Visch-Brink and Ribbers2016; Zhang et al., Reference Zhang, Yu and Teng2021) while others do not (Curtis et al., Reference Curtis, Nicholas, Pittmann and Zipse2020; Wilson et al., Reference Wilson, Parsons and Reutens2006; Zumbansen et al., Reference Zumbansen, Peretz and Hébert2014b).
Like many of the other elements of MIT, pitch modulation was included to promote right-hemisphere involvement, since the right hemisphere was seen as dominant in processing music and prosody (Sparks et al., Reference Sparks, Helm and Albert1974). Singing has also been noted to slow articulatory rate, as mentioned above (Section 43.3.2), and promote constant voicing across syllables, both of which have been mentioned as potentially important (Helm-Estabrooks and Albert, Reference Helm-Estabrooks and Albert2004; Norton et al., Reference Norton, Zipse, Marchina and Schlaug2009). These manipulations of rate and voicing may primarily affect motor speech rather than language. On the other hand, in modified MIT protocols that include more complex melodies and even instrumental accompaniment, the melody may serve as a mnemonic device to aid in retrieval of the phonological word forms, rather than to facilitate motor speech function (Baker, Reference Baker2000).
43.3.5 Unison Production
Speaking along with another person or a recording, commonly referred to as unison or choral production, is a component of a number of aphasia treatments besides MIT, whether spoken or sung (Kershenbaum et al., Reference Kershenbaum, Galassi, Shattuck-Hufnagel, Bachan and Zipse2024). It is used to promote fluent, accurate productions in other clinical populations, including people who stutter and people with Parkinson’s disease (Juste et al., Reference Juste, Sassi, Costa and De Andrade2018; Kiefte and Armson, Reference Kiefte and Armson2008; Ritto et al., Reference Ritto, Costa, Juste and de Andrade2016). The facilitating effect of unison production for PWAs has been documented across a few studies (Fridriksson et al., Reference Fridriksson, Hubbard and Hudspeth2012; Kershenbaum et al., Reference Kershenbaum, Nicholas, Hunsaker and Zipse2019, Reference Kershenbaum, Galassi, Shattuck-Hufnagel, Bachan and Zipse2024; Racette, Reference Racette2006). In the aphasia research literature more generally, unison production has been implemented in various ways. In some paradigms, PWAs listen to an utterance and then repeat it in unison (such that the target utterance is known in advance, e.g., Kershenbaum et al., Reference Kershenbaum, Nicholas, Hunsaker and Zipse2019), while in others, the PWAs speak along with utterances that are at least initially unfamiliar (such that they are quickly repeating what they hear, i.e., shadowing; Fridriksson et al., Reference Fridriksson, Hubbard and Hudspeth2012). Another important variable is whether the model utterance is audio-only or includes a view of the speaker’s mouth, as the latter can be facilitating (Fridriksson et al., Reference Fridriksson, Hubbard and Hudspeth2012). MIT relies on repetition so that the target utterance is known, and the clinician typically sits opposite the PWA so their face is visible during articulation.
Explanations for why speaking in unison is helpful for PWAs have included perception–action interactions, possibly involving mirror neurons, and synchrony with a model (Racette, Reference Racette2006; see Chapter 6). Cummins has examined synchronous speech in neurotypical adults without aphasia rather extensively, noting how precisely speakers can align their speech with one another (Reference Cummins2003). He has highlighted entrainment of oscillatory neural activity as a potential mechanism for speech entrainment, though allowed that models need to better account for the complex time structure of typical speech (Cummins, Reference Cummins2009, Reference Cummins2012). More recently, the ability of PWAs to synchronize their speech with a spoken model has been examined under different prosodic timing conditions: typical conversational timing, and beat-based metrical timing, where stressed syllables occur at regular intervals. Both PWAs and control speakers align their speech more precisely with the model in the metrical condition, and also produce a higher percentage of accurate syllables in this condition (Kershenbaum et al., Reference Kershenbaum, Galassi, Shattuck-Hufnagel, Bachan and Zipse2024). The metrical condition, similar to MIT, uses a predictable timing structure that does not rely as heavily on linguistic knowledge (e.g., syntax). This simple, predictable timing structure may allow PWAs to achieve better sensorimotor synchrony with the spoken model and more fully benefit from unison production. More work remains to be done to understand entrainment as a potential facilitating mechanism for PWAs.
43.3.6 Treatment Intensity
A key feature of MIT, as originally conceived, was its intensity: Sparks (Reference Sparks and Chapey2008) stipulated that treatment should take place twice daily. Numerous treatment studies have used high-intensity treatment, for example 1.5 hours/day, five days/week, for approximately 15 weeks (Schlaug et al., Reference Schlaug, Marchina and Norton2008); 30 minutes/day, five days/week, for eight weeks (Zhang et al., Reference Zhang, Yu and Teng2021); and five hours/week for six weeks (Van der Meulen et al., Reference Van der Meulen, Van De Sandt-Koenderman, Heijenbrok, Visch-Brink and Ribbers2014, Reference Van der Meulen, Van De Sandt-Koenderman, Heijenbrok, Visch-Brink and Ribbers2016). Three one-hour sessions/week is a fairly common intensity in MIT treatment studies (Curtis et al., Reference Curtis, Nicholas, Pittmann and Zipse2020; Hough, Reference Hough2010; Zumbansen et al., Reference Zumbansen, Peretz and Hébert2014b). Even this is considerably greater than what is typically used in aphasia treatment in clinical practice, at least in the US, and raises the question of whether promising evidence for MIT is driven in part by the high intensities used in treatment studies (Cavanaugh et al., Reference Cavanaugh, Kravetz and Jarold2021). In fact, across two RCTs, one in the subacute and one in the chronic phase of recovery, intensity was predictive of treatment response to MIT even when age, aphasia severity, and a variety of baseline language measures were not, although time post-onset was also predictive in the subacute phase (Van der Meulen et al., Reference Van der Meulen, Van De Sandt-Koenderman, Heijenbrok, Visch-Brink and Ribbers2014, Reference Van der Meulen, Van De Sandt-Koenderman, Heijenbrok, Visch-Brink and Ribbers2016; although see also Zumbansen and Tremblay, Reference Zumbansen and Tremblay2019). The importance of treatment intensity is one of the principles of neuroplasticity in rehabilitation, as described by Kleim and Jones (Reference Kleim and Jones2008): Sufficient intensity is required to induce neuroplasticity, and adequate treatment duration is critical for behavioral change (“use it and improve it”).
In this regard, the highly facilitating nature of MIT is critical: It makes intensive practice of spoken language both possible and palatable for many people with severe aphasia. Clinical researchers have noted that patients often find MIT motivating and even enjoyable (Merrett et al., Reference Merrett, Peretz and Wilson2014; Sparks et al., Reference Sparks, Helm and Albert1974; Van der Meulen et al., Reference Van der Meulen, Van De Sandt-Koenderman and Ribbers2012). For PWAs who struggle to say single words, the feeling of fluently intoning phrases is likely rewarding. Van der Meulen et al. (Reference Van der Meulen, Van De Sandt-Koenderman, Heijenbrok, Visch-Brink and Ribbers2016) noted that although aphasia treatment studies with higher intensity generally have greater attrition, their own RCT did not have any individuals drop out (Brady et al., Reference Brady, Kelly, Godwin, Enderby and Brady2016). In addition, the structure and repetition of MIT may make it suitable for home practice, a potentially important way to increase intensity in the face of limited provider availability and high treatment costs.
43.3.7 Gradual Progression
Another key feature of MIT is gradual progression through steps of increasing difficulty. Depending on the protocol used, MIT may include three or four levels of difficulty with progressively longer and more challenging utterances. Within each of the levels, the PWA proceeds through several steps for each utterance, with decreasing clinician support (Helm-Estabrooks and Albert, Reference Helm-Estabrooks and Albert2004; Sparks, Reference Sparks and Chapey2008). For example, in Level I (or II, depending on the protocol), there are five steps: (1) the clinician hums the utterance and intones it twice while tapping the PWA’s hand; (2) the clinician and PWA intone the utterance in unison while tapping; (3) the clinician and PWA intone in unison while tapping, but the clinician “fades out” partway through the utterance; (4) the clinician intones the utterance and the PWA repeats it immediately, with tapping for both productions; (5) the clinician intones a question and the PWA responds with the target utterance, with hand tapping. Some studies have used simplified protocols with just one level (e.g., Curtis et al., Reference Curtis, Nicholas, Pittmann and Zipse2020). However, gradual progression through steps with decreasing clinician support is central to MIT.
One major source of variation in treatment response is likely to be exactly how clinician support is implemented, what types of cues are used to facilitate utterance production, and when and how they are discontinued across the steps. For example, one MIT protocol says that in the unison-fade step (step 3 above), the clinician should not lip-synch the utterance after fading out (Helm-Estabrooks and Albert, Reference Helm-Estabrooks and Albert2004). This visual input can be very facilitating, so variation in how and whether it is used is likely quite important (Fridriksson et al., Reference Fridriksson, Hubbard and Hudspeth2012). This same protocol specifies to discontinue utterances not produced after four attempts. In practice, clinicians often use facilitation techniques such as placement cues, other articulatory-kinematic approaches, or written letters or words to help the PWA segment the target if they initially struggle with an utterance (e.g., Dunham and Newhoff, Reference Dunham and Newhoff1979). Such approaches may particularly address AOS.
Gradual progression through steps of increasing difficulty may work through errorless learning, a cognitive rehabilitation approach widely used to support learning in people with amnesia, that has also been used to treat PWAs (Middleton and Schwartz, Reference Middleton and Schwartz2012). In this approach, successful retrieval of a target behavior is practiced repeatedly to promote implicit, Hebbian learning of a desired response. In addition, the progression of MIT provides a motivating context for many repetitions of each utterance. The importance of repetition is a principle of neuroplasticity in rehabilitation (Kleim and Jones, Reference Kleim and Jones2008).
43.3.8 Utterances Targeted in Treatment
43.3.8.1 Types of Utterances
MIT was rooted in clinical observations that PWAs can often sing familiar songs when unable to speak, but this benefit seems due in part to song familiarity (Hébert et al., Reference Hébert, Racette, Gagnon and Peretz2003; Straube et al., Reference Straube, Schulz, Geipel, Mentzel and Miltner2008). A couple of studies have included utterance familiarity or automaticity as a variable (Hough, Reference Hough2010; Stahl et al., Reference Stahl, Kotz, Henseler, Turner and Geyer2011). Stahl et al. (Reference Stahl, Kotz, Henseler, Turner and Geyer2011) compared unison production of formulaic versus non-formulaic lyrics, where the former consisted of common social phrases judged to be automatized, while the latter were syntactically correct phrases likely to be novel. They found an advantage for formulaic lyrics, measured in percentage of syllables correct.
There is evidence that the production of formulaic utterances is supported by right-hemisphere and subcortical structures, making these utterances easier for people with left-hemisphere lesions and aphasia to produce (Van Lancker Sidtis, Reference Van Lancker Sidtis2012; Van Lancker Sidtis and Postman, Reference Van Lancker Sidtis and Postman2006). Stahl et al. (Reference Stahl, Henseler, Turner, Geyer and Kotz2013) speculated that intensive training of formulaic phrases may result in increased right-hemisphere activation, consistent with the idea that MIT works by shifting spoken-language processing to the right hemisphere (see Section 43.2.4). Another explanation for the advantage of formulaic utterances concerns motor speech: People with AOS typically show an advantage for automatic utterances relative to volitional ones (West et al., Reference West, Hesketh, Vail and Bowen2005).
43.3.8.2 Variety of Utterances
MIT was conceived of as a way to stimulate the language system, such that a wide variety of utterances should be used to avoid practice effects for particular utterances (Sparks, Reference Sparks and Chapey2008). Indeed, studies that have documented generalization to functional communication have often used many different utterances in treatment (Curtis et al., Reference Curtis, Nicholas, Pittmann and Zipse2020; Zipse et al., Reference Zipse, Norton, Marchina and Schlaug2012; Zumbansen et al., Reference Zumbansen, Peretz and Hébert2014b). In aphasia treatment more generally, using a variety of treatment targets and tasks has been associated with improved generalization (Nadeau et al., Reference Nadeau, Rothi, Rosenbek and Chapey2008).
In some cases, MIT may be used to train a relatively small set of utterances in people with severe aphasia, not with the aim of stimulating the language system more generally but rather to build a limited repertoire of functional phrases. As noted above (see Section 43.2.3), Zumbansen et al. (Reference Zumbansen, Peretz and Hébert2014a) have called this “palliative” use. In essence, the goal is to select utterances and train them until they become formulaic. This is more of a compensatory strategy than a true rehabilitative one. In this case, the treatment rationale would not justify using a wide variety of utterances in treatment.
43.4 Putting the Ingredients Together
MIT is a complex treatment with many potential active ingredients, each of which may interact with others. For example, unison production may be most facilitating at a slow, metrically regular rate that allows the PWA to more easily align their speech with the spoken model. The multifaceted nature of MIT can offer multiple opportunities for a mechanism to work: The slow rate, melodic line, formulaic phrases, and left-hand tapping may all increase engagement of right-hemisphere networks. In addition, some of the many ingredients may be able to work in various ways, potentially activating left-hemisphere perilesional tissue or right-hemisphere regions homologous to left-hemisphere speech and language areas. This may increase the potential that the treatment benefits a given PWA, regardless of whether they have a smaller left-hemisphere lesion with the potential for recovery mediated by left-hemisphere perilesional tissue, or whether the lesion is so large any recovery must rely on right-hemisphere areas (Merrett et al., Reference Merrett, Peretz and Wilson2014).
MIT may be especially powerful due to its ability to simultaneously address aphasia and AOS in an integrated way. The criteria for MIT candidacy describe severe Broca’s aphasia, which commonly co-occurs with AOS. These two conditions may interact. Failure to retrieve a phonological word form (an aphasic impairment) obviously affects the ability to prepare a speech motor plan for that word. However, once the phonological word form is activated – perhaps more weakly or intermittently than in a speaker without aphasia – any delay or disruption in motor speech planning may result in a missed opportunity to take advantage of the instance of successful lexical retrieval.
43.4.1 MIT as a Framework: What Works for Whom?
What works best on average is not necessarily what works best for a particular individual, especially in a heterogeneous population such as PWAs (even within the subpopulation of individuals who meet the criteria for MIT; see Section 43.2.2). In providing the first detailed protocol for MIT, the originators noted this came with the risk that it would be followed too rigidly, and they encouraged clinicians to modify the protocol to meet each individual’s needs, stating, “The clinical awareness and skill of the person providing clinical service should influence the form of that service” (Sparks and Holland, Reference Sparks and Holland1976, p. 288). Along these lines, Merrett et al. (Reference Merrett, Tailby, Jackson and Wilson2019) note the tension between standardization and customization of a treatment approach, and advocate for “standardized customization” (p. 431). MIT will likely be most powerful if used as a framework, with specific ingredients selected and adjusted for each individual.
Characterizing treatments is particularly complex in rehabilitation more generally. Interventions are behavioral, relying heavily on the interaction between patients and providers, and are typically focused on increasing function and life participation, which results in widely varied goals based on patients’ needs. This creates challenges for clinical effectiveness research, practice, and training (Hart et al., Reference Hart, Dijkers and Whyte2019). To define rehabilitation interventions in a way that allows for a balance of customization (tailoring the treatment to the patient’s needs) and standardization (following a fixed, replicable protocol), a taxonomy is needed (Hart et al., Reference Hart, Dijkers and Whyte2019). While a variety of different frameworks have been proposed, the rehabilitation treatment specification system (RTSS) offers the advantage of defining interventions in the context of treatment theory: Which aspect of function is the treatment targeting, which mechanism(s) of action can effect this change, and which treatment ingredients will be used (Van Stan et al., Reference Van Stan, Whyte and Duffy2021; Whyte et al., Reference Whyte, Dijkers and Hart2014)? Applying the RTSS to MIT is a promising way to organize the evidence pertaining to each ingredient, and highlight gaps for future research to address.
43.4.2 Research Design Considerations
Reviews of the evidence for MIT’s effectiveness often suggest that more and larger-scale RCTs are needed. Before undertaking such trials, critical individual factors that affect treatment responsiveness need to be better understood. Researchers can take advantage of the heterogeneity inherent to the population of PWAs by using single-subject and within-group research designs to understand varied treatment responses, relate these to individual factors, and explore mechanisms of action (Merrett et al., Reference Merrett, Tailby, Jackson and Wilson2019; Thompson, Reference Thompson2006). MIT treatment studies often describe the treatment protocol in a very cursory way, particularly in studies that include an imaging component. This makes it difficult to understand how the treatment worked. Treatment studies must carefully specify which ingredients are used and how they are implemented so that work can be replicated and variation across studies can be accounted for in later meta-analyses. Meta-analyses using individual participant data (IPD) are a useful means for combining data across studies while offering the flexibility to account for variation in participants and treatment factors (Popescu et al., Reference Popescu, Stahl and Wiernik2022; Zumbansen and Tremblay, Reference Zumbansen and Tremblay2019).
43.5 Conclusions
The facilitating techniques used in MIT can be striking in their ability to promote spoken-language production in people with severe aphasia. As a result, MIT has attracted considerable attention from clinical researchers. The numerous treatment ingredients incorporated into MIT make it a potentially flexible and powerful approach, but the heterogeneity inherent in the aphasia population, the range of different MIT protocols used, and the lack of specificity regarding how they are implemented has resulted in relatively weak evidence regarding which components work best for whom. A treatment taxonomy that specifies treatment targets, ingredients, and their mechanisms of action is a promising tool to better investigate MIT and implement it in clinical practice.
Summary
MIT is a music-based aphasia treatment with numerous potentially active treatment ingredients. Evidence suggests the rhythm and timing of the utterances used, along with unison production, are particularly important. A treatment taxonomy specifying treatment targets, ingredients, and mechanisms of action is a promising tool to understand MIT.
Implications
Evidence from studies of MIT suggests that the rhythm and timing aspects of spoken language can be clinically important variables. A slow rate and regular rhythm facilitate spoken-language production in people with nonfluent aphasia. These manipulations may support unison production, another component of MIT.
Gains
Understanding how, why, and for whom MIT works provides insight into how language interacts with motor speech planning. Neuroimaging work adds information about the brain regions and neural circuits capable of supporting these functions.
44.1 Phonetic Adaptation in Interactive Language Use
It is a truism that speech is a means of shared communicative exchange. Yet, neurocognitive accounts of (adult) speech production have often adopted a unidirectional perspective, modeling speakers as isolated agents (Guenther, Reference Guenther2016; Hickok, Reference Hickok2012; Parrell et al., Reference Parrell, Lammert, Ciccarelli and Quatieri2019). In these models, adult speech is described as a closed, fully developed system of internal feedforward and feedback control mechanisms operating on largely invariant motor and sensory phonological systems (Hickok, Reference Hickok2012) or speech sound maps (Guenther, Reference Guenther2016) acquired during childhood. Feedback control processes in these accounts are designed to ensure that the motor plans or programs, once established, “stay tuned” over the course of a lifetime, despite noisy motor implementation or changes in vocal tract anatomy (Guenther, Reference Guenther2016, p. 108; Parrell et al., Reference Parrell, Lammert, Ciccarelli and Quatieri2019). In the absence of modules mediating auditory input from other speakers in these single-person models, a speaker’s internal sensory targets are sealed from existing phonetic variation in their language community and remain unchanged throughout life.
However, phonetic plasticity, that is, the gradual adaptation of sound patterns to others’ speech, does not end with the completion of language acquisition in adolescence, as even adult speakers are known to adjust their pronunciation to the speech of others in their environment. Evidence for this is based on observations discussed in terms such as phonetic entrainment, convergence, alignment, accommodation, imitation, or adaptation (Wynn and Borrie, Reference Wynn and Borrie2022). Phonetic adaptation occurs at different temporal and social scales, that is, at the most proximal scale of adjacent conversational turns (Pardo, Reference Pardo2006), across short periods of exposure to other dialects (Delvaux and Soquet, Reference Delvaux and Soquet2007), over periods of a few months in contained groups of individuals (Harrington et al., Reference Harrington, Gubian, Stevens and Schiel2019a), over a lifetime in individuals who are exposed to new dialectal variants (Harrington et al., Reference Harrington, Palethorpe and Watson2000; Riverin-Coutlée and Harrington, Reference Riverin-Coutlée and Harrington2022), or as manifestations of ongoing gradual sound change spreading within social groups or regional communities (e.g., Bukmaier et al., Reference Bukmaier, Harrington and Kleber2014; Labov, Reference Labov2014). Finally, at the most distal end, there is the diachronic sound change languages undergo over centuries, which can ultimately be traced back to the perception–production dynamics of interactive language use that trigger distinctive phonological alternations through propagation and phonologization of gradual phonetic changes (Harrington et al., Reference Harrington, Kleber, Reubold, Katz and Assmann2019b).
Apart from phonetic convergence, there is a second widely discussed paradigm of interactive language use, that is, the moment-to-moment temporal coordination of interlocutors (Levinson, Reference Levinson2016). Speakers engaged in a conversation almost universally tend to avoid overlapping talk and strive to minimize silent gaps between conversational turns (Stivers et al., Reference Stivers, Enfield and Brown2009). Of note, turn transition times are typically much shorter than the time required for speech planning, which implies that perception and comprehension of incoming speech overlaps and is interwoven with the linguistic and motor processes involved in preparing a response (Levinson and Torreira, Reference Levinson and Torreira2015). Another important turn-taking issue is to understand how speakers can predict the end of an incoming turn precisely enough to take their own turn with such short delays.
As a summary, there is a large body of linguistic data that cannot be explained by a single-speaker approach to speech motor control and therefore call for an expansion of speech production models to account for the impact of external input from other speakers during conversation (Bradshaw and McGettigan, Reference Bradshaw and McGettigan2021; Sato et al., Reference Sato, Grabski and Garnier2013). Furthermore, the neural underpinnings and the clinical aspects of speech production in interactive contexts are still under-researched, calling for a “second-person” approach in neurophonetics.
This chapter will focus mainly on phonetic aspects of between-speaker adaptation, although most of the reported evidence is not confined to the phonetic level but also includes other linguistic domains. We first outline some of the prevailing models of interactive speech (Section 44.2) and then discuss assumptions about underlying neural mechanisms using data from neuroimaging studies in neurotypical participants (Section 44.3) and from clinical populations (Section 44.4). A particular focus is on speech rhythm, which plays a crucial role in mediating inter-speaker temporal alignment (see Chapter 29) and may itself be an object of implicit gradual convergence.
44.2 Behavioral Mechanisms and Models
44.2.1 Phonetic Mechanisms
The core of the phonetic changes that occur across different temporal and social/regional scales are the individual episodes of auditory–motor interaction of speakers during conversations. Exemplar theory assumes that speakers taking part in conversations are exposed to the phonetic variation that exists in a community and thereby continuously update the knowledge they have of their language (Blevins, Reference Blevins2004; Harrington et al., Reference Harrington, Kleber, Reubold, Katz and Assmann2019b). Like in other domains of motor action (e.g., Cracco et al., Reference Cracco, Bardi and Desmet2018), there is a tendency also in speech to covertly imitate others’ actions, leading to alignment of fine phonetic details of interlocutors’ speech in conversational interaction (Garrod and Pickering, Reference Garrod and Pickering2009). Implicit imitation may include virtually all phonetic aspects, for example, vocal pitch (Bradshaw and McGettigan, Reference Bradshaw and McGettigan2021), vowel quality (Delvaux and Soquet, Reference Delvaux and Soquet2007), plosive consonant articulation (Shockley et al., Reference Shockley, Sabadini and Fowler2004), speech rate (Schultz et al., Reference Schultz, O’Brien and Phillips2016), or prosody (Weise et al., Reference Weise, Levitan, Hirschberg and Levitan2019), especially speech rhythm (Polyanskaya et al., Reference Polyanskaya, Samuel and Ordin2019). Changes are usually subtle and only measurable using acoustic parameters or sensitive perceptual paradigms.
The degree of phonetic adaptation depends on the type of interaction. Experimental paradigms of joint speech have often been based on semi-interactive laboratory tasks, such as repetition or close shadowing of prerecorded speech, and it is still unclear if phonetic convergence in naturalistic interactions and in such experimental settings rely on the same mechanisms (Pardo et al., Reference Pardo, Urmanche and Wilman2018). Other factors reported to play a role are social proximity and preference (e.g., Babel, Reference Babel2012; see below). Most importantly, the time and frequency of exposure to a specific phonetic variant and the density of interactions in a community have an impact on how salient and persistent a phonetic change will be (Blevins, Reference Blevins2004). Agent-based computational modeling has been used to simulate the propagation of phonetic change and predict the macroscopic changes that emerge from subtle phonetic variation within an ensemble of interacting agents when phonetic or social variables are controlled experimentally (for a recent overview, see Harrington et al., Reference Harrington, Kleber, Reubold, Katz and Assmann2019b).
44.2.2 Social versus Cognitive Models
As outlined above, there is evidence that the degree to which interlocutors involved in a conversation converge or diverge in their pronunciation may depend on their social closeness or mutual liking (e.g., Pardo et al., Reference Pardo, Gibbons, Suppes and Krauss2012; for an overview and discussion, see Ruch et al., Reference Ruch, Zürcher and Burkart2018). Phonetic aspects of pronunciation interact with social patterns and often have a social meaning, which has led several authors to identify social pressure as a driving force of sound change (Eckert, Reference Eckert2012; Labov, Reference Labov1963; Polyanskaya et al., Reference Polyanskaya, Samuel and Ordin2019). Based on such evidence, communication accommodation theory (CAT) (Giles and Ogay, Reference Giles, Ogay, Whaley and Samter2007; Giles et al., Reference Giles, Taylor and Bourhis1973) considers linguistic convergence or divergence as specific communication strategies that speakers use to signal their attitudes towards other individuals and create, maintain, or decrease social distance in interaction.
In a contrasting approach, Pickering and Garrod (Reference Pickering and Garrod2004, Reference Pickering and Garrod2013) postulated that speaker accommodation in conversation is driven by implicit cognitive processes rather than explicit social strategies, with prediction and forward modeling as the core mechanisms conveying adaptation. In their interactive alignment model of speaker–listener interactions, conversation is understood as a production-comprehension process in which speakers compute forward models to predict and possibly adjust their planned utterances to the perceptual needs of their interlocutors, and listeners in turn covertly imitate the speakers’ utterances and derive their own forward models to predict what their counterparts will shortly produce. Thus, in conversation we are implicitly modeling our interlocutors who, in turn, are modeling us in a reciprocal exchange of sensory signals (Friston and Frith, Reference Friston and Frith2015). This interaction is considered to reduce the computational processing load and facilitate the mutual understanding of speakers/listeners and, at the same time, lead to a convergence at semantic, syntactic, lexical, and phonetic-phonological levels and a temporal alignment of their interaction. In phonetic terms, the perceptual forward model that a listener creates of an interlocutor’s utterance is shaped by phonetic details of that utterance, which can then merge with the motor forward model listeners compute for their own response and so lead to phonetic convergence (for discussions, see Bradshaw and McGettigan, Reference Bradshaw and McGettigan2021; Ruch et al., Reference Ruch, Zürcher and Burkart2018).
44.2.3 The Role of Speech Rhythm
Rhythmic stimuli are considered to offer an invitation – or even constitute an affordance – for perceivers to coordinate their behavior with the stimulus, as in dancing or clapping one’s hands to a piece of music (“rhythmic entrainment”; Cummins, Reference Cummins2009). The regular recurrence of a beat facilitates sensorimotor predictions about the occurrence of subsequent events and thereby allows individuals to synchronize their actions with the stimulus. Neural entrainment theories assume that alignment to a rhythmic stimulus is mediated by endogenous oscillatory brain activity at a frequency corresponding to the frequency of the stimulus (Lakatos et al., Reference Lakatos, Gross and Thut2019). Speech, with its recurring sonority peaks of syllabic structure and its alternations between stressed and unstressed syllables, has a quasi-rhythmic envelope that, in line with neural entrainment assumptions, evokes an oscillatory auditory cortical response in the delta (1–3 Hz) and theta range (4–8 Hz) coupled with the frequency modulation of the speech signal (Lakatos et al., Reference Lakatos, Gross and Thut2019; see Chapter 3; for a critical view, see Oganian et al., Reference Oganian, Kojima and Breska2023). Thus, in conversational interactions, endogenous oscillators in the brains of the speaker and the listener are assumed to become entrained to the speaker’s prosodic (delta) and syllabic (theta) rhythm. This rhythmic speech–brain entrainment promotes speech understanding (Riecke et al., Reference Riecke, Formisano, Sorger, Başkent and Gaudrain2018) and enables perceivers to predict upcoming linguistic content (Kösem et al., Reference Kösem, Bosker and Takashima2018). Likewise, it allows listeners to predict the end of the speaker’s turn and prepare for their own seamless turn-taking (Wilson and Wilson, Reference Wilson and Wilson2005). Domain-general mechanisms of reaction speed enhancement through expectancy-driven delta oscillations, as described by Stefanics et al. (Reference Stefanics, Hangya and Hernádi2010), may contribute to the smoothness of turn transitions and regulate the perception–action cycle of conversational interactions (see Chapter 6). As hypothesized in Pickering and Garrod’s interactive alignment model, phonetic adaptation during conversation emerges through mutual covert imitation and internal forward modeling of each other’s speech, interwoven with the speaker’s forward modeling of their own speech (Pickering and Garrod, Reference Pickering and Garrod2013). On this background, rhythmic speech–brain entrainment can be understood as a neural mechanism that establishes temporal synchrony between the speakers’ and listeners’ forward models, thereby strengthening the coupling of production and comprehension.
44.3 Neural Mechanisms
The hypothesis that listeners create forward models of a speaker’s utterances was addressed in a seminal multi-brain imaging study by Stephens et al. (Reference Stephens, Silbert and Hasson2010). In this investigation, the functional magnetic resonance imaging (fMRI) activities of individuals listening to a story were modeled, off-line, with the blood-oxygenation-level-dependent (BOLD) signal of the speaker telling the story. Stephens et al. (Reference Stephens, Silbert and Hasson2010) found that listeners’ brain activity was spatially and temporally coupled with the speaker’s activity, predominantly with a delay, but to some extent also anticipating it. Interestingly, the degree of similarity and predictive anticipatory coupling with the storyteller’s brain activation was correlated with the accuracy of story comprehension, supporting the concept that listeners’ forward modeling of a talker’s utterances facilitates their comprehension (Pickering and Garrod, Reference Pickering and Garrod2004, Reference Pickering and Garrod2013).
Since then, several other multi-brain studies of speaker–listener interactions have been conducted (e.g., Dikker et al., Reference Dikker, Silbert, Hasson and Zevin2014; Silbert et al., Reference Silbert, Honey, Simony, Poeppel and Hasson2014). Interactive alignment theory predicts that speaker–listener coupling can involve different processing levels, from phonetic to syntactic and lexical-semantic, which should then be reflected in the spatial pattern of between-brain alignment. This prediction was confirmed by Dikker et al. (Reference Dikker, Silbert, Hasson and Zevin2014), who used a paradigm where listener accommodation was specifically dependent on lexical-semantic factors. These authors found brain-to-brain synchrony predominantly in left posterior superior-temporal gyrus, which they interpreted as a sign of speaker–listener alignment at the lexical-semantic level. For a review of this literature, see Schoot et al. (Reference Schoot, Hagoort and Segaert2016).
The studies outlined so far have focused on how listeners’ brain activation resonates with a speaker’s activation patterns, as the basis for linguistic convergence that may unfold between the two. However, they disregard if adaptation actually occurs and give no specific account of the brain areas involved in the imitation of aspects of another speaker’s phonetic repertoire. In fact, only few studies have so far focused on the neural underpinnings of phonetic (or, more generally, linguistic) adaptation to others’ speech. Peschke et al. (Reference Peschke, Ziegler, Kappes and Baumgaertner2009) used a close-shadowing task requiring participants to overtly repeat pseudowords produced by model speakers, with the instruction to start speaking at the shortest possible delay. Adaptation to stimulus fundamental frequency (F0) and stimulus duration (i.e., speaking rate) was examined in 20 participants who performed the task in an fMRI scanner. Significant brain activation was found for the degree of speech rate imitation, but not for pitch imitation. Greater imitation of rate was associated with greater activation in right inferior-parietal cortex near the temporo-parietal junction. In one explanation, this result was interpreted as a sign of higher auditory attention in participants with a greater tendency to imitate, rather than as a correlate of imitation per se. In an alternative explanation, the observed right temporo-parietal activation was considered to reflect automatic processing of paralinguistic details of a speech stimulus, such as speech rate (Peschke et al., Reference Peschke, Ziegler, Kappes and Baumgaertner2009). A later fMRI study by Garnier et al. (Reference Garnier, Lamalle and Sato2013) studied F0 imitation in a vowel production task and found a similar, though bilateral, activation of inferior-parietal and posterior superior-temporal regions. However, in this study, brain activation was inversely correlated with the degree of adaptation. Although these data point at a role of temporo-parietal cortex in the adaptation to others’ speech, there are inconsistencies that may be due to differences in the methods used to elicit imitation, that is, production of isolated vowels versus shadowing of single words.
In the reported paradigms of isolated word or vowel production, the quasi-rhythmic pattern of connected speech played no role, which may have diminished the participants’ propensity for entrainment and phonetic adaptation to the model speakers. As outlined in Section 44.2.3, neural entrainment to the slow modulation of the speech envelope constitutes a core mechanism facilitating the prediction of upcoming input. Giraud and Poeppel (Reference Giraud and Poeppel2012) hypothesize that the sampling of quasi-rhythmic speech information by neural oscillations is asymmetric to the extent that theta and delta oscillations parsing timescales of syllable and larger size predominates in the right auditory cortex, while neural computations across timescales encompassing segmental or sub-segmental information rely on high-frequency (“gamma”) oscillations dominating in left auditory cortex (Poeppel, Reference Poeppel2003). A study by Park et al. (Reference Park, Ince, Schyns, Thut and Gross2015) revealed that speech–brain coupling is enhanced by top-down information from left motor and premotor areas, causing a lateralization of speech-induced neural entrainment to the left superior-temporal lobe and a “brain–brain coupling” between auditory and speech motor regions. This coupling is highly speech-specific to the extent that it is restricted to a relatively narrow frequency range around ca. 4.5 Hz, which corresponds to mean syllabic speech rate across languages (Assaneo and Poeppel, Reference Assaneo and Poeppel2018). For an overview of the literature on neural oscillations in speech processing, see Meyer (Reference Meyer2018) and Chapter 3.
In accordance with the idea of a modulating influence of anterior language areas on auditory processing, Scott et al. (Reference Scott, McGettigan and Eisner2009) argued for a specific role of motor cortex in conversation, especially in tracking the speech rate and rhythm of the current talker and thereby organizing smooth turn transitions and interactive alignment. In a more recent study, Castellucci et al. (Reference Castellucci, Kovach, Howard, Greenlee and Long2022) used intracranial electrocorticography in patient volunteers undergoing surgical treatment to investigate the neural dynamics underlying the specific planning processes that enable rapid turn-taking in interactive speech. They identified a frontotemporal network centered on posterior portions of the left inferior and middle frontal gyri to be engaged in response planning during dyadic interactions, providing further evidence for a specific role of auditory–motor neural coupling in conversational interaction.
44.4 Clinical Data
The question of whether neurological conditions affect a speaker’s propensity to align with others’ speech is relevant from three perspectives: First, clinical data can provide insight into which brain regions are involved in linguistic adaptation and thereby contribute to a refinement of models of neural control of speech. Second, entrainment paradigms can offer specific treatment options for patients with neurological speech disorders. Third, disruption of the social mechanisms of conversational adaptation can have adverse consequences for the participation of neurologically impaired individuals that may need to be addressed clinically (Borrie et al., Reference Borrie, Lubold and Pon-Barry2015).
Studies of speaker alignment in interactive or semi-interactive language use in patients with neurological disorders are still rare. The work reviewed here relates to phonetic adaptation and temporal alignment in three clinical groups, that is, post-stroke aphasia with or without apraxia of speech (AOS), Parkinson’s disease (PD), and spinocerebellar ataxia.
44.4.1 Post-Stroke Aphasia and AOS
Infarctions of the left middle cerebral artery, which most often cause language disorder, usually involve damage to components of the dorsal and/or ventral auditory stream, that is, the neural connectivity considered to implement the “perception–action pathway” that is at the center of interactive alignment theories (Pickering and Garrod, Reference Pickering and Garrod2007; Scott et al., Reference Scott, McGettigan and Eisner2009). Research has focused on the impact of lesions to the anterior versus posterior sections of this pathway on phonetic adaptation. In some studies, the anterior–posterior distinction has been implicitly equated with a contrast between “non-fluent” aphasia syndromes, that is, Broca’s aphasia, on the one hand, and “fluent aphasia” with phonological impairment, on the other, although syndrome classifications and the fluent versus non-fluent dichotomy provide only a vague account of impaired language processing components and affected cortical areas (Caramazza and Badecker, Reference Caramazza and Badecker1989).
In studies by Kappes et al., phonetic adaptation was examined in two contrastive cases of aphasia after anterior versus posterior lesions (Kappes et al., Reference Kappes, Baumgaertner, Peschke and Ziegler2009) and in a case series of individuals with left- versus right-hemisphere strokes (Kappes et al., Reference Kappes, Baumgaertner, Peschke, Goldenberg and Ziegler2010). In a word repetition task, participants overtly repeated pseudo-noun phrases, that is, disyllabic pseudowords preceded by the plural article “die” (e.g., /di:.’dai.gəl/), with stress on the first syllable of the pseudoword and a final schwa-syllable. Two phonetic parameters were varied along a continuum, that is, (i) the degree of pitch elevation on the stress-carrying syllable and (ii) the degree of hyper- or hypo-articulation of the schwa-syllable. The two paradigms represent naturally occurring variations of word stress and phonetic reduction in German. The two patients examined in Kappes et al. (Reference Kappes, Baumgaertner, Peschke and Ziegler2009) showed a clear dissociation in their propensity to adapt in word repetition: A patient with lesions in the anterior opercular, precentral, and anterior insular cortex clearly imitated the gradual phonetic variation in both parameters, whereas a second patient with lesions in inferior-parietal cortex and superior and middle temporal gyrus did not align with the model in either of the two parameters. In the case series of Kappes et al. (Reference Kappes, Baumgaertner, Peschke, Goldenberg and Ziegler2010), individuals with aphasia after left-hemisphere lesions showed a significantly lower degree of imitation in both phonetic paradigms as compared to neurotypical controls and individuals with right-hemisphere lesions. A voxel-wise analysis of the influence of lesion location on imitation in the left-hemisphere group revealed two closely neighboring regions centered in Heschl’s gyrus that were negatively associated with the degree of covert imitation of both parameters. On the contrary, lesions to anterior language areas did not influence imitation behavior. Taken together, these results suggest a role of auditory mechanisms in phonetic adaptation and are not supportive of the motor hypothesis of conversational alignment put forward by Castellucci et al. (Reference Castellucci, Kovach, Howard, Greenlee and Long2022) and Scott et al. (Reference Scott, McGettigan and Eisner2009). Note, however, that the motor hypothesis originally relates to interactions involving larger stretches of connected speech and prediction mechanisms based on the rate and rhythm of incoming speech signals (Park et al., Reference Park, Ince, Schyns, Thut and Gross2015), whereas the adaptation paradigms reported above used isolated single-word utterances that did not provide any space for rhythmic entrainment.
Temporal alignment in connected speech was addressed more specifically in a sequential synchronization experiment by Aichert et al. (Reference Aichert, Lehner and Falk2021). In this study, 12 patients with AOS and 12 patients with phonological impairment participated in a spoken sentence-completion task. AOS is a speech motor-planning disorder that is usually associated with aphasia due to lesions of anterior language areas, whereas lexical or post-lexical phonological impairment is associated with lesions located more posteriorly along the dorsal stream (Schwartz et al., Reference Schwartz, Faseyitan, Kim and Coslett2012). Participants in Aichert et al. (Reference Aichert, Lehner and Falk2021) were required to complete sentence fragments (the “primes”) “as smoothly as possible” by pre-specified, semantically compatible target words. Each prime sentence consisted of four disyllabic words (e.g., “le.na|pflanz.te|da.mals|die.se _”; English (literally) “Lena planted then this _”; periods indicate syllable boundaries, vertical strokes word boundaries; stressed syllables in bold) and had to be completed by a given disyllabic noun (e.g., “tul.pe”; English “tulip”). Half of the primes had a regular trochaic rhythm (as in the cited example) and half were metrically irregular, with alternations of trochaic and iambic words and a stress clash within the sentence. The target words were trochees (e.g., tul.pe) or iambs (e.g., te.nor) and were orthogonally arranged with the prime sentences into rhythmically compatible and incompatible prime-target pairs (for trochaic versus iambic meters, see Chapter 32). Response latency, that is, the time interval between the onset of the model speaker’s last word and the onset of the participant’s response, was used as a measure of entrainment. In neurotypical participants, metrically regular response words complementing metrically regular prime sentences were initiated almost precisely “in time with the beat”; that is, response latencies matched the mean duration of the metrical feet of the corresponding prime sentence. This suggests that in the rhythmically regular condition, participants entrained perfectly with the metrical pace of the model speaker’s utterances. After prime sentences with irregular rhythms, trochaic target words were initiated with somewhat shorter delays, suggesting that while hearing a rhythmically irregular prime sentence, the participants may have been unable to create a rhythmical framework for their response and therefore tried to produce the target word as quickly as possible (Aichert et al., Reference Aichert, Lehner and Falk2021). When the target words had an iambic meter, response latencies were consistently increased by ca. 30 ms in both prime conditions, consistent with the assumption that the much less frequent iambic pattern of lexical stress comes with a production disadvantage relative to the considerably more frequent trochaic pattern (Aichert et al., Reference Aichert, Späth and Ziegler2016).
Compared with this response pattern, patients with aphasia, especially those with a concomitant motor speech impairment, had substantially longer response latencies, which may have been due to an unspecific effect of the brain lesion or the speech-language disorder. However, more importantly, in both aphasia groups, response latencies were not modulated to any significant extent by the rhythmic pattern of the prime sentences; that is, the patients with aphasia did not entrain with the regular speech rhythm of the model speaker in terms of the timing of their responses. In the speech-apraxic patients, this outcome appears consistent with the motor hypothesis of interactive alignment advocated by Castellucci et al. (Reference Castellucci, Kovach, Howard, Greenlee and Long2022) or Scott et al. (Reference Scott, McGettigan and Eisner2009), whereas in the patients with intact motor speech, disruption of auditory aspects of the perception–action mechanism involved in interactive alignment, as suggested by Kappes et al. (Reference Kappes, Baumgaertner, Peschke, Goldenberg and Ziegler2010), may be more plausible. However, speech error analyses of the target-word responses revealed that individuals with aphasia with or without AOS made fewer errors in responses to regular than to irregular primes (Aichert et al., Reference Aichert, Lehner, Falk, Späth and Ziegler2019). This seems to suggest that they implicitly did profit from the rhythmical regularity of another speaker’s utterances, if not in terms of temporal alignment then at least in terms of the accuracy of their responses.
Speech entrainment methods have long been recognized as an efficient intervention strategy in individuals with AOS, for example through synchronous production of training items, where the clinician instructs the patient “to attend carefully to the auditory and especially to the visual cues of correct production as they say the utterance together” (e.g., Rosenbek et al., Reference Rosenbek, Lemme, Ahern, Harris and Wertz1973, p. 464). Since Rosenbek’s joint-speech intervention in speech apraxia did not necessarily involve continuous speech at the level of phrases or even texts, its effect was not easily explainable by rhythmic entrainment mechanisms. In contrast, the synchronous or choral speaking methods described and discussed by Cummins (Reference Cummins2003, Reference Cummins2009) and applied, for example, in stuttering therapy, involve synchronous production of longer stretches of continuous speech and are explicitly considered to rely on rhythmic entrainment (for a discussion, see Bradshaw and McGettigan, Reference Bradshaw and McGettigan2021; see also Chapters 45 and 46). Fridriksson et al. (Reference Fridriksson, Hubbard and Hudspeth2012) implemented a computerized version of audiovisual entrainment in which patients mimic, in real time, a videotaped speaker producing short scripts, and found a significant fluency-enhancing effect in patients with Broca’s aphasia. Johnson et al. (Reference Johnson, Yourganov and Basilakos2022) hypothesized that the improvements achieved by this method are ascribable to a synchronization of activations in anterior and posterior language areas, potentially through rhythmic entrainment mechanisms as described by Assaneo and Poeppel (Reference Assaneo and Poeppel2018) and others (see Section 44.3).
44.4.2 Parkinson’s Disease (PD)
It has repeatedly been shown that auditory rhythmic stimulation through the beat of music or of a metronome enhances movement control in individuals with PD (see Chapter 45). Most of the studies of rhythmic entrainment by such nonlinguistic auditory cues have addressed gait problems and reported greater stride length and higher walking speed (Nombela et al., Reference Nombela, Hughes, Owen and Grahn2013), while only few studies reported on therapeutic applications addressing speech impairments (e.g., Thaut et al., Reference Thaut, Mcintosh, McIntosh and Hoemberg2001). The beneficial effects of auditory–motor synchronization were explained within a theoretical framework of self-paced movements in which akinesia in PD is ascribed to a breakdown of a basal ganglia-thalamocortical circuit supporting attention-dependent motor timing and initiation mechanisms (Schwartze et al., Reference Schwartze, Keller, Patel and Kotz2011). In rhythmic auditory–motor synchronization, this dysfunctional mechanism is thought to be compensated by a cerebellar-thalamocortical circuit that supports the matching of movements to an external rhythmic template (for an outline, see Dalla Bella et al., Reference Dalla Bella, Benoit, Farrugia, Schwartze and Kotz2015; see also Chapter 45).
Compared with a metronome sound or a piece of music with a prominent beat, the speech signal of an interacting interlocutor presumably has much less rhythmic salience. One may therefore ask if individuals with PD entrain with the rhythm of others’ speech to a similar extent as they entrain with music or a metronome. This question was addressed in the sentence-completion experiment already outlined in Section 44.4.1 (Aichert et al., Reference Aichert, Lehner and Falk2021), which, along with the two aphasia groups described above, also included a group of individuals with PD. In this study it turned out that the speakers with PD showed the same response pattern as the neurotypical participants; that is, they completed the model speaker’s metrically regular prime sentences with a delay that was adjusted to the perceived speech rhythm. Thus, speakers with PD, like healthy speakers, appeared to anticipate the point in time when their response fitted into the rhythmic pattern of the model speaker’s utterance (Aichert et al., Reference Aichert, Lehner and Falk2021).
In a later study, Späth et al. (Reference Späth, Aichert and Timmann2022) examined if basal ganglia dysfunction in PD not only preserves the ability to temporally align with others’ speech but also the propensity to covertly imitate another speaker’s phonetic idiosyncrasies. Two semi-interactive paradigms were used in this study to elicit sentence utterances, that is, a sentence repetition paradigm where participants were instructed to simply repeat a model speaker’s prerecorded sentence, and a pseudo-dialogue paradigm where participants answered to the model speaker’s sentence by producing a scripted response sentence, such as in a short dyadic exchange. In a control condition, participants read the test sentences aloud. Speech rate in the model sentences was varied experimentally between 2.9 and 4.0 syllables per second. The study included 15 individuals with PD, along with 12 individuals with spinocerebellar ataxia, type 6 (SCA6; see Section 44.4.3), and 27 neurotypical controls. The research question was whether patients with PD would covertly imitate the individual rate and rhythm of the model sentences. Regarding speech rate, a linear regression model revealed that the PD group followed the item-to-item changes in the model speaker’s speech rate in the sentence repetition paradigm by a proportion of more than 30%. In the pseudo-dialogues, the degree of adaptation was smaller (ca. 20%), but still significant. There was no difference between the healthy and PD participants. On an individual basis, significant rate adaptation was found in 80% of both neurotypical and PD individuals.
To assess rhythm adaptation, the individual rhythm of each spoken sentence was represented by a vector of nine inter-beat intervals, that is, the intervals between the p-centers of the 10 successive syllables of a sentence (for p-centers, see Chapter 11). The closeness of a participant’s sentence rhythm to the associated model sentence was determined as the Euclidean distance between the two corresponding vectors of inter-beat intervals. Adaptation occurred when the Euclidean distance between the participant’s and the model speaker’s sentence became smaller in the semi-interactive as compared to the noninteractive (i.e., reading) condition. Using this measure, the PD group demonstrated significant rhythm adaptation in both the repetition and the pseudo-dialogue paradigms. Rhythm adaptation was even stronger in the PD than in the control group, with 80% of the individuals with PD versus 52% of the neurotypical participants showing significant rhythm adaptation across all sentences. This finding fits with observations of a high responsiveness of PD patients to external rhythmical stimulation and the hypothesis that they resort to cerebellar mechanisms of matching an external rhythm (Dalla Bella et al., Reference Dalla Bella, Benoit, Farrugia, Schwartze and Kotz2015). Hence, the basal ganglia dysfunction underlying PD obviously did not prevent participants from covertly adapting to a model speaker’s rate and rhythm, at least in experimental paradigms that promote attention to external stimuli, such as sentence repetition (Späth et al., Reference Späth, Aichert and Timmann2022; for a similar result, see Späth et al., Reference Späth, Aichert and Ceballos-Baumann2016).
44.4.3 Cerebellar Degeneration
Compared with basal ganglia disorders, only little is known about the role of the cerebellum in speech entrainment. Therefore, clinical studies of phonetic alignment involving cerebellar pathologies are particularly relevant. As far as temporal alignment and rhythmic entrainment in interactive language use is concerned, the critical involvement of cerebellar-thalamocortical circuits in motor and perceptual timing in the sub-second range (Buhusi and Meck, Reference Buhusi and Meck2005; Konoike and Nakamura, Reference Konoike and Nakamura2020) and in rhythmic auditory–motor synchronization (Thaut et al., Reference Thaut, Stephan and Wunderlich2009) suggest that cerebellar dysfunction would presumably interfere with smooth turn-taking in conversations or with synchronized speaking. By contrast to this assumption, however, Breska and Ivry (Reference Breska and Ivry2018) put the cerebellum’s contribution to perceptual timing into perspective by showing that temporal prediction based on rhythmic (visual) cues was preserved in patients with spinocerebellar ataxia. Similarly, Breska and Ivry (Reference Breska and Ivry2016) suggested that motor timing based on rhythms emerging implicitly from motor control parameters, such as in the repetitive drawing of circles, is unimpaired in patients with cerebellar degeneration. However, it remains open whether the conclusions drawn from such paradigms can be extrapolated to phonetic alignment in interactive speech.
A different line of research ties in with the well-established role of cortico-cerebellar circuits in the representation of forward models in motor control, that is, in the prediction of the sensory consequences of one’s own planned movements (Wolpert et al., Reference Wolpert, Miall and Kawato1998; see Chapter 6). The “predictive cerebellum” concept has in recent years been translated to the domain of action observation, suggesting that the cerebellum is not only engaged in internal sensorimotor forward modeling but also in the prediction of the consequences of motor actions observed in others (Abdelgabar et al., Reference Abdelgabar, Suttrup and Broersen2019). Even more generally, cerebro-cerebellar forward models have been considered as a mechanism to understand and predict the outcome of others’ behaviors, not only in sensorimotor terms but also in social cognition and affective processing (Sokolov et al., Reference Sokolov, Miall and Ivry2017; Van Overwalle et al., Reference Van Overwalle, Manto and Cattaneo2020). Transferred to language comprehension in conversational interactions, the posterior cerebellum was shown to be engaged in using earlier context in a perceived sentence to predict what an interlocutor is going to say in the further course of the sentence (e.g., Moberget et al., Reference Moberget, Gullesen, Andersson, Ivry and Endestad2014). This places the predictive functions of the cerebellum at the center of “active inference” (Friston and Frith, Reference Friston and Frith2015), in cognitive sequencing (Morgan et al., Reference Morgan, Slapik and Iannuzzelli2021) or in interactive alignment models (Pickering and Garrod, Reference Pickering and Garrod2013), and leads to the prediction that cerebellar pathology would interrupt the propensity of individuals to align with and adapt to others in interactive speech.
This hypothesis was tested in 12 individuals with SCA6 who were included in the rate- and rhythm adaptation experiment described in Section 44.4.2 (Späth et al., Reference Späth, Aichert and Timmann2022). Recall that in this experiment, neurotypical individuals and individuals with PD showed similarly clear tendencies to adapt to a model speaker’s speech rate and rhythm, both in sentence repetition and in dialogue-like sentence dyads. In remarkable contrast to this, the spinocerebellar group showed hardly any adaptation, neither of speech rate nor of rhythm, and none of the SCA6 individuals adapted to both rate and rhythm to a statistically significant extent. Interestingly, the proportion to which SCA6 patients aligned with the model speaker’s rate and rhythm did not depend on general motor or speech motor abilities assessed by ataxia-rating scales and a dysarthria test, and also not on auditory perceptual abilities assessed by an auditory rate discrimination test. Hence, the reduced propensity of individuals with cerebellar degenerative disorders neither resulted from purely auditory nor from purely motor dysfunctions as far as they could be assessed experimentally. Späth et al. (Reference Späth, Aichert and Timmann2022) proposed an explanation that links up with the generalized forward-modeling account of cerebellar function, suggesting that cerebellar degeneration impairs listeners’ forward modeling and prediction of their interlocutors’ speech in conversational interactions and thereby undermines the cognitive processes supporting interactive alignment and phonetic convergence (Späth et al., Reference Späth, Aichert and Timmann2022).
Summary
Neuroimaging and neurophysiological data as well as clinical evidence point to a major role of left fronto-temporal neural coupling and cortico-cerebellar circuits in interactive speaker alignment. PD as a clinical model of basal ganglia involvement appears to preserve speakers’ propensity to adapt to others’ speech rate and rhythm.
Implications
Rhythmic neural entrainment models have emphasized the role of neural oscillators in the entrainment of listeners to the quasi-rhythmic envelope of the speech signal and a coupling of auditory with motor speech areas as a platform for entrainment in interactive speech. Phonetic adaptation in the absence of rhythmic speech cues may involve other mechanisms.
Gains
Accumulating evidence for phonetic adaptation and rhythmic entrainment in interactive language use calls for a second-person approach in the modeling of speech motor control. Cognitive theories of conversational alignment through predictive coding and generalized forward-modeling mechanisms converge with modern neuroanatomical and neurophysiological perspectives on action and perception.
45.1 Introduction
Stuttering and Parkinson’s disease (PD) are complex neurological conditions characterized by disrupted motor control, which prominently manifests in speech and walking impairments. Within these disorders, an intriguing parallel emerges as both exhibit untimely initiation or termination of motor commands, leading to distinctive motor impairments. Stuttering, with its blockades, sound and syllable repetitions, and prolongations, significantly disrupts the smooth and rhythmic flow of speech (Bloodstein et al., Reference Bloodstein, Ratner and Brundage2021). In contrast, PD presents with dysfunctional gait and balance, along with freezing episodes, posing challenges to maintaining a regular rhythm while walking (Grabli et al., Reference Grabli, Karachi and Welter2012; Kalia and Lang, Reference Kalia and Lang2015). These rhythmic alterations not only affect the motor functions but also extend to rhythm perception. Remarkably, they transcend the boundaries of specific motor effectors and encompass broader rhythmic domains. Therefore, it becomes crucial to explore the underlying mechanisms that contribute to these rhythmic disturbances across diverse motor behaviors and perceptual processes. In this chapter we try to unravel the hypothesis that motor deficits in stuttering and PD partly originate from alterations within the timing system responsible for temporal prediction (e.g., Schwartze and Kotz, Reference Schwartze and Kotz2013). Investigating the interplay between motor control and temporal processing in the two classes of disorders will help to shed light on shared mechanisms. Particular attention will be paid to rhythm-based interventions building on these shared mechanisms and potentially leading to innovative treatment strategies. In doing so, we adopt a multidisciplinary approach, integrating neurology, speech pathology, motor control, and cognitive neuroscience.
45.2 The Role of Rhythm in Developmental Stuttering
Neurodevelopmental stuttering is a childhood-onset speech motor disorder that significantly disrupts the flow of speech (ICD-11, 2023). It is reported since antiquity across languages and regions around the globe. It is more prevalent in young children (around 5–10% of children aged two–three years) compared to adolescents or adults (~1%) (Yairi and Ambrose, Reference Yairi and Ambrose2013). In approximately 80% of affected children, symptoms naturally disappear within a few months to two years after stuttering onset, often before puberty (Yairi and Ambrose, Reference Yairi and Ambrose2004). However, some individuals continue to stutter into adulthood. Risk factors for persistent stuttering include co-occurring neurodevelopmental speech or language disorders (e.g., dyslexia, developmental language disorder), a family history of stuttering (with heredity estimates of 40–80%), late onset of stuttering (> four years), and being male (Frigerio-Domingues and Drayna, Reference Frigerio-Domingues and Drayna2017; Singer et al., Reference Singer, Hessling, Kelly, Singer and Jones2020).
Stuttering hinders the flow of speech with involuntary sound and syllable repetitions and silent pauses (Guitar, Reference Guitar2012). While typical speech dysfluencies include pauses and repetitions, such as searching for words or correcting mispronunciations (Lickley, Reference Lickley and Redford2015), stuttering stands out by disrupting the start or continuation of speech, leading to irregular breaks in speech flow (Guitar, Reference Guitar2012). Stuttering is often associated with physical symptoms such as muscle tension, facial grimacing, and involuntary movements (Bloodstein et al., Reference Bloodstein, Ratner and Brundage2021).
The arrhythmic character of stuttering is shaped by the randomness of symptoms. One individual’s frequency and severity of symptoms can randomly change from mild to severe stuttering from one day or situation to the other (Tichenor and Yaruss, Reference Tichenor and Yaruss2021). The temporal unpredictability of symptoms within a speech segment is probably one of the main reasons why stuttering is seen as a disorder disrupting the natural rhythm of speech. Stuttering’s unpredictable nature tends to disrupt conversation flow, prompting interlocutors unfamiliar with this disorder to use correction strategies such as completing sentences, interrupting, or prematurely taking turns (Guitar, Reference Guitar2012). Conversely, people who stutter might employ avoidance tactics in conversations, such as changing or skipping words and using fillers to conceal stuttering or avoid taking turns (Tichenor and Yaruss, Reference Tichenor and Yaruss2019). These attempts from both sides to restore a smoother flow of conversation or conceal the stuttering are ultimately ineffective. The continuous struggle with self-expression can cause frustration, leading to speech avoidance, together with feelings of guilt, shame, and fear, which significantly affect their psychosocial well-being, and may result in isolation or depression, underscoring stuttering’s classification as a communication disorder (Bloodstein et al., Reference Bloodstein, Ratner and Brundage2021; DSM-5, 2013).
At the core, stuttering is believed to stem from malfunctioning speech motor planning. Various hypotheses share the idea that the timely initiation and termination of speech movements might be compromised because of faulty integration of information from the auditory and motor systems (Alm, Reference Alm2004; Chang and Guenther, Reference Chang and Guenther2020; Civier et al., Reference Civier, Bullock, Max and Guenther2013; Harrington, Reference Harrington1988; Max et al., Reference Max, Guenther, Gracco, Ghosh and Wallace2004; Smith and Weber, Reference Smith and Weber2017). The motor system’s predicted output may temporally not align with the actual auditory feedback, resulting in temporal conflicts and, ultimately, stuttering symptoms (Max et al., Reference Max, Guenther, Gracco, Ghosh and Wallace2004). Consequently, the motor system struggles to provide accurate timing cues for fluent speech production (Alm, Reference Alm2004). At the neuronal level, altered connectivity and structural changes in the auditory, motor control, and timing circuits, including the basal-ganglia-thalamo-cortical circuits, have been observed in individuals who stutter (Chang et al., Reference Chang, Erickson, Ambrose, Hasegawa-Johnson and Ludlow2008, Reference Chang, Zhu, Choo and Angstadt2015; Connally et al., Reference Connally, Ward and Pliatsikas2018; Kronfeld-Duenias et al., Reference Kronfeld-Duenias, Amir, Ezrati-Vinacour, Civier and Ben-Shachar2016; Sommer et al., Reference Sommer, Koch, Paulus, Weiller and Büchel2002). These changes affect speech production, auditory–motor learning, and information flow between left-hemisphere areas and subcortical structures (Chang and Zhu, Reference Chang and Zhu2013; Giraud et al., Reference Giraud, Neumann and Bachoud-Levi2008; Kell et al., Reference Kell, Neumann, Behrens, von Gudenberg and Giraud2018; see also Chang and Guenther, Reference Chang and Guenther2020). Structural alterations have also been reported in key structures within the left-dominant part of the networks (e.g., supplementary motor area, inferior frontal gyrus and premotor cortex, putamen and nucleus caudate; e.g., Beal et al., Reference Beal, Gracco, Brettschneider, Kroll and De Nil2013, Reference Beal, Lerch and Cameron2015; Chang and Guenther, Reference Chang and Guenther2020; Neef et al., Reference Neef, Anwander and Friederici2015).
If the general timing network plays a role in stuttering, why would only speech be affected? Indeed, studies have shown that individuals who stutter exhibit distinct patterns in tasks involving metronome tapping, displaying less consistency and accuracy compared to their fluent peers, particularly those with moderate to high stuttering severity (Falk et al., Reference Falk, Müller and Dalla Bella2015; Sares et al., Reference Sares, Deroche, Shiller and Gracco2019). Children who stutter also demonstrated weaker discrimination of musical rhythmic sequences, suggesting difficulties in generating an internal beat in both music and speech, at least in an English-speaking population (Wieland et al., Reference Wieland, McAuley, Dilley and Chang2015). These findings, in conjunction with neural observations, point towards the involvement of the broader timing network in stuttering.
45.3 Rhythm Disorders in PD
After Alzheimer’s disease, characterized by the gradual loss of cognitive function, memory impairment, and changes in behavior and personality, PD is the second most common neurodegenerative disorder, and the most common serious movement disorder (Hirtz et al., Reference Hirtz, Thurman and Gwinn-Hardy2007). There are about four million patients worldwide suffering from PD (Andlin-Sobocki et al., Reference Andlin-Sobocki, Jönsson, Wittchen and Olesen2005). The disorder is caused by the progressive loss of neurons in the substantia nigra, which disrupts dopaminergic projections to the basal ganglia (specifically, the caudate nucleus and putamen) and leads to the deregulation of basal ganglia-thalamo-cortical circuitry.
Three cardinal symptoms characterize PD, namely resting tremor, limb rigidity (stiffness and resistance to movement in the muscles, causing a reduced range of motion), and general slowness of movement and difficulty initiating and executing voluntary actions (bradykinesia/akinesia) (Jankovic, Reference Jankovic2008; Kalia and Lang, Reference Kalia and Lang2015; Samii et al., Reference Samii, Nutt and Ransom2004).
In addition to these cardinal symptoms, PD also presents with significant motor signs related to gait and balance. As PD progresses, the severity of these symptoms tends to increase (Bloem, Reference Bloem1992; Grabli et al., Reference Grabli, Karachi and Welter2012; Koller and Montgomery, Reference Koller and Montgomery1997). During the early stages, gait dysfunctions can be observed when patients engage in dual-task conditions, such as walking while simultaneously performing another task (e.g., speaking). These dual-task situations place demands on limited attentional resources and executive functions (Al-Yahya et al., Reference Al-Yahya, Dawes and Smith2011; Kelly et al., Reference Kelly, Eusterbrock and Shumway-Cook2012). Gait alterations in PD include smaller and less regular steps due to shorter strides, compensatory adjustments in cadence (steps/min) to account for reduced stride length, reduced gait velocity, as well as festination and freezing (difficulty in initiating or stopping gait when turning or approaching an object) (Giladi, Reference Giladi2001; Grabli et al., Reference Grabli, Karachi and Welter2012; Morris et al., Reference Morris, Iansek, Matyas and Summers1994, Reference Morris, Huxham, McGinley, Dodd and Iansek2001). All these alterations of walking lead to dysfunctional gait rhythm in PD. These deficits are a major cause of disability, hindering patients’ mobility and independence, and a growing economic burden for the healthcare system (Grabli et al., Reference Grabli, Karachi and Welter2012).
Notably, rhythm disorders apparent in Parkinsonian gait extend across motor domains. Rhythm disorders in PD are also found in orofacial rhythmic coordination (e.g., in oral diadochokinesis tasks), where patients have difficulties in keeping a steady – isochronous – oral rhythm (Skodda et al., Reference Skodda, Flasskamp and Schlegel2010), and in tapping tasks when they have to tap their hand or finger at a regular rhythm or to an external rhythmic stimulus (Benoit et al., Reference Benoit, Dalla Bella and Farrugia2014; Bieńkiewicz and Craig, Reference Bieńkiewicz and Craig2015; Jones and Jahanshahi, Reference Jones and Jahanshahi2014). Rhythm disorders in PD manifest also in perceptual tasks, in the absence of motor output, such as extracting the beat from a musical sequence (Grahn and Brett, Reference Grahn and Brett2009; Tolleson et al., Reference Tolleson, Dobolyi and Roman2015). Only a few studies have investigated the relationship between rhythm variability across different motor domains in PD. Evidence suggests a correlation between rhythmic features of gait and speech in PD (Cantiniaux et al., Reference Cantiniaux, Vaugoyeau and Robert2010). Recent research from our laboratory demonstrates a tight relationship between the variability of motor actions across various effectors (e.g., finger tapping, gait, oromotor system) and impaired beat perception, suggesting that a central mechanism related to rhythm processing may contribute to rhythm motor disorders across domains (Dalla Bella, Reference Dalla Bella2022; Puyjarinet et al., Reference Puyjarinet, Bégel and Gény2019). Notably, these effects across motor domains, including speech production, are observed in spite of the variability of the rhythm class of language (French, English) (see also Chapters 11, 33, 30, 32, and 40); altogether these findings support the concept of a central disorder, referred to as “general dysrhythmia,” underlying rhythmic deficits in PD (Cantiniaux et al., Reference Cantiniaux, Vaugoyeau and Robert2010; Puyjarinet et al., Reference Puyjarinet, Bégel and Gény2019; Tolleson et al., Reference Tolleson, Dobolyi and Roman2015).
This parsimonious explanation of general rhythm disorders in PD is in keeping with the neuronal basis of the disease, involving basal ganglia-cortical circuitries (Factor and Weiner, Reference Factor and Weiner2008), which play a role in rhythm processing and temporal prediction (Grahn and Brett, Reference Grahn and Brett2007, Reference Grahn and Brett2009; Schwartze and Kotz, Reference Schwartze and Kotz2013). Indeed, the core neural circuitry impacted by PD, which includes the basal ganglia, premotor cortex, and pre-supplementary motor area, is also involved in rhythm perception and production (Chen et al., Reference Chen, Penhune and Zatorre2008; Coull et al., Reference Coull, Cheng and Meck2011; Dalla Bella et al., Reference Dalla Bella, Benoit and Farrugia2017; Grahn and Brett, Reference Grahn and Brett2007; Grahn and Rowe, Reference Grahn and Rowe2009; Repp, Reference Repp2005; Repp and Su, Reference Repp and Su2013).
45.4 Overlaps between Developmental Stuttering and PD
Despite significant clinical and age-related distinctions between stuttering and PD, both disorders share a dysfunction in the basal ganglia-cortical network, a critical component involved in rhythm processing and temporal prediction (see Table 45.1). This suggests that overlaps should be observed across the two classes of disorders. This section explores shared phenomena and mechanisms between PD and stuttering and highlights that both conditions can be considered as rhythmic-motor disorders, emphasizing their rhythmic aspects in addition to motor dysfunction.
| Stuttering | PD | |
|---|---|---|
| Disorder type | Neurodevelopmental | Neurodegenerative |
| Primary affected motor rhythm | Speech (syllabic rhythm, initiation, execution) | Gait (initiation and maintenance) |
| Other affected motor rhythms | Tapping (paced/unpaced) | Tapping (paced/unpaced) Oromotor coordination (diadocokinesis) Speech (dysarthria, stuttering) |
| Rhythmic perception affected? | Maybe (one study) | Yes |
| Similarities between stuttering and PD | ||
| Neural bases | Alterations in the basal ganglia-thalamo-cortical network | |
| Main underlying mechanisms | Impaired temporal predictions and less automatized/de-automatized motor patterns | |
| Benefits from | Enhancing temporal cues, auditory pacing, training of auditory–motor patterns | |
45.4.1 Stuttering in PD
Although dysarthria is the most prominent speech motor disorder in relation with PD (e.g., Duffy, Reference Duffy2019), stuttered dysfluencies are also found, in particular in more severe and longer-term cases of PD (Benke et al., Reference Benke, Hohenstein, Poewe and Butterworth2000; Gooch et al., Reference Gooch, Horne and Melzer2023). In the few studies available (see Gooch et al, Reference Gooch, Horne and Melzer2023, for a summary), estimates of new-onset stuttering in PD patients range between 4 and 53%. Individuals who had once remitted from childhood stuttering were also found to present stuttering again at the onset of PD (Shahed and Jankovic, Reference Shahed and Jankovic2001).
45.4.2 “Freezing of Gait” versus “Gluency” in Speech
Alm (Reference Alm2021) recently discussed similarities between gait freezing in PD and stuttering in the “inability to move forward in a movement sequence,” whether gait or speech. Freezing of gait implies a blockade appearing as a failure in gait initiation, or occurring abruptly while patients are walking; in the latter case, a sudden decrease of step length and increase of step frequency and step-to-step variability is observed prior to a complete blockade, which may lead to falling (e.g., Grabli et al., Reference Grabli, Karachi and Welter2012). For stuttering, the term “gluency” has been coined for the subjective experience of being stuck and unable to control the articulators as wished (Van Riper, Reference Van Riper1992).
45.4.3 Effects of Auditory Pacing
In developmental stuttering, we find “fluency-enhancing conditions” that can significantly reduce stuttering, sometimes to no stuttering symptoms at all. There are different forms of these conditions. Some of them temporarily change the way auditory feedback of speech is delivered (e.g., whispering, delaying auditory feedback, auditory masking with noise or music). Others provide auditory rhythmic cues or rhythmic enhancement (i.e., speaking with a metronome, singing, choral speech; Andrews et al., Reference Andrews, Howie, Dozsa and Guitar1982; Ingham et al., Reference Ingham, Bothe and Jang2009). However, the beneficial effect of fluency-inducing conditions wanes after stopping the cue or altered feedback. Interestingly, stuttering in PD has a long tradition of being described as neurogenic stuttering that should not respond to such fluency enhancements (Krishnan and Tiwari, Reference Krishnan and Tiwari2013). However, individuals with PD who stutter were found to respond to choral speech similar to individuals with developmental stuttering (Juste et al., Reference Juste, Sassi, Costa and de Andrade2018). Moreover, articulatory tools used in the therapy of neurodevelopmental stuttering, such as slowing speech rate as well as other articulatory techniques, can also help individuals with PD who stutter with their speech. These results require more studies about the common grounds for speech and other dysfluencies in PD and developmental stuttering.
The effect of auditory pacing in PD is more evident. Known as rhythmic auditory cueing (RAC), presenting a regular auditory stimulus such as a metronome or music with a salient beat improves significantly gait in PD patients (Fleming, Reference Fleming1942; Ghai et al., Reference Ghai, Ghai, Schmitz and Effenberg2018b; Kwakkel et al., Reference Kwakkel, de Goede and van Wegen2007). The intervention involves instructing patients to walk in synchrony with a regular sound or music with a distinct beat, often tailored to their preferred cadence (Benoit et al., Reference Benoit, Dalla Bella and Farrugia2014; Elston et al., Reference Elston, Honan, Powell, Gormley and Stein2010; Enzensberger et al., Reference Enzensberger, Oberländer and Stecker1997; Howe et al., Reference Howe, Lövgreen, Cody, Ashton and Oldham2003; McIntosh et al., Reference McIntosh, Brown, Rice and Thaut1997; Thaut et al., Reference Thaut, McIntosh and Rice1996). In the presence of a rhythmic stimulus, PD patients typically walk faster, increase their step length (McIntosh et al., Reference McIntosh, Brown, Rice and Thaut1997), and reduce the frequency of freezing episodes (Arias and Cudeiro, Reference Arias and Cudeiro2010). As in stuttering, this immediate effect tends to disappear after the end of the stimulation.
45.4.4 Shared Mechanisms
Both stuttering and PD share a common rhythmic component associated with difficulties in generating precise internal timing for motor actions, such as gait coordination and speech articulation. This rhythmic deficit involves inaccurate temporal predictions governing motor commands, resulting in disrupted movement initiation or execution. Interestingly, in both cases, the presence of an external rhythmic stimulus can alleviate these difficulties by compensating for the internal prediction inaccuracies. These observations support the characterization of stuttering and PD as motor-rhythm disorders. Both conditions involve alterations in the neuronal circuitry (subcortical-cortical network) underlying rhythm perception, production, and temporal prediction. Tasks involving beat perception and synchronization recruit similar neuronal circuitries, including the basal ganglia, premotor cortex, and pre-supplementary motor area (Chen et al., Reference Chen, Penhune and Zatorre2008; Coull et al., Reference Coull, Cheng and Meck2011; Dalla Bella et al., Reference Dalla Bella, Benoit and Farrugia2017; Grahn and Brett, Reference Grahn and Brett2007; Grahn and Rowe, Reference Grahn and Rowe2009; Repp, Reference Repp2005; Repp and Su, Reference Repp and Su2013; Schwartze and Kotz, Reference Schwartze and Kotz2013).
Another important aspect of rhythm deficits in both stuttering and PD is the role of automatization. In PD, neurodegeneration leads to de-automatization of movement, resulting, among other symptoms, in poorer dual-task performance. This aspect seems to be less evident in stuttering. However, Alm (Reference Alm2021) recently proposed that stuttering may involve less automatized speech sequences within the basal ganglia motor loop during childhood (see also Chang and Guenther, Reference Chang and Guenther2020). Stuttering symptoms would emerge during attempts to produce these poorly automatized sequences. De-automatization of speech production through the allocation of increased attentional resources, such as imitating others, speaking with an accent, or consciously altering speech rate and articulatory patterns, would then reduce stuttering. The effects of rhythmic fluency-enhancing conditions can be interpreted in a similar way, as strong beat-based rhythms provided by a metronome provide a temporal scaffolding supporting temporal predictions (Large and Jones, Reference Large and Jones1999; Schwartze and Kotz, Reference Schwartze and Kotz2013) capable of freeing up attentional resources.
45.5 Rhythm as a Viable Intervention for both PD and Stuttering
The aforementioned overlaps between PD and stuttering point to common deficits in temporal prediction and automatization. This suggests that (a) training temporal predictions for movement generation and (b) automatizing newly acquired timing patterns might have therapeutic potential for both classes of disorders. It is worth noting, however, that while both conditions are associated with rhythm and timing deficits, and their neural underpinning of these disorders partially overlap, there are significant differences. PD primarily involves degeneration in the dopaminergic pathways within the basal ganglia, impacting motor control and automatization. In contrast, stuttering is associated with deregulation of basal ganglia-cortical circuitries but is not accompanied by neurodegeneration, suggesting a more functional or developmental anomaly. Moreover, the role of the dopaminergic system in stuttering is not clear yet (Alm, Reference Alm2021). Therefore, while temporal prediction and rhythm training might benefit both classes of disorders by engaging common neural circuits including the basal ganglia and motor cortical areas, distinct functional mechanisms may be exploited in the two cases. For PD, rhythm-based therapies might aim to counteract or bypass dopaminergic deficits, whereas in stuttering, the focus could be on strengthening the functional connectivity and efficiency of the motor circuits involved. This distinction underscores the importance of tailored therapeutic interventions that, while exploiting the shared role of rhythm and timing, are also sensitive to the unique neural substrates of each disorder.
45.5.1 Training Exploiting Rhythmic Stimulation in PD
Several treatments are available to manage motor symptoms in PD. These include medication (such as levodopa and dopamine agonists) (Connolly and Lang, Reference Connolly and Lang2014), surgical procedures (such as pallidotomy or thalamotomy) (Lozano et al., Reference Lozano, Tam and Lozano2018), deep-brain stimulation (DBS) (Benabid et al., Reference Benabid, Pollak, Louveau, Henry and de Rougemont1987; Kalia et al., Reference Kalia, Sankar and Lozano2013), and noninvasive options such as physical therapy and neuromodulation techniques (transcranial magnetic stimulation or transcranial direct-current stimulation) (Benninger and Hallett, Reference Benninger and Hallett2015). Each treatment aims to compensate for dopamine loss or reduce the dysfunction in brain circuitries related to movement. In addition to pharmacotherapy and various other interventions, non-pharmacological treatments such as RAC are recognized for their beneficial effects in managing PD symptoms. These rhythm-based therapies complement traditional treatments and are increasingly acknowledged for their role in improving motor symptoms in PD patients. More generally, rhythmic stimuli have shown beneficial effects on motor behavior in patients with movement disorders and older adults (Ghai et al., Reference Ghai, Ghai and Effenberg2018a, Reference Ghai, Ghai, Schmitz and Effenberg2018b; Spaulding et al., Reference Spaulding, Barber and Colby2013). Most studies have focused on gait disorders due to their functional relevance, impact on quality of life, and economic burden. In the management of PD, where the effectiveness of dopamine replacement therapy diminishes over time (Grabli et al., Reference Grabli, Karachi and Welter2012; Sethi, Reference Sethi2008), there is a pressing need for innovative non-pharmacological approaches to improve gait. Rhythm-based interventions, such as walking to an auditory beat or participating in dance activities, hold promise in enhancing gait, quality of life, and social engagement among individuals with PD (for a review, see Dalla Bella, Reference Dalla Bella, Cuddy, Belleville and Moussard2020). These interventions leverage rhythmic auditory cues to provide a temporal framework that facilitates movement initiation and coordination (Ghai et al., Reference Ghai, Ghai, Schmitz and Effenberg2018b; Spaulding et al., Reference Spaulding, Barber and Colby2013).
RAC has an immediate beneficial effect on gait in PD (Arias and Cudeiro, Reference Arias and Cudeiro2010; Cochen De Cock et al., Reference Cochen De Cock, Dotov and Ihalainen2018; McIntosh et al., Reference McIntosh, Brown, Rice and Thaut1997). While these benefits tend to dissipate once the stimulation ceases, longer-term effects can be observed through RAC rehabilitation programs, as shown by Lim et al. (Reference Lim, van Wegen and de Goede2005). These programs involve regular RAC-assisted walking sessions, resulting in increased walking speed and reduced freezing phenomena at the end of the rehabilitation, even in the absence of stimulation (Dalla Bella et al., Reference Dalla Bella, Benoit and Farrugia2017; Nieuwboer, Reference Nieuwboer2008; Rochester et al., Reference Rochester, Burn, Woods, Godwin and Nieuwboer2009). Similar motor benefits are observed with home-based RAC rehabilitation using a stimulating device (Nieuwboer et al., Reference Nieuwboer, Kwakkel and Rochester2007). However, the long-term persistence of these effects and their interaction with neurodegenerative decline remain uncertain, with inconclusive evidence to date (Benoit et al., Reference Benoit, Dalla Bella and Farrugia2014; Marchese et al., Reference Marchese, Diverio, Zucchi, Lentino and Abbruzzese2000; Nieuwboer et al., Reference Nieuwboer, De Weerdt and Dom2001).
The exact nature of brain mechanisms underlying these beneficial effects still needs clarification. For example, the bases of RAC in PD is still a subject of ongoing debate (Dalla Bella et al., Reference Dalla Bella, Benoit, Farrugia, Schwartze and Kotz2015, Reference Dalla Bella, Dotov, Bardy and Cochen de Cock2018; Nombela et al., Reference Nombela, Hughes, Owen and Grahn2013; for a review, see Dalla Bella, Reference Dalla Bella, Cuddy, Belleville and Moussard2020). It is still unclear whether beneficial effects are mediated by spared brain mechanisms (cerebello-thalamo-cortical network) acting compensatorily, or by capitalizing on residual capacities of the impaired network in PD (basal ganglia-thalamo-cortical network). However, emerging evidence suggests that these mechanisms may extend beyond gait-specific processes and instead involve a more general-purpose network that supports rhythm perception, production, and temporal prediction (Dalla Bella, Reference Dalla Bella, Cuddy, Belleville and Moussard2020; Large and Jones, Reference Large and Jones1999; Piras and Coull, Reference Piras and Coull2011; Schwartze and Kotz, Reference Schwartze and Kotz2013). This idea is supported by studies indicating improved rhythm perception following RAC training (Benoit et al., Reference Benoit, Dalla Bella and Farrugia2014) and the observation that gait improvement through RAC is associated with individual rhythm perception and production abilities (Cochen De Cock et al., Reference Cochen De Cock, Dotov and Ihalainen2018; Dalla Bella et al., Reference Dalla Bella, Benoit and Farrugia2017, Reference Dalla Bella, Dotov, Bardy and Cochen de Cock2018). Notably, this hypothesis aligns well with the aforementioned general dysrhythmia hypothesis (Cantiniaux et al., Reference Cantiniaux, Vaugoyeau and Robert2010; Puyjarinet et al., Reference Puyjarinet, Bégel and Gény2019; Tolleson et al., Reference Tolleson, Dobolyi and Roman2015) and provides a coherent framework for understanding the broader implications of rhythm interventions.
A hypothesis arising from this theory posits that rhythmic training targeting a specific effector (e.g., hand, finger) may yield positive effects on motor control and rhythmic behavior in other effectors (e.g., oromotor, gait). This transfer effect could be facilitated by the shared mechanisms supporting temporal prediction (Dalla Bella, Reference Dalla Bella2022). To examine this hypothesis, we conducted a recent pilot study (Puyjarinet et al., Reference Puyjarinet, Bégel and Geny2022) involving patients with PD. During the study, participants underwent training using either a rhythmic tapping game (Rhythm Workers; Bégel et al., Reference Bégel, Seilles and Dalla Bella2018; Dauvergne et al., Reference Dauvergne, Bégel and Gény2018) or a nonrhythmic game (Tetris) over the course of one month. Both games were implemented as tablet apps. The rhythmic game required participants to tap along with various rhythmic auditory stimuli, with synchronization accuracy driving progress in the game. Remarkably, the rhythm intervention not only reduced motor variability in the trained motor domain (tapping) but also demonstrated a positive effect on an oromotor task (diadocokinesis task), unlike the control condition that showed no such effect. Moreover, these beneficial outcomes were correlated with improvements in rhythm perception. These promising findings provide evidence of transfer effects driven by rhythmic training in PD, and first causal evidence in support of the hypothesis of a general dysrhythmia in PD. If confirmed in further studies also involving other clinical populations, these findings might have particular significance from a clinical standpoint, whereby the effects of rhythmic training may extend from one effector and motor actions to others. This highlights the potential of rhythmic interventions as a valuable clinical tool for addressing motor impairments in various conditions, including developmental stuttering.
45.5.2 Potential of Rhythmic Training in Developmental Stuttering
Two decades ago, it was proposed that explicitly training the basal ganglia timing network may benefit rhythmic speech production in stuttering (Alm, Reference Alm2004; Fujii and Wan, Reference Fujii and Wan2014). However, to date, no therapeutic approach based on rhythmic pacing techniques has been established, as the effects tend to diminish immediately after the end of rhythmic stimulation. Some devices have been developed to mimic fluency-enhancing conditions, such as choral speech, during naturalistic speech interaction, with mixed results (e.g., Pollard et al., Reference Pollard, Ellis, Finan and Ramig2009). More recently, efforts have been focused on utilizing neuromodulation techniques to establish more efficient patterns of information flow in the brains of adults who stutter. For example, transcranial direct-current stimulation (tDCS), a technique through which brain regions are stimulated with very low electrical current during the execution of a task, was used in combination with rhythmic pacing, such as speaking with a metronome or choral speech, to enhance fluent speech production (Busan et al., Reference Busan, Moret, Masina, Del Ben and Campana2021). Although first results are promising, further research is needed to determine the potential and the exact conditions under which these techniques should be applied.
Further exploration could focus on investigating whether intense or long-term rhythmic training could serve as a naturalistic approach for individuals who stutter to enhance their temporal predictions. An initial step would involve assessing the relationship between musical training and the occurrence, severity, or therapy outcomes of stuttering. If individuals who stutter exhibit significantly lower levels of musical training compared to the general population, or if lower severity or therapy success is associated with musical or rhythmic abilities, this would provide a basis for examining the effects of musical and rhythmic training on stuttering. Currently, only a limited number of studies have investigated the relationship between music and stuttering, primarily regarding immediate fluency-inducing effects, with Falk (Reference Falk and Sammler2025) and Falk et al. (Reference Falk, Schreirer, Russo, Heydon, Fancourt and Cohen2018) providing comprehensive overviews. Secondly, it would be crucial to identify individual differences that distinguish which speakers who stutter would benefit from musical training versus those who would not. Lastly, research should assess whether general musical, nonverbal, or specifically verbal rhythmic training can produce transfer effects on self-paced everyday speech.
45.6 Summary
Stuttering and PD exhibit different etiologies, as well as notable clinical and age-related differences, which lead to classifying them as separate disorders. In spite of these differences, though, both disorders share a dysfunction in the basal ganglia-cortical circuitries that play a vital role in rhythm processing and temporal prediction. A pivotal notion in explaining this overlap is the concept of predictive timing, namely the ability to predict accurately the time of occurrence of an upcoming event (e.g., the next syllable, or the next step), based on the regular temporal structure of a sequence (Large and Jones, Reference Large and Jones1999; Piras and Coull, Reference Piras and Coull2011; Schwartze and Kotz, Reference Schwartze and Kotz2013). Our review examined the behavioral – clinical manifestations – and neuronal overlaps of stuttering and PD, underscoring that both conditions involve alterations in the neuronal circuitry (subcortical-cortical networks) underlying rhythm perception, production, and temporal prediction. For these reasons, we conclude that stuttering and PD can be classified as rhythmic-motor disorders, emphasizing the significance of rhythm in addition to motor dysfunction. This hypothesis has implications for novel intervention strategies exploiting shared neuronal circuitries underpinning temporal and rhythm processing, which could potentially benefit both stuttering and PD. While rhythm-based interventions such as RAC have been widely examined in PD, their efficacy in stuttering warrants further investigation. The emergence of new technologies, such as mobile devices and serious games, offers opportunities to implement rhythmic training protocols in a variety of populations, including developmental stuttering (Agres et al., Reference Agres, Schaefer and Volk2021; Dalla Bella, Reference Dalla Bella2022). These advancements provide a platform to test the effectiveness of rhythmic training in improving temporal prediction in both PD and stuttering.
45.7 Acknowledgements
Simone Dalla Bella is funded by a Discovery grant from the Natural Sciences and Engineering Research Council of Canada (NSERC), and by a Canada Research Chair in music auditory–motor skill learning and new technologies. Simone Falk is funded by a Discovery grant from NSERC, and by a Canada Research Chair in interdisciplinary studies on rhythm and language acquisition.
Summary
In this review, we compare rhythmic dimensions of stuttering and PD, two neurological conditions leading to dysfluencies and disruptions in motor control in speech and walking, respectively. The findings indicate common grounds in rhythm-related symptoms and neuronal resources, underscoring the relevance of rhythm for the classification of both disorders.
Implications
The chapter helps us to understand processes and neural resources underlying rhythmic alterations and temporal prediction in speech motor control and their links to gross motor function. The results will inform future research comparing speech and motor rhythms in different motor disorders including, but not limited to, speech and language disorders.
Gains
Based on the view that stuttering and PD are rhythmic-motor disorders, we can conceive new intervention strategies based on rhythm training. These rhythm-based interventions could motivate interdisciplinary research using new technologies and uniting scientists from the speech and language sciences as well as from cognitive (neuro)sciences.
46.1 Introduction
46.1.1 The Nature of Rhythm and Its Measurability
‘Rhythm’ in the study of spoken language is used in many different contexts – for example, as an aesthetic property, as a manifestation of a foreign accent, or as a feature of language typology (Hoeqvist, Reference Hoeqvist1983; Barry et al., Reference Barry, Andreeva and Koreman2009; Koreman et al., Reference Koreman, Van Dommelen, Sikveland, Andreeva and Barry2009). What is meant by ‘rhythm’ in these different contexts is primarily an auditory property.Footnote 1
Phonetic studies of rhythm have recently focused on measurable properties, more specifically, on the durational characteristics of speech (Low, Reference Low1998; Grabe et al., Reference Grabe, Post and Watson1999; Low and Grabe, Reference Low and Grabe1999; Deterding, Reference Deterding2001; Gibbon and Gut, Reference Gibbon and Gut2001; Low et al., Reference Low, Grabe and Nolan2001; Grabe, Reference Grabe, Low, Gussenhoven and Warner2002; Asu and Nolan, Reference Asu and Nolan2005; Russo and Barry, Reference Russo, Barry and Russo2010; see also Chapter 30). This is immediately understandable and plausible in the light of the early, auditory-based statements. Additionally, the concept of an acoustic foundation underpinning auditory language–rhythm discrimination further supports this idea, which reduced rhythmic differences between languages to syllable-timed – that is, with a claim of approximately equal syllabic intervals, or syllabic isochrony – and stress-timed – that is, with a claim of roughly equal foot intervals and reduced syllable durations between the accented syllables (Lloyd, Reference Lloyd1940; Abercrombie, Reference Abercrombie1965).
It is now generally accepted that none of the many attempts to find a physical reflex of isochrony have been successful in the past (Bolinger, Reference Bolinger, Abe and Tanekiyo1965; Wenk and Wioland, Reference Wenk and Wioland1982; Roach, Reference Roach and Crystal1982; Dauer, Reference Dauer1983, Reference Dauer1987; Manrique and Signorini, Reference Manrique and Signorini1983; Eriksson, Reference Eriksson1992; Deterding, Reference Deterding2001; Gibbon and Gut, Reference Gibbon and Gut2001; Wagner, Reference Wagner and Russo2010). Rhythm is no longer considered as a language primitive but rather as an emergent property, the product of phonological structure and phonetic realization. The shift from isochrony to variability led to the breakdown of the initial dichotomy in auditory perception, causing the disconnection of the syllable from its role as a fundamental unit of rhythm. The concept of syllable and foot regularity has been replaced by the degree of syllabic irregularity depending on the range of syllable complexity, with sub-syllabic durational measures as its acoustic basis (for an additional perspective in neuroscience, consider Chapters 3, 5, and 9; also, for the language acquisition view, see Chapters 35 and 36).
Moving somewhat away from what had been defined in the past as syllabic isochrony in all languages, in the new approaches the measurements of durational variation seem to serve more successfully to separate rhythmic types (Low, Reference Low1998; Ramus, Reference Ramus, Nespor and Mehler1999; Ramus et al., Reference Ramus, Nespor and Mehler1999; Grabe and Low, Reference Grabe, Low, Gussenhoven and Warner2002; Barry et al., Reference Barry, Andreeva, Russo, Dimitrova and Kostadinova2003; Russo and Barry, Reference Russo and Barry2004, Reference Russo and Barry2008a, Reference Russo and Barry2008b; Dellwo, Reference Dellwo, Karnowski and Szigeti2006; Mok and Dellwo, Reference Mok and Dellwo2008).
Speech is rhythmically structured in time (Chapter 32; Arvaniti, Reference Arvaniti1994, Reference Arvaniti2009; Cutler, Reference Cutler1994; Barry et al., Reference Barry, Andreeva, Russo, Dimitrova and Kostadinova2003; Russo and Barry, Reference Russo and Barry2008a, Reference Russo and Barry2008b, Reference Russo, Barry and Russo2010; Cummins, Reference Cummins2009; Barry and Andreeva, Reference Barry, Andreeva and Russo2010; Wagner, Reference Wagner and Russo2010). We expect a temporal regularity in the prominent syllables produced in natural, communicatively meaningful speech (see Chapter 35), given the multi-level nature of accentuation. This expectation holds true even if the acoustic basis of rhythm-carrying prominences does not show predictability in each production parameter (i.e., duration, fundamental frequency, intensity, and spectral definition). In a language without lexical stress, such as French (which features a phrase-final demarcative accent), supra-lexical information-based prominence is observed. It’s notable that accentuation effects in French primarily occur at the ends of phrases or stress groups (see Barry and Andreeva, Reference Barry, Andreeva and Russo2010). This prominence disrupts the typical pattern of temporal regularity (isochrony) in syllable sequences. Moreover, in normal speech (with or without a lexical stress system), the rhythm is still carried by the prominences within utterances, but we can rarely find a pattern of regular beats.
The rhythmic differences between language types should be audibly comprehensible, as well as quantitatively demonstrable. And if rhythm is part of a language, such differences should be related to phonology. This connection becomes effective and plausible because of the concepts of mora, syllable, and foot. Thus, the view has grown that the rhythmic character of a language is an emergent property, the product of phonological structure and post-lexical processes in speech production (Bolinger, Reference Bolinger, Abe and Tanekiyo1965; Dauer, Reference Dauer1983, Reference Dauer1987; Low, Reference Low1998; Ramus et al., Reference Ramus, Nespor and Mehler1999; Grabe and Low, Reference Grabe, Low, Gussenhoven and Warner2002; Barry and Russo, Reference Barry, Andreeva, Russo, Dimitrova and Kostadinova2003; Wagner, Reference Wagner and Russo2010).Footnote 2 In the task of rhythm measurement, prosodic patterns serve as a guiding factor. This implies that maintaining some degree of isochrony is crucial for the effective functioning of the rhythmic predictor, as rhythmic measurements capture two levels of speech organization. These measurements encompass both segmental and prosodic syllabic structures embedded within phrasal prosody (Couper-Kuhlen, Reference Couper-Kuhlen1993; Auer et al., Reference Auer, Couper-Kuhlen and Müller1999; Barry et al., Reference Barry, Andreeva and Koreman2009).
It is well known that rhythm measures have been conceived to capture the rhythm typology of different languages. They aim to assign the rhythm of an utterance to either the syllable-timed pole, characterized by less variability in vocalic durations, or to the stress-timed pole, which features greater variability in vocalic durations along the rhythmic continuum. Structurally based measures, which basically focus on different degrees of deviation from physical isochrony, appear to have been much more successful in differentiating languages’ rhythmicity (Ramus, Reference Ramus, Nespor and Mehler1999; Ramus et al., Reference Ramus, Nespor and Mehler1999; Low et al., Reference Low, Grabe and Nolan2001; Grabe and Low, Reference Grabe, Low, Gussenhoven and Warner2002; Barry and Russo, Reference Barry, Andreeva, Russo, Dimitrova and Kostadinova2003; Barry et al., Reference Barry, Andreeva, Russo, Dimitrova and Kostadinova2003; Kohler, Reference Kohler2009; Nolan and Asu, Reference Nolan and Asu2009; Chapter 30): Ramus’ delta values (∆C and ∆V) (see Ramus, Reference Ramus, Nespor and Mehler1999; Ramus et al., Reference Ramus, Nespor and Mehler1999), the standard deviation of the vocalic and consonantal intervals within an utterance, with in addition a measure of the vocalic proportion of the utterance (%V); and the pairwise variability indices (PVI) (Low et al., Reference Low, Grabe and Nolan2001).Footnote 3
These measures capture separately the degree of variability in the vocalic intervals (vowel duration, PVI-V, ∆V, etc.) and the intervocalic (consonantal) intervals (PVI-C, ∆C, etc.). They represent a reflection of the structural properties of the syllables. This seems to contradict the common assumption of isochrony theory, according to which the syllabic unit is the important element at the basis of rhythmic impression, although, of course, there are measures also based on variability in syllable duration.
Languages cannot be classified solely based on isochrony measures. However, they can be classified using both Ramus’ and Low’s structural measures (Ramus, Reference Ramus, Nespor and Mehler1999; Grabe and Low, Reference Grabe, Low, Gussenhoven and Warner2002; etc.). These measures visualize the stress-timed–syllable-timed continuum, identifying vocalic and consonantal dimensions along which any language might deviate from the prototypical rhythm in a sort of rhythm space (see Barry and Andreeva, Reference Barry, Andreeva and Russo2010).Footnote 4 These rhythmic measures capture various aspects of syllable complexity, making them suitable for comparing languages. These differences in complexity also impact the time required for articulating a syllable. These variability-based rhythm measures (PVI, ∆C, and ∆V) capture durational differences between consecutive vocalic and intervocalic intervals, which are correlated with differences in syllabic structure and the durational effects of degrees of prominence. However, rhythm measures, which focus on variability rather than isochrony (i.e., on the durational consequences of differences in syllable structure and phrasal modification), exhibit a less obvious connection between auditory impressions and physical measures (Barry and Russo, Reference Barry, Andreeva, Russo, Dimitrova and Kostadinova2003; Barry et al., Reference Barry, Andreeva, Russo, Dimitrova and Kostadinova2003; Asu and Nolan, Reference Asu and Nolan2005; Dellwo, Reference Dellwo, Karnowski and Szigeti2006; Mok and Dellwo, Reference Mok and Dellwo2008). Arvaniti (Reference Arvaniti2009) pointed out that there are no objective criteria for postulating a convincing degree of proximity or distance between measures to support a grouping or separation of languages. It’s important to acknowledge the challenge of relating recent rhythmic measures to any auditory perception of rhythm. As a result, we must question whether languages can truly be reliably differentiated based on such measures (Arvaniti, Reference Arvaniti2009; Barry et al., Reference Barry, Andreeva and Koreman2009; Russo and Barry, Reference Russo, Barry and Russo2010; Chapter 30).
46.1.2 Speech Rhythm and the Speech Rhythm Space in Stuttering
Speech impairments can have an impact on rhythm. This is particularly evident in the case of stuttering, a motor control disorder that affects 1% of the global population (Yairi and Ambrose, Reference Yairi and Ambrose2013). Stuttering speech is characterized by the presence of disfluencies, including repetitions of segments/sounds, syllables, words, prolongations of sounds, and interruptions (silent blocks), which can also manifest themselves as a glottal stop in the pre-phonatory posture (Guitar, Reference Guitar2013; Monfrais-Pfauwadel, Reference Monfrais-Pfauwadel2014; Onslow, Reference Onslow2020). Consequently, predictive rhythmic timing is malfunctioning in stuttering children, adolescents, and adults, since their ability in rhythmic speech production and timing is compromised.
People who stutter know exactly what they want to say but are temporarily unable to articulate their speech due to muscle contractions. This sets them apart from non-stuttering individuals who also produce disfluencies, which are more reflective of lexical search or lexical planning time (Lickley, Reference Lickley, Bertini, Celata, Lenoci, Meluzzi and Ricci2018). Being hindered from producing their speech can lead to negative feelings in people who stutter, such as frustration or embarrassment, to the point where speakers may fear speaking up, avoid eye contact with their interlocutor, and/or isolate themselves.
There are two types of stuttering: developmental stuttering and acquired stuttering. Developmental stuttering typically begins between the ages of two and seven and disappears in 80% of cases. Acquired stuttering is a generic term for all stutters that are not developmental. It can be caused by a stroke, tumour, head injury, side effects of certain medications, and so on (Guitar, Reference Guitar2013).
In this chapter, we will focus solely on developmental stuttering. Its origin is multifactorial, involving neurological (Etchell et al., Reference Etchell, Civier, Ballard and Sowman2018) and genetic factors (Riaz et al., Reference Riaz, Steinberg and Ahmad2005; Domingues and Drayna, Reference Domingues and Drayna2015). Apart from these aspects, stuttering is also influenced by several linguistic and/or phonetic factors (Howell et al., Reference Howell, Au-Yeung and Sackin1999; Au-Yeung et al., Reference Au-Yeung, Vallejo Gomez and Howell2003; Buhr and Zebrowski, Reference Buhr and Zebrowski2009). This speech disorder primarily affects the first syllable at the beginning of a turn-taking (Monfrais-Pfauwadel, Reference Monfrais-Pfauwadel2014). Lexical words such as nouns and verbs tend to be more disfluent in adults who stutter compared to functional words. Similarly, stressed syllables are more difficult to pronounce for people who stutter compared to unstressed syllables. Moreover, typical stuttering disfluencies have the peculiarity of being able to break within syllables instead of occurring between syllables or words. They are usually accompanied by tension that may be audible.
Stuttering has an impact on the timing and rhythmic flow of production since it affects timing mechanisms (Guitar, Reference Guitar2013; Monfrais-Pfauwadel, Reference Monfrais-Pfauwadel2014; see DSM-5 in Crocq et al., Reference Crocq, Guelfi, Boyer, Pull and Pull-Erpelding2015; Didirková et al., Reference Didirková, Le Maguer and Hirsch2021).Footnote 5 We know, for example, that the oro-laryngeal timing of people who stutter has particular characteristics. In particular, voice onset time (VOT) and voice termination time (VTT) are longer in this category of speakers than in people who do not stutter (Agnello, Reference Agnello, Webster and Furst1975). Other research, based on electromagnetic articulography (EMA) data, has shown breaks in articulatory timing at the supraglottal level (Didirková et al., Reference Didirková, Le Maguer and Hirsch2021). Stuttering demands a temporal adaptation from speakers when synchronizing rhythmical movements to provide a structural grid of regularity and recurrence. Stuttering affects notably the background of regularity (i.e., the underlying rhythm of speech), the sequences of evenly spaced phonetic material, matched segments, and syllables. Thus, it can be defined as a neurodevelopmental disorder that disrupts the temporal organization of speech. Monfrais-Pfauwadel (Reference Monfrais-Pfauwadel2014: 2) speaks of audible and perceptible traces of motor and then psychic struggle in contrast with normal speakers. This is consistent with accounts of interruptions (freezing) in stuttering (see Assaneo and Poeppel, Reference Assaneo and Poeppel2018; Alm, Reference Alm2021; Orpella et al., Reference Orpella, Flick and Assaneo2024 on the interaction between auditory and speech-motor cortices, and the synchronization between auditory and speech-motor regions related to speech rates). Orpella et al. (Reference Orpella, Flick and Assaneo2024) suggest that there is a reactive inhibitory control response from stutterers when they produce a word that will likely be stuttered. Technically, persons who stutter (PWS) show deactivation of left-hemisphere sensorimotor structures and overactivation of right-hemisphere parts. The problem is due to a lack of motor integration to regulate the movements of speech.
Studies on PWS have evaluated the speech on rhythmic measures such as rate. They have already shown that people who stutter do not use a typical tempo in speech and do not have a rhythmic speech (Boecher et al., Reference Boecher, Franich and Usler2022). PWS have specific patterns in perceptually non-fluent speech, mainly characterized by a lack of coordination between supraglottal articulations and laryngeal gestures; they have a longer laryngeal movement reaction, compared with fluent speech produced by persons who do not stutter (PWNS) (Zimmermann, Reference Zimmermann1980; Van Lieshout et al., Reference Van Lieshout, Hulstijn and Peters1996; Max and Gracco, Reference Max and Gracco2005; Heyde et al., Reference Heyde, Scobbie, Lickley and Drake2016; Didirková et al., Reference Didirková, Le Maguer and Hirsch2021). This affects the temporal variability of oral articulations and the speech rate. A longer duration of onset movements than in PWNS, closing gestures, complex consonant clusters, or vowel nuclei are encouraged by the steady position of the phonatory system, lips, or jaws. In PWS some articulatory movements show high velocity despite lower tempo, a negative correlation that could reflect defective speech–brain synchronization; in line with this proposal, the brains of PWS seem to exhibit alterations, resulting in less stable speech-motor planning and execution (Alm, Reference Alm2004, Reference Alm2021; Alario et al., Reference Alario, Chainay, Lehericy and Cohen2006). These factors lead PWS to asynchronous movements and a variable articulatory behaviour. Consequences of this are the stuttering-like disfluencies mentioned above and the difficulties for PWS to increase their speech rate (Howell et al., Reference Howell, Au-Yeung and Sackin1999). Thus, PWS show a poor temporal coordination, variable gestural movements, and a dysfunctional inter-articulatory coordination (Didirková et al., Reference Didirková, Le Maguer and Hirsch2021).
The aim of this chapter is to study how rhythm is disrupted in stuttering speech by comparing adults who stutter (PWS) with typically developing adults (PWNS) (n = 14 per group). We assess simple and complex rhythmic chunks to achieve this. Speech rhythm has been quantified using rhythmic measures (the PVI from Grabe and Low, Reference Grabe, Low, Gussenhoven and Warner2002; ∆V and ∆C from Ramus, Reference Ramus, Nespor and Mehler1999; Ramus et al., Reference Ramus, Nespor and Mehler1999). Both PVI and ∆V/∆C provide a diagnostic frame for identifying the two-dimensional presentation of the values (vocalic or consonantal) along which stuttered speech deviates from the prototypical normal speech.
46.1.3 Methods
Among the types of stuttering described in the literature (Yairi and Ambrose, Reference Yairi and Ambrose2013; Ward, Reference Ward2018), our study deals with persistent developmental stuttering, which generally starts between ages three and seven and remains persistent from adolescence to adulthood (Didirková et al., Reference Didirková, Le Maguer and Hirsch2021). A corpus study was conducted, and the raw and normalized pairwise variability index (nPVI) was computed for individual utterances to distinguish PWS from PWNS. We quantified rhythmicity in the speech of PWS using PWNS as control subjects.
46.1.4 Corpus and Participants
Our corpus investigation is based on audiovisual recordings coming from the French ANR project under grant no. ANR-18-CE36–0008 (BENEPHIDIRE: Bégaiement: la Neurologie, la Phonétique, l’Informatique pour son Diagnostic et sa Rééducation, PI: Fabrice HirschFootnote 6). The main objective of this ANR project is to enhance our understanding of stuttering to facilitate diagnosis and treatment of this disorder by speech-language therapists. To collect the data, a multidisciplinary team, composed of researchers in linguistics, computer scientists, neurologists, along with therapists specialized in treating this disorder, was assembled. This ANR project acquired morphological brain-imaging data, articulatory data using dynamic MRI, and acoustic data.Footnote 7 Our study is part of the work package aimed at studying the acoustic and motor characteristics of disfluencies.
We analysed data from 28 French native speakers (14 males and females who stutter; 14 males and females who do not stutterFootnote 8), who participated in an interview task conducted by a speech pathologist (a phoniatrist), accompanied by a speech therapist. The French treatment model is based on a relaxed style of interacting and motor rehabilitation in order (1) to reduce avoidance of speaking and (2) to develop gradually normal speech and to eliminate negative feelings. The therapy aims at restoring flexible and spontaneous speech that allows patients to express themselves even when disfluencies persist in conversational settings with smooth transitioning between listening and speaking.
The participants were asked by a phoniatrist to perform several tasks in the way of semi-directed speech and reading. The semi-spontaneous speech focuses on the description of a typical day, hobbies, Covid period and life, the emotional experience of the person with stuttering. Participants (PWS and PWNS) completed the interview task and a reading passage during the same interview under clinical test-taking conditions. Thus, PWS and PWNS participants were engaged in an in-person conversation. Control participants completed the same tasks and reading passage as PWS and matched the same questions. We measured for each speaker 13 minutes of the interview task, distributed over nine minutes of semi-spontaneous speech and four minutes of the reading task. The task also included a syllable-timed speech test as a training device aimed at enhancing speech in PWS. With this device, PWS were pushed to produce their speech with more isochronous intervals. The stuttering of our PWS was evaluated as severe by their speech therapist on the Riley’s Stuttering Severity Instrument scale (Riley, Reference Riley1994).
In the following sections we show the analysis conducted on four speakers (two per group PWS and PWNS).Footnote 9 We extracted 229 spontaneous speech samples from the recorded interviews. All samples were longer than four syllables (ips = inter-pause stretches > four syllables), matched for length and tasks in terms of PWNS. The ips are the utterance units used for calculating individual rhythm measures, which are then grouped and averaged over speakers. In addition to spontaneous speech, a total of 79 read speech samples were extracted.
46.2 Analysis
The use of purely durational measures to capture the rhythmic effects might appear like an oversimplification, but in fact many structural properties of speech are linkable to duration (i.e., length properties). In PWS, there is a reduced amount of time available for articulatory gestures. The reduction in articulatory time leads to articulatory changes. These changes in articulation affect the quality of vowels and consonants. Additionally, alterations in speech timing occur as a result of these changes. This is why word length has also increased the rhythmic variability in PWS.
We used two approaches in our study: an automatic analysis and a manual analysis. Data analysis relied first on the auditory and acoustic identification of stuttered utterances. The manual method allowed us to better highlight the stuttered sequences. Phrase boundaries were defined for utterances as syntactic boundaries or pauses (typical disfluencies) produced by the speaker. For our rhythmic computation, non-pathological disfluencies, revisions, or filler pauses were removed from measures, so it was possible to identify prosodically uninterrupted ‘inter-pause stretches’ (ips), while stuttered (supraglottal) disfluencies within phrase boundaries were considered as part of segmental stutterers’ production.Footnote 10 Therefore, we assume that stuttering-like disfluencies, segment/syllable repetitions, prolongations, and stuttering blocks count for rhythmic intervals.Footnote 11
This extraction process was performed using the speech editor Praat (software version 6.3.09).Footnote 12 We compared the duration of acoustic segments in the speech of PWS prior to and following the use of speech techniques, that is, the automatic speech recognition and rhythm quantification based on the variability of vocalic and intervocalic intervals (see Section 46.1). The segmentation, aligned with the speech signal, was based on an acoustic-perceptive identification, as well as on automatic segmentation (see below).
This section also provides acoustical evidence for some basic differences in the syllable structure of PWS and PWNS, which can be expected to result in systematically divergent rhythmic measures. We applied the following method. The extracted speech samples were transcribed orthographically using an automatic speech recognition system called Whisper, an open-source project available at https://github.com/openai/whisper. The transcription was saved as a text file (.txt). For the purpose of this work, audio recordings were converted to .wav format and analysed in Praat. The entire corpus was first transcribed orthographically in automatic mode (see below) before being segmented and annotated semi-automatically using Praat.
After transcription, the speech samples were automatically segmented into phonetic and word segments using the WebMAUS Basic Service, a web-based tool provided by the Phonetics and Phonology Group at the Ludwig Maximilian University of Munich. Its interface can be accessed at https://clarin.phonetik.uni-muenchen.de/BASWebServices/interface/WebMAUSBasic. The transcription and segmentation results were then manually verified and corrected if necessary, ensuring the accuracy of the data. All segmentation boundaries were moved to their nearest zero-crossings using a Praat script called ‘move-to-zero.praat’ (see Figure 46.1, tiers 1, 2, 3).Footnote 13 A fourth tier was inserted to label all segmental events as a consonant or a vowel based on the phonetic transcription in the third tier (see Figure 46.1, tier 4) using a Praat script called ‘relabel_merge_interval.praat’.Footnote 14
Spectrogram: tiers and intervals.
Spectrogram illustrating characteristic disfluencies in the speech of a PWS, including prolonged intervals and atypical rhythm patterns. Visible disruptions in speech flow are evidenced by irregular spacing between phonetic elements, reflecting the temporal dynamics of stuttering. Vocalic and intervocalic intervals on tier 5.
Various X-SAMPA symbols were employed for annotation purposes in our study, such as in Figure 46.1 (see <p:> for stuttered pause).Footnote 15 The tier 5 in Figure 46.1 indicates the interval, whether it is vocalic or intervocalic (= consonantal). For more details on the definition of vocalic and intervocalic intervals see Section 46.2.3.Footnote 16 The specific annotation tier 5 was added to identify the stuttered PVI interval. This includes stuttered disfluencies, such as prolongations (consonantal and vocalic lengthening such as [kkkkkɑ̃] ‘when’, [ssssssɥi] ‘(I) am’, i.e., elongations of a sound); repetitions (segments, syllables, words) annotated on to interval measures for PWS; and blocks in utterance-internal phrase if any (silent intervals between two segments or syllables, combined with spasmodic tension and movements; see Didirková and Hirsch, Reference Didirková and Hirsch2020; Didirková et al., Reference Didirková, Le Maguer and Hirsch2021; also see Figures 46.2 and 46.3).
Spectrogram: stuttering on consonants (speaker B31).
Spectrogram of stuttered speech. This visual representation captures the prolonged and repeated articulations typically seen in PWS, such as extended consonant intervals and the irregular vocalic segments, reflecting the disrupted timing and rhythm patterns that challenge the regular speech flow.
Spectrogram: stuttering on vowels at the beginning of the utterance (speaker 00001bis).
Spectrogram highlighting the pattern of stuttering on vowels at the beginning of an utterance in a person who stutters. The image showcases the characteristic stuttering disfluencies including a high number of repetitions, prolongations, and blocks, illustrating the unique temporal dynamics and rhythm disruptions encountered in stuttered speech.
A high number of repetitions, prolongations, and blocks were identified in our analysis. By ‘stuttered’ block, we mean a disfluency made up of a silent duration between two segments or syllables associated with tension, whereas the stuttered prolongations are identified as an identical structure of the formants (for vowels and sonorants) or spectral cues typical of a consonantal sound. Stuttered disfluencies are only produced by PWS.
46.2.1 Rhythm Measurements and the PVI: A Quantitative Analysis
We highlight that the rhythmic measures introduced in Section 46.1, such as PVI-V and ∆V, reflect differences between languages with only single-slot syllabic nuclei and those with single and double-slot nuclei. Additionally, PVI-C and ∆C measures are sensitive to differences in onset and coda structure (see Russo and Barry, Reference Russo, Barry and Russo2010). Thus, a language with more variable onset and coda structure, long and short vowels, and a reduction of unstressed syllables will generate higher variability measures than a language without such features. Furthermore, it’s important to note that the same rhythmic measures, calculated for the same language but from two different corpora, can result in radically different typological associations in terms of rhythmicity.
We calculated the variability of vowel and consonantal duration and computed rhythmicity of the PWS utterances, adopting the PVI methodology first proposed by Grabe and Low (Reference Grabe, Low, Gussenhoven and Warner2002) to measure rhythmic duration. The basic hypothesis to be tested is that the range of vowel variability, consonantal duration, possible syllable complexity, and other phonological differences between PWS and PWNS lead to an important difference in the rhythm measures between groups. Quantified rhythmicity thus depends on the intersection of multiple parameters, and it is defined in terms of degree rather than rhythmic dichotomy (see Barry and Andreeva, Reference Barry, Andreeva and Russo2010).
The rhythmic nature of the speech alterations in stuttering also leads us to some understanding of the cognitive phonological processes behind the behavioural PWS data. We conducted measurements on vocalic intervals and the intervals between vowels (excluding ‘normal’ disfluencies, such as pauses and hesitations) within a speech passage. We calculated the PVI, the mean difference in vocalic and intervocalic intervals from one vowel or one consonantal interval to another (raw PVI (rPVI) and normalized PVI (nPVI)).
This index of variation quantifies the extent of variability observed in consecutive measurements. Equation (1) provides the rPVI.
(1)


where m is the number of intervals and dk is the duration of the k-th interval. In (1), rPVI (PVI-C) is not normalized for speech rate. However, a normalized PVI, which relates the difference between intervals to the mean duration of the two intervals, was introduced by Deterding (Reference Deterding2001) (cf. Low et al., Reference Low, Grabe and Nolan2001) as an explicit correction for tempo change.Footnote 17 Thus, speech rhythm was quantified in our study between successive vowels also using the nPVI. This nPVI version is represented by the following equation in (2) (see Deterding, Reference Deterding2001; Barry and Russo, Reference Barry, Andreeva, Russo, Dimitrova and Kostadinova2003; Russo and Barry, Reference Russo and Barry2008a, Reference Russo and Barry2008b, Reference Russo, Barry and Russo2010; among others).
(2) nPVI

In (2), the duration (d) of a vowel (k + 1) is subtracted from the duration of the preceding vowel (k) and divided by their average duration. The absolute values of the resulting subtotals are summed up and divided by the number of vowels in the phrase (m) minus one. The result is multiplied by 100 to obtain a normalized score.
The normalization method used for PVI-V (but not for PVI-C) shows that the nPVI-V reduces local inter-syllabic differences, such as stressed versus unstressed or short versus long vowel, which are essential cues of rhythmic impressions. Thus, the range of vowel variability is generally reduced in comparison to Ramus measures (∆V and ∆V; see Section 46.3), but, as will be shown below, its sensitivity to tempo effects remains.
PVI-V captures the degree to which consecutive vowel durations vary: (a) long versus short vowels, b) phonetic variation due to differences in degree of aperture – the effects of phrasal accentuation. The PVI-C captures, on the other hand, the degree to which consecutive consonantal durations vary (e.g., single consonants or consonant clusters). PVI-V and PVI-C provide a measure of variation that takes the sequential nature of rhythmic impressions into consideration. The PVI-C measure captures the degree to which consecutive consonantal durations vary (i.e., single consonants or clusters).
We performed all the calculations of rPVI and nPVI for vocalic and intervocalic intervals using R Core Team (2021). Vocalic intervals were identified as the portion of the signal between the onset and offset of a vowel, characterized by vowel formants. This definition encompassed sections with varying numbers of vowels, including monophthongs or multiple vowels spanning across the transition between adjacent words.
Intervocalic intervals, on the other hand, were defined as the segment of the signal between the offset of one vowel and the onset of the subsequent vowel, regardless of the number of intervening consonants. To measure the duration of both vocalic and intervocalic intervals, we employed a left-to-right approach using wideband spectrograms in Praat. Our first query was whether r/nPVI were different between PWS and PWNS. The higher values of rPVI-C (as for ∆C) indicate that PWS speech is sensitive to complex consonantal structures in the onset and coda of a syllabic structure, as commonly found in languages with a predominant C(C)VC(C) structure.
To offer a broader perspective and some possibility for comparison, we calculated (in Section 46.3) both the sequentially calculated pairwise variability measures (PVI) using the pairwise normalization procedure for vowels (Grabe and Low, Reference Grabe, Low, Gussenhoven and Warner2002) and the three global measures used by Ramus et al. (Reference Ramus, Nespor and Mehler1999) applied to both stuttering and normal speech and the speech rate (the number of vowel intervals per second, including pauses) (3).
(3) Ramus measures
%V (within ips = inter-pause stretches)
∆V – standard deviation of vocalic intervals
∆C – standard deviation of intervocalic intervals
The variability of vocalic and intervocalic (consonantal) intervals are taken by both Ramus and by Grabe and Low as correlates of the complex interaction of structural properties. However, their way of calculating the variability is different. The Ramus %V measure does not capture variation, and ∆V and ∆C are measures of overall vocalic and consonantal variation rather than an accumulative pairwise measure. The vocalic proportion of the utterance (%V), as a measure, is difficult to interpret in connection with any concept of rhythm.
46.3 Results
In this section, we present the results of stuttered speech from two speakers, comparing them with two non-stuttering speakers. The sample size is insufficient to conduct inferential statistical analyses. Therefore, we provide only descriptive statistics, including percentages and standard deviations, following the approach outlined by Ramus et al. (Reference Ramus, Nespor and Mehler1999). We also report observations of rPVI and nPVI across different speech conditions (stuttered versus fluent) and speech styles (read versus spontaneous). Moreover, we examine differences among individual speakers. We computed the average duration of speeches, including both fluent and stuttered speech, categorized according to various contextual factors. Error bars on the graph depict the standard error of the mean (SEM).
In Table 46.1 and Figure 46.4 we display the outcomes for our four speakers (two per group, PWS and PWNS). These results include the standard deviation of durations for vowel and intervocalic consonantal intervals (∆V and ∆C, respectively, shown in Figure 46.4), alongside the percentage of vowel intervals (%V) and consonantal intervals (%C) within ips. Additionally, we detail the proportion and standard deviation of computed pauses and hesitations.
Comparative analysis of vocalic and intervocalic intervals, pauses, and hesitations in stuttered versus normal speech. This table presents the percentages of vocalic intervals (%V) and intervocalic intervals (%C), as well as the proportions of pauses and hesitations, for both PWS and PWNS.
| Stuttering | Normal speech | |
|---|---|---|
| Intervocalic | 46.4% | 48% |
| Vocalic | 48.3% | 49.9% |
| Pauses | 2.5% | 1% |
| Hesitations | 2.7% | 0.45% |
Average standard deviation of vocalic intervals, intervocalic intervals, duration of pauses, and duration of hesitations.
Variability in speech patterns: comparing standard deviation of speech components between PWS and PWNS. This bar graph quantifies the standard deviation for vocalic intervals, intervocalic intervals, pauses, and hesitations. The data show PWS experience more variability in the duration of pauses and hesitations, indicative of stuttering disfluencies. PWNS show lower standard deviation in both vocalic and intervocalic intervals, indicating more consistent timing. This increased variability in intervocalic intervals among PWS suggests a disruption in speech rhythm typical of stuttering patterns.
Figure 46.4 Long description
The bars represent normal and stutter, respectively. The values of standard deviation are as follows. Stutter: Hesitation, 280. Pause; 280. Intervocalic; 170. Vocalic, 150. Normal: Pause; 140. Hesitation, 120. Vocalic, 70. Intervocalic; 65. The values are estimated.
The calculations in Table 46.1 show that stuttered speech exhibits a higher percentage of pauses and hesitations compared to normal speech. Notably, the percentage of vocalic intervals (%V) remains consistently reliable across our speakers. Measures such as %C and %V do not effectively differentiate between PWS and PWNS. In contrast, stuttering disfluencies prove to be more distinguishing factors between the two groups. In Figure 46.4, the average and standard deviation of vocalic intervals, intervocalic intervals, duration of pauses, and hesitations show differences for ∆V and ∆C. The differences observed in the average and standard deviation (∆V and ∆C) between PWS and PWNS can be attributed to the distinct speech patterns associated with stuttering: disfluencies (such as repetitions, prolongations, and blocks) can lead to differences in the timing and duration of vocalic intervals and consonantal intervals between the two groups. PWS exhibit more variability (higher standard deviation) in these intervals due to the interruptions caused by disfluencies. Stuttering involves disruptions in the neural processes responsible for speech production and motor control. These disruptions can lead to inconsistencies and variability in the timing and duration of speech intervals, as well as in the deviation of these intervals from the expected norms.
In Figure 46.4, we see that PWNS have a lower standard deviation in vocalic intervals than PWS. This suggests that PWNS have less variability in the duration of their vocalic intervals. The standard deviation for intervocalic intervals is lower for PWNS compared to those who stutter, which again indicates less variability for the non-stuttering group in the timing between vowels across consonants. For the duration of pauses, the standard deviation is higher for PWS. This implies that the length of pauses among PWS varies more than PWNS. Furthermore, Figure 46.4 shows a higher standard deviation for PWS in the duration of hesitations, suggesting greater variability compared to PWNS. Thus, it appears that PWS have more variability in the duration of their pauses and hesitations but less variability in vocalic and intervocalic intervals compared to PWNS. This could reflect a compensation mechanism where PWS try to maintain a steadier rhythm in some speech components while experiencing more variability in others, as a response to the disruptions caused by stuttering.
Figure 46.5 presents the average duration of various speech elements for PWS and PWNS, categorized according to different contextual factors such as vocalic and intervocalic intervals, pauses, and hesitation, with error bars indicating the SEM. We observe the following. For the vocalic intervals, both PWS and PWNS show relatively short average durations, with PWS having slightly longer vocalic intervals on average, as indicated by the error bars; for the intervocalic intervals, again PWS show longer average duration compared to PWNS. The average duration of pauses is notably longer for PWS. This difference is clearer, as shown by the lack of overlap in the error bars. There is a significant difference in the average duration of hesitations, with PWS showing much longer durations. This is due to the individual’s attempt to avoid or postpone stuttering events, which results in prolonged filler sounds or silent blocks. The error bars indicate the variability of each measurement, and we can see that there is greater variability in the duration of hesitations for both groups, but it is most pronounced in PWS. This aligns with the variable nature of stuttering and how it can impact different aspects of speech timing. Overall, PWS tend to have longer durations of pauses and hesitations, which can be attributed to the speech disfluencies characteristic of stuttering.
Average duration of speech according to vocalic intervals, intervocalic intervals, pauses, and hesitation.
Comparative duration of speech elements in stuttering and normal speech. This bar chart presents the mean durations of vocalic and intervocalic intervals, pauses, and hesitations for both normal speakers and PWS. PWS demonstrate longer and more variable durations for pauses and hesitations, highlighting the temporal disruption characteristic of stuttered speech.
Figure 46.5 Long description
The bars represent normal and stutter, respectively. The mean values of duration are as follows. Stutter: Hesitation, 812.5. Pause; 500. Intervocalic; 125. Vocalic, 125. Normal: Hesitation; 375. Pause, 175. Vocalic, 100. Intervocalic; 100. The values are estimated.
In Figure 46.6, the standard deviation of vocalic and intervocalic intervals, as well as the duration of pauses and hesitations, are compared across read and spontaneous speech modalities for PWS and PWNS. This figure presents a clear distinction between read and spontaneous speech, showing that the rhythmic measures are indeed text-dependent. In the context of read speech, PWS show higher standard deviation compared to PWNS, suggesting more variability in the duration when reading. For intervocalic intervals, again, PWS display higher standard deviation during read speech, indicating more inconsistency in the timing between vowels across consonants. For PWS, the standard deviation for pauses is higher compared to PWNS, indicating that even in a controlled reading environment, PWS exhibit more variability in their pausing. There is a significant increase in the standard deviation of pauses for PWS during reading tasks. For hesitations, PWS have a notably higher standard deviation, reflecting much more variability in the occurrence and duration of hesitations when compared to PWNS in read speech. In spontaneous speech, the variability in the duration of vocalic intervals for PWS increases further, as evidenced by the standard deviation, surpassing that of PWNS. Similarly, the standard deviation for PWS in intervocalic intervals during spontaneous speech is greater than for PWNS, indicating a heightened level of variability. The variability in pauses for PWS in spontaneous speech also increases, maintaining a higher standard deviation compared to PWNS. The standard deviation of hesitations in spontaneous speech for PWS is significantly higher than for PWNS. We use here ‘significantly higher’ in a descriptive sense, observing that Figure 46.6 indicates a noticeably larger standard deviation for PWS, which suggests more variability in their hesitations during spontaneous speech compared to PWNS.
Effect of speech style: read and spontaneous.
Variability in speech components during read and spontaneous speech. The bar graph compares the standard deviation of vocalic and intervocalic intervals, pauses, and hesitations for both PWS and PWNS across read and spontaneous speaking tasks. Notably, PWS exhibit a higher standard deviation in intervocalic intervals than PWNS in both speech contexts, which is indicative of greater timing irregularities during stuttered speech. This variability is more pronounced during spontaneous speech, suggesting that unplanned speaking poses additional challenges for PWS.
Figure 46.6 Long description
The bars represent normal and stutter, respectively. The values of standard deviation are as follows. Left. Stutter: Pause; 280. Vocalic, 170. Intervocalic; 120. Normal: Pause, 125. Vocalic, 50. Intervocalic; 40. Right. Stutter: Hesitation; 300. Pause; 270. Intervocalic, 170. Vocalic, 130. Normal: Pause, 152. Hesitation; 120. Vocalic, 80. Intervocalic; 60. The values are estimated.
Figure 46.7 illustrates the mean duration of various speeches (normal and stuttered) within the four contextual categories across distinct speech styles (read and spontaneous), with error bars representing the SEM. For read speech, both PWS and PWNS have similar, relatively short mean durations for vocalic intervals, but PWS have slightly higher variability as indicated by longer error bars. For intervocalic intervals, PWS show longer mean durations with greater variability than PWNS. This may indicate more difficulty in transitioning between sounds. The mean duration of pauses for PWS is much longer than for PWNS, with significantly larger error bars. PWS demonstrate a longer mean duration for hesitations compared to PWNS, along with greater variability, as evidenced by the longer error bars. In spontaneous speech, the mean durations for vocalic intervals are relatively similar between PWS and PWNS; however, PWS exhibit more variability. Again, PWS have longer mean durations for intervocalic intervals than PWNS, with larger error bars indicating more variability. PWS have longer pauses on average than PWNS in spontaneous speech as well, and the variability is quite high. PWS have a notably longer mean duration of hesitations and also show considerable variability in these durations. The error bars suggest that the variability in speech patterns is contextually influenced. The larger error bars for PWS across all categories indicate that stuttered speech is more variable and less predictable than non-stuttered speech, particularly in spontaneous contexts. In Figure 46.7, the intervocalic intervals for PWS appear to have longer mean durations than those for PWNS in both read and spontaneous speech, which could suggest that these intervals are particularly affected by stuttering. The error bars for the PWS group are noticeably longer in the intervocalic category compared to the PWNS group, indicating greater variability around the mean. This greater variability for PWS suggests that intervocalic intervals might be a key area where stuttering manifests, potentially due to the motor coordination needed to transition between sounds or the timing required to articulate consonants that come between vowels.
Mean duration of normal and stuttered speech across read and spontaneous tasks.
Duration of speech elements in read and spontaneous speech. The bar graph illustrates the average duration of vocalic and intervocalic intervals, pauses, and hesitations for PWS compared to PWNS during read and spontaneous speech. The graph indicates that PWS experience longer and more variable durations of these speech components, especially during spontaneous speech, highlighting the increased challenges faced by PWS in real-time conversational contexts.
Figure 46.7 Long description
The bars represent normal and stutter, respectively. The values of duration are as follows. Left. Stutter: Hesitation, 1100. Pause, 480. Vocalic, 175. Intervocalic, 175. Normal: Pause, 100. Vocalic, 80. Intervocalic, 80. Right. Stutter: Hesitation, 700. Pause, 600. Intervocalic, 125. Vocalic, 120. Normal: Hesitation, 300. Pause, 250. Intervocalic, 125. Vocalic, 120. The values are estimated.
The results also show that PWS severely speak with a lower speech rate than speakers who stutter less severely or who speak in a ‘normal’ way, that is, normal subjects;Footnote 18 see Figures 46.8 and 46.9.
Comparison of speech rates between PWNS and PWS.
Speech rate distribution for PWS versus PWNS. This box plot reveals that PWS generally have a slower speech rate than PWNS, as evidenced by the lower median value. The plot also shows a wider range of speech rates among PWS, indicating greater variability within this group.
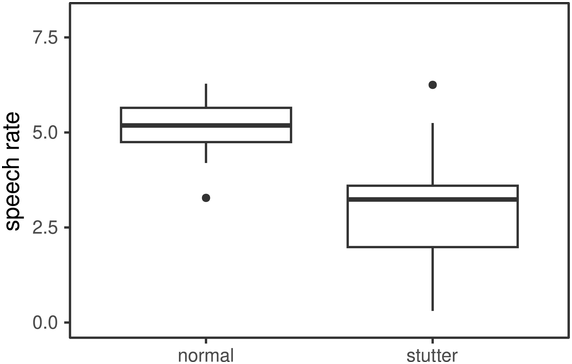
Speech rate: effect of speech style.
Speech rate in read and spontaneous speech for PWS and PWNS. The box plots compare speech rates, showing that PWS have a consistently slower speech rate than normal speakers in both read and spontaneous speech modes. The wider spread of rates for PWS during spontaneous speech suggests greater variability in speech production when speaking without a script.
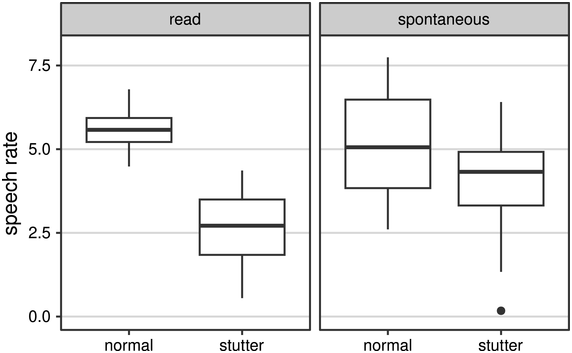
Figure 46.9 Long description
Left. The median speech rate for normal and stutter speeches are 5.3 and 2.6, respectively. Right. The median speech rate for normal and stutter speeches are 5.3 and 2.6, respectively. The values are estimated.
We quantified speech rate by dividing the number of vocalic intervals by the total time in seconds of each utterance. The median value, indicated by the line in the middle of each box, is lower for PWS compared to normal speakers. This suggests that, on average, PWS have a slower speech rate. The boxes represent the interquartile range (IQR), which is the middle 50% of the data. The IQR for PWS is narrower and shifted lower on the scale, indicating that most PWS have a lower speech rate compared to most normal speakers. The dot above the ‘normal’ category indicates an outlier, a speech rate that is unusually high compared to the rest of the data for normal speakers. The figure underscores the impact of stuttering on speech rate, showing that stuttering tends to slow down speech and reduce variability in speech rate among PWS. This information is crucial for understanding and developing therapeutic strategies to help PWS manage their speech rate and improve communication effectiveness.
In Figure 46.9, we compare the speech rate of PWNS and PWS during read and spontaneous speech tasks. In read speech, the median speech rate for PWNS is higher than for PWS, indicated by the median line within each box. This suggests that during read tasks, PWS generally speak more slowly. The median speech rate for PWS in spontaneous speech appears to be lower than for PWNS, consistent with the pattern seen in read speech. The IQR for PWS in spontaneous speech is narrower than for PWNS, and the median is lower, reinforcing that PWS have a more confined range of speech rates and generally slower speech. PWS show longer whiskers in spontaneous speech compared to read speech, indicating a broader range of speech rates in spontaneous conditions. However, the median is still lower than that of PWNS, underlining a slower speech rate for PWS. The sequential Grabe and Low variation measures also showed notable effects for intervocalic (consonantal) variation.
In Figure 46.10, we present the PVI results for all utterances, including both raw for consonantal intervals and normalized for vocalic intervals, along with a comparison of rhythm patterns between stuttering and normal speech in both read and spontaneous conditions. Each point in the figure represents the results of individual utterances, with vocalic nPVI values plotted on the vertical axis and intervocalic rPVI values on the horizontal axis.
PVI (raw and normalized) results for all utterances (PWS and PWNS).
PVI in read and spontaneous speech for PWNS and PWS. This scatterplot displays individual utterances, comparing vocalic nPVI and intervocalic rPVI. The data points illustrate that PWS, particularly in spontaneous speech, tend to have higher intervocalic rPVI values, signifying greater variability in the timing of their speech and reflecting the rhythmic irregularities associated with stuttering.
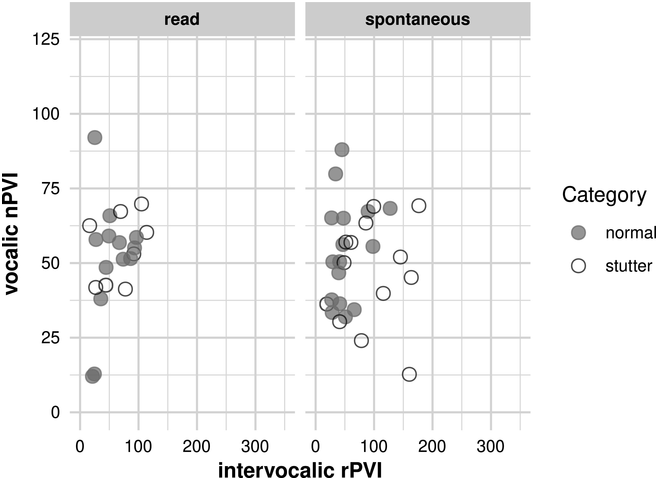
Figure 46.10 Long description
The horizontal axis represents intervocalic r P V I which ranges from 0 through 300. The vertical axis represents vocalic n P V I which ranges from 0 through 125. It plots data points for normal and stutter.
In read speech, PWS tend to have greater variability in both vocalic and intervocalic intervals. In the spontaneous section, while there is some overlap between PWS and PWNS, PWS still tend to show higher vocalic nPVI and intervocalic rPVI values. This suggests that in spontaneous speech, the pattern continues, with PWS displaying greater rhythm variability. In spontaneous speech, points representing PWS are further right on the horizontal axis than those for PWNS; this indicates higher rPVI values for PWS, suggesting greater variability in their intervocalic intervals.
The result from Figure 46.10 regarding rPVI-C is consistent with the acoustic analysis we conducted, and it appears to be correlated with frequent repetitions and prolongations of consonants, especially in onset positions of syllables. Additionally, it is associated with tense pauses (blocks), during which a word sequence fails to initiate.
On the vertical axis, higher points indicate greater variability in vocalic intervals. PWS who have higher nPVI values show more variability in the rhythm of their vocalic intervals. The high nPVI-V values for PWS also reflect prolonged vocalization associated with stuttering, as well as prolonged pauses between vocalization chunks. The higher rPVI-C for PWS is consistent with the presence of speech disfluencies shown above. These disruptions in the speech flow contribute to the irregularity of consonantal intervals, which is captured by a higher rPVI measure.
The figure provides a visual confirmation of these descriptions, showing that stuttered speech can be differentiated from ‘normal’ speech in terms of temporal variability, with PWS generally showing increased variability in rhythm. We subsequently calculated intra-speaker, across-utterance variability. This variability was more pronounced in PWS compared to PWNS. Individuals who stutter exhibited a wide range of rhythmic measurements, both high and low. This is also because rhythm values are a reflection of the language material that occurs in the corpus, and of the style in which the utterances are produced (see Barry and Russo, Reference Barry, Andreeva, Russo, Dimitrova and Kostadinova2003; Russo and Barry, Reference Russo, Barry and Russo2010). Two speakers reading the same two texts can vary significantly, even in different dimensions for different texts, one on the consonant axis, the other on the vowel axis. With spontaneous speech, and speaker variation, it can be expected to be a much higher variability.
In Figure 46.11, we give the average of the PVI results. PWS has high variability in both vocalic and intervocalic intervals, as measured by the nPVI and rPVI, respectively. The figure provides a visual comparison between PWS and PWNS across different speaking conditions, allowing for an analysis of how stuttering may affect speech rhythm in controlled (read) versus natural (spontaneous) settings. Vocalic nPVI values are plotted on the vertical axis against intervocalic rPVI values on the horizontal axis.
PVI results for PWS and PWNS: average (read and spontaneous speech).
Rhythmic variability in speech. The plot illustrates the relationship between vocalic nPVI and intervocalic rPVI for both PWNS and PWS in read and spontaneous speech contexts. Each symbol represents a distinct speech sample, with higher intervocalic rPVI values observed among PWS, especially in spontaneous speech. This indicates a more variable and disrupted speech rhythm in PWS, which contrasts with the more uniform rhythmic pattern seen in normal speakers.
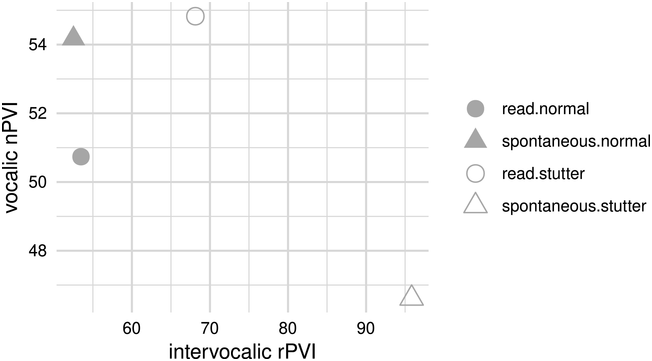
Figure 46.11 Long description
The horizontal axis represents intervocalic r P V I, which ranges from 60 through 90. The vertical axis represents vocalic n P V I, which ranges from 48 through 54. The distribution of data points is as follows. Spontaneous normal, (50, 54). Read Normal, (50, 51). Read Stutter, (55, 70). Spontaneous Stutter, (95, 47). The values are estimated.
PWS and PWNS differ in terms of average PVI in reading and in interview conditions. Read speech has allowed us to identify text-dependent and speaker-dependent differences in rhythm measures. The reading condition revealed less rhythm differences between PWS and PWNS than spontaneous speech. The spread of the point along the horizontal axis suggests that there is some variability in the timing between consonants (intervocalic rPVI) for stuttered speech in read and spontaneous conditions. In this figure, the highest intervocalic rPVI value for PWS is indicated by a triangle in the spontaneous speech section, positioned further right on the horizontal axis. This high rPVI value suggests that there is considerable variability in the timing between the consonants for this PWS speech sample during spontaneous speech.
PWS produced a range of rPVI-C values. As in Figure 46.10, in our PWS corpus we found a production variability between consonantal and vocalic segments greater in consonantal targets and complex sequences than in vowels. This leads to more rhythmic speech in those intervals (i.e., relatively low nPVI scores for PWS, and high rPVI).
46.3.1 Speech Rhythmicity of Individual Speakers
We found systematic differences between two speakers who stutter; thus, clearly, personal speech production strategies of PWS affect ‘rhythm’ measures. The range of PVI values produced by the same speaker was greater in the PWS group compared to the PWNS group, whereas PWNS produced a more regular nPVI level. We show in Figure 46.12 the average duration of speech components at the individual speaker level, incorporating both normal and stuttered speech, categorized according to different contextual factors such as vocalic and intervocalic intervals, pauses, and hesitation, with error bars indicating the SEM.
Average duration metrics for vocalic and intervocalic intervals, pauses, and hesitations among individual speakers.
Duration of speech components among individual speakers. The bar graph compares the average duration of vocalic and intervocalic intervals, pauses, and hesitations for individual speakers identified as 00001bis, B31, C14, and C15. It highlights the contrast in speech durations between normal speakers and PWS, with PWS generally showing longer durations in pauses and hesitations, indicative of the speech disfluencies commonly associated with stuttering. The differences in duration and variability between speakers underscore the individual nature of stuttering manifestations.
Figure 46.12 Long description
The vertical axis represents duration, which ranges from 0 through 600 milliseconds. The horizontal axis lists the following: Vocalic, Intervocalic, Pause, and hesitation. The bars represent Normal and Stutter, respectively. The mean duration values for Stutter are as follows. First: Pause, 350. Hesitation, 220. Vocalic, 170. Intervocalic, 110. Second: Pause, 500. Hesitation, 400. Intervocalic, 120. Vocalic, 80. The mean duration values for Stutter are as follows. Third: Hesitation, 300. Pause, 290. Vocalic, 90. Intervocalic, 80. Fourth: Hesitation, 460. Pause, 150. Intervocalic, 100. Vocalic, 90. The values are estimated.
Figure 46.12 suggests that for some speakers, the duration of vocalic intervals is longer in stuttered speech compared to normal speech, although this is not consistent across all speakers. However, the figure shows that the intervocalic intervals (rPVI) can be longer for stuttered speech than for normal speech. The duration of pauses appears to be longer in stuttered speech for all individual speakers represented in the figure, suggesting a common trait among PWS. The average duration for hesitations is longer for stuttered speech, while in others, it is comparable between stuttered and normal speech. The error bars across all categories indicate variability in the durations for both normal and stuttered speech. A larger error bar indicates for PWS more variability in that particular speech component. Overall, the figure reveals that the average duration of both intervocalic intervals and pauses is longer in stuttered speech compared to normal speech, with individual variations across the speakers. Hesitations and vocalic intervals show a less consistent pattern and may vary more on an individual basis.
Figure 46.13 illustrates the mean duration of various speeches (normal and stuttered) within the four contextual categories across distinct speech styles (read and spontaneous), with error bars representing the SEM, which reflects the amount for each speaker.
Comparative analysis of speech for individual speakers. Mean durations for vocalic intervals, intervocalic intervals, pauses, and hesitations.
Detailed speech component durations by speaker. Presenting both mean values and variability, this dual-bar graph compares the duration of vocalic and intervocalic intervals, pauses, and hesitations for each of the four speakers distinguished by ‘normal’ and ‘stutter’ speech patterns. Inter-speaker variability is marked, with PWS often showing extended durations and higher variability in pauses and hesitations. The graph also illustrates significant inter-speaker variability, particularly in the stuttering group, underscoring the personalized nature of speech disruptions experienced by PWS.
Figure 46.13 Long description
The vertical axis represents duration, which ranges from 0 through 600 milliseconds. The horizontal axis lists the following: Vocalic, Intervocalic, Pause, and hesitation. The bars represent Normal and Stutter, respectively. The mean duration values for Stutter are as follows. First: Pause, 350. Hesitation, 220. Vocalic, 170. Intervocalic, 110. Second: Intervocalic, 210. Vocalic, 80. Third. Pause, 430. Hesitation, 220. Vocalic, 130. Intervocalic, 100. Fourth. Pause, 500. Hesitation, 400. Intervocalic, 110. Vocalic, 80. The mean duration values for Normal are as follows. First: Vocalic, 100. Intervocalic, 100. Pause, 100. Second. Vocalic, 80. Intervocalic, 100. Pause, 300. Third: Pause, 400. Hesitation, 400. Pause, 300. Vocalic, 100. Intervocalic, 100. Fourth: Hesitation, 480. Pause, 100. Intervocalic, 100. Vocalic, 100. The values are estimated.
PWS often have increased mean durations for pauses and hesitations, as this is a common feature of stuttered speech. This is typically seen in the higher dark grey bars within these categories. The standard error represented by the error bars is larger for PWS in certain speech elements, such as pauses and hesitations. This is indicative of greater variability in how these elements are expressed by PWS compared to PWNS.
By comparing read and spontaneous speech, PWS show a larger discrepancy in mean durations between these two types of speech, reflecting the increased challenges PWS face in spontaneous speech scenarios.
46.3.2 Speech Rhythmicity in PWS
We calculated also the percentage of vocalic intervals, intervocalic intervals, pauses, and hesitations during stuttering speech and normal speech for individual speakers; see Table 46.2.
This table delineates the percentage of intervocalic and vocalic intervals, along with the frequency of pauses and hesitations, for both PWS and PWNS. It highlights that PWS tend to have a higher percentage of hesitations and a variable distribution of pauses, reflecting the stuttering characteristics. Meanwhile, the percentage of intervocalic and vocalic intervals does not significantly differ between PWS and PWNS.
| Stuttering | Normal speech | |||
|---|---|---|---|---|
| B31 | 00001bis | C14 | C15 | |
| Intervocalic | 49% | 44% | 49.2% | 47.7% |
| Vocalic | 48.4% | 48% | 49.5% | 50% |
| Pauses | 1.3% | 3.5% | 0.8% | 1.4% |
| Hesitations | 1.3% | 4% | 0.5% | 0.4% |
In Table 46.2, ∆C and ∆V do not separate PWS from PWNS; however, stuttering disfluencies are numerically important. This result is not surprising since Ramus’ ∆V measure captures global variation within ips, whereas Grabe and Low’s PVI measure captures ‘pairwise’ sequential variation. We calculated the average and the standard deviation of vocalic intervals, intervocalic intervals, duration of pauses, and duration of hesitations. The numerical results in Table 46.2 are also visible in Figure 46.14.
Standard deviation of vocalic intervals, intervocalic intervals, duration of pauses, and duration of hesitations.
Variability in speech components among individual speakers. The graph displays the standard deviation of vocalic and intervocalic intervals, pauses, and hesitations for two PWNS (C14 and C15) and two PWS (00001bis and B31). The pronounced variability in the stuttering speakers’ intervocalic intervals and hesitations, particularly for B31, indicates the degree to which stuttering can affect speech rhythm and flow.
Figure 46.14 Long description
The vertical axis represents duration, which ranges from 0 to 600 milliseconds. The horizontal axis lists the following: Vocalic, Intervocalic, Pause, and hesitation. The bars represent Normal and Stutter, respectively. The values of standard deviation for Stutter are as follows. Top Left. Pause, 300. Vocalic, 200. Hesitation, 190. Intervocalic, 50. Top right. Hesitation, 600. Intervocalic, 210. Pause, 200. Vocalic, 50. Bottom left. Pause, 200. Hesitation, 110. Vocalic, 90. Intervocalic, 20. Bottom right. Vocalic, 80. Intervocalic, 80. Pause, 80. Hesitation, 10. The values are estimated.
In PWNS the standard deviation values across all speech elements are relatively low. For the PWS, the standard deviation values are also relatively low (but higher than PWNS) and comparable to those of the normal speakers (but higher than PWNS for intervocalic intervals). A PWS speaker has a noticeably higher standard deviation in the hesitation category, which suggests a significant variability in the duration of hesitations. This could indicate moments where the speaker is experiencing blocks or is attempting to avoid disfluent moments. The standard deviation for intervocalic intervals for PWS speaker B31 shows a much larger standard deviation compared to both the normal speakers and PWS speaker 00001bis. This suggests that there is a greater variability in the timing of consonantal intervals for this speaker, which may reflect the irregular speech rhythm commonly associated with stuttering. This could be related to the stuttering disfluencies that affect the flow of speech, potentially leading to more pronounced and irregular spacing between consonantal sounds. This can be a characteristic of the speech patterns in PWS.
Figure 46.15 displays the standard deviation of speech elements for both normal speakers and PWS, broken down by read and spontaneous speech styles. Both speakers exhibit low standard deviation in read and spontaneous speech styles across all speech elements. This suggests that their speech timing is fairly consistent, whether reading a text or speaking spontaneously. For PWS, during spontaneous speech, the standard deviation increases, especially for intervocalic intervals and hesitations. In a speaker who stutters (B31) during spontaneous speech, there’s a notable increase in the standard deviation for hesitations. This large variability could indicate significant disruptions in speech flow due to stuttering, affecting the speaker’s ability to maintain consistent hesitations. Overall, the figure illustrates that while normal speakers maintain a consistent rhythm across both speech styles, PWS exhibit more variability, particularly in spontaneous speech. This is most pronounced in the duration of their hesitations, suggesting that spontaneous speech poses more significant challenges for individuals who stutter.
Standard deviation of vocalic intervals, intervocalic intervals, duration of pauses, and duration of hesitations. Effect of speech style: read and spontaneous.
Speech component variability across speaking conditions for individuals. In this graph, intervocalic intervals demonstrate notable variability for PWS, especially in spontaneous speech, with speaker B31 showing a heightened standard deviation in intervocalic intervals during spontaneous speech. This suggests that the timing between spoken sounds is a critical indicator of stuttering, highlighting the irregular speech rhythm and flow for PWS. Additionally, the variability in pause and hesitation durations for PWS further emphasizes the rhythmic disruptions characteristic of stuttering.
Figure 46.15 Long description
The vertical axis represents duration, which ranges from 0 to 600 milliseconds. The horizontal axis lists the following: Vocalic, Intervocalic, Pause, and hesitation. The bars represent Normal and Stutter, respectively. The values of standard deviation for Stutter are as follows. First. Pause, 300. Vocalic, 200. Intervocalic, 80. Hesitation, 10. Second. Pause, 450. Vocalic, 200. Hesitation, 200. Intervocalic, 80. Third. Intervocalic, 200. Vocalic, 20. Pause, 10. Hesitation, 10. Fourth. Hesitation, 600. Intervocalic, 210. Pause, 200. Vocalic, 50. The values of standard deviation for normal are as follows. First. Vocalic. Intervocalic, 50. Pause, 10. Hesitation, 10. Second. Vocalic, 100. Hesitation, 100. Intervocalic, 50. Pause, 50. Third. Intervocalic, 50. Vocalic, 40. Pause, 10. Hesitation, 10. Fourth. Vocalic, 80. Intervocalic, 80. Pause, 50. Hesitation, 10. The values are estimated.
The comparison of stuttering and normal speech rhythm in read and spontaneous conditions for the PVI measures is shown in Figure 46.16, where the points represent the results of all utterances. Vocalic nPVI values are plotted on the vertical axis against intervocalic rPVI values on the horizontal axis.
PVI results for all utterances.
PVI values by individual and speech context. This scatterplot maps the vocalic nPVI against the intervocalic rPVI for four speakers, distinguishing between ‘normal’ and ‘stutter’ speech patterns during read and spontaneous speaking tasks. For both 00001bis and B31, who stutter, there is a noticeable spread in intervocalic rPVI values, particularly in spontaneous speech, indicating substantial rhythmic variability.
Figure 46.16 Long description
The horizontal axis represents intervocalic r P V I which ranges from 50 to 150. The vertical axis represents vocalic n P V I which ranges from 25 to 75. Top left and right. The data points representing read stutter and spontaneous stutter are randomly distributed throughout both graphs. Bottom left and right. The data points representing read normal and spontaneous normal are randomly distributed throughout both graphs. The legends for these data points are given on the right side.
In Figure 46.16, individual utterance measures are plotted for both normal speakers and PWS across two speech conditions: read and spontaneous. The PVI is used to analyse the rhythmic characteristics of speech, with vocalic nPVI on the vertical axis indicating variability between vowel durations, and intervocalic rPVI on the horizontal axis indicating variability between consonant durations. It is well known that the selection of words, and the prosodic structure of the utterances at phrasal level, can result in considerable shifts in values. The tempo and style of speech (e.g., the difference between read and spontaneous speech, or the type of read text or the type of natural discourse) influenced the values that have been obtained. However, there are key elements to identify PWS and understand the rhythmic measures of nPVI and especially rPVI. The spread of the points along the horizontal axis (rPVI) shows variability in the timing of intervocalic intervals. We can observe variance of PVI values at intra-speaker level across utterances in the spontaneous speech interview. PWS have points that are spread further right, and this suggests higher variability in their intervocalic rhythmic measure compared to normal speakers. One can observe how the speech rhythm changes from a read to a spontaneous condition. A significant shift in position, especially horizontally, indicates how stuttering impacts speech in a less controlled environment.
In Figure 46.17 we show the average of the PVI results for the comparison of stuttering and normal speech rhythm in read and spontaneous conditions. Vocalic nPVI values are plotted on the vertical axis against intervocalic rPVI values on the horizontal axis.
PVI results: average.
Vocalic and intervocalic temporal variability in speech. This scatterplot contrasts vocalic nPVI and intervocalic rPVI across read and spontaneous speech tasks for each speaker, showcasing the temporal dynamics of speech. The plot points to differences between normal speakers (C14 and C15) and those who stutter (00001bis and B31), particularly in spontaneous speech. The individuals who stutter demonstrate wider scatter in intervocalic rPVI values, indicative of the variability in speech rhythm and timing that is characteristic of stuttering.
Figure 46.17 Long description
The horizontal axis represents intervocalic r P V I which ranges from 40 to 120. The vertical axis represents vocalic n P V I which ranges from 46 to 58. Top left and right. The data points representing read stutter and spontaneous stutter are randomly distributed throughout both graphs. Bottom left and right. The data points representing read normal and spontaneous normal are randomly distributed throughout both graphs. The legends for these data points are given on the right side.
In Figure 46.17, the average PVI results are plotted for individuals with normal speech and PWS across two different speech conditions: read and spontaneous. Higher nPVI values on the vertical axis indicate greater variability in vocalic intervals. In this figure, the nPVI values for all speakers seem to fall within a relatively close range, suggesting similar variability in vocalic intervals among the speakers. Higher values on the horizontal axis indicate greater variability in intervocalic timing. PWS have higher rPVI values than normal speakers; this indicates more pronounced variability in their intervocalic interval.
Normal speakers exhibit less variability in both nPVI and rPVI, indicating more regular speech rhythm, while PWS show more variability, particularly in rPVI, indicating a less regular rhythm. The PVI values, particularly the intervocalic rPVI, could be used to identify and characterize the rhythmic differences in speech related to stuttering. However, in spontaneous speech, we expect a considerably higher degree of variation in measures due to both the material being spoken and the individual characteristics of the speaker. We have observed that personal speech production strategies during stuttering affect rhythm measures. There will always be differences between PWS with different phonotactics and differences in durational oppositions. However, PWS demonstrate considerable variability in their speech rhythms, particularly exhibiting greater variability in the intervocalic intervals (consonants) measured by PVI-C (and ∆C), compared to PWNS.
46.4 Conclusions
This study offered a comprehensive analysis of speech rhythm in PWS compared to PWNS, highlighting the pivotal role of rPVI as an identifier of rhythmic patterns specific to PWS (along with the measures of pauses and hesitations). This measure particularly stands out, denoting higher variability within PWS speech, thereby disrupting the expected rhythm patterns typically found in PWNS. This variability is especially pronounced in spontaneous speech conditions, suggesting that the dynamic speech production is impacted by the natural variability of spoken material and the speaking strategies of individuals. Our study underscores the critical role of the rPVI in delineating the rhythmic deviations in PWS, offering insights into the mechanisms underlying stuttering and its effects on speech production dynamics.
Our findings highlight the significant impact of stuttering on speech rhythm, particularly in spontaneous speech scenarios, which exhibit a heightened degree of variability due to both the linguistic material and the speaker’s unique characteristics.
The analysis draws on the rhythm measures developed by Ramus (Reference Ramus, Nespor and Mehler1999), Ramus et al. (Reference Ramus, Nespor and Mehler1999), and Grabe and Low (Reference Grabe, Low, Gussenhoven and Warner2002), applying these to our corpus to dissect the nuanced rhythmic profiles of our participants. The data are extracted from the French ANR project (BENEPHIDIRE), as detailed in Section 46.1.3. The analysis on the corpus, encompassing interviews and read tasks performed by 14 French native speakers, underscores the variability in PWS’ speech rhythm. PVI measures (PVI-V and PVI-C) and Ramus et al. (Reference Ramus, Nespor and Mehler1999) (∆V and ∆C) both reflect the amount of variation in syllabic structure and prosodic factors that affect duration. Syllable complexity in PWS, repetitions, blocks, or lengthening of sounds and syllables during speech were contributory factors to the rhythm of an utterance (expected high rPVI), and to the general rhythmic impression of stuttering speech.
In our sample of four speakers (two PWS, two PWNS), the rPVI metric emerged as a crucial element for distinguishing rhythm between groups, showcasing how stuttering introduces significant rhythmic variability, especially in intervocalic intervals. This variability reflects the inherent challenges PWS face in speech production, attributed to disruptions in neural processes governing speech and motor control. These disruptions result in variability across speech intervals, emphasizing the marked impact stuttering has on speech rhythm. This study demonstrates that these measures are adept at identifying the rhythmic deviations characteristic of stuttered speech, providing insights into the complex interplay between phonological structure, phonetic realization, and the emergent properties of rhythm.
Based on the detailed analysis presented in Section 46.3, it’s clear that the rPVI notably shifts to the right for PWS when compared to PWNS. This rightward movement on the horizontal axis, which represents intervocalic variability, underscores a key finding: PWS exhibit significantly greater variability in the timing between consonants.
PWS displayed pronounced intra-speaker variability in rhythmic values across utterances. This variability was evident in both the average values of the PVI and in the distribution of the normalized PVI mean values. The variability was markedly more in spontaneous speech than in reading conditions, underscoring the substantial influence of speech style on rhythmic measures. Particularly, intervocalic interval variability (PVI-C and ∆C) was more pronounced, likely due to variations in the onset and coda structures of syllables.
Interestingly, certain instances of speech from PWS were less variable, potentially due to more controlled motor-planning processes during clinical tests. This resulted in a decreased variability in vowel duration (nPVI), which served as an indicator of fluency improvements.
The rPVI outcomes delineate a rhythm plot where PWS align closer to the ‘stress-timed’ end of the rhythm spectrum, diverging from the more ‘syllable-timed’ rhythm of PWNS. This distinction is rooted in the less isochronous nature of PWS utterances, with syllable complexity – marked by repetitions, blocks, and sound or syllable lengthening – contributing to this rhythmic deviation. The observed high variability in both vocalic and intervocalic intervals among PWS, as contrasted with PWNS, show the impact of stuttering on speech rhythm, making rPVI a robust measure for differentiating between PWS and PWNS across various speaking tasks and styles.
Our analysis reaffirms the importance of rPVI in identifying the rhythmic patterns inherent in PWS and highlights the broader implications of rhythm measures in understanding the dynamic motor system’s instability in stuttering. This contributes to our comprehension of stuttering’s multifaceted impact on speech rhythm, paving the way for future research into its underlying mechanisms and potential therapeutic interventions.
The results from our analysis underscore the complexity of speech production in stuttering, which goes beyond simple durational measures. The study’s findings reiterate that rhythm is a composite, emergent property rather than a simple binary classification of speech patterns.
Our chapter significantly advances our understanding of the causal mechanisms of neurodevelopmental stuttering by providing a detailed examination of speech rhythm variability in PWS compared to PWNS. By highlighting the increased variability in speech rhythm among PWS – especially in spontaneous speech – the study suggests that the neurological underpinnings of stuttering may involve disruptions or inefficiencies in the neural circuits responsible for timing and coordinating speech production. This aligns with current theories that posit stuttering as a motor-timing disorder, providing empirical evidence to further this hypothesis (Ludlow and Loucks, Reference Ludlow and Loucks2003; Alario et al., Reference Alario, Chainay, Lehericy and Cohen2006; Kell et al., Reference Kell, Neumann and von Kriegstein2009; Watkins, Reference Watkins, Chesters, Connally, Hickok and Small2016; Assaneo and Poeppel, Reference Assaneo and Poeppel2018; Chang et al., Reference Chang, Garnett, Etchell and Chow2019).
The observed intra-speaker variability in rhythmic measures among PWS, particularly in the context of rPVI, underscores the complexity of stuttering as a neurodevelopmental condition. It suggests that the stuttering mechanism may not solely be a result of static neural disruption but could also involve dynamic factors such as neural plasticity, attentional control, and the processing of linguistic information (Kell et al., Reference Kell, Neumann and von Kriegstein2009; Watkins, Reference Watkins, Chesters, Connally, Hickok and Small2016; Neumann, Reference Neumann, Euler and Bosshardt2017; Chang et al., Reference Chang, Garnett, Etchell and Chow2019).
Understanding the precise nature of rhythm variability in stuttering can guide the development of targeted interventions and therapies, potentially focusing on improving rhythm perception and production as a means to mitigate stuttering symptoms.
46.5 Acknowledgements
We thank Qianwen Gwan (IR SFL 7023 CNRS) for her help with automatic data transcription and annotation.
Summary
This study provided an analysis of speech rhythm in both PWS and PWNS. The analysis reveals that while rhythm measures fluctuate, the impact of stuttering on speech rhythm is substantial. Our findings indicate that the rPVI measure serves as a key marker for identifying the rhythmic patterns inherent in PWS. This crucially illustrates the dynamic motor system’s instability in stuttered speech.
Implications
The PVI measures reflect structural differences, which affect the emergent perceived rhythm of an utterance. Thus, we are not measuring the rhythm of PWS but the properties that affect the potential for certain rhythmic patterns in the utterances of stuttering speech. These rhythmic conditions can provide timing cues to overcome vulnerable pathways that affect the impaired neurological system of PWS.
Gains
This analysis has also been a tool to indirectly assess the severity of stuttering. It improves our comprehension of the causal mechanisms of neurodevelopmental stuttering, thus suggesting new and future pathways for research on this speech/motor disturbance.
47.1 Introduction
Differences in speech prosody, including rhythmic aspects, have been recognized as a hallmark of the speech of speakers with autism spectrum disorder (ASD) since the earliest descriptions of the disorder (Asperger, Reference Asperger1944; Kanner, Reference Kanner1943). A preponderance of evidence exists that prosodic deficits in speakers with ASD are common (Baltaxe, Reference Baltaxe1984; DePape, et al., Reference DePape, Chen, Hall and Trainor2012; Diehl et al., Reference Diehl, Bennetto, Watson, Gunlogson and McDonough2008, Reference Diehl, Watson, Bennetto, McDonough and Gunlogson2009, Reference Diehl, Friedberg, Paul and Snedeker2015; Diehl and Paul, Reference Diehl and Paul2013; Filipe et al., Reference Filipe, Frota, Castro and Vicente2014; Green and Tobin, Reference Green and Tobin2009; Grossman et al., Reference Grossman, Bemis, Skwerer and Tager-Flusberg2010; Grossman and Tager-Flusberg, Reference Grossman and Tager-Flusberg2012; McCann and Peppé, Reference McCann and Peppé2003; Nadig and Shaw, Reference Nadig and Shaw2012; Patel et al., Reference Patel, Nayar and Martin2020; Paul et al., Reference Paul, Augustyn, Klin and Volkmar2005a, Reference Paul, Shriberg and Mcsweeny2005b; Peppé et al., Reference Peppé, McCann, Gibbon, O’Hare and Rutherford2006, Reference Peppé, McCann, Gibbon, O’Hare and Rutherford2007; Shriberg et al., Reference Shriberg, Paul and Mcsweeny2001; Wynn et al., Reference Wynn, Borrie and Sellers2018), yet our understanding of the exact nature of these prosodic deficits is still emerging (Fusaroli et al., Reference Fusaroli, Lambrechts, Bang, Bowler and Gaigg2017).
Prior research has focused on both the production and perception of grammatical, pragmatic, and affective aspects of speech prosody at the word and sentence levels in individuals with ASD. However, more recently, the scope of research on prosody in autism has been broadened, and investigations of interactional and conversational aspects of prosody have emerged (Lehnert-LeHouillier et al., Reference Lehnert-LeHouillier, Terrazas and Sandoval2020; Ochi et al., Reference Ochi, Ono and Owada2022; Patel et al., Reference Patel, Cole, Lau, Fragnito and Losh2022; Wynn et al., Reference Wynn, Borrie and Sellers2018). This chapter first provides a brief review of prosodic entrainment with particular emphasis on rhythmic and fundamental frequency (F0) entrainment in individuals with autism. Next, we present our study investigating whether speakers with and without autism differ in entrainment to speaking rate and F0 at the conversational turn and to what extent these prosodic features are correlated. Furthermore, we investigate whether entrainment patterns that emerge at the level of the conversational turn translate to entrainment at the level of the conversation as a whole.
In order to accommodate differing preferences expressed by self-advocates, caregivers, and parents within the autism community (see Brown, Reference Brown2011; Dunn and Andrews, Reference Dunn and Andrews2015; Kenny et al., Reference Kenny, Hattersley and Molins2016), this chapter uses both identity-first language (i.e., autistic speakers) and person-first language (i.e., speakers with autism).
47.2 Entrainment
Interactional or conversational prosody relates to changes in prosodic-acoustic characteristics that are used to modulate social interactions by managing conversational turns, signaling attitudes towards conversation topics as well as the conversation partner, among others (see Ward, Reference Ward2019). One well-described conversational prosodic phenomenon is conversational entrainmentFootnote 1 – sometimes also referred to as alignment or mimicry. Conversational entrainment, in general, refers to conversation partners’ alignment in linguistic features during a conversation. Generally speaking, more entrainment in linguistic features is associated with positive interactions whereas a lack of entrainment as well as dis-entrainment – the divergence of conversation partners in linguistic features – are typically associated with negative conversational and relational attributes (see Pickering and Garrod, Reference Pickering and Garrod2004, and Soliz and Giles, Reference Soliz and Giles2014, for a summary and theoretical implication of entrainment behaviors).
In speakers without known communication disorders, conversational entrainment has been shown to occur at the lexical level (i.e., Brennan and Clark, Reference Brennan and Clark1996; Nenkova et al., Reference Nenkova, Gravano and Hirschberg2008), the syntactic level (i.e., Branigan et al., Reference Branigan, Pickering, McLean and Cleland2007; Cleland and Pickering, Reference Cleland and Pickering2003), as well as at the acoustic-phonetic level (i.e., Pardo, Reference Pardo2006; Pardo et al., Reference Pardo, Urmanche, Wilman and Wiener2017).
Prosodic entrainment, as manifested in the alignment of acoustic-prosodic features, such as speaking rate (i.e., Giles et al., Reference Giles, Coupland, Coupland, Giles, Coupland and Coupland1991; Levitan et al., Reference Levitan, Gravano and Willson2012; Local, Reference Local2007), vocal intensity or loudness (i.e., Natale, Reference Natale1975), timing of pauses (i.e., Edlund et al., Reference Edlund, Heldner and Hirschberg2009), and F0 (i.e., Babel and Bulatov, Reference Babel and Bulatov2012; Gregory et al., Reference Gregory, Dagan and Webster1997; Gregory and Webster, Reference Gregory and Webster1996; Levitan and Hirschberg, Reference Levitan and Hirschberg2011; Weise et al., Reference Weise, Levitan, Hirschberg and Levitan2019), has also been well attested in typical speakers (see Beňuš, Reference Beňuš2014, for more discussion). Conversational prosodic entrainment has been shown to be correlated with the perceived overall quality of a conversation (Michalsky et al., Reference Michalsky, Schoormann and Niebuhr2018), the quality of the relationship of conversation partners (Ireland et al., Reference Ireland, Slatcher and Eastwick2011; Lubold and Pon-Barry, Reference Lubold and Pon-Barry2014), the perceived likability and attractiveness of interlocuters (Michalsky and Schoormann, Reference Michalsky and Schoormann2017), and the overall ability to succeed as part of a team (Niebuhr and Michalsky, Reference Niebuhr and Michalsky2019).
Wynn et al. (Reference Wynn, Borrie and Sellers2018) first investigated prosodic entrainment in individuals with ASD by investigating speaking-rate entrainment in children and adults with ASD in response to the speaking rate of an interlocutor. They found that although neurotypical adult speakers entrained to the speaking rate of a prerecorded interlocutor, adults with ASD did not. Children – regardless of whether or not they were diagnosed with ASD – also did not entrain in speaking rate. Lehnert-LeHouillier et al. (Reference Lehnert-LeHouillier, Terrazas and Sandoval2020) studied F0 entrainment and found that children and adolescents with ASD showed less mean F0 entrainment compared to neurotypical peers, but performed similarly to the neurotypical comparison group in F0 range entrainment. Hence, both studies provide evidence that individuals with ASD differ in prosodic entrainment from neurotypical comparison groups. Similarly, Patel et al. (Reference Patel, Cole, Lau, Fragnito and Losh2022) report the most comprehensive study on entrainment behaviors in adolescents and young adults with autism to date, including measures of lexical, semantic, syntactic, and prosodic entrainment. Prosodic entrainment measures in the study of Patel et al. include both F0 measures and rhythmic measures at the dialog act, which is defined as a phrase or sentence that expresses the communicative intent in the interaction. Overall, Patel et al. (Reference Patel, Cole, Lau, Fragnito and Losh2022) find that “autistic speakers” dis-entrained significantly more often compared to the neurotypical controls both in terms of F0 and rhythmic acoustic-prosodic features. In addition to differences in prosodic entrainment, Patel et al. (Reference Patel, Cole, Lau, Fragnito and Losh2022) report differences in lexical entrainment between the two groups but not in syntactic and semantic entrainment. Similar to Patel et al. (Reference Patel, Cole, Lau, Fragnito and Losh2022), Ochi et al. (Reference Ochi, Ono and Owada2022) use a variety of acoustic-prosodic measures obtained in the vicinity of conversational turns to calculate prosodic entrainment, with the goal to assess whether these features correlate with ASD severity. The data used by Ochi et al. (Reference Ochi, Ono and Owada2022) were recordings obtained during the administration of the semi-structured Autism Diagnostic Observation Schedule – Second Edition (Lord et al., Reference Lord, Rutter and Dilavore2012), which is used to diagnose ASD. The results suggest that the amount of prosodic entrainment is highly correlated with autism severity. However, since the focus of the study of Ochi et al. was on assessing severity, this study does not provide information on differences in entrainment between speakers with and without autism.
In summary, there is mounting support showing that differences in prosodic entrainment exist between speakers with and without autism. However, previous studies differ greatly in terms of the ages of participants, the experimental tasks used, the specific acoustic-prosodic features that were studied, and the method used to assess entrainment. For example, while Wynn et al. (Reference Wynn, Borrie and Sellers2018) used spoken responses to a prerecorded interlocuter, Lehnert-LeHouillier et al. (Reference Lehnert-LeHouillier, Terrazas and Sandoval2020) and Patel et al. (Reference Patel, Cole, Lau, Fragnito and Losh2022) used goal-oriented conversational tasks, and Ochi et al. (Reference Ochi, Ono and Owada2022) used a semi-structured diagnostic interview. Lehnert-LeHouillier et al. (Reference Lehnert-LeHouillier, Terrazas and Sandoval2020) assessed entrainment by comparing the initial portion of conversations to the final portions of the same conversations, while Patel et al. (Reference Patel, Cole, Lau, Fragnito and Losh2022) assessed entrainment at the level of the dialog act by deriving the entrainment measure for each dialog act segment via calculating a mean using a sampling method with random replacement of 1,000 samples, and then comparing each dialog act to this mean. Ochi et al. (Reference Ochi, Ono and Owada2022), similar to Patel et al. (Reference Patel, Cole, Lau, Fragnito and Losh2022), use computational methods to assess entrainment via concurrent extraction of multiple prosodic-acoustic markers. Last but not least, while Lehnert-LeHouillier et al. (Reference Lehnert-LeHouillier, Terrazas and Sandoval2020) matched participants in their ASD and neurotypical groups by age, gender, and nonverbal IQ, the participants of Wynn et al. (Reference Wynn, Borrie and Sellers2018) and Patel et al. (Reference Patel, Cole, Lau, Fragnito and Losh2022) were not matched on these parameters. Therefore, the possibility that the differences between speakers with and without autism that were reported in Wynn et al. (Reference Wynn, Borrie and Sellers2018) and Patel et al. (Reference Patel, Cole, Lau, Fragnito and Losh2022) are, in fact, due to differences in age, gender, or nonverbal/performance IQ cannot be excluded.
A next step in prosodic entrainment research would be to identify differences in entrainment profiles between speakers with and without ASD. Different profiles may emerge when investigating whether and how entrainment in different prosodic-acoustic features is correlated and whether local (i.e., entrainment at the level of what is referred to as dialog act, conversational turn, or interpausal unit) implies global entrainment at the level of the conversation as a whole. In order to investigate the existence of such differences, we obtained conversational data from 28 children and teens – 14 with an ASD diagnosis and 14 neurotypical peers matched on age, gender, and nonverbal IQ.
Prosodic entrainment behavior was analyzed in both groups of speakers to see whether entrainment in F0 at the level of the conversational turn correlates with rhythmic entrainment at the conversational turn. Furthermore, we investigated whether global F0 entrainment as observed between the initial and final portion of a conversation is correlated with entrainment behavior at the level of conversational turns.
47.3 Methodology
47.3.1 Participants
Twenty-eight children and adolescents participated in the current study, 14 with an ASD diagnosis and 14 typically developing peers between the ages of nine and 15 years. The participants with ASD and the neurotypical (NT) peers were matched on age (ASD: M = 12.47, SD = 1.9; NT: M = 12.53, SD = 1.9), gender (three girls and 11 boys in both groups), and nonverbal IQ (ASD: M = 107, SD = 10.8; NT: M = 110, SD = 8.85), but differed significantly in composite IQ scores (F(1,22) = 5.11, p = .03) and language functioning (F(1,22) = 18.08, p < .001). All ASD participants had received a medical diagnosis of ASD (Autism = 7, High Functioning Autism = 5, Asperger’s Syndrome = 1, PDD-NOS = 1) prior to participating in this study, according to parent report, and received educational services due to their ASD diagnosis at the time of the study. The mean age of ASD diagnosis was 4.2 years with a range from two to eight years. All participants in the ASD group were administered the Autism Diagnostic Observation Schedule, Second Edition (ADOS-2) (Lord et al., Reference Lord, Rutter and Dilavore2012), a semi-structured standardized assessment widely used to assess and diagnose ASD as part of this study. Only participants with ASD who met the ADOS-2 cutoff score for autism or autism spectrum were included in this study. Since all participants with ASD were fluent speakers of English, Module 3 of the ADOS-2 (Fluent Speech – Child/Adolescent) was administered to all ASD participants.
This study was approved by the New Mexico State University Institutional Review Board and conforms with the guidelines of the Office of Research Integrity and Ethics. The legal guardians of the participants provided written informed consent, and the participants themselves provided written assent to participate in this study. All participants were recruited from the Southern New Mexico area – a linguistically and culturally diverse region of the United States. Of the 14 participants with ASD, seven were of Hispanic heritage, six were Caucasian, and one was African American. Ten of the neurotypical peers were Hispanic and three were Caucasian. However, all participants met the inclusion criteria of coming from households where English was spoken as the first and primary language. All participants passed hearing screenings at pure-tone frequencies of 500 Hz, 1,000 Hz, 2,000 Hz, and 4,000 Hz, and reported normal vision. All participants were administered the Core Language portion of the Clinical Evaluation of Language Fundamentals, Fifth Edition (CELF-5; Wiig et al., Reference Wiig, Semel and Secord2013) to assess general language functioning. Furthermore, the Kaufman Brief Intelligence Test (KBIT-2; Kaufman and Kaufman, Reference Kaufman and Kaufman2004) was administered to determine verbal, nonverbal, and composite IQ scores. This assessment consists of three sub-tests, two measuring verbal IQ and one measuring nonverbal IQ performance. A summary of participant characteristics is shown in Table 47.1.
Summary of group characteristics for the ASD and NT participants. KBIT-2 and CELF-5 scores are provided as standard scores. The ADOS-2 score is provided as ADOS-2 Comparison Score. *** signifies alpha level < 0.001, ** signifies alpha level < 0.01, and * signifies alpha <0.05.
| ASD group (n=14) | Neurotypical group (n=13) | ||||
|---|---|---|---|---|---|
| Mean (SD) | Range | Mean (SD) | Range | p-value | |
| Age | 12.47 (1.9) | 9.01–15.00 | 12.53 (1.9) | 9.01–15.00 | .91 |
| Gender male:female | 11:3 | 11:3 | N/A | N/A | N/A |
| Nonverbal IQ (KBIT-2) | 107 (10.8) | 89–128 | 110 (8.85) | 88–120 | .47 |
| Verbal IQ (KBIT-2) | 89 (22.9) | 64–139 | 109 (13.1) | 90–130 | .004** |
| Composite IQ (KBIT-2) | 98 (17.8) | 73–138 | 112 (12.18) | 87–131 | .03* |
| Language (CELF-5) | 88 (13.14) | 73–113 | 109 (11.19) | 89–126 | <.001*** |
| ADOS-2 | 5.93 (2.09) | 4–10 | N/A | N/A | N/A |
In order to meet inclusion criteria, participants were required to have nonverbal IQ standard scores of 85 or higher, a composite IQ standard score of 70 or higher, as well as a CELF Core Language standard score of 70 or higher in order to assure that participants were able to successfully engage in all study tasks.
As Table 47.1 shows, the two groups differ in terms of their verbal skills, as shown in the differences in verbal IQ and CELF-5 scores, which is to be expected given that challenges with verbal communication is one of the characteristics of autism. The difference in composite or total IQ, in turn, is entirely carried by the differences in verbal IQ between the two groups.
47.3.2 Conversational Task
The conversational task used in this study was the Diapix task (Baker and Hazan, Reference Baker and Hazan2011) – a goal-oriented conversational task that has been shown to elicit conversational prosodic entrainment and that has previously been used successfully with individuals impacted by communication disorders (Borrie et al., Reference Borrie, Lubold and Pon-Barry2015). Study participants were paired with an adult research assistant for the conversation. The research assistants were undergraduate students in the Communication Disorders program at New Mexico State University. A total of nine research assistants between the ages of 20 and 24 years were involved in the study. Research assistants were aware that the purpose of the study was the investigation of speech characteristics in youth with and without ASD, but they did not know that the aim was to investigate prosodic entrainment. All research assistants participated as conversation partners in conversations with participants from both groups but were not blinded to the ASD diagnosis of the study participants.
Each conversation partner was given a picture that was similar but not identical to the conversation partner’s picture. The conversational dyad was then asked to find 10 differences between their respective pictures through collaborative conversation without being allowed to see each other’s pictures. Research assistants and study participants alike were told that the goal of the conversational task was to find as many differences as possible. The conversation was ended after the dyad had identified the 10 differences between the pictures, or concurred that they were unable to find any further differences. All conversations were conducted in a sound-treated room and recorded in audio wave file format at a 44.1 kHz sampling rate with 16-bit resolution using a Marantz PMD 670 digital recorder and a Shure SM58 cardioid dynamic microphone that was placed between the conversation partners, approximately 30 inches from each speaker. All sound files were then transferred for post-processing and labelling. Audio files were annotated using Praat (Boersma and Weenink, Reference Boersma and Weenink2019) TextGrid files. All conversational utterances spoken during the conversation were labelled to indicate which of the two speakers had produced them. Only linguistically meaningful utterances were included. Nonlinguistic vocalizations such as laughter, humming, as well as speaker overlap were excluded from the subsequent acoustic analysis during which measures of speaking rate as words per minute (WPM) and mean F0 were extracted from all utterances. No significant difference in the mean duration of the conversations between the ASD (M = 8.1 minutes, SD = 1.74) and the NT (M = 7.6 minutes, SD = 1.94) group was present.
47.3.3 Calculation of Prosodic Entrainment
47.3.3.1 Speaking Rate
Several pre-processing steps were taken to prepare the data for analysis of speaking rate. More specifically, all acoustic recordings were down-sampled to 16 kHz and saved as a mono-channel PCM audio format. These steps ensured that our files would work with the various software tools throughout the experiment. Each audio file was then transcribed at the word level first using Azure speech-to-text and then hand-corrected. The results were stored in a separate text file along with the time, location, duration of each word. Using the Julia computing tool (Bezanson et al., Reference Bezanson, Karpinski, Shah and Edelman2017), each transcription was inserted into the appropriate TextGrid file as interval tier, so that each word had a start and an end time as determined by the offset and duration reported by the Microsoft Azure speech-to-text tool. Next, the following procedure was used to calculate entrainment in speaking rate:
1. The WPM estimates were extracted for any segment produced by speaker 1 (S1). This segment, in turn, was surrounded by segments produced by speaker 2 (S2).
2. The sign of the difference in speaking rate for the S1 utterance compared to the previous S2 utterance was calculated as: ∆S1 = sgn(S1 − S2Prev).
3. The sign of the difference in speaking rate for the S2 utterance compared to the previous S2 utterance was calculated as: ∆S2 = sgn(S2Next − S2Prev).
4. For each S1 segment, we multiplied ∆S1 by ∆S2.
The purpose of each of the aforementioned steps is as follows. Step 1 is responsible for extracting the three consecutive WPM readings for each segment required to perform our algorithm (first S2, S1, and second S2). The first S2 value is used as a reference value to calculate whether S2’s speaking rate has increased, decreased, or stayed the same after the S1 segment. Step 2 computes S1’s speaking rate and compares it to the first S2 segment. A value of 1.0 indicates that S1 increased speaking rate, a value of −1.0 indicates S1 decreased speaking rate, and a value of 0 indicates that the speaking rate stayed the same compared to first S2 segment. Step 3 computes S2’s speaking-rate entrainment using the same approach as described in step 2. Step 4 multiplies ∆S1 by ∆S2, which returns 1.0 if both values carry the same sign, that is, S2 is entraining to S1, and returns −1.0 if the two values carry different signs, that is, S2 is dis-entraining from S1, and if there was a change of less than 5 WPM, we considered this to signify neither entrainment nor dis-entrainment. This threshold of five WPM was chosen based on the analysis of samples from the corpus during which speakers produced two consecutive thematically unrelated turns with a pause between both turns but without turn exchange with an interlocutor. Therefore, we conclude that a five-WPM difference between turns is within the amount of variation that occurs naturally. An example of this four-step procedure where speaker 2 entrains to speaker 1 is provided in Figure 47.1.
Example of a turn exchange.
Speaker 2 entrains to Speaker 1. Step 1 shows the extracted WPM values of three consecutive WPM segments; Step 2 shows a value of 1.0 for ΔS1; Step 3 shows a value of 1.0 for ΔS2; Step 4 multiplies ΔS1 by ΔS2, resulting in a value of 1.0 indicating that S2 entrained to S1 during this turn exchange.
47.3.3.2 F0
47.3.3.2.1 F0 Entrainment Calculation at the Level of Conversational Turns
At the level of conversational turns, the average F0 value was extracted from each speaker segment using a Praat script that uses an autocorrelation-based method developed by Boersma (Reference Boersma1993) to estimate the pitch value every 10 ms automatically. Next, we used the Julia environment to average the F0 values for each segment produced by each speaker. The maximum allowable pitch range (pitch floor and pitch ceiling) used for the analysis was adjusted based on the speaker’s gender. Specifically, we used a pitch range of 70–250 Hz, 150–350 Hz, and 170–450 Hz for adult males, adult females, and children, respectively. The adult male range was used for the male adolescents in our dataset. In order to correctly classify each speaker as adult male, female, or child, a Julia function was developed to utilize the autocorrelation method developed by Boersma (Reference Boersma1993) to automatically estimate the mean F0 for each speaker. We next used the mean F0 estimate to select the appropriate F0 range for speakers based on their estimated F0 average.
Next, we used the same steps described in Section 47.3.3.1 to calculate F0 entrainment at the conversational turn level, using the extracted average F0 instead of WPM as the input to the algorithm. Any change in F0 that was greater than 5 Hz in the same direction as the interlocuter was considered an instance of entrainment, a change in F0 greater than 5 Hz in the opposite direction than that of the interlocuter was considered dis-entrainment, and changes of less than 5 Hz were considered neither entrainment nor dis-entrainment. This threshold of 5 Hz was chosen based on the analysis of the mean F0 difference in a set of samples from the corpus during which speakers produced two consecutive thematically unrelated turns with a pause between both turns but without turn exchange with an interlocutor. Hence, we assume that a +/− 5 Hz difference is not induced by the F0 of the interlocutor but by naturally occurring variance in F0.
47.3.3.2.2 F0 Entrainment Calculation at the Conversational Level
In order to assess whether entrainment behavior at the level of the conversational turn is predictive of global conversational entrainment as derived when comparing the beginning and end of a conversation, we also correlated F0 entrainment at the turn level with global conversational entrainment. Global F0 entrainment was assessed using the procedure developed in Lehnert-LeHouillier et al. (Reference Lehnert-LeHouillier, Terrazas and Sandoval2020). The following is a summary of the procedure. Mean F0 was extracted from the utterances produced by each speaker during the first and the last third of the conversation, using Praat (Boersma and Weenink, Reference Boersma and Weenink2019). The same autocorrelation-based pitch estimation method described above was used to extract pitch estimates at intervals of 10 ms during the labelled sections of the sound file – in this case, the initial and final third of the conversation. Based on the extracted F0 values, the mean F0 for each of the speakers was calculated for the first and the last third of the conversation. The distance between the mean F0 values for both speakers was calculated for both the first and the last third of the conversation by subtracting the mean F0 of one speaker from that of the other speaker in the dyad. A decrease in distance between the initial and the final third suggests mean F0 entrainment, whereas an increase of this distance suggests dis-entrainment. An illustration of this procedure is provided in Figure 47.2.
Conversational mean F0 entrainment.
Illustration of the approach used to determine mean F0 entrainment exhibited during a conversation. Based on the F0 contours produced by S1 and S2 during conversational turns in the first and the last third of the conversation, mean F0 for each speaker was calculated for the respective thirds. The difference/distance between both speakers’ mean F0 was then calculated. If this difference/distance decreased from initial to final third, as shown in this figure, speakers showed entrainment. A common mean F0 was calculated for each conversational dyad. The difference/distance of each speaker from this common mean during the first and last third was then calculated to determine the contribution of each speaker to the overall entrainment in mean F0.
As can be seen in Figure 47.2, S1 in this hypothetical example contributes more to the conversational entrainment in mean F0 than S2. It is also possible that two speakers entrain much less than the hypothetical speakers in Figure 47.2, such that the speaker who contributes more to the mean F0 entrainment in such a conversation with less overall entrainment would contribute an absolute F0 change to the F0 entrainment that is smaller than that of S2 in our Figure 47.2. In order to account for such a situation and to capture both aspects – the amount of overall conversational mean F0 entrainment as well as the individual contribution of our study participants – the conversational mean F0 entrainment measure was normalized using the entrainment contribution measure. The normalized mean F0 entrainment measure was then used as the input to the statistical analysis.
47.3.4 Statistical Analysis
All statistical analyses were conducted using the R statistical computing environment (R Core Team, 2016) and the packages “tidyverse” (Wickham et al., Reference Wickham, Averick and Bryan2019), “lme4” (Bates et al., Reference Bates, Mächler, Bolker and Walker2015), and “cocor” (Diedenhofen and Musch, Reference Diedenhofen and Musch2015). Mixed-effects modelling was used to assess (1) the group differences in speaking-rate entrainment and F0 entrainment at the level of the conversational turn, and correlation statistics were used to assess (2) the relationship between entrainment at the level of the conversational turn and global conversational entrainment. The first question was investigated by fitting a mixed-effects model with turn-level entrainment as the outcome variable and with group (ASD versus NT) and entrainment type (Entrainment, Dis-entrainment, and No Change) as predictor variables. Participants and conversation partners were modelled as random effects. The second question was answered via correlation testing using Pearson’s correlation coefficient r.
47.4 Results
The mixed-effects model yielded no significant difference between groups when it came to turn-level entrainment in either speaking rate or F0. Figure 47.3 shows the percentage of turn exchanges during which dis-entrainment, no entrainment, and entrainment occurred. Panel A shows speaking-rate entrainment by type of entrainment for each group, and Panel B shows F0 entrainment.
Turn-level entrainment in speaking rate and F0.
Panel A shows the percentage of turns with dis-entrainment, no change in speaking rate, and entrainment in speaking rate for the ASD group and the neurotypical comparison group.
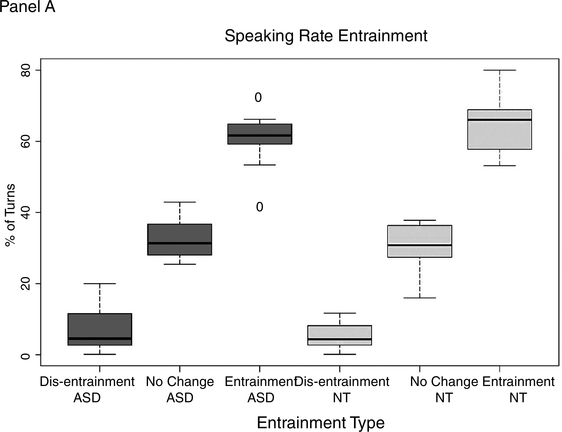
Figure 47.3A Long description
The horizontal axis lists various types of entrainments in both the graphs, which are as follows. Dis entrainment A S D, No change A S D, Entrainment A S D, Dis entrainment N T, No Change N T, and Entrainment N T. The vertical axis represents percentage of turns which ranges from 0 through 80 percent in panel A. The median values of turns in percentages are as follows. Entrainment N T, 65. Entrainment A S D, 60. No change N T, 30. No change A S D, 30. Dis entrainment A S D, 10. Dis entrainment N T, 8.
Panel B shows the percentage of turns with dis-entrainment, no change in speaking rate, and entrainment in F0 for both groups.
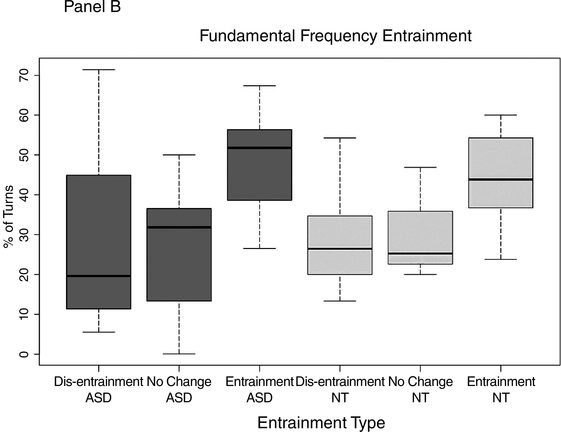
Figure 47.3B Long description
The horizontal axis lists various types of entrainments in the graph, which are as follows. Dis entrainment A S D, No change A S D, Entrainment A S D, Dis entrainment N T, No Change N T, and Entrainment N T. The vertical axis represents percentage of turns which ranges from 0 through 70 percent in graph B. The median values of turns in percentages are as follows. Entrainment A S D, 50. Entrainment N T, 45. No Change A S D, 32. Dis Entrainment N T, 30. No Change, 20. Dis Entrainment A S D, 20.
As can be seen in Figure 47.3, both groups exhibited all three entrainment types – dis-entrainment, no change, and entrainment – at the level of the conversational turn. Furthermore, both groups show entrainment more frequently than either dis-entrainment or no change in the two assessed features “speaking rate” and “F0.”
The only group difference in entrainment behavior that was observed was in global conversational entrainment (b = −0.72, SE = 0.25, t = 2.85, p = .009). Similar to the results reported in Lehnert-LeHouillier et al. (Reference Lehnert-LeHouillier, Terrazas and Sandoval2020), the children and adolescents with autism contributed significantly less to the global conversational F0 entrainment compared to the neurotypical control group.
The results from the correlation analysis revealed that speaking-rate entrainment was highly correlated with F0 entrainment at the local conversational turn level (r = 0.522, p < 0.0001). This holds true for both autistic speakers (r = 0.524, p < 0.001) and the neurotypical peer group (r = 0.55, p < 0.001), suggesting that speakers in both groups coordinated both prosodic features when signalling turn-level prosodic entrainment. However, when looking at the relationship between F0 entrainment at the turn level and global F0 entrainment from the beginning to the end of the conversation, no correlation was found for either the autistic speakers (r = 0.04) or the neurotypical speakers (r = 0.03). This suggests that entrainment at the level of the conversational turn may serve a different conversational function than global conversational entrainment, at least as far as entrainment in mean F0 is concerned.
47.5 Discussion and Conclusion
The emerging research on conversational prosodic-rhythmic entrainment in speakers with autism suggests that these speakers differ in entrainment behaviors from neurotypical speakers. Given the social function of conversational prosodic entrainment, which has been shown to be associated with the perceived quality of conversations (Michalsky et al., Reference Michalsky, Schoormann and Niebuhr2018), as well as the quality of the relationship of conversation partners (Ireland et al., Reference Ireland, Slatcher and Eastwick2011; Lubold and Pon-Barry, Reference Lubold and Pon-Barry2014), differences in prosodic entrainment in speakers with autism are not surprising as they can be seen as a reflection of the social-communicative impairments that are a hallmark of autism.
This chapter reviewed in particular differences in prosodic entrainment in terms of speaking rate and F0, and contributed to the study of rhythmic-prosodic entrainment in speakers with autism by presenting the results from a study investigating speaking-rate and F0 entrainment in children and adolescents with autism in comparison to age, gender, and nonverbal IQ-matched neurotypical peers. The results concur with some of the prior studies, in particular with the study reported by Wynn et al. (Reference Wynn, Borrie and Sellers2018), who did not find differences in speaking-rate entrainment in their child participants with and without autism. They only report differences in speaking rate in adults with autism. The results of the study reported here, similar to the report of Wynn et al. on their child participants, did not find differences in speaking-rate entrainment between speakers with and without autism. This is in contrast to the results reported by Patel et al. (Reference Patel, Cole, Lau, Fragnito and Losh2022) who found that their participants with autism as well as the first-degree relatives of those speakers showed significantly less speaking-rate entrainment at the dialog act level. The study reported here differs in important ways from the two studies that included investigations of speaking rate. Both Wynn et al. (Reference Wynn, Borrie and Sellers2018) and Patel et al. (Reference Patel, Cole, Lau, Fragnito and Losh2022) used syllables per second as measure of speaking rate, while we used WPM. Furthermore, the age ranges of the participants in the three studies differed when it came to the young participants with autism. The mean age of the study of Wynn et al. (Reference Wynn, Borrie and Sellers2018) was 10 years and seven months. The ASD group of Patel et al. (Reference Patel, Cole, Lau, Fragnito and Losh2022) consisted of older adolescents and young adults with a mean age of 19 years and four months. Our study participants with a mean age of 12 years and five months were slightly older than those of Wynn et al. and somewhat younger than those of Patel et al. The difference in the findings in these three studies suggest that age may be one variable that impacts rhythmic entrainment – both in speakers with and without autism.
While Wynn et al. (Reference Wynn, Borrie and Sellers2018) did not investigate F0 entrainment, Patel et al. (Reference Patel, Cole, Lau, Fragnito and Losh2022) and the study reported above both investigated F0 entrainment at a smaller scale during conversations – at the level of the dialog act and the level of the conversational turn, respectively. Patel et al. (Reference Patel, Cole, Lau, Fragnito and Losh2022) report significant differences in mean F0 entrainment at the dialog act level between their ASD participants and the neurotypical comparison group. However, we did not find such group differences in our study reported here. While there are differences in how F0 entrainment was calculated and assessed in both studies, there are also important differences in the demographic characteristics of the participant groups. While our study included participants in each group that were carefully matched in terms of age, gender, and nonverbal IQ so as to not confound the results by including variables that have been linked to prosodic entrainment differences, such as gender (i.e., Reichel et al., Reference Reichel, Beňuš and Mády2018) and age (i.e., Wynn et al., Reference Wynn, Borrie and Sellers2018), the speakers with autism of Patel et al. differed from the neurotypical comparison group in terms of all three parameters – age, gender composition of the groups, and nonverbal IQ. Therefore, further investigation with more carefully matched participant groups would be highly desirable.
The study reported in this chapter was to our knowledge the first to investigate correlations between different acoustic-prosodic features in conversational prosodic entrainment in speakers with autism as well as correlations between local and global entrainment. The results suggest that at the local level of the conversational turn, both speakers with and without autism seem to correlate speaking rate and F0 to mark prosodic entrainment. However, entrainment behavior at the local turn level did not correlate with F0 entrainment at the level of global conversational entrainment for either group. This suggests distinct functions of local and global entrainment in F0, which should be investigated in future research.
The study reported here also has several limitations that we would like to point out. The most obvious limitation is the small sample size of only 14 participants in each group. However, this relatively small sample size made careful matching of participants possible. It should also be noted that the age range of the participants spans puberty – a time associated with significant changes in vocal characteristics of the speakers. This rendered the analysis more difficult as F0 ranges differed as a function of these changes in our male adolescent speakers.
In summary, more research is needed to clarify the factors that influence rhythmic-prosodic entrainment in speakers with autism and to delineate those factors that are not due to speaker characteristics associated with autism.
47.6 Acknowledgements
We would like to thank the children and teens who participated in this research study as well as their families. This research was supported by an Institutional Development Award (IDeA) from the National Institute of General Medical Sciences of the National Institutes of Health under grant number P20GM103451.
Summary
Rhythmic entrainment in speaking rate is highly correlated with F0 entrainment at the local level of conversational turns in the speech of speakers with and without autism. Speakers with autism show differences in global conversational entrainment; however, no correlation between local and global entrainment in F0 was observed for either group.
Implications
The lack of correlation between local and global prosodic entrainment suggests that local prosodic entrainment may serve a different conversational function than global prosodic entrainment. Further research is needed to determine what these distinct functions may be.
Gains
The study presented here suggests that speakers with autism do not show differences in speaking-rate entrainment when compared to neurotypical speakers who are matched in age, gender, and nonverbal IQ. This finding is in contrast to earlier findings and highlights the importance of delineating factors that may impact entrainment behaviors but that are not due to speaker characteristics associated with autism.
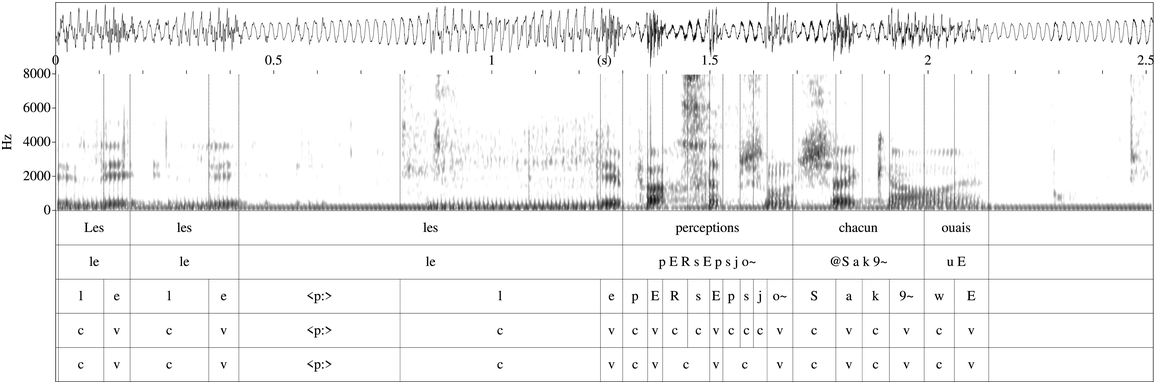
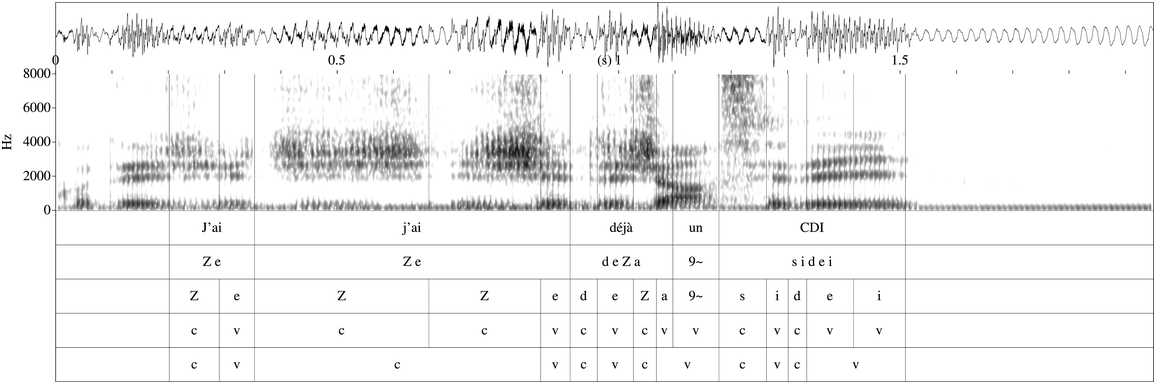
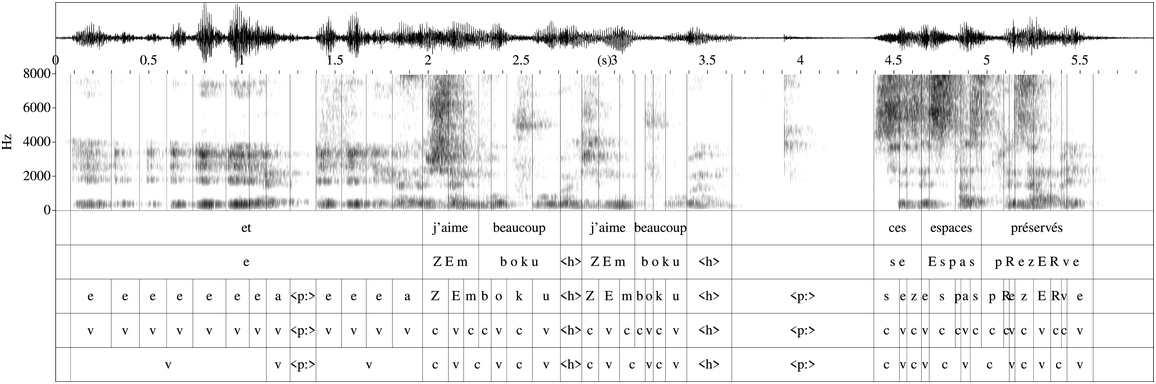
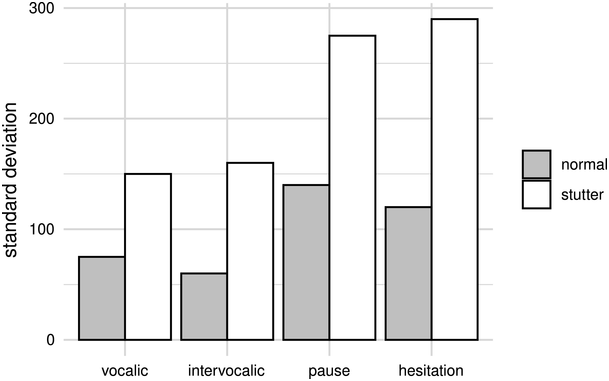
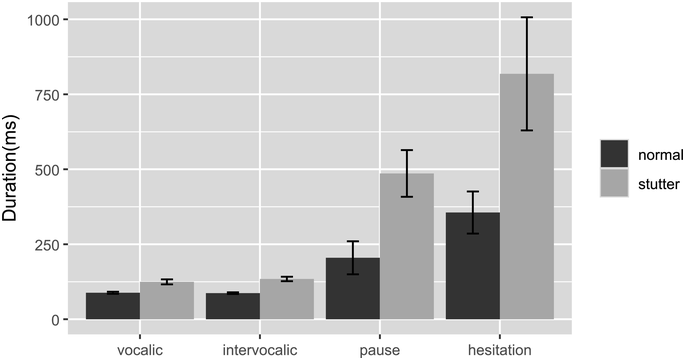
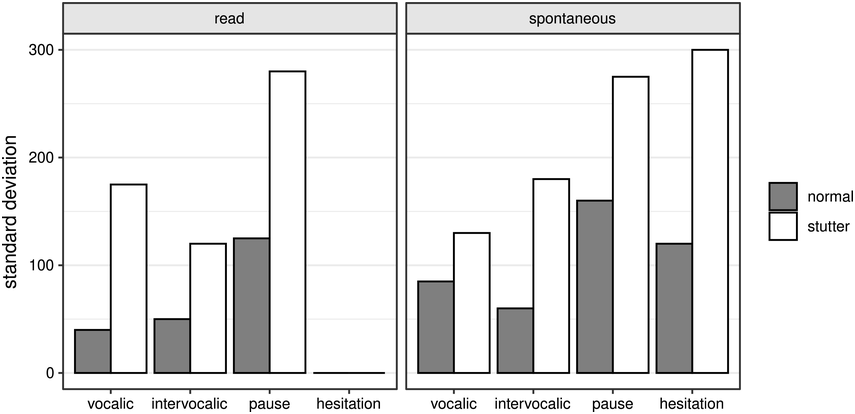
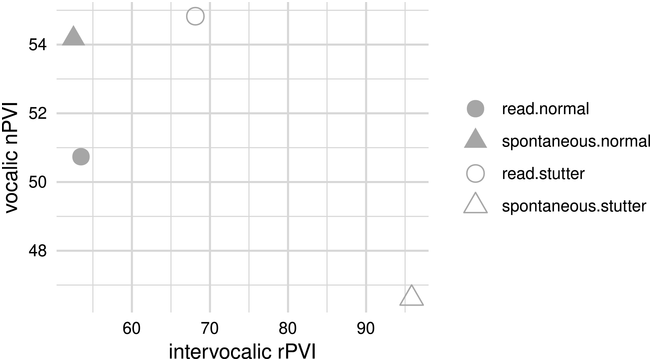
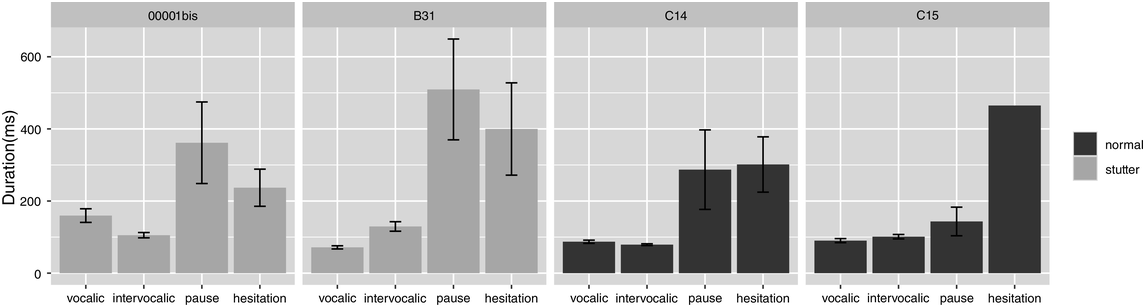
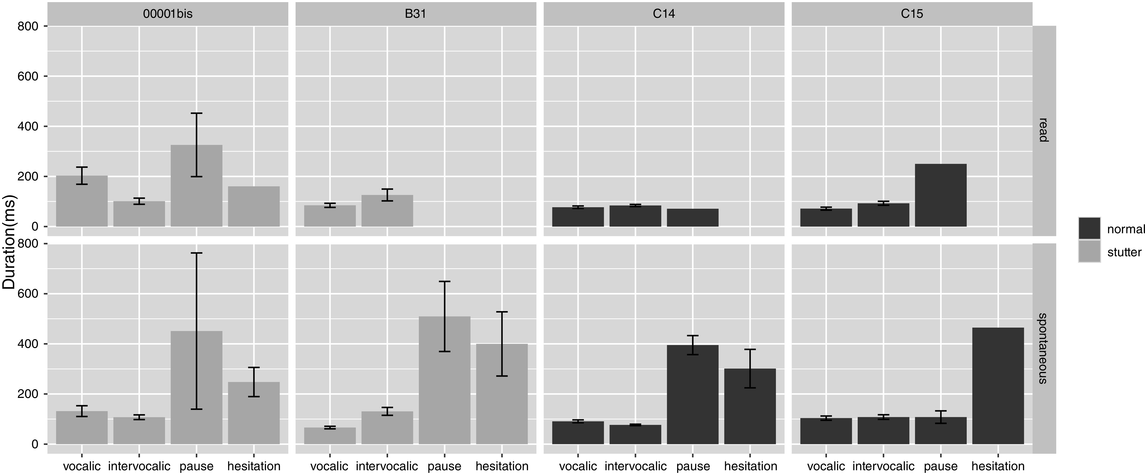
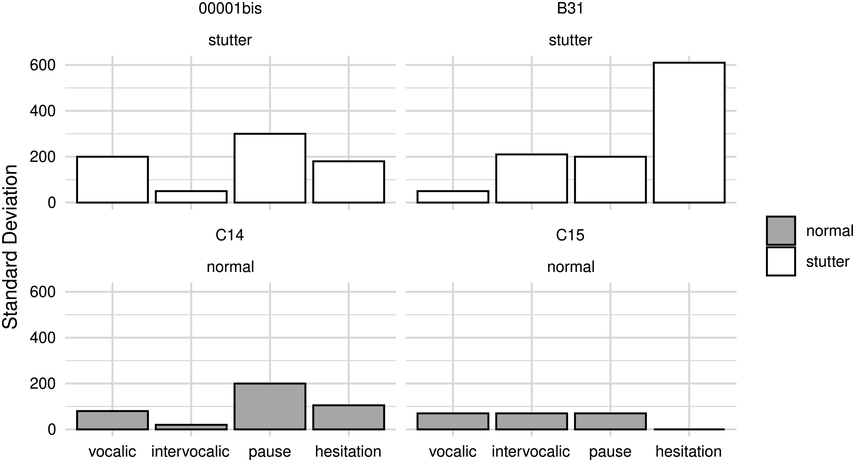
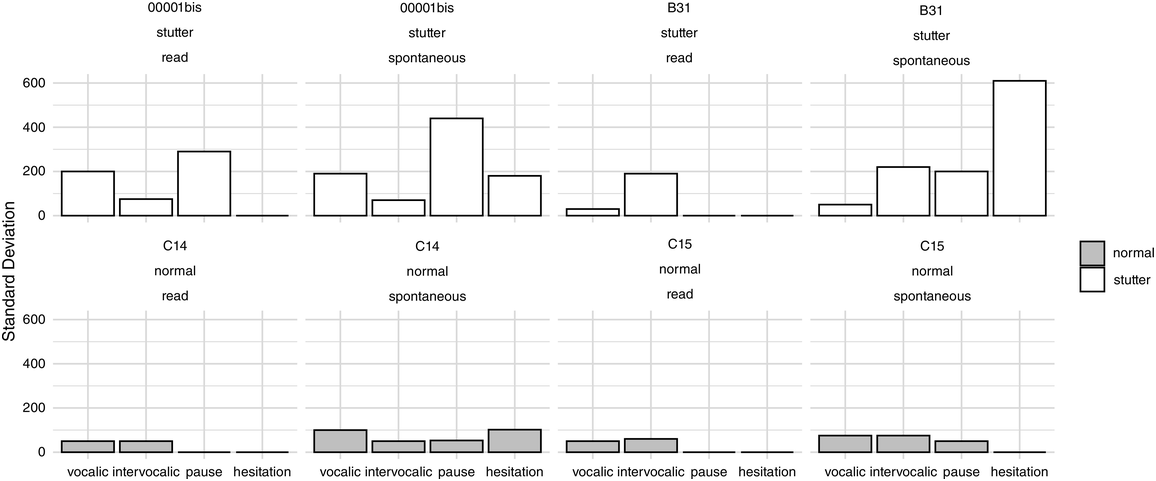
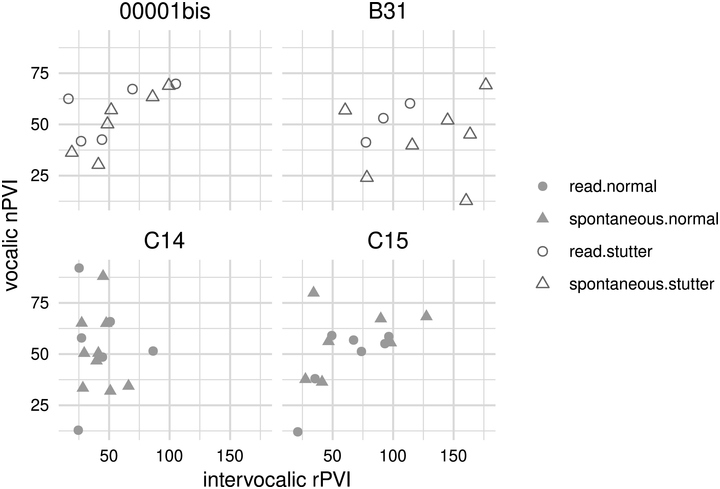
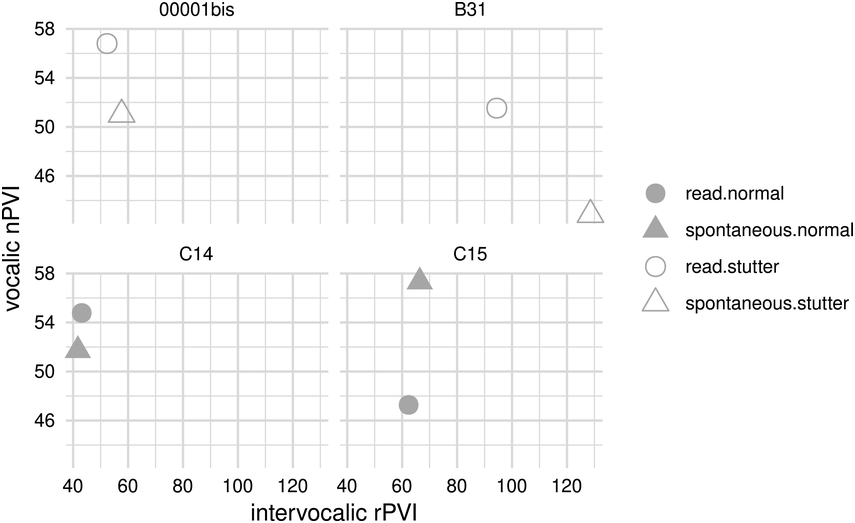
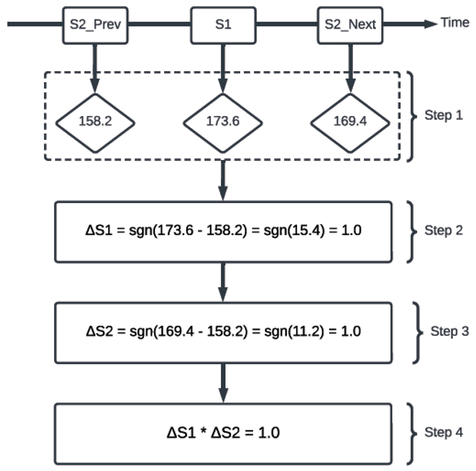
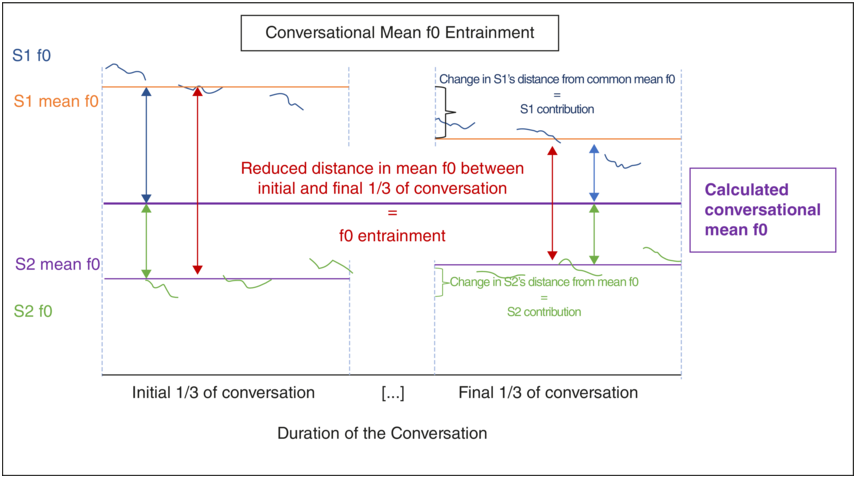
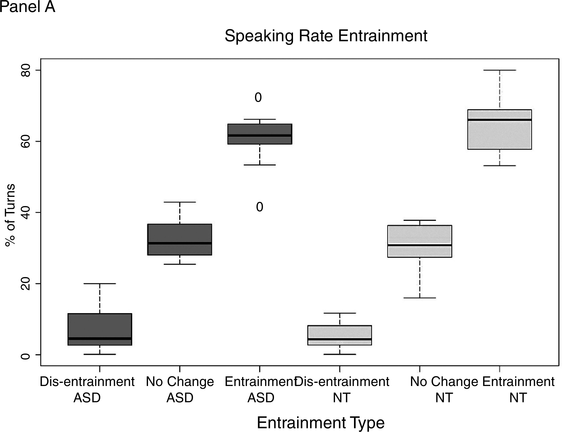
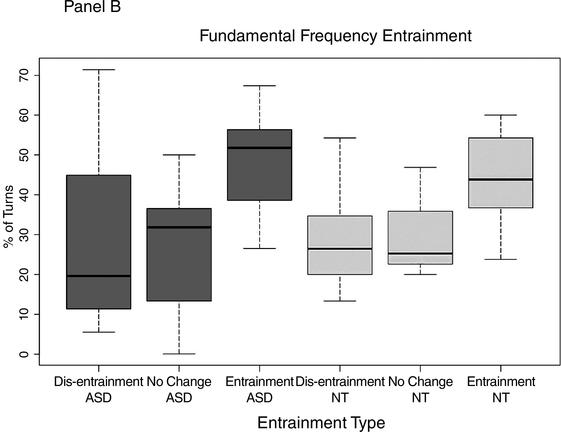

 Open access