


1. Introduction
Many important decisions are made by agents with discretionary power. Politicians decide which policies to implement, police officers decide which vehicles to stop, hiring managers decide what candidates best fit a job description, and procurement officers make decisions on how to award contracts. These decision-makers are entrusted with using their discretionary power in a manner that aligns with the goals of their respective organization. However, in practice, agents may deviate from these goals by adopting decision rules that prioritize the interests of a third party over those of the organization.
We study the role of two key channels through which third parties may distort the judgment of agents. The first is a monetary channel: agents may be persuaded to alter their judgment in exchange for a bribe. The second channel involves lobbying, which relies on non-monetary persuasion. While bribery can be effective for agents motivated by financial gain, its effectiveness may diminish when the acceptance of bribes is associated with salient moral costs (Gneezy et al., Reference Gneezy, Saccardo and van Veldhuizen2019, Reference Gneezy, Saccardo, Serra-Garcia and van Veldhuizen2020). In such cases, lobbying, with its potentially lower moral costs, may prove to be a more effective form of persuasion.
Both bribery and lobbying are thought to be important (e.g., Campos & Giovannoni, Reference Campos and Giovannoni2007; Kaufmann, Reference Kaufmann2005), but they are challenging to investigate due to the lack of suitable data. To overcome this challenge, we turn to the laboratory to study some basic properties of these behaviors (Di Tella et al., Reference Di Tella, Perez-Truglia, Babino and Sigman2015; Gneezy et al., Reference Gneezy, Saccardo and van Veldhuizen2019; Malmendier & Schmidt, Reference Malmendier and Schmidt2017).
In our experiment (N = 416), one participant (the ‘worker’) works on a task, and a second participant (the ‘referee’) is tasked with giving a bonus to a worker who meets an objective performance threshold. In a 2 × 2 between subject design, we examine the separate and joint impact of lobbying and bribery. We do so by varying whether the worker is given the option to send a monetary bribe to the referee or to engage in lobbying. We operationalize lobbying by giving workers the option to attempt to persuade the referee through free-form communication. To mimic the potentially negative consequences of bribery and lobbying, we incorporate a negative externality: awarding a bonus payment to an undeserving worker reduces overall earnings of other workers in the session.
We investigate two possible effects of bribery and lobbying: (a) an increase in the proportion of undeserving winners, that is, workers who performed worse than the threshold, but nevertheless received the bonus, and (b) a weakening of the relationship between performance and winning among those who fall below the performance threshold. In our control treatment without bribery and lobbying, referees award the bonus to undeserving workers 21% of the time, and the likelihood of receiving a bonus increases with better performance, suggesting that referees tend to favor those who narrowly missed the threshold.
Lobbying increases the overall fraction of undeserving winners by 16 percentage points but does not change the relationship between performance and winning, as workers who narrowly missed the performance threshold are still more likely to be selected. In contrast, bribery does not increase the fraction of undeserving winners but alters the decision-making process by weakening the link between performance and winning. Specifically, with bribery, referees are more inclined to award the bonus to workers who are willing to bribe, regardless of their performance, rather than to those who performed better but still fell short of the threshold. We also find evidence that bribery and lobbying act as complements: participants use lobbying to coordinate on the size of the bribe, which enhances the benefit of bribing and increases the penalty for those who choose not to bribe.
Our results contribute to the growing body of experimental research on bribery and corruption. Starting with Abbink et al. (Reference Abbink, Irlenbusch and Renner2002), these experiments investigate how policies such as staff rotation (Abbink, Reference Abbink2004), wage increases (Van Veldhuizen, Reference Van Veldhuizen2013), and increased monitoring (Serra, Reference Serra2011) change the way agents allocate money between themselves, the principal, and a third party.
Recent work demonstrates that bribes change the way agents make decisions, allowing them to convince themselves that an inferior performer deserves to win a contest (Gneezy et al., Reference Gneezy, Saccardo and van Veldhuizen2019), that a product that comes with a commission is also superior (Gneezy et al., Reference Gneezy, Saccardo, Serra-Garcia and van Veldhuizen2020; Malmendier & Schmidt, Reference Malmendier and Schmidt2017; Saccardo & Serra-Garcia, Reference Saccardo and Serra-Garcia2023), or that another participant cheated and can therefore be harmed (Di Tella et al., Reference Di Tella, Perez-Truglia, Babino and Sigman2015).
We extend this line of research by investigating the role of distorted judgment in a context that involves both bribery and lobbying. This approach allows us to examine the effects of each channel independently and explore how they interact with each other when they occur simultaneously, as is often the case in real-world settings.
Our work also relates to previous research on communication in social dilemmas (e.g., Bornstein et al., Reference Bornstein, Rapoport, Kerpel and Katz1989; Isaac & Walker, Reference Isaac and Walker1988; Ostrom et al., Reference Ostrom, Walker and Gardner1992), markets (e.g., Bartling et al., Reference Bartling, Valero, Weber and Yao2024; Fonseca & Normann, Reference Fonseca and Normann2012), contract design (Brandts et al., Reference Brandts, Ellman and Charness2016; Charness & Dufwenberg, Reference Charness and Dufwenberg2006), and other settings (see Brandts et al., Reference Brandts, Cooper and Rott2019 for a recent review). Unlike these previous studies, communication in our setting leads to a less desirable outcome overall, as it results in bonuses being awarded to undeserving participants. Finally, our design also allows us to study the moral costs associated with distorting the judgment of a worker’s true performance. Our findings suggest that these moral costs may be substantial, and that amplifying them further could help reduce the effectiveness of both bribes and lobbying.
2. Experimental design
We study a setting in which one participant (the ‘worker’) works on a real effort task and a second participant (the ‘referee’) evaluates the worker’s performance and decides whether they are eligible for a bonus payment. The experiment was computerized using Ztree (Fischbacher, Reference Fischbacher2007). Workers and referees each received a $5 show-up fee for participating in the experiment. The experiment was run at the University of California San Diego (UCSD) in Spring 2016 and at most 10 participants (five pairs) took part in each session. We did not pre-register the experiment, because it was not common practice in economics to do so at the time.
2.1. Task
The worker’s task is to form as many English words as possible from a string of eight letters (‘aabbells’) in five minutes. Each word is worth two times the number of characters (e.g., 10 points for ‘bells’), with the exception of seven-letter and eight-letter words, which are worth 20 and 30 points respectively. Workers are told that if their total score equals or exceeds 200 points, they will be entitled to receive a bonus, and that another participant (the referee) is tasked with evaluating their performance. Each worker was assigned to a single referee, and vice versa.
Note that some of the admissible words were obscure and less familiar, even to native speakers of the English language. This feature of the task makes the evaluation process at least partially subjective, introducing some scope for referees to justify giving points to workers based on questionable words. All instructions are presented in Online Appendix B.
At the end of the five minutes, the referee receives all the words constructed by their worker. The referee is then asked to evaluate the worker’s performance, and indicate whether their performance exceeded the threshold. Our primary interest is whether undeserving workers are able to convince referees to give them a bonus. To maximize the number of relevant cases, we therefore calibrated the task using a pre-test (discussed in section E below) such that we expected only about 10% of workers to actually achieve the performance threshold.
2.2. Treatments
In a 2 × 2 design we varied whether the worker is allowed to bribe the referee and whether they can engage in lobbying, which we operationalize using free-form communication. In our CONTROL group, the referee evaluates the worker without interacting with them in any way. In treatment BRIBE, participants are told that after completing their task but before the referee starts the evaluation, the worker has the option to send an integer amount of up to $5 from their show-up fee to the referee. The referee sees the proposed bribe, goes through the words to determine the worker’s score, and then decides whether to award the bonus. If the referee decides to award the bonus, they can choose whether to keep the bribe; if not, the bribe is returned to the worker.
In treatment COM (for ‘communication’) the worker and referee can chat to one another in a chat box before and during the evaluation process (two and three minutes, respectively). Having the communication take place before the evaluation helps the worker forge an initial relationship with the referee, while having that communication concurrently during the evaluation process allows the worker to directly persuade the referee of the quality of their overall performance or of the validity of specific words. After the five minutes of chat end, the referee has five more minutes to finish the evaluation process in absence of any distractions.
Finally, in treatment BRIBECOM, the worker and referee have access to both bribery and communication. Here, the worker and referee can first engage in free-form communication for two minutes. The worker can then decide whether to bribe the referee, and if so, by how much. Finally, the referee starts evaluating the worker’s performance. Similar to the BRIBE treatment, the proposed bribe is visible throughout the evaluation process. Similar to the COM treatment, there is a chat window during the evaluation stage that closes after three minutes. After the chat window closes, the referee then has five more minutes to finish the evaluation of the worker in absence of any distractions.
2.3. Additional design features
To mimic negative features associated with bribery and lobbying, all four treatments incorporate externalities, efficiency losses, and monitoring. We incorporate the first two features by making the bonus payments depend on the total number of bonuses paid in a given session. Specifically, in case of only one ‘winner,’ the winner is paid a bonus of $55. If there are two winners, each winner is paid $25; three winners each are paid $15, four winners $10 and five winners each are paid $7. This payment structure implies that awarding a bonus to an undeserving worker both reduces the payoffs of potentially more deserving winners (a negative externality) and the total size of the pie of bonuses to be awarded in the session (an efficiency loss).
In addition, all participants are told that referees have a 10% chance of being audited at the end of the session. If this occurs, the audited referee(s) stay for several additional minutes, while a research assistant evaluates whether the worker’s score exceeds the threshold and compares their assessment with the referee’s decision. If the referee’s decision does not correspond to the worker’s performance, the referee is fined half their show-up fee and also loses any bribe they decided to keep. This feature mimics the fact that distortion of judgment may be illegal and subject to punishment, but that auditing is probabilistic. The worker’s earnings are not affected.
2.4. Remaining procedures
Participants were recruited using standard laboratory procedures via an online experimental registration system. Upon entering the laboratory, each participant was assigned to a random cubicle, read through the instructions and answered several comprehension questions, all presented on their computer screen. In explaining the task, we used a different set of letters (‘cdeeeinv’) than the one used in the actual experiment.
After all participants finished their instructions, the experiment proceeded as described above. At the end of the experiment, workers found out whether they passed the threshold (as judged by their referee) and received the bonus. If they passed the threshold, we also told them how many other workers passed it, which was necessary to determine the size of their individual bonus. We then told participants their total earnings in the experiment and, when applicable, whether the referee had decided to accept or return the bribe.
All participants then answered a brief questionnaire with demographic questions, an open question regarding the effectiveness of communication (COM and BRIBECOM only), and questions related to the actual number of workers they thought were good enough to pass the threshold in their session. We also asked workers whether they thought they were personally good enough to pass the threshold, and referees what they thought their worker’s score actually was. We then paid participants and the experiment ended. We then compared the worker’s submitted words to a list of admissible words to get a measure of the worker’s actual score for use in the analysis.
2.5. Evaluator sessions and pilots
After running the initial sessions, we recruited an additional set of 516 UCSD students to evaluate the chats. For this purpose, we presented participants with the instructions for the main experiment. We then asked them to read through several chats and classify their contents along several pre-specified dimensions (including attempted monetary and non-monetary persuasion, small talk, and friendliness of the conversation, see Online Appendix A3). This data provides us with a way to analyze the types of topics discussed in the chat. Each participant evaluated five chats, giving us between 24 and 27 evaluators for each individual chat.
We conducted three pilots to test the software and calibrate the worker’s task to find a point-threshold for the bonus such that approximately 90% of workers would fall below the threshold. In the first pilot, 69 participants completed the worker’s task using one of three sequences of letters. We used longer sequences (e.g., ‘accdeeeginst’) and a different point system where the nth letter of a word was worth n points. The results led us to adopt a simpler point system for our second pilot study (N = 172), where we tested three potential sequences (‘aabbells,’ ‘abflloot,’ and ‘edgjmntu’). In our third pilot, we tested the experimental software with one session for each treatment (N = 34).
3. Predictions
Given the possibility that an audit occurs, referees in the CONTROL and COM treatments are incentivized to award the bonus only to workers who deserve it. In the BRIBE and BRIBECOM treatments, referees who maximize their expected payment will award the bonus to any worker who sent them a bribe. This is because bribes can only be kept if the worker receives the bonus, and even the smallest bribe ($1) exceeds the expected loss from being caught 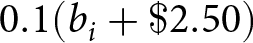 $0.1({b_i} + \$ 2.50)$. Assuming that participants maximize their expected payment, and given that the minimum bonus is equal to $5, all undeserving workers are expected to bribe at least $1 to get the bonus. Hence, expected payoff maximization predicts that introducing bribes increases the fraction of undeserving workers who obtain the bonus to 100%.
Based on past work, we expect bribes to be less effective in practice. For example, if referees are risk averse, or care about efficiency, externalities, or creating disadvantageous payoff inequality, they may require a higher bribe to distort their judgment or they may be unwilling to distort their judgment altogether. Referees may also experience a moral cost from distorting their judgment per se (Gneezy et al., Reference Gneezy, Saccardo and van Veldhuizen2019). For similar reasons, the fraction of undeserving workers who choose to offer a bribe to the referee may be lower than 100%.
Lobbying may affect the referee’s decision by giving workers a channel for attempting to convince the referee to increase their performance assessment (e.g., by agreeing that ‘salable’ is a word), to establish a social tie with the referee, and perhaps even to lower the referee’s moral cost (by e.g., convincing the referee that distorting judgment is not so bad). Hence, allowing for lobbying may increase the fraction of undeserving winners as well. When bribes are possible, lobbying may also help workers and referees coordinate and convince each other that bribery is not dishonest. As such, lobbying may increase the frequency of undeserving winners and increase the effectiveness of bribes.
4. Results
A total of 430 participants took part in our experiment. We exclude the data from one session with only six participants, along with the data from three pairs for which the workers’ output was not saved due to a software error and one pair where the referee accidentally clicked through without evaluating the words.Footnote 1 Table 1 presents descriptive statistics for our remaining sample. The treatments are well balanced in terms of gender, age, the fraction of non-native speakers, and fields of study. Table A6 and A7 in the Online Appendix present descriptive statistics separately for workers and referees.
Descriptive statistics

Notes: Descriptive statistics (standard deviations). The first eight variables are dummies for gender, the respective majors and non-native speakers, and the age in years. ‘Score’ is the true number of points earned by workers as determined by the experimenters. ‘Passed threshold’ is a dummy for participants who reached the performance threshold of 200. ‘Sent a bribe’ is a dummy for whether the Worker sent a bribe. ‘Bribe amount if > 0’ is the size of the bribe in cases where a bribe was sent. The two score and bribe variables only use data from workers. The other variables use data from workers and referees.
Table 1 also presents descriptive statistics on bribery. In treatments where they were allowed to bribe, 70 out of 107 workers (65%) chose to do so. Among those who chose to bribe, the average bribe was $2.96. Figure A1 in the Online Appendix presents the full distribution. In Table A3 in the Online Appendix we examine how worker demographics predict the size and likelihood of sending a bribe.
Before proceeding to our main analysis, it is important to evaluate how the availability of bribes or lobbying might influence worker performance. Intuitively, workers might adjust their effort – either reducing or increasing it – in response to the possibility to leverage these persuasion channels. However, our findings do not reveal a clear relationship between performance and the possibility to take advantage of bribery or lobbying. While allowing for bribes or communication separately directionally results in lower performance relative to the control treatment, allowing for both channels directionally results in higher performance, though none of these differences are statistically significant. Moreover, the fraction of workers who passed the threshold did not differ significantly by treatment (p > .10 for all pairwise treatment comparisons, t-test). We present further details in Online Appendix A1 and control for score differences in our main regression analyses. Finally, it is worth noting that, across both treatments where bribery was allowed, there is no relationship between the worker’s score and either the likelihood of bribery (r = 0.008, p = .933) or the size of the bribe (r = 0.047, p = .631).
When workers passed the threshold and were therefore entitled to the bonus, they received it in the majority of cases (11 out of 13, or 84.6%). In the remainder of our analysis, we will focus on referees matched with workers who were not entitled to receive the bonus (N = 195). This approach allows us to investigate the extent to which lobbying and bribery affected the referees’ willingness to distort their judgment by awarding the bonus to an undeserving worker. Note that we will use the words ‘lobbying’ and ‘communication’ interchangeably in this section.
4.1. Treatment differences
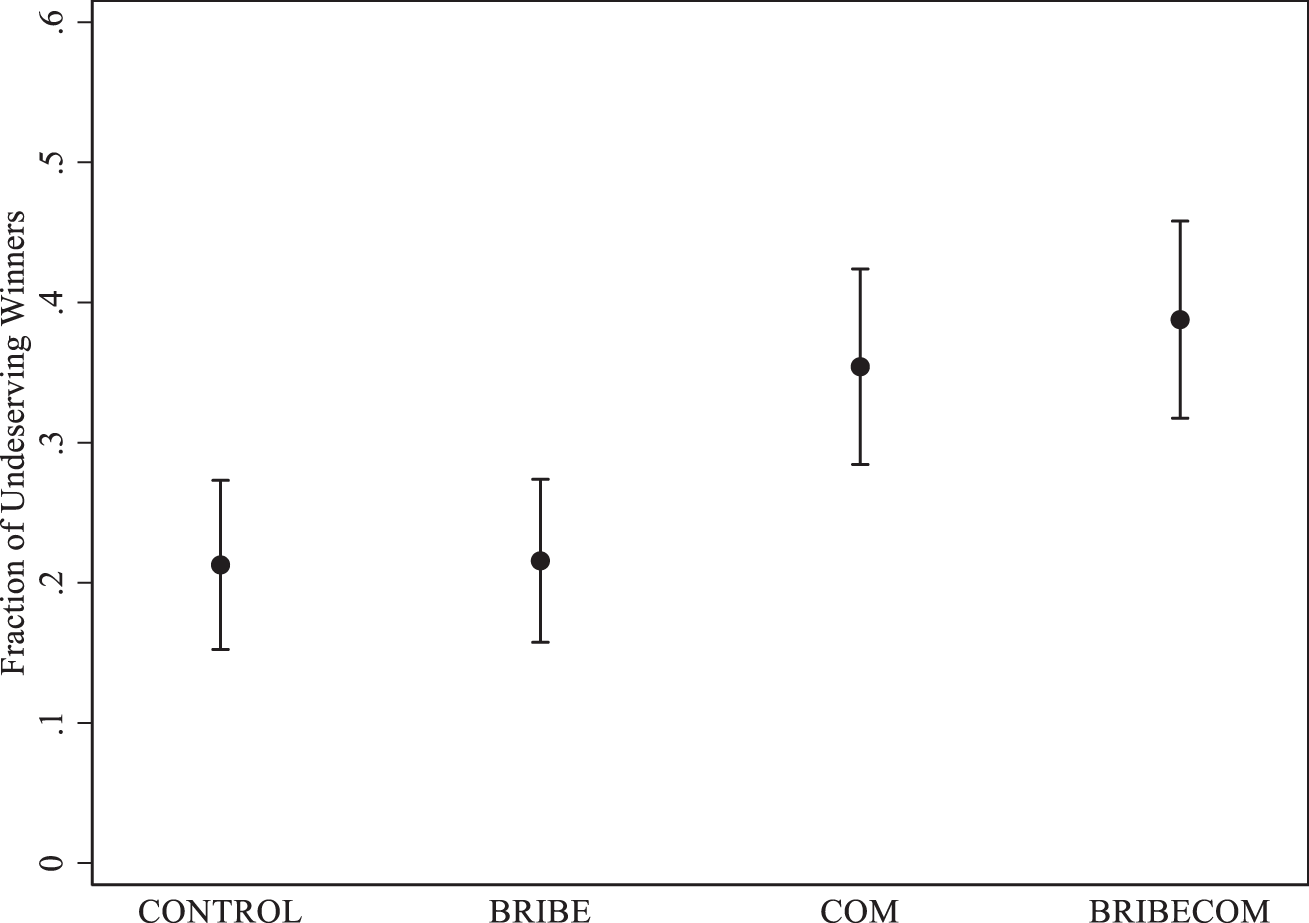
As a first step, we examine whether the overall fraction of undeserving workers receiving the bonus differs across treatments. Specifically, we compare the fraction of undeserving winners – those with a score less than 200 – who still received the bonus (Fig. 1). If referees are honest and do not make mistakes, this fraction should be equal to 0% in the CONTROL treatment. In practice it is 21.3%, suggesting that several referees either made a mistake or were willing to pass a worker who did not reach the threshold.
Fraction of undeserving winners by treatment (± one standard error)

Fig. 1 also reveals that lobbying was effective in distorting the referees’ judgment. The fraction of undeserving winners was significantly higher in the two treatments with communication relative to the two treatments without communication (21.4% vs. 37.1%; p = .016, test of proportions). By contrast, allowing workers to send a bribe did not affect the fraction of undeserving winners (28.4% in CONTROL and COM combined vs. 30.0% in BRIBE and BRIBECOM combined; p = .809, test of proportions). We also see no evidence of an interaction effect: allowing for both bribes and lobbying (BRIBECOM) yielded a similar fraction of undeserving winners compared to the lobbying-only treatment COM (35.4% vs. 38.8%, p = .732, test of proportions).Footnote 2
Table 2 repeats this analysis using linear probability models. In line with the raw data from Fig. 1 and to increase power, we assume that the effects of bribery and lobbying are additively separable. Column (1) replicates the non-parametric tests for the main effects of bribery and lobbying. Column (2) also controls for the workers’ score to adjust for potential treatment differences in performance, which slightly reduces the impact of communication. The positive coefficient for the worker’s score indicates that high-performing (but still undeserving) workers (i.e., workers with performance closer to the threshold) are more likely to receive the bonus. Table A2 shows that all results in Table 1 are robust to controlling for the referee’s demographic characteristics and appear to be driven by referees who are native speakers. Overall, we find evidence that allowing for communication increases the fraction of undeserving winners, whereas bribery does not. In the next sections, we will separately investigate the effects of lobbying and bribery in greater detail.
Referee behavior

Notes: OLS estimates, robust standard errors are in parentheses. The dependent variable is a dummy for whether the referee awarded the bonus to the worker. ‘Bribery Allowed’ and ‘Communication Allowed’ are dummy variables for treatments that allow for bribery (BRIBE and BRIBECOM) and communication (COM and BRIBECOM) respectively. ‘Score’ is the worker’s (demeaned) performance on the task. ‘Bribe Amount > 0’ is a dummy for cases where the worker sent a positive bribe. ‘P(Bribery Allowed | Bribe Amount > 0) = 0’ presents the p-value from a Wald test that tests whether the sum of the ‘Bribery Allowed’ and ‘Bribery Allowed * Bribe Amount > 0’ coefficients differs significantly from zero. The table only includes cases in which the worker’s score is below the bonus threshold of 200.
*** Significant at the 1% level; ** Significant at the 5% level; * Significant at the 10% level.
4.2. The distortionary effects of lobbying
Though lobbying increases the number of undeserving winners, its distortionary effect also depends on how it influences the relationship between performance and receiving the bonus. One possibility is that lobbying increases the likelihood of receiving the bonus without altering the relationship between performance and winning – meaning that higher-performing workers still have a greater likelihood of receiving the bonus, even among those below the threshold. In this case, the distortion in the quality of winners would be minimal, as performance would remain an important factor. However, if lobbying weakens the relationship between performance and winning – by making all workers equally likely to win, regardless of their performance, or even favoring poorer performers – the distortion would be more pronounced. In this case, lobbying would disrupt the link between performance and winning, leading to a larger degradation in the quality of the winners.
To investigate how lobbying affects the relationship between performance and winning, Column (3) in Table 2 allows the effect of communication to depend on the worker’s score. The estimated interaction effect is close to zero, suggesting that the effect of communication does not depend on the worker’s score. The near-zero interaction effect combined with the positive main effect of ‘communication’ shows that having communication increased the probability of winning for all workers, independent of their score. Hence, while lobbying is distortionary because it increases the overall percentage of winners, it does not significantly weaken the relationship between performance and winning – higher-performing workers still retain an advantage in receiving the bonus.
In addition to examining whether referees awarded the bonus, we can also study distortion by investigating the scores reported by referees in the questionnaire when judging workers’ performance. The results are similar. Communication increases the fraction of referees who report that their worker’s score in the questionnaire passed the 200-point threshold from 9.2% to 22.7% (p = .010, test of proportions). Incidentally, the correlation between the workers’ actual scores and those reported by the referees was similar in sessions with (r = 0.70, p < 0.0001) and without (r = 0.63, p < 0.0001) communication. This suggests that communication did not hamper the referee’s ability to grade, such as by serving as a distraction.
How does the content of communication influence referees? Table 3 reports OLS regressions that compare the effectiveness of different arguments, as classified in the evaluator sessions using pre-defined categories. Column (1) shows that workers who expressed sadness about their poor performance were less likely to receive the bonus and Column (3) shows that they were also less likely to have their score reported as exceeding the threshold. Although these results could have been driven by these workers actually having lower performance, columns (2) and (4) show that these effects remain unchanged when we control for the worker’s actual score. When chats were used to negotiate a bribe (the monetary argument), the worker was significantly more likely to obtain the bonus. These monetary arguments are not relevant for the score reported by the referee. Workers who claimed to have worked hard were more likely to have their scores reported as exceeding the threshold, though this effect is no longer significant after controlling for the worker’s score. Incidentally, the worker’s actual score is not significantly correlated with the presence of any of the five arguments.
Distortionary effects of communication arguments

Notes: OLS estimates, robust standard errors are in parentheses. The dependent variable in columns (1)–(2) is a dummy for whether the referee awarded the bonus to the worker. The dependent variable in columns (3)–(4) is a dummy for whether the referee gave the worker a score greater or equal to the threshold of 200 in the questionnaire. The first five variables are the average response across all evaluators in the evaluator sessions to binary questions asking evaluators whether specific arguments were used by the worker to convince the referee (see Online Appendix A3 for the specific questions). ‘Score’ is the worker’s performance on the task. The table only includes data from the COM and BRIBECOM treatments, and only includes cases in which the worker’s score is below the bonus threshold of 200.
*** Significant at the 1% level; ** Significant at the 5% level; * Significant at the 10% level.
Overall, lobbying is distortionary in the sense that it helps all workers increase their probability of obtaining the bonus, independent of their score. Workers who do not express sadness at their own poor performance or use the chat to negotiate a bribe were most likely to receive a bonus. We examine the interaction between bribery and lobbying in greater detail in section 4.4 below.
4.3. The distortionary effect of bribes
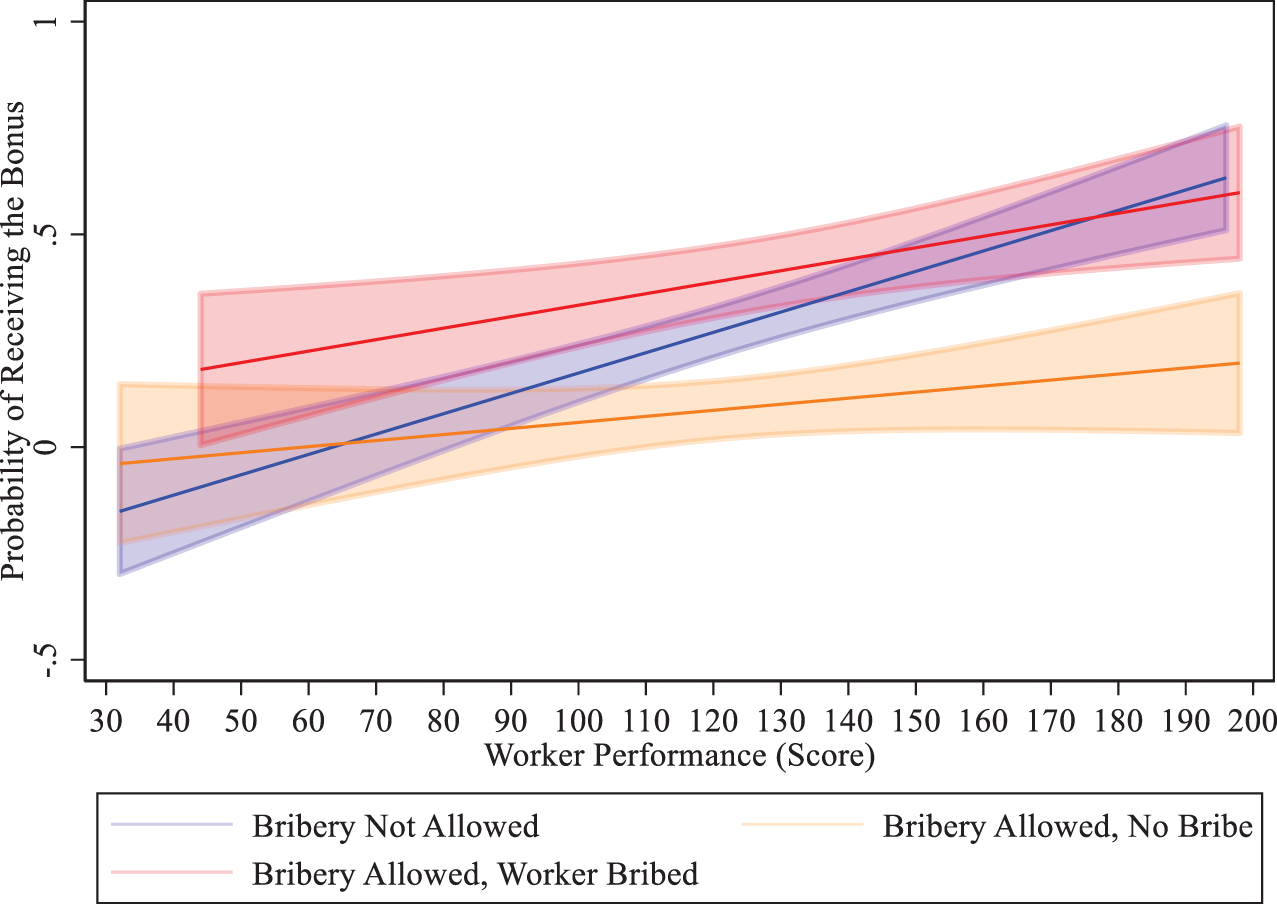
Though bribery did not increase the fraction of undeserving winners overall (Fig. 1), the extent to which it is distortionary also depends on how it affects the relationship between performance and winning. To analyze this relationship, we interact the worker’s score with an indicator for treatments where bribery was allowed. The results are presented in Columns (3) and (5) of Table 2 and visualized in Fig. 2. When no bribes are allowed, there is a positive relationship between performance and the likelihood of receiving the bonus. Once bribery becomes an option, however, this relationship essentially disappears. In other words, referees in sessions with bribes appear to have cared less about the worker’s performance.
Predicted winners by score and bribery (95% confidence intervals)

Instead, referees awarded bonuses to workers who sent a bribe. Formally, out of the 70 workers who bribed, 66 had a score of less than 200, 27 of whom (40.9%) were awarded a bonus. By contrast, out of 34 undeserving workers who did not send a bribe, only three (8.8%) received the bonus. This difference is large (32.1pp) and significant (p < .001, test of proportions). It is useful to note that workers who bribed (135) and workers who did not (130) had very similar scores (p = .631, t-test).
Column (4) in Table 2 replicates this analysis, while controlling for the presence of communication. The ‘Bribery Allowed * Bribe Amount > 0’ coefficient confirms the result of the non-parametric test, showing that workers who bribe are significantly more likely to win than workers who choose not to bribe. The ‘Bribery Allowed’ coefficient additionally shows that workers who did not bribe when they were able to, were 17 percentage points less likely to receive the bonus than workers in other treatments who did not have the option to bribe. The sum of these two coefficients shows that workers who bribed when able to were not significantly more likely to win than workers who did not have the option to bribe (p = 0.128, Wald test). Column (5) repeats this analysis, while also studying the role of performance. Performance positively predicts winning when bribery is not allowed, but no longer does so when bribery is allowed. The three-way interaction term implies that the performance effect was similar regardless of whether a bribe was sent, as is visually apparent in Fig. 2.
Overall, these results highlight the distortionary effect of bribes that are masked when focusing only on analyzing differences in the fraction of winners. In treatments without bribes, workers are more likely to receive the bonus the closer their score is to the threshold. When workers have the opportunity to bribe, however, the relationship between performance and winning disappears, as only workers who sent a bribe have a chance of receiving the bonus if they did not pass the threshold. Even though the average fraction of bonuses paid out is not affected by the possibility to bribe, allowing workers to bribe shifts resources from those who arguably deserve it more to those who are willing to pay to obtain it. In addition, it shifts bonus payments from those who are unwilling to engage in bribery to those who are happy to do so.
4.4. Bribery and lobbying
Finally, we analyze bribery and lobbying jointly and investigate whether communication changes the size, effectiveness, or distortionary nature of bribes, and whether bribery changes the types of arguments used in communication. Without communication, 54.9% of workers decide to send a bribe. With communication, this fraction rises to 77.6% (p = .017, test of proportions). Conditional on sending a bribe, however, the amount is similar with ($2.89) and without communication ($3.03; p = .740, t-test, see Figure A1).
Bribes also appear more distortionary in the presence of communication. In the BRIBE treatment (without communication), workers who sent a bribe were awarded the bonus 28.6% of the time, compared to 13.0% of workers who failed to send a bribe, a difference that is not significant regardless of whether we control for performance (Table A8). By contrast, in the BRIBECOM treatment 19 out of the 38 workers who sent a bribe (50.0%) received the bonus, compared to 0% for the 11 workers who did not send a bribe, a statistically significant difference (p < .001, Table A8). The difference-in-difference is statistically significant (p = .016 without performance controls and p = .049 with performance controls, Table A8), which implies that bribes were indeed more effective when communication was possible.
In the previous section, we saw that bribes were distortionary in the sense of shifting resources away from high performers to low performers. Table A7 examines the relationship between performance and bonus payments separately for cases with and without communication. The results are very similar: high performers are more likely to receive the bonus when bribery is not allowed, but there is no significant effect when bribes are allowed, regardless of whether a bribe was sent or whether communication was possible. In other words, this distortionary effect of bribes does not depend on the presence of communication.
Not surprisingly, we also find that allowing bribery increases the rate at which monetary arguments are discussed in the chat (Table A4). Conversely, the frequency of non-monetary arguments falls in cases where bribes are possible. This change seems to mostly be driven by a reduced frequency of chats where workers claimed they almost passed the threshold. At the same time, we do not find evidence that allowing bribery changed the effectiveness of different arguments in persuading the referee to award the bonus (Table A5). Within treatment BRIBECOM, monetary arguments (p = .003, t-test), having worked hard (p = .008), not being sad (p = .034), and having almost passed the threshold (p = .017) were all more likely to come up in pairs in which a bribe was exchanged. All in all, allowing for bribes changes the content of communication, but does not significantly alter the effectiveness of different arguments.
5. Concluding remarks
For as long as governments have existed, public officials have been subjected to attempts to influence decisions through tangible or non-tangible forms of persuasion. We study both persuasion channels in an experiment where workers can attempt to persuade referees to award them a bonus that they are not entitled to. We find that both channels distort referees’ judgment, but they do so in different ways. Whereas lobbying increases the fraction of undeserving winners – those with scores below the threshold who receive the bonus – bribery changes who receives the bonus. Without bribery, undeserving workers with scores close to the threshold were most likely to receive the bonus. In contrast, when bribery was possible, bribes induced referees to award bonus payments only to workers who provided them with financial compensation, regardless of their performance.
We also find evidence that bribery and lobbying influence each other. While sending a bribe does not significantly increase the win chance without lobbying, bribes have a strong effect when lobbying is introduced, as evidenced by the large difference in win rates between workers, depending on whether they chose to bribe. This effect may be due at least in part to participants appearing to use lobbying to coordinate on bribery. This result is in line with previous studies on communication in coordination games and social dilemmas. In contrast to these previous studies, however, lobbying leads to a less desirable outcome overall, shrinking the total prize pool and awarding prizes to undeserving participants. These results also suggest that eliminating the possibility to lobby may reduce the effectiveness of bribes. Note, however, that the results pertaining to how bribery and lobbying influence each other are based on smaller sample sizes and should therefore be interpreted with caution.
Our results also highlight the importance of studying not just average effects (how many winners), but also distributional effects (who wins). While bribery does not increase the number of undeserving winners, it does shift bonuses away from workers who almost deserved the prize to workers willing to bribe. Our design allows us to capture these distributional effects in ways that could not be done in previous research relying on decisions between monetary allocations and not real effort (e.g., Abbink et al., Reference Abbink, Irlenbusch and Renner2002 and its follow-ups).
Bribes in our setting are less effective than in previous work. Relative to other bribery experiments (see e.g., Abbink & Serra, Reference Abbink, Serra, Serra and Wantchekon2012 for a review), the inclusion of a real effort judgment task may have made referees more reluctant to reciprocate a bribe. As in these papers, reciprocating a bribe generates a negative externality and an efficiency loss. But unlike in these papers, reciprocity also comes with a moral cost of distorting judgment. The relatively low effectiveness of bribery in our experiment is therefore consistent with a substantial moral cost of distorting judgment.
Future research could build upon our design by investigating the impact of bribery and lobbying in other environments. It would be interesting to examine whether bribes are more effective when they come as a surprise, for example by only informing referees that bribes are possible when a worker has decided to send one. Another interesting question is whether changes in the monitoring technology and wages of the referees as well as other types of interventions could reduce the effectiveness of bribery and lobbying. This also includes interventions that explicitly target the referee’s moral cost of distorting judgment (Gneezy et al., Reference Gneezy, Saccardo and van Veldhuizen2019) and whether such interventions reduce (by increasing moral cost) or enhance (by giving workers more scope for persuasion) the effectiveness of lobbying.
Supplementary material
The supplementary material for this article can be found at https://doi.org/10.1017/eec.2024.5.
Acknowledgements
We thank Steve Berggreen-Clausen, Katharina Laske, Elin Molin, Petra Thiemann, and seminar participants at numerous universities for comments, and Austin Henderson for excellent research assistance. This research was conducted under IRB#110022 from University of California San Diego. Roel van Veldhuizen gratefully acknowledges financial support from the Leibniz SAW project MADEP and the Jan Wallander och Tom Hedelius foundation. The replication material for this study is available at https://doi.org/10.17605/OSF.IO/RCJU4.
Competing interests
The authors declare that they have no relevant or material financial interests that relate to the research described in this paper.


 Open access