


1. Introduction
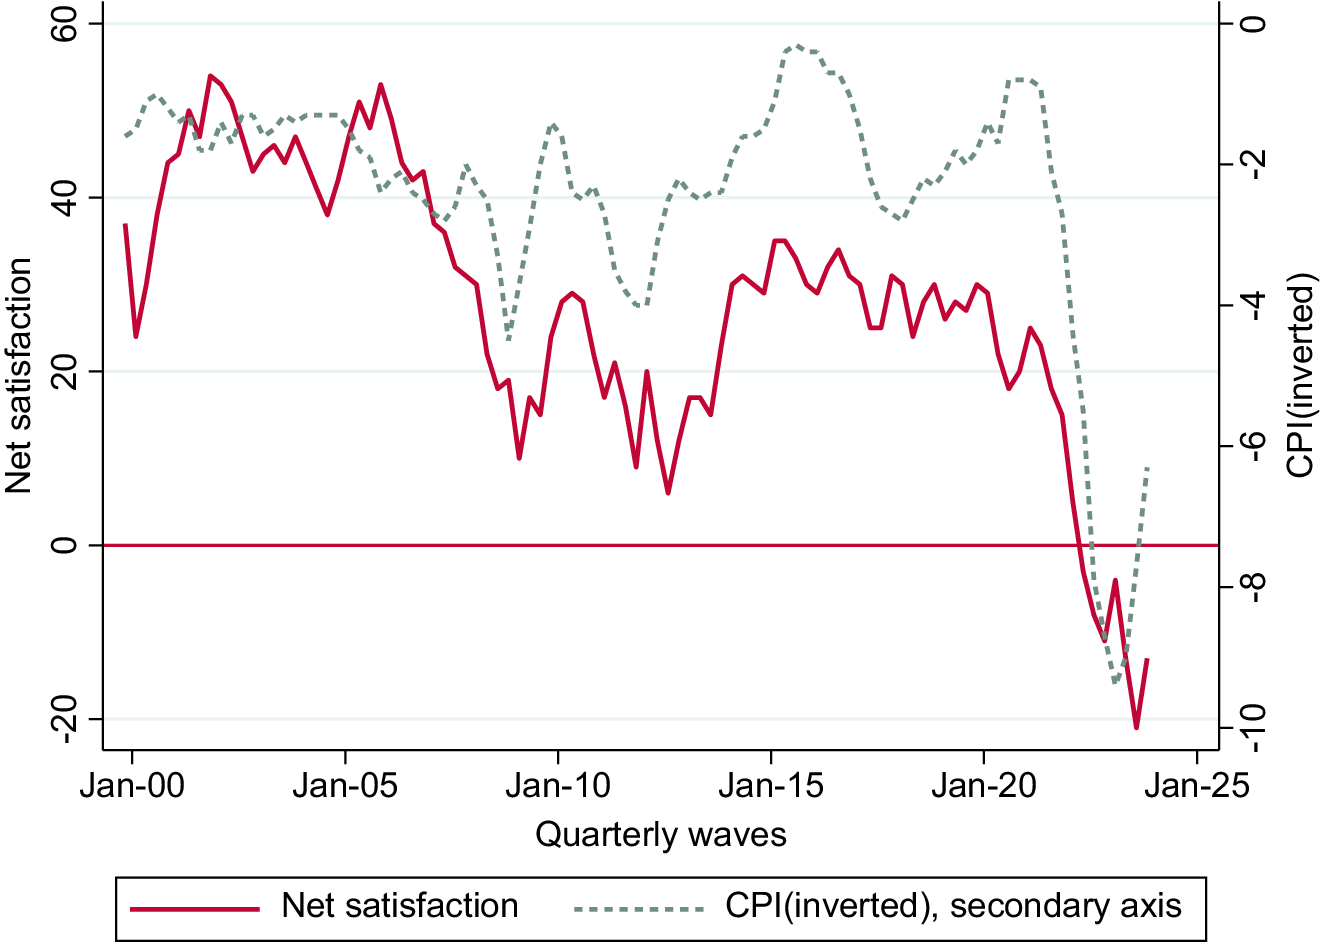
In tandem with increasing inflation, public confidence in the Bank England dropped dramatically. While the net satisfaction with the BankFootnote 1 averaged 23.9% points between 2009 and 2021, it became negative in the second quarter of 2022. The British public manifested the lowest historical levels of confidence in August 2023, contrasting with improvements in inflation control in the months before the survey, and it seems to have “reacted” slowly to improvements in inflation performance (see Figure 1).
Net satisfaction balance and CPI (inverted). Quarterly data.
Sources: Garriga (Reference Garriga2023), updated with data from Bank of England/Ipsos Inflation Attitudes survey (https://www.bankofengland.co.uk/inflation-attitudes-survey/2023/november-2023) and ONS Data.
Why does satisfaction with the Bank of England matter? Satisfaction with the Bank’s performance is important because it is a key determinant of public confidence or trust in the institution. Many argue that trust is a rational assessment of the performance of a political institution (Hudson, Reference Hudson2006). Therefore, “institutions that perform well generate trust; untrustworthy institutions generate scepticism and distrust” (Mishler and Rose, Reference Mishler and Rose2001, p. 31).
In the case of central banks, two additional factors further complicate this relationship between performance and trust. First, for monetary policy to be effective, central banks need to anchor inflation expectations (Blinder et al., Reference Blinder, Ehrmann, Fratzscher, De Haan and Jansen2008; Christelis et al., Reference Christelis, Georgarakos, Jappelli and van Roij2020; Coibion et al., Reference Coibion, Gorodnichenko, Kumar and Pedemonte2020; De Haan and Sturm, Reference De Haan and Sturm2019). Therefore, lack of trust may undermine the central bank’s performance. Second, poor(er) performance and low public confidence undermine central banks’ “output” legitimacy (Baerg and Cross, Reference Baerg and Cross2022; Burgoon et al., Reference Burgoon, Demetriades and Underhill2012). This exposes the Bank to public or political pressures that can potentially challenge their independence (Binder, Reference Binder2021a, Reference Binder2021b; Bodea and Garriga, Reference Bodea and Garriga2023; Goodhart and Lastra, Reference Goodhart and Lastra2018).
Acknowledging the rational roots of trust in institutions does not deny the likely influence of other historic or cultural factors on trust (Angino et al., Reference Angino, Ferrara and Secola2022). It does not imply that trust perfectly maps satisfaction either. However, for the purposes of this article, satisfaction is considered a proxy for public confidence in the Bank of England, as is normally used in the press and communications to broader audiencesFootnote 2—holding other factors constant.
The importance of public confidence for the Bank of England’s own operations and legitimacy justifies a closer look at the correlates of satisfaction with the Bank—or trust on the Bank’s ability to fulfil one of its main mandates, price stability. The aim of this article is to provide a detailed description of the individual characteristics that are associated with higher trust or public confidence in the Bank of England, using data from the Inflation Attitudes survey (2001–2023) on satisfaction with the Bank’s performance.Footnote 3 Although the use of observational data limits the ability of making causal claims, it allows us to look at persistent trends and to identify eventual changes through time. Therefore, the second goal of this article is to explore eventual shifts in the correlates of trust in the aftermath of the Global Financial Crisis, and during the period of inflation surge.
The rest of this article proceeds as follows. The next section describes the data and methods used. Section 3 presents the findings for the correlates of satisfaction and lack of opinion on the Bank of England, and examines these correlates in different time periods. The last section discusses the findings and proposes avenues for future research.
2. Data and methods
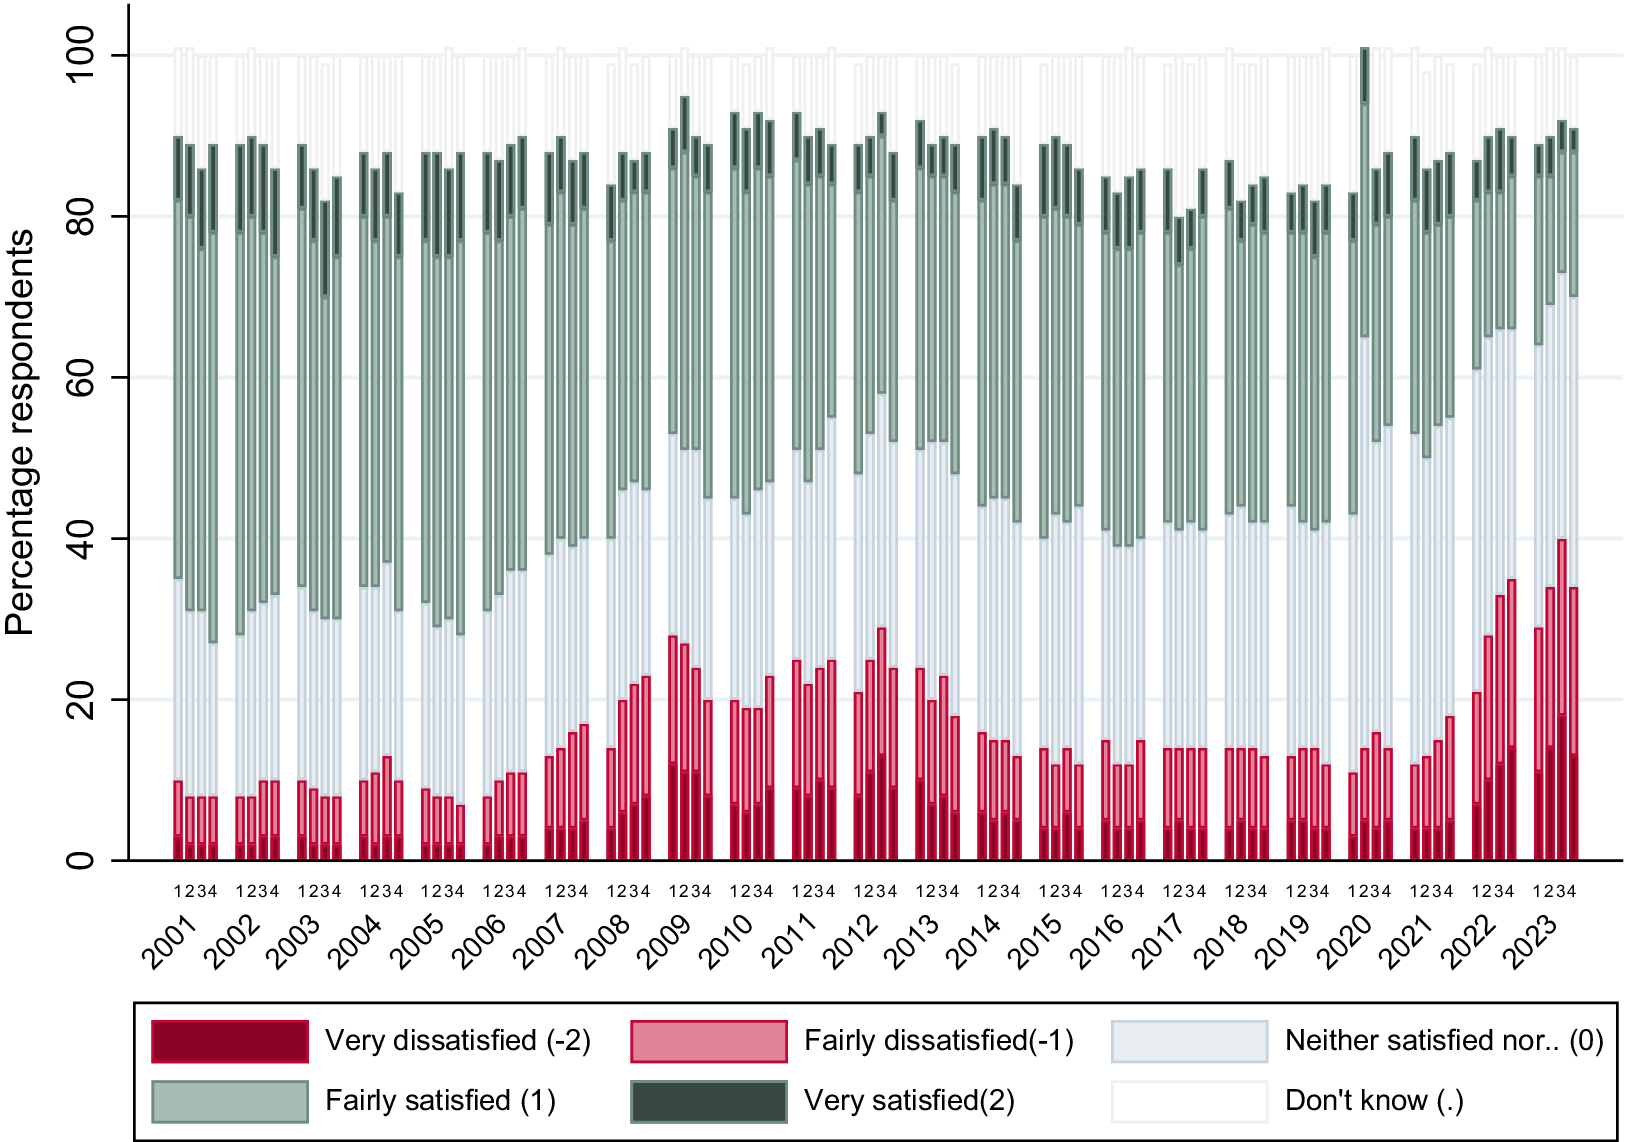
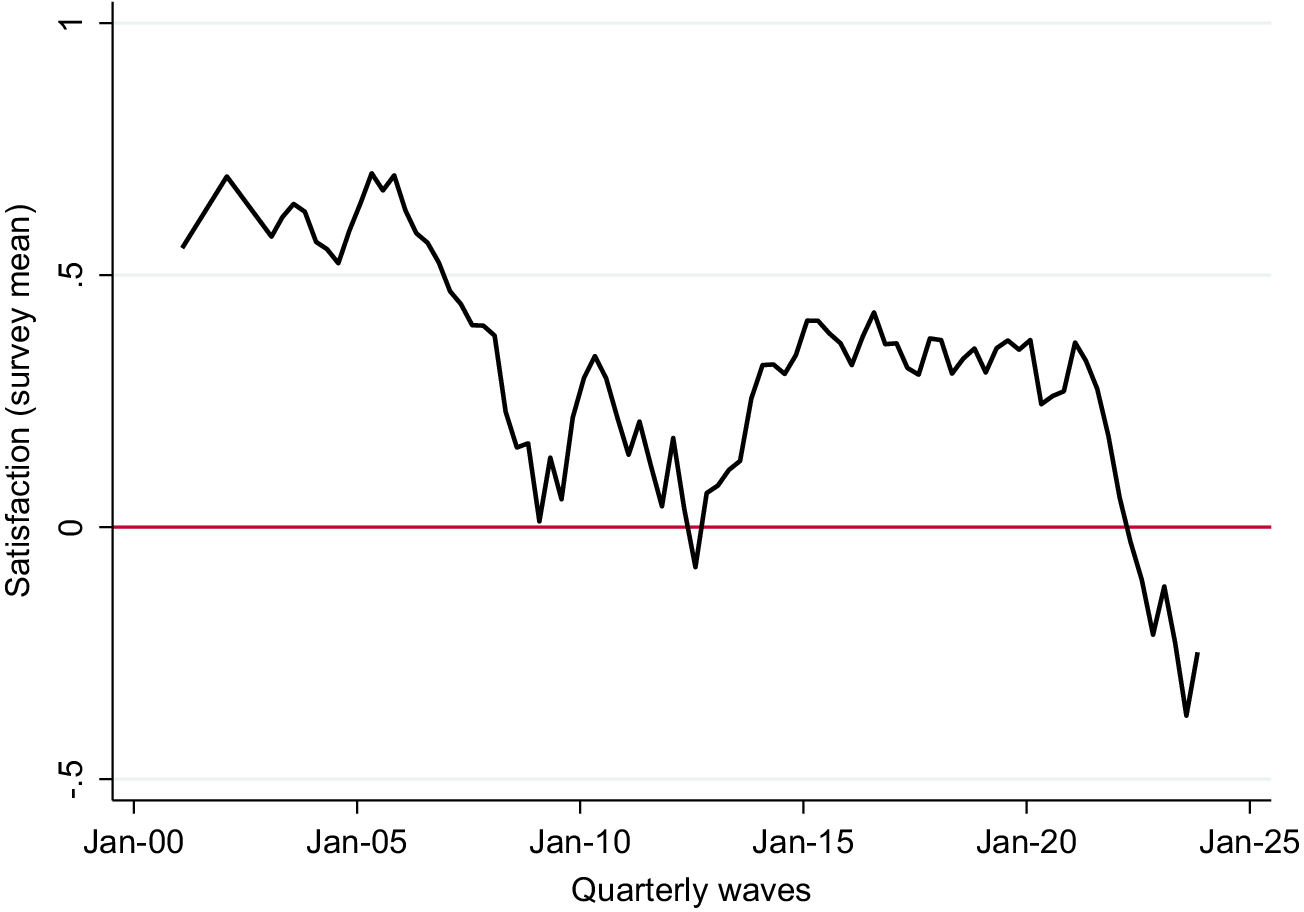
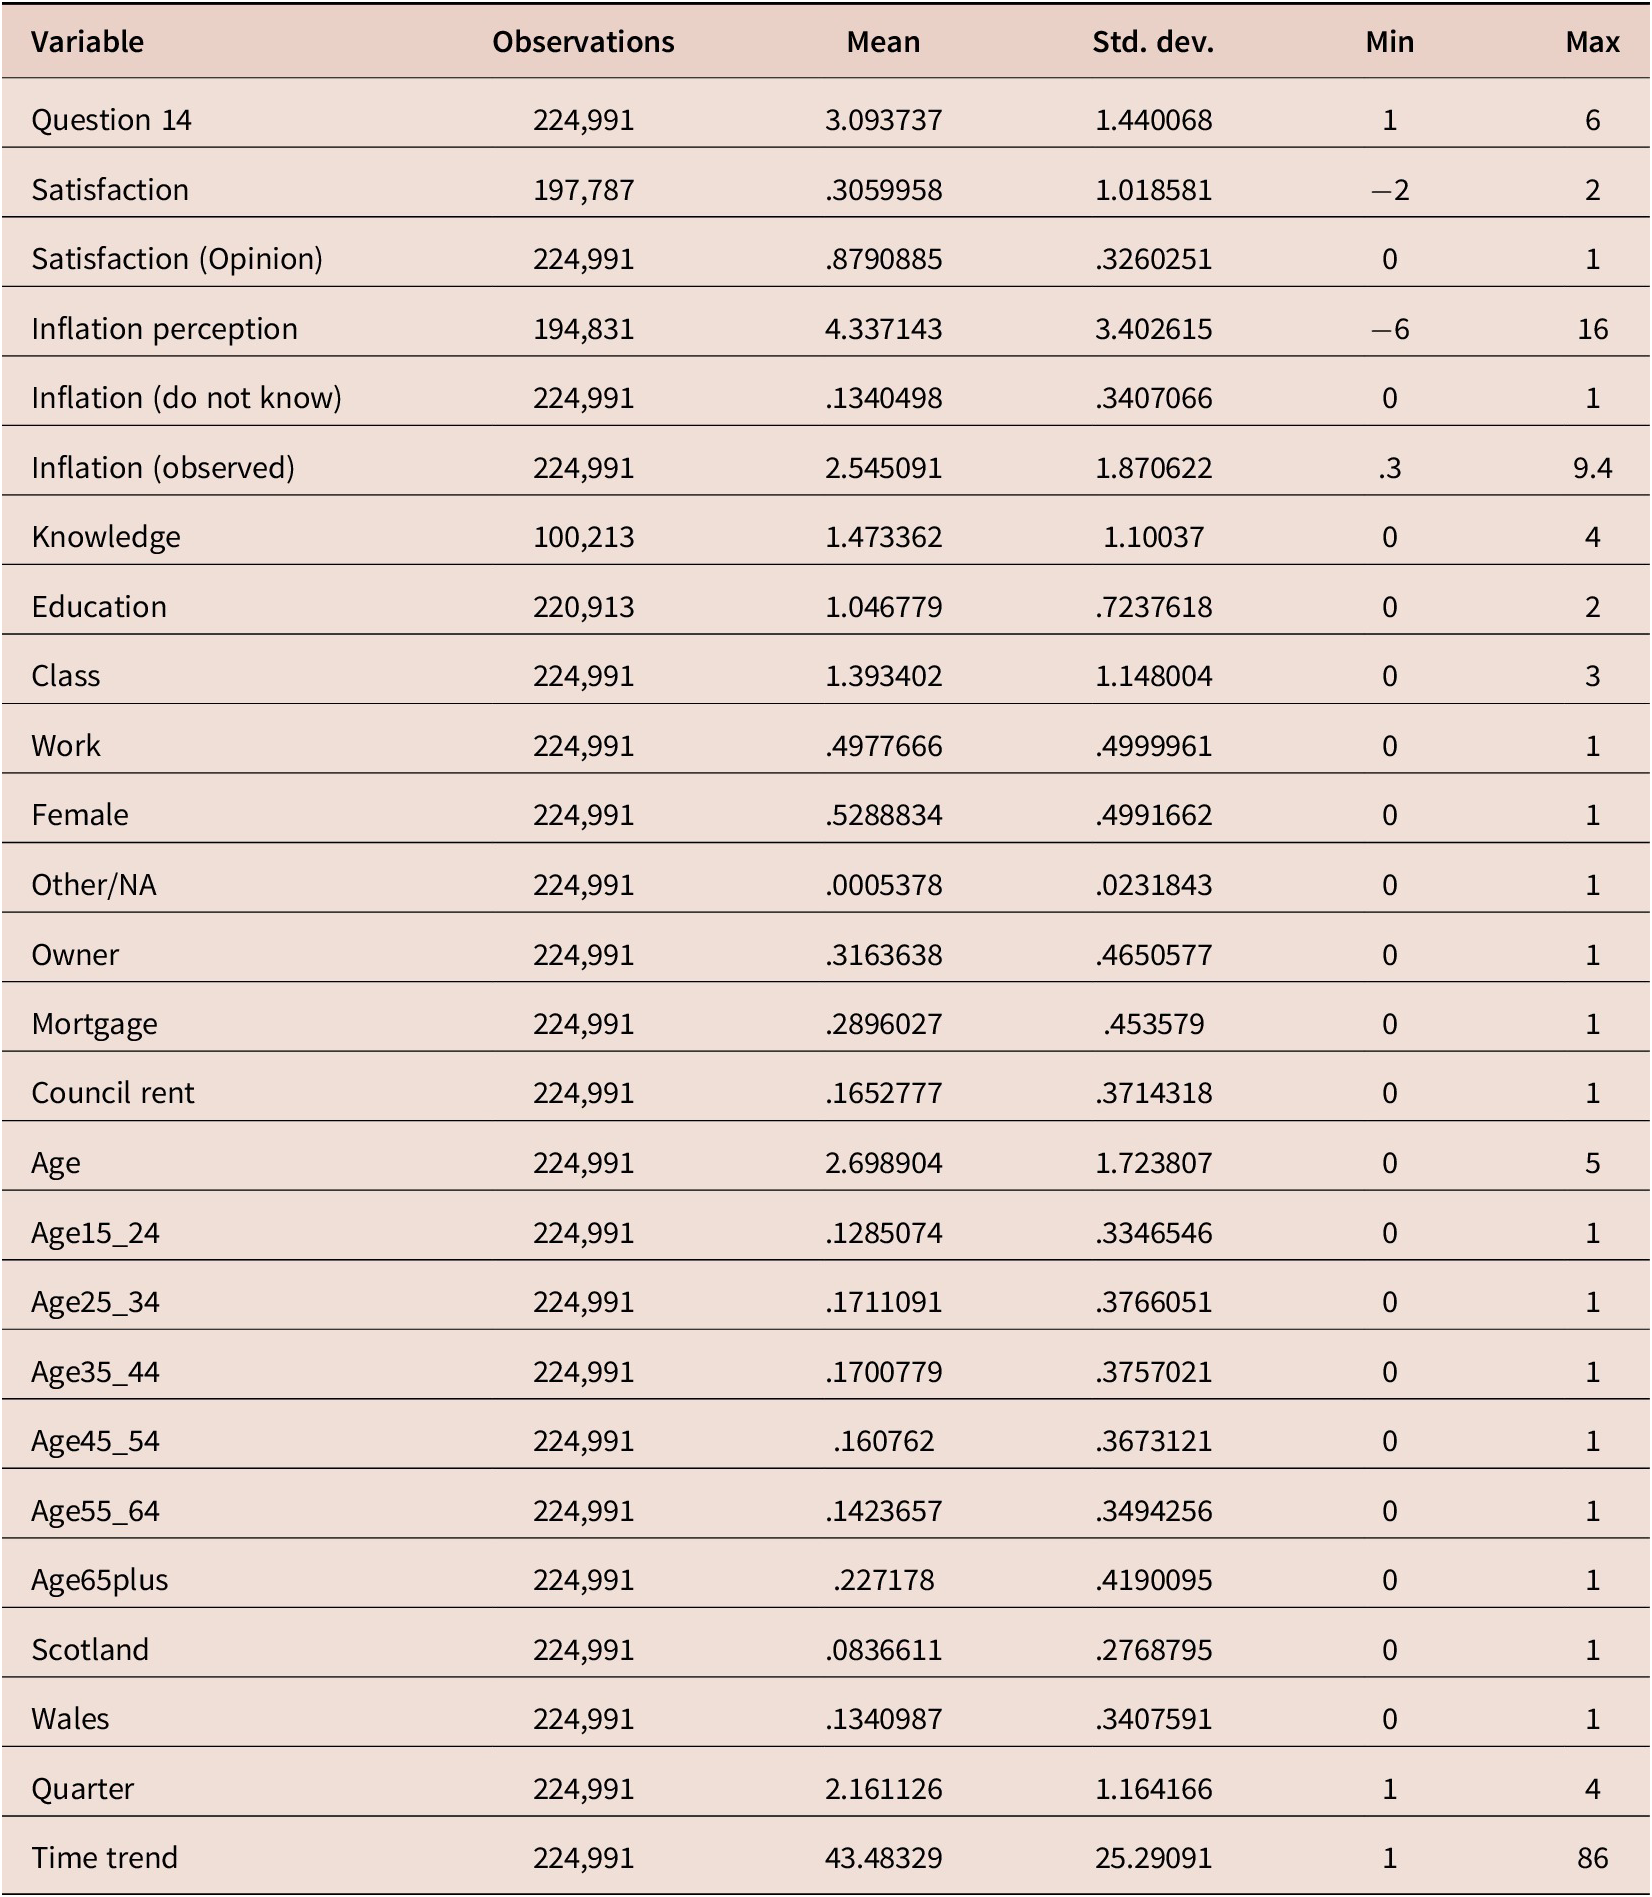
For this article, I use data from the Bank of England’s quarterly Inflation Attitudes survey (2001–2023),Footnote 4 on a quota sample of people aged 16–75 across the United Kingdom. The dependent variable is Satisfaction with the Bank of England, an ordered index measured with the answers to the question “Overall, how satisfied or dissatisfied are you with the way the Bank of England is doing its job to set interest rates in order to control inflation?” This variable ranges from −2 (very dissatisfied) to 2 (very satisfied).Footnote 5 The mean for this variable in the full sample is 0.31, and the median is 0. Although the full sample includes 224,991 responses for most questions, only 194,831 respondents answered the question about satisfaction. Further analyses look at the characteristics of those who answered “Don’t know” to this question. In those models, the variable Opinion is coded 1 if the respondent expressed an opinion about the Bank’s performance, and 0 otherwise. Figure 2 shows the distribution of this variable through time, and Figure 3 plots the mean values, omitting the “do not know” responses. Although net satisfaction became negative for the first time in the second quarter of 2022, the sample mean satisfaction was also negative in the third quarter of 2012.
Distribution of variable Satisfaction, per quarterly wave.
Note: Responses to “Overall, how satisfied or dissatisfied are you with the way the Bank of England is doing its job to set interest rates in order to control inflation?”
Mean value of variable Satisfaction, per quarterly wave.
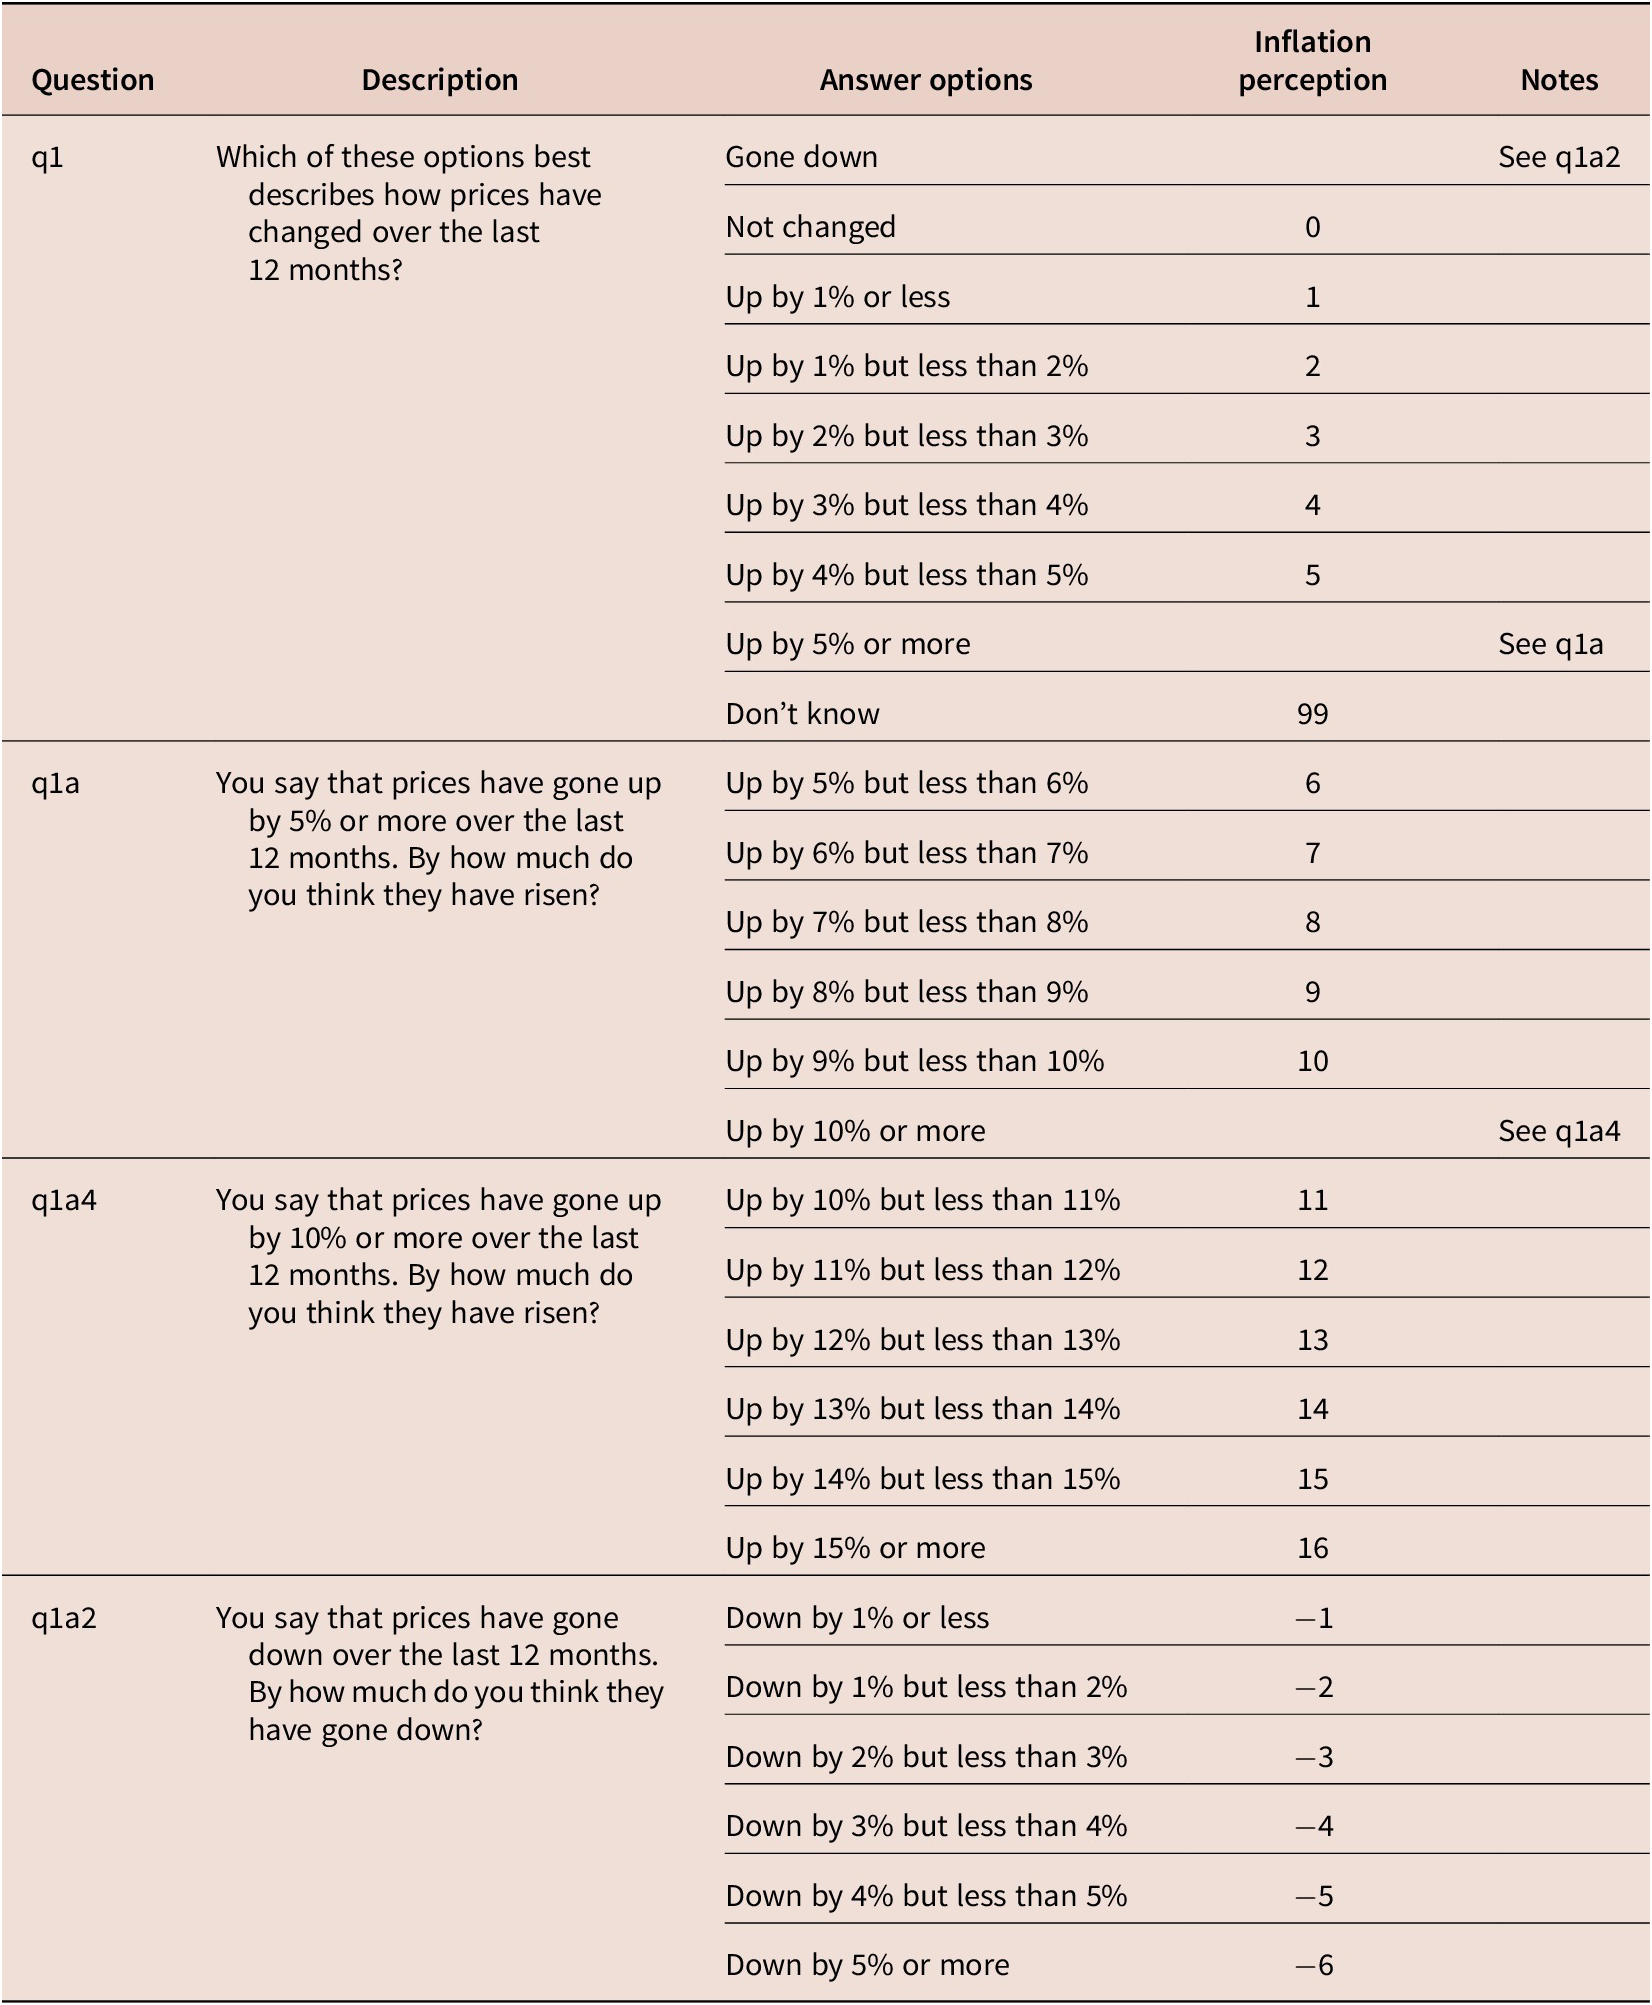
Unless specified otherwise, most independent variables are directly taken from the answers to the survey with the following exceptions. Inflation perception is coded by combining the answers to the questions phrased as “Which of these options best describes how prices have changed over the last 12 months?” The options for the answer are discrete numbers, with 1% point interval increases and decreases (see Table A2.1 in the appendix). A caveat for this variable is that respondents do not have the choice to estimate a number below −5% or above 16%, which constrains their answers. Because 13% of respondents answered “No idea” when asked about inflation in the past 12 months, a variable Inflation perception (no idea) is coded 1 for these responses, and 0 otherwise.
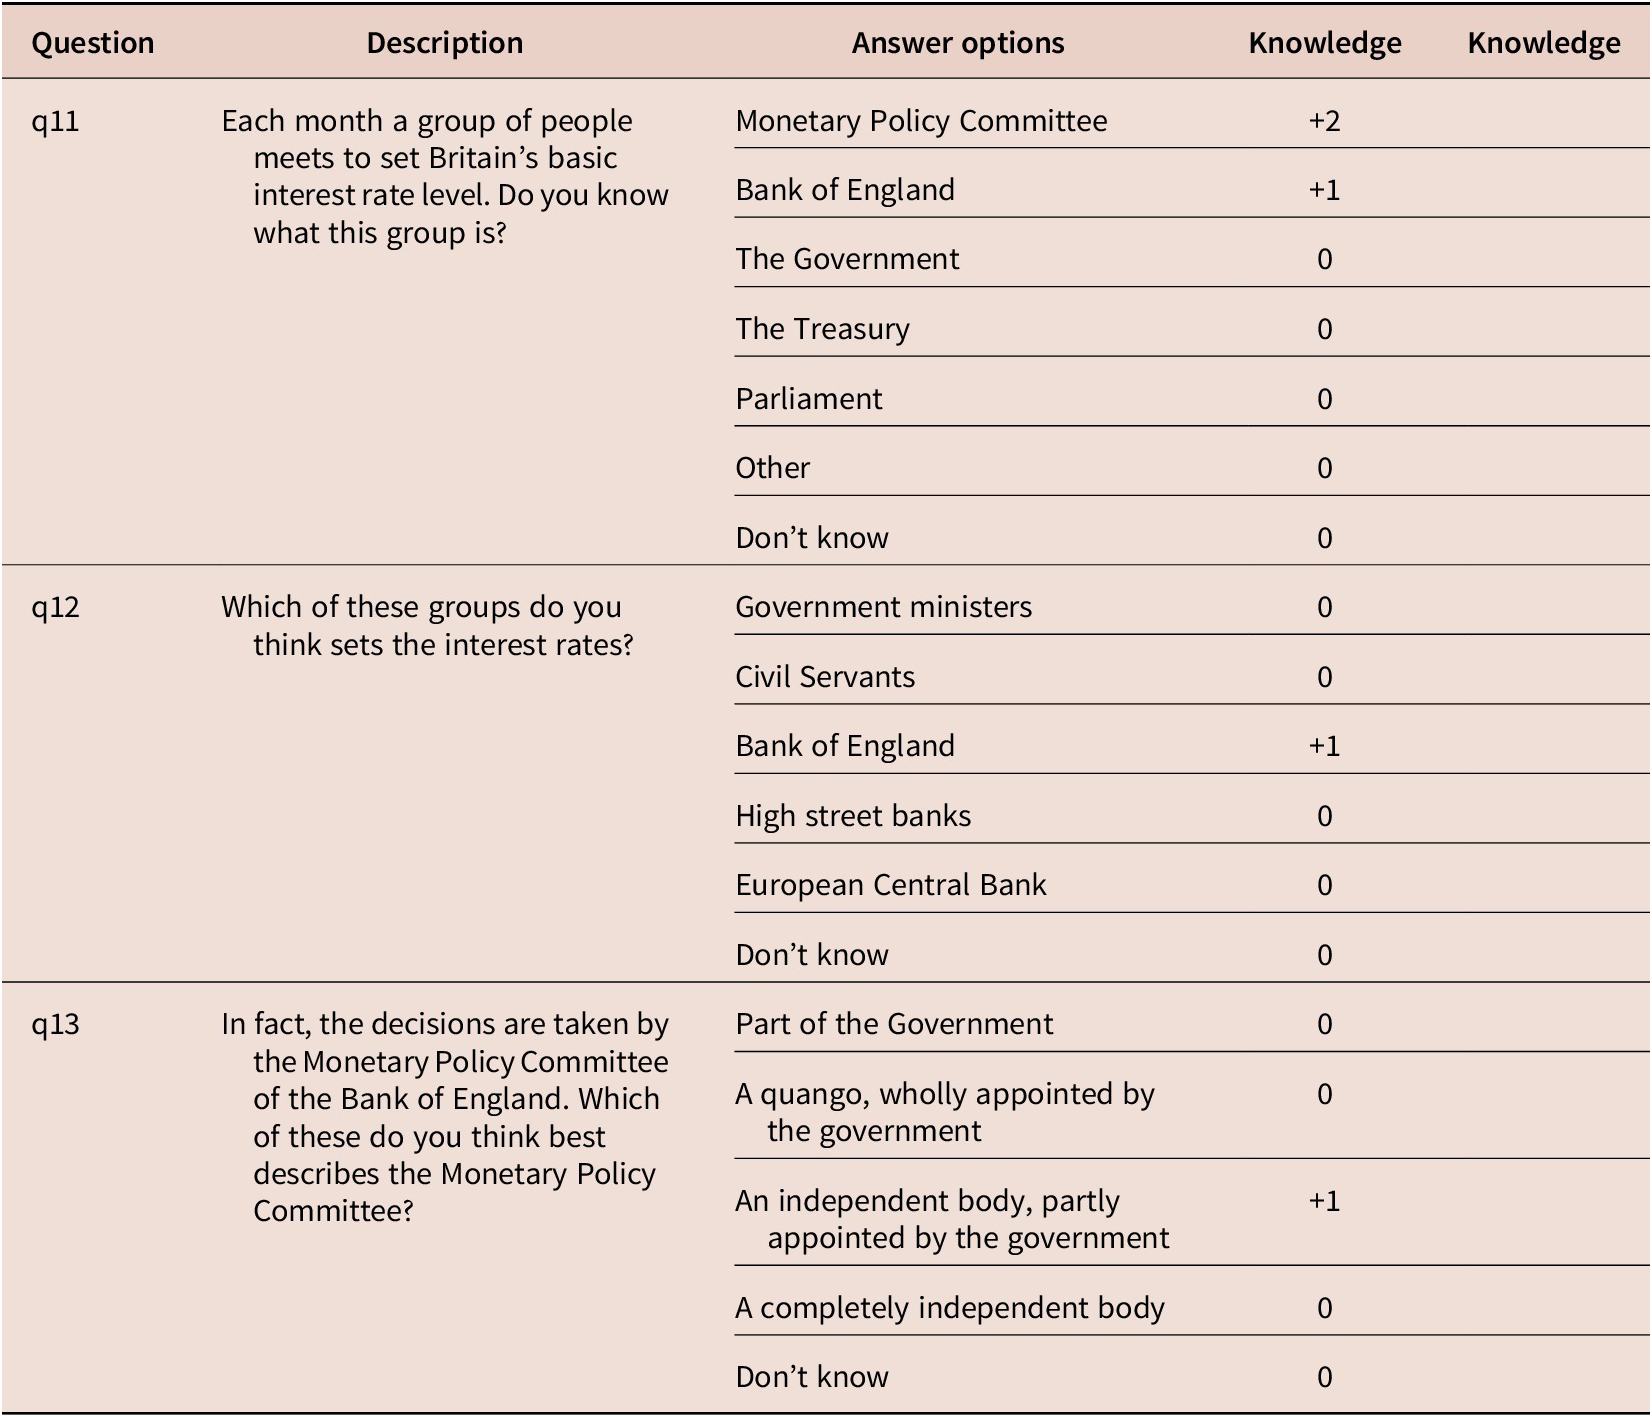
The variable Knowledge about the Bank is an additive index of the correct answers to questions regarding who sets the interest rate, including the independence of the Monetary Policy Committee from the government (see Table A2.2 for coding). A caveat regarding the Knowledge variable: the questions used to build this variable were only asked in the first quarter of each year. Therefore, models including this variable are estimated using responses obtained in the first survey each year.
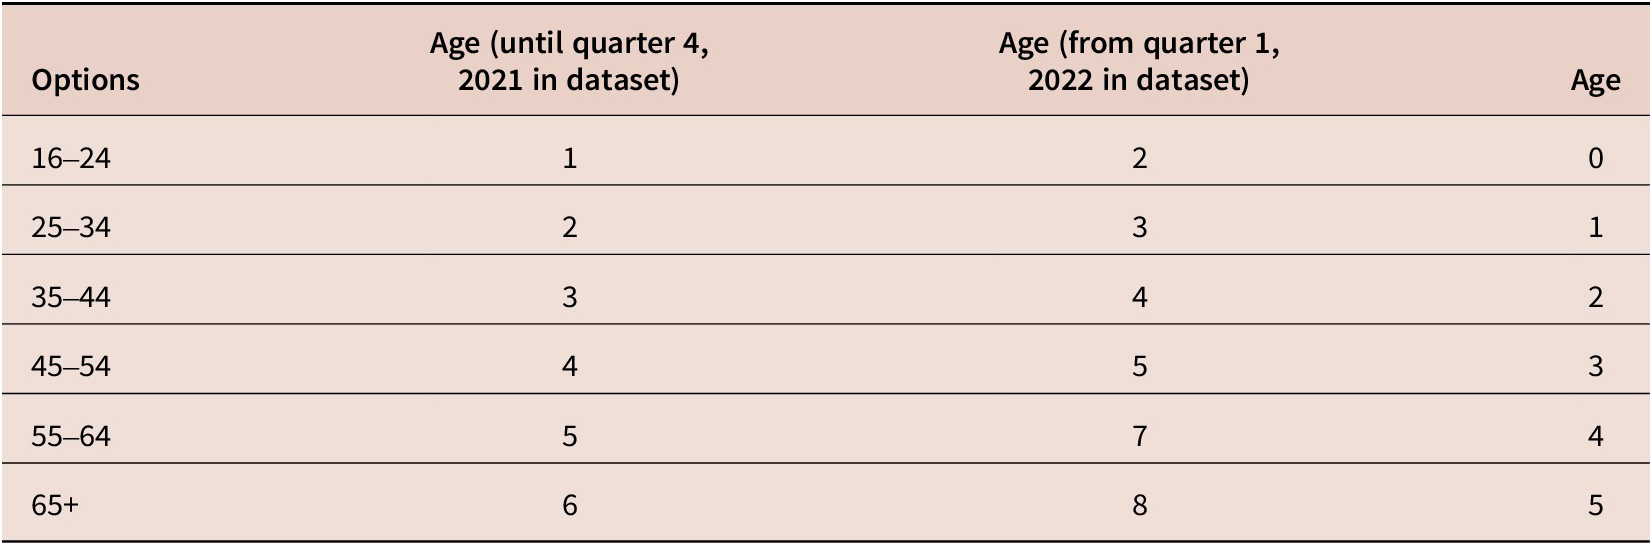
The variable Sex in the survey has four options for gender identification (male, female, in another way, prefer not to answer). I recoded the last two options (included in surveys since February 2022) as Other/NA. Age, coded in the survey as a discrete variable in 10-year groups from 15–24 years to 65 and up, is recoded as a series of dichotomous variables for the first set of models, and included as a 0–5 variable in other specifications.Footnote 6 Class ranges from 0 to 3 (3 = AB, 2 = C1, 1 = C2, 0 = DE). Working indicates whether the respondent is working full of part-time, and 0 otherwise. Education is a categorical variable ranging from 0 (low, GCSE), to 2 (high, degree). The survey identifies the respondents’ housing tenure. These data have been recoded as a series of dichotomous variables identifying outright owners (Owner), mortgage holders (Mortgage), renting from the council (Council rent) and “other”—people letting or living in other people’s houses— as 1, and 0 otherwise. Inflation (observed) is the last 12-month inflation recorded in the quarter of the survey, and comes from the ONS. Appendix 3 shows the descriptive statistics for the full sample and for the first quarter-only sample, and the correlation matrix.
The data series need to be compared with caution because of a shift to online surveys in May 2020.Footnote 7 The use of wave-fixed effects and re-estimation of analyses in subsamples may help dealing with this issue. Unless otherwise specified, linear regression models are estimated in Stata using the svy prefix for complex survey data, using the weights stated in the data to make the sample UK representative, and including wave (year-quarter) fixed effects.
3. Findings
3.1 The correlates of public confidence in the Bank of England
3.1.1 Actual and perceived inflation
Table 1 shows the correlates of trust in the Bank of England using responses from the first quarter of each year. The first column includes the measures of observed inflation. Column (2) includes the respondent’s perceived inflation—observed inflation is highly correlated with perception (0.44), so they are not included together. Column (3) includes all measures of inflation—despite the correlation between two of the inflation variables—to show that the association between inflation perception and satisfaction is independent from the actual level of inflation.
Correlates of Satisfaction and having an opinion on the Bank of England’s performance
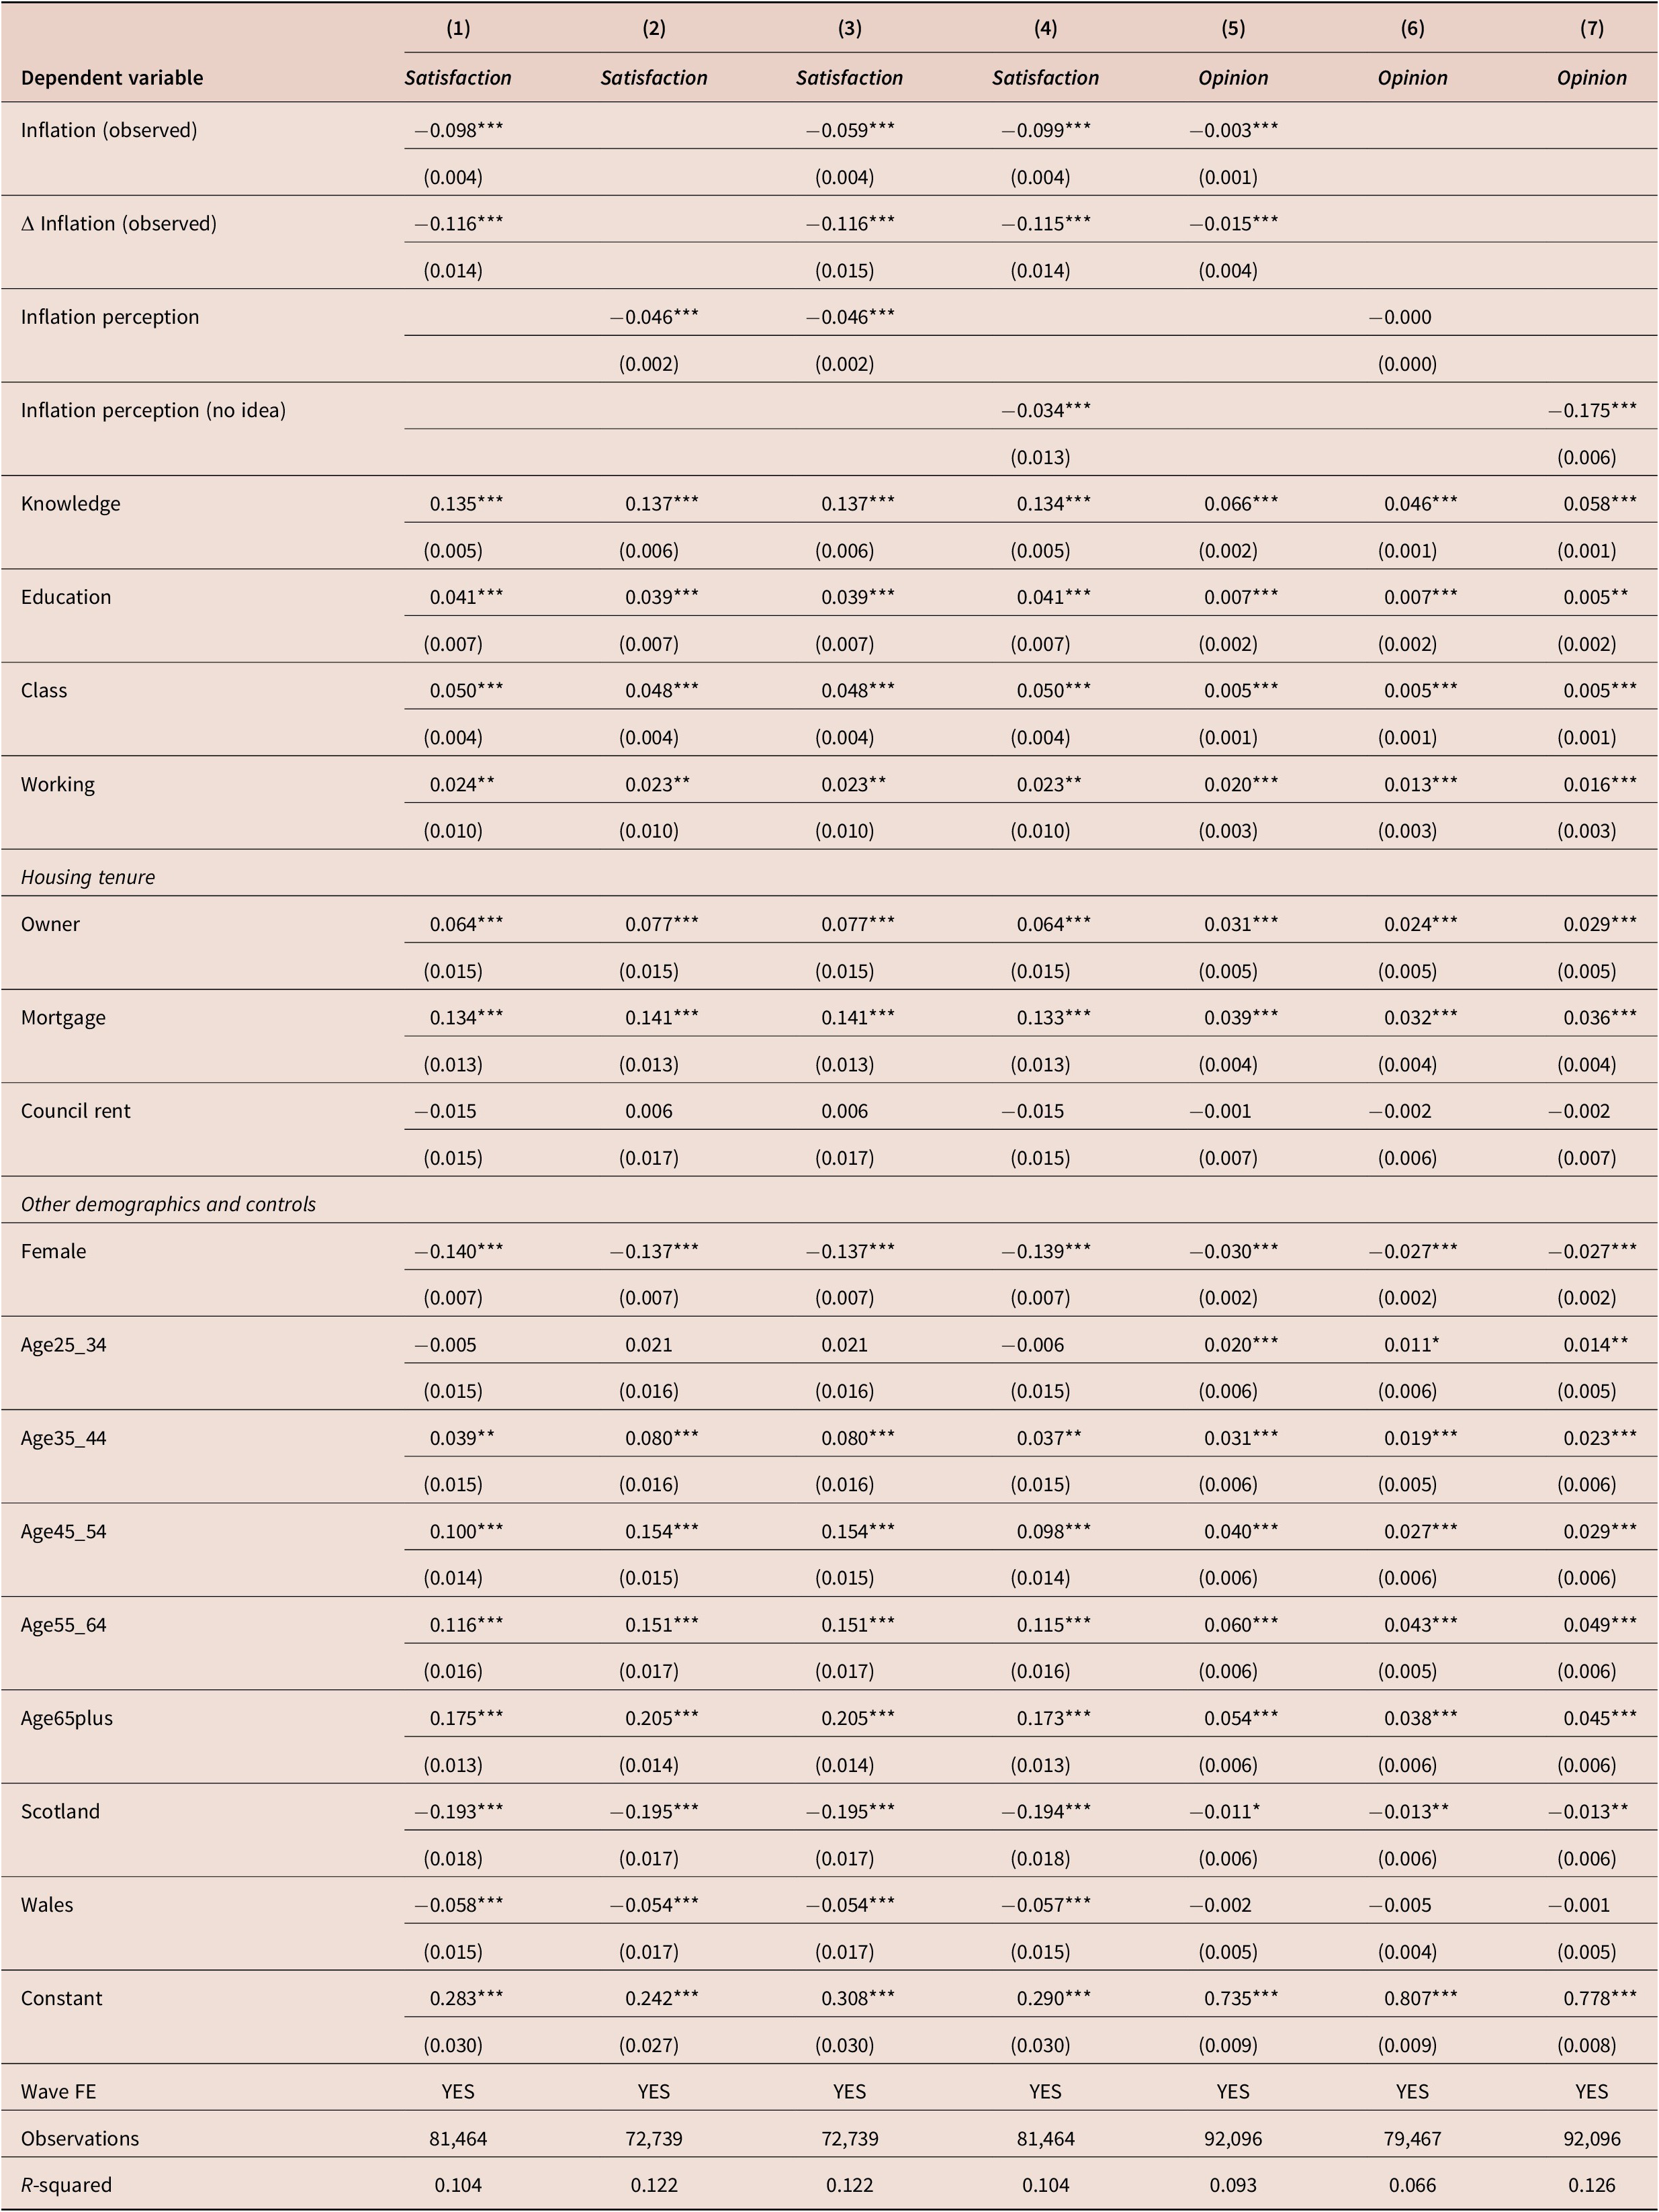
Notes: Standard errors in parentheses. Statistical significance indicated as follows: *** p < 0.01, ** p < 0.05, * p < 0.1.
As one might expect, higher levels of CPI inflation are associated with lower satisfaction with the work of the Bank. Substantively, a standard deviation increase in Inflation (observed) is associated with a 0.24 standard deviation decrease in Satisfaction. This effect is smaller than what the data in Figure 1 would suggest. Holding inflation constant, quarterly increases in CPI inflation are associated with further decreases in Satisfaction. However, the substantive magnitude of this effect is very small (7% of a standard deviation in the dependent variable).
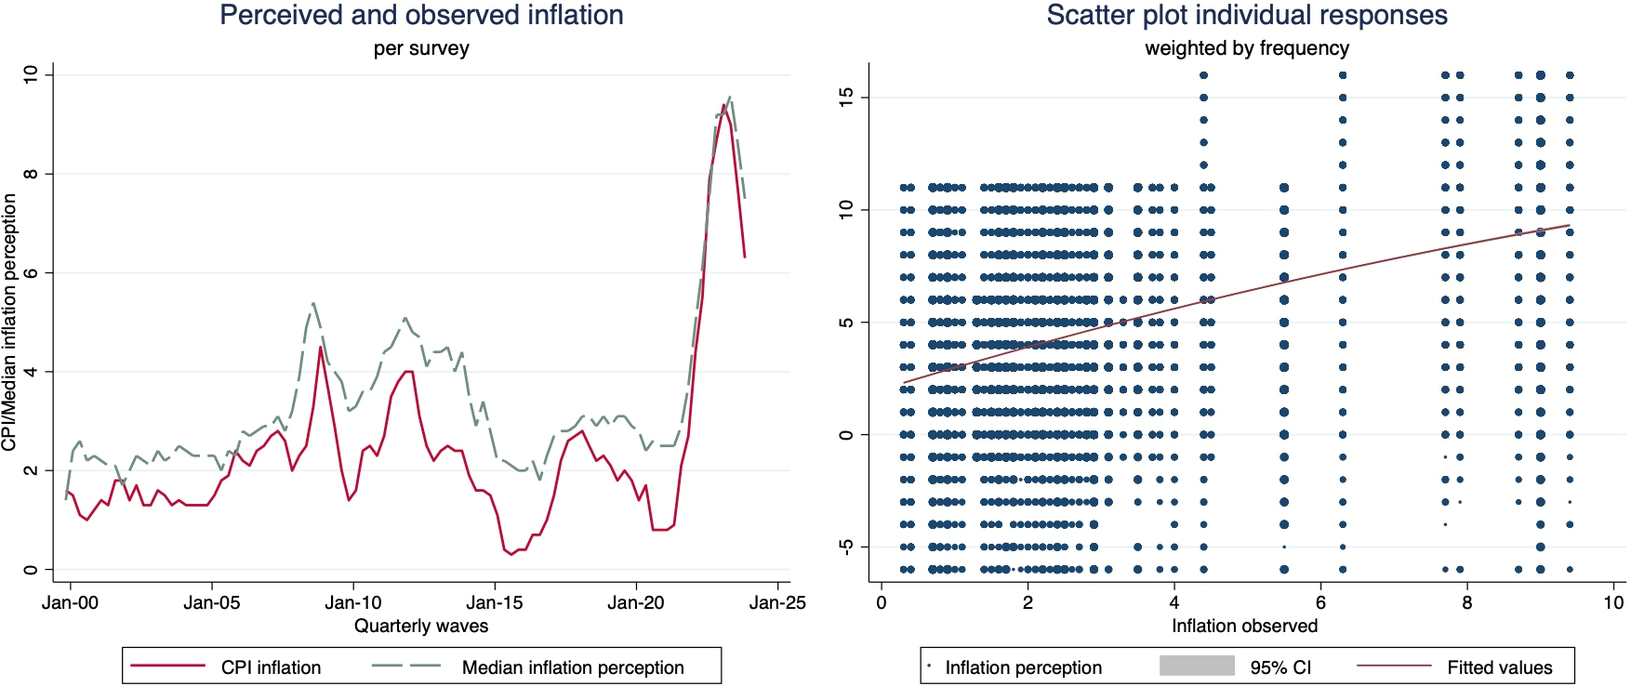
Column (2) focuses on the perceived inflation, which is likely to be relevant for individuals’ assessment of the Bank’s performance. Although perception of inflation is highly correlated with actual inflation, the correlation is far from perfect,Footnote 8 non-linear, and the respondents tend to overestimate inflation. As Figure 4 (left-side panel) shows, the mean perceived inflation maps quite closely actual CPI inflation. The right-side panel shows that variance at the individual level is important. Unsurprisingly, higher perceived inflation in the past 12 months is associated with lower levels of satisfaction. Substantively, a standard deviation increase in Inflation perception is associated with a 0.149 standard deviation in Satisfaction. The magnitude of this coefficient does not change if additional controls for observed inflation and inflation change are included in the model (see column (3)). In contrast, the coefficient associated with observed inflation is smaller once Inflation perception is included in the model.
CPI and perceived inflation at the aggregate (per survey), and individual levels.
Given that 11% of the individuals who manifested an opinion on the Bank’s performance responded “No idea” when asked about inflation in the past 12 months, I re-estimate model (3) replacing the variable Inflation perception that ranges between −6 and 16, for a dichotomous variable indicating whether the respondent had no idea regarding inflation in the past year. The coefficient in column (4) indicates that individuals who report no idea about inflation express lower levels of satisfaction with the Bank. The magnitude of this effect, however, is quite small.
3.1.2 Knowledge about the Bank and education
As found in other studies, there is a positive relationship between trust and knowledge about the Bank of England (Dräger and Nghiem, Reference Dräger and Nghiem2023; Haldane and McMahon, Reference Haldane and McMahon2018; Hayo and Neuenkirch, Reference Hayo and Neuenkirch2014; van der Cruijsen and Samarina, Reference Van der Cruijsen and Samarina2023). The magnitude of this association is substantively large: a standard deviation increase in Knowledge is associated with a 0.151 standard deviation increase in Satisfaction. This effect is marginally larger than the one associated with Inflation perception. This association is surprisingly strong given that these models control for education, which is also positively associated with Satisfaction, but it is not highly correlated with Knowledge (the correlation between Knowledge and Education is 0.21). This finding needs to be read in the light of generally low levels of financial literacy (Van der Cruijsen et al., Reference Van der Cruijsen, Jansen and De Haan2018), and a recent literature indicating that knowledge about the (European) central bank’s policy instruments affect inflation expectations but not trust (Brouwer and de Haan, Reference Brouwer and de Haan2022). Although the surveys reveal a significant association between knowledge and trust even controlling for inflation, these data do not allow to assert causality.
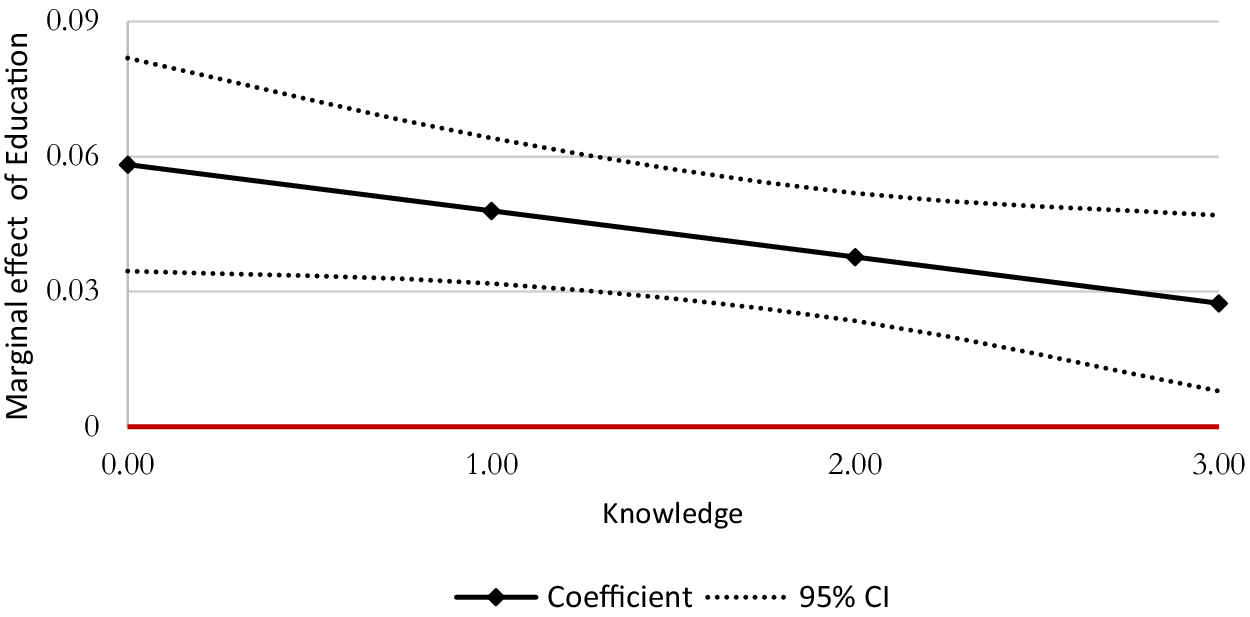
More educated individuals (measured as a three-category variable of schooling) tend to express higher satisfaction, as in other studies (van der Cruijsen and Samarina, Reference Van der Cruijsen and Samarina2023). The substantive effect of Education however is quite small (a standard deviation of Education is associated with 0.03 standard deviation in Satisfaction). Not only the association between Education and Satisfaction is weak, but it also becomes weaker at higher levels of knowledge about the Bank of England (see Figure 5).
Association between Education and Satisfaction at different levels of knowledge about the Bank of England.
Note: These estimates come from re-estimating column 2, including an interaction between Education and Knowledge. Models not reported for space considerations.
3.1.3 Other correlates
Several socio-economic indicators are also associated with Satisfaction. Higher class (AB) respondents express more satisfaction than those classified as C1, C2 or DE. The substantive magnitude of this variable’s association is quite small, but almost doubles the standardised effect of Education. Those working full- or part-time express also more satisfaction with the work of the Bank than those who are not currently employed.
The surveys allow classifying housing tenure as outright owners, mortgage holders, renting from the council and “other”—people letting or living in other people’s houses—which is the baseline category for housing tenure in these models. Holding everything else constant, outright owners and mortgage holders express more satisfaction than other categories of housing tenure. In the whole sample, mortgage holders express more satisfaction with the Bank than outright owners. The difference between Owner and Mortgage is statistically significant, but the difference in satisfaction between the baseline “other” and Council rent is not.
There is a marked gender difference in Satisfaction, as reported for other central banks (Brouwer and de Haan, Reference Brouwer and de Haan2022; Hayo and Neuenkirch, Reference Hayo and Neuenkirch2014; van der Cruijsen and Samarina, Reference Van der Cruijsen and Samarina2023). Male respondents express higher satisfaction than those who identify as female and “other/NA.” There is no statistically significant difference between female and other identifications in reported satisfaction.Footnote 9 Older respondents tend to express higher satisfaction. This is interesting because these estimates control for variables that are normally associated with age (particularly, housing tenure, education and status). In this sample, there are no statistically significant differences between those aged 15–24, and those aged 25–34 years, or among respondents, those aged 45–54, and those aged 55–64 years. In other words, there are four identifiable groups or cohorts with increasing levels of reported satisfaction: 15–34, 35–44, 45–65 and those over 65. Finally, respondents in Wales and Scotland tend to express lower levels of dissatisfaction than those surveyed in England.
3.1.4 Understanding the “Don’t know”
Columns (6) to (9) explore the correlates of having an opinion about the Bank of England’s performance. These models estimate the linear probability of responding to the question on satisfaction with the working of the Bank versus responding “do not know.”Footnote 10
The variables associated with higher trust generally correlate with the likelihood of expressing an opinion. Inflation and changes in inflation are negatively associated with having an opinion on the Bank’s performance—in other words, high inflation is associated with a higher probability of responding “do not know.” Those who know less about the Bank, those who do not have an idea regarding past inflation, less educated and lower-class respondents, younger and female respondents and residents in Scotland are more likely to not have or express an opinion about the Bank’s performance.
There are two differences between the correlates of public confidence and those of the higher likelihood of having an opinion. First, Inflation perception does not correlate with the likelihood of expressing an opinion. Second, Welsh respondents do not have a different likelihood of having an opinion than those surveyed in England.
3.2 Have the correlates of trust changed?
One of the advantages of a series of comparable observational data is the possibility in exploring dynamics in the correlates of satisfaction. Although the models described in the previous section include wave- (effectively, year-) fixed effects, this section explores the hypothesis that both the Global Financial Crisis and the inflation surge may be linked to structural shifts in the correlates of trust.
Figure 6 plots the estimates of a simplified modelFootnote 11 interacting all variables with the period they are observed (full table in Appendix 4). The three periods are defined as before and after the Global Financial crisis (2001–2008, and 2009–2021, respectively), and the 2 years of inflation surge (2022–2023).Footnote 12 Although the comparison of estimates needs to be done with caution, the figure provides interesting information regarding what characteristics may affect trust in the Bank of England in different periods.
Correlates of trust. Different periods.
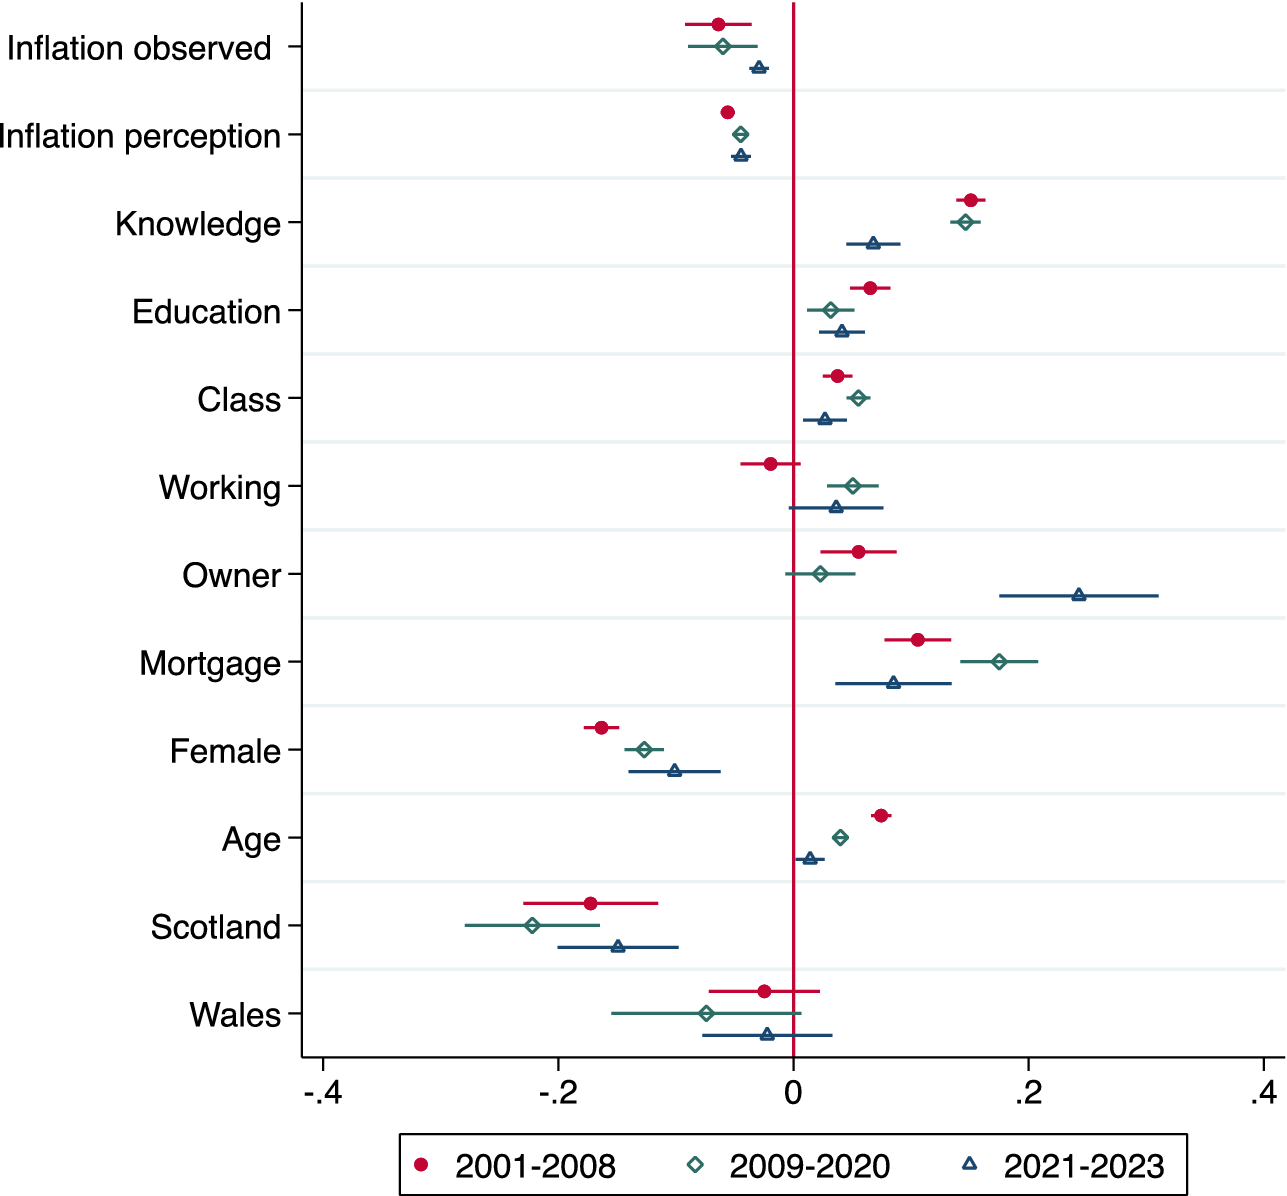
The dichotomous variables for post-GFC (2009–2021) and inflation surge (2022–2023) are negative and statistically significant, reflecting a decline in trust in the Bank of England, as reported for other central banks. Although the coefficient for post-GFC is smaller than the one associated with inflation surge, the difference between them is not statistically significant.
Some correlates do not change across periods. In particular, the coefficients associated with Inflation (observed), Inflation perception, Education, Class, gender, Scotland and Wales are substantively similar across periods.Footnote 13 Although the association between Age and Satisfaction remains positive and significant, it gets substantively weaker through time.
There are a few interesting differences across periods. First, this model suggests that Working is only statistically significant and positive in the post-GFC period. Given how the question is phrased—whether the respondent works part- or full-time—the interpretation of this variable is not straightforward: the baseline category includes both unemployed respondents, people who may not be seeking a job and retirees. These two groups might have been generally negatively affected during the post-GFC, but affected differently during the inflation surge, driving the non-statistically significant difference in satisfaction with those who are working.
There are two additional differences regarding housing tenure and knowledge about the Bank. Across subsamples, outright owners and owners with mortgage generally express more satisfaction than non-owners. During the post-GFC period, however, there is no statistically significant difference between outright owners and non-owners. Not surprisingly, given the effect of higher interest rates on mortgage holders, satisfaction for this group dropped significantly during the inflation surge to the pre-GFC levels. Although the mean level of satisfaction among owners did not increase in the past years, the difference between these respondents and those who report other forms of housing tenure became much larger in the last period—in other words, this result is driven by a large drop in satisfaction in the baseline category (non-owners).
Finally, the association between Knowledge and Satisfaction is weaker during the inflation surge, about half the magnitude of the coefficient for previous periods, and this difference is statistically significant. This is remarkable because the analyses on the full sample show that knowledge about the Bank was substantively the strongest predictor of trust. Because this association between knowledge about the central bank and trust has motivated research on how central bank communications could be used to enhance trust in the institution, further research should determine whether this result is due to less variance in knowledge among respondents through, or whether the questions used to measure knowledge are becoming less useful to proxy knowledge about the Bank of England.
4. Final remarks
Since the Global Financial Crisis, trust in central banks has declined across countries (Roth et al., Reference Roth, Gros and Nowak-Lehmann2014). Although this decline in confidence mirrors a more general decline in trust in political institutions (Foster and Frieden, Reference Foster and Frieden2017; Levi and Stoker, Reference Levi and Stoker2000), public confidence is not only a result of the performance of central banks, but key for central banks to fulfil their mission via anchoring inflation expectations, and to justify their own autonomous decision-making. The analyses presented here show that public sentiment with the Bank of England depends in part on the Bank’s actual performance—the level of inflation is associated with satisfaction with the Bank—but objective performance and perception of this performance explain about a quarter of the variance in public confidence.
One of the key factors associated with trust in the Bank is knowledge about the institution. This finding, consistent with the literature (Dräger and Nghiem, Reference Dräger and Nghiem2023; Haldane and McMahon, Reference Haldane and McMahon2018; Hayo and Neuenkirch, Reference Hayo and Neuenkirch2014; van der Cruijsen and Samarina, Reference Van der Cruijsen and Samarina2023), has driven interest on improving our understanding on the effects of financial literacy and central bank communications on public opinion both among academics and practitioners. Central banks have tried to improve their communication and engagement with different audiences. For example, research shows that simpler, more engaging communications improve public understanding, which can enhance the effectiveness of monetary policy (Haldane and McMahon, Reference Haldane and McMahon2018). However, the association between knowledge and trust seems to be weaker during the inflation surge, and this does not seem to be a result of a significant increase of financial literacy in the population that would make improvements in specific knowledge about the Bank less significant. Further research should explore whether some kinds of information—or even, some sources of information—mediate the effect of knowledge on satisfaction with, and potentially trust in, the Bank of England.
Other data in this article suggest that beyond being clearer in their communications, the Bank of England could target communication to individuals that are more likely to express little trust in the Bank. Further research could explore the effect of targeting communications to women and younger citizens. Some work already shows gendered differences in who presents the information (Bisbee et al., Reference Bisbee, Fraccaroli and Kern2024; Bodea et al., Reference Bodea, Ferrara, Kerner and Sattler2021; Bodea and Kerner, Reference Bodea and Kerner2022a, Reference Bodea and Kerner2022b), but I am unaware of work exploring communications content or styles targeting younger cohorts of citizens.
Finally, although not addressed in this article, it seems likely that the relationship between trust, inflation perception and knowledge is far more complex. Indeed, financial literacy and trust are likely to affect inflation perceptions and expectations (Christelis et al., Reference Christelis, Georgarakos, Jappelli and van Roij2020). This is another avenue for future research that exceeds the purposes of this study.
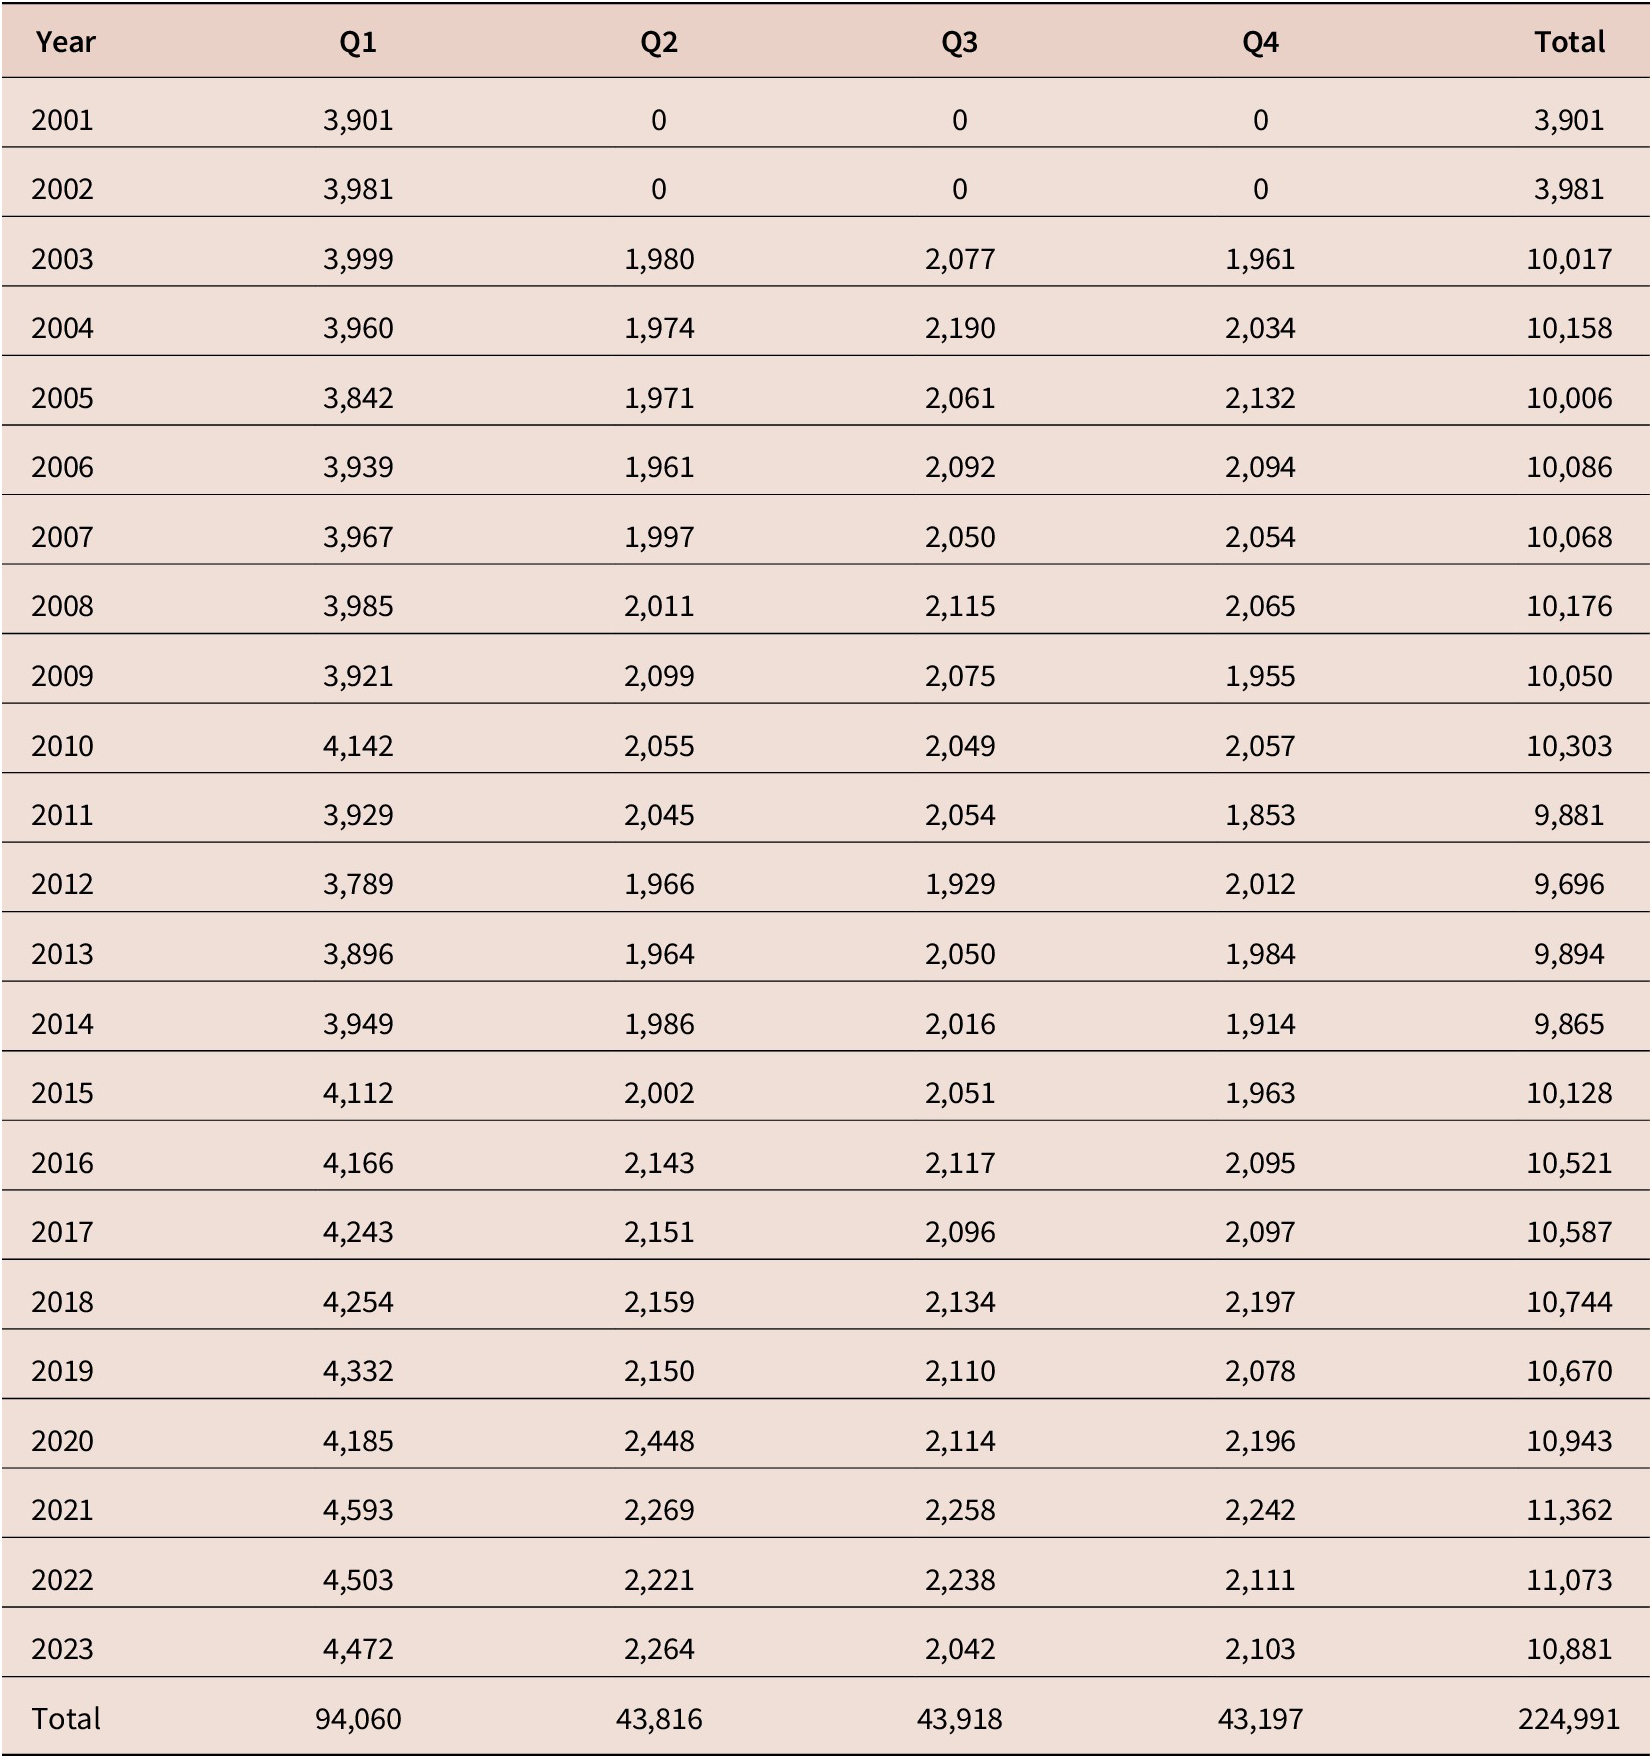
Appendix 1
Number of respondents per survey wave
Appendix 2. Variables constructed from the survey. Questions, answer options and coding
Variable Inflation perception
Variable knowledge
Variables age
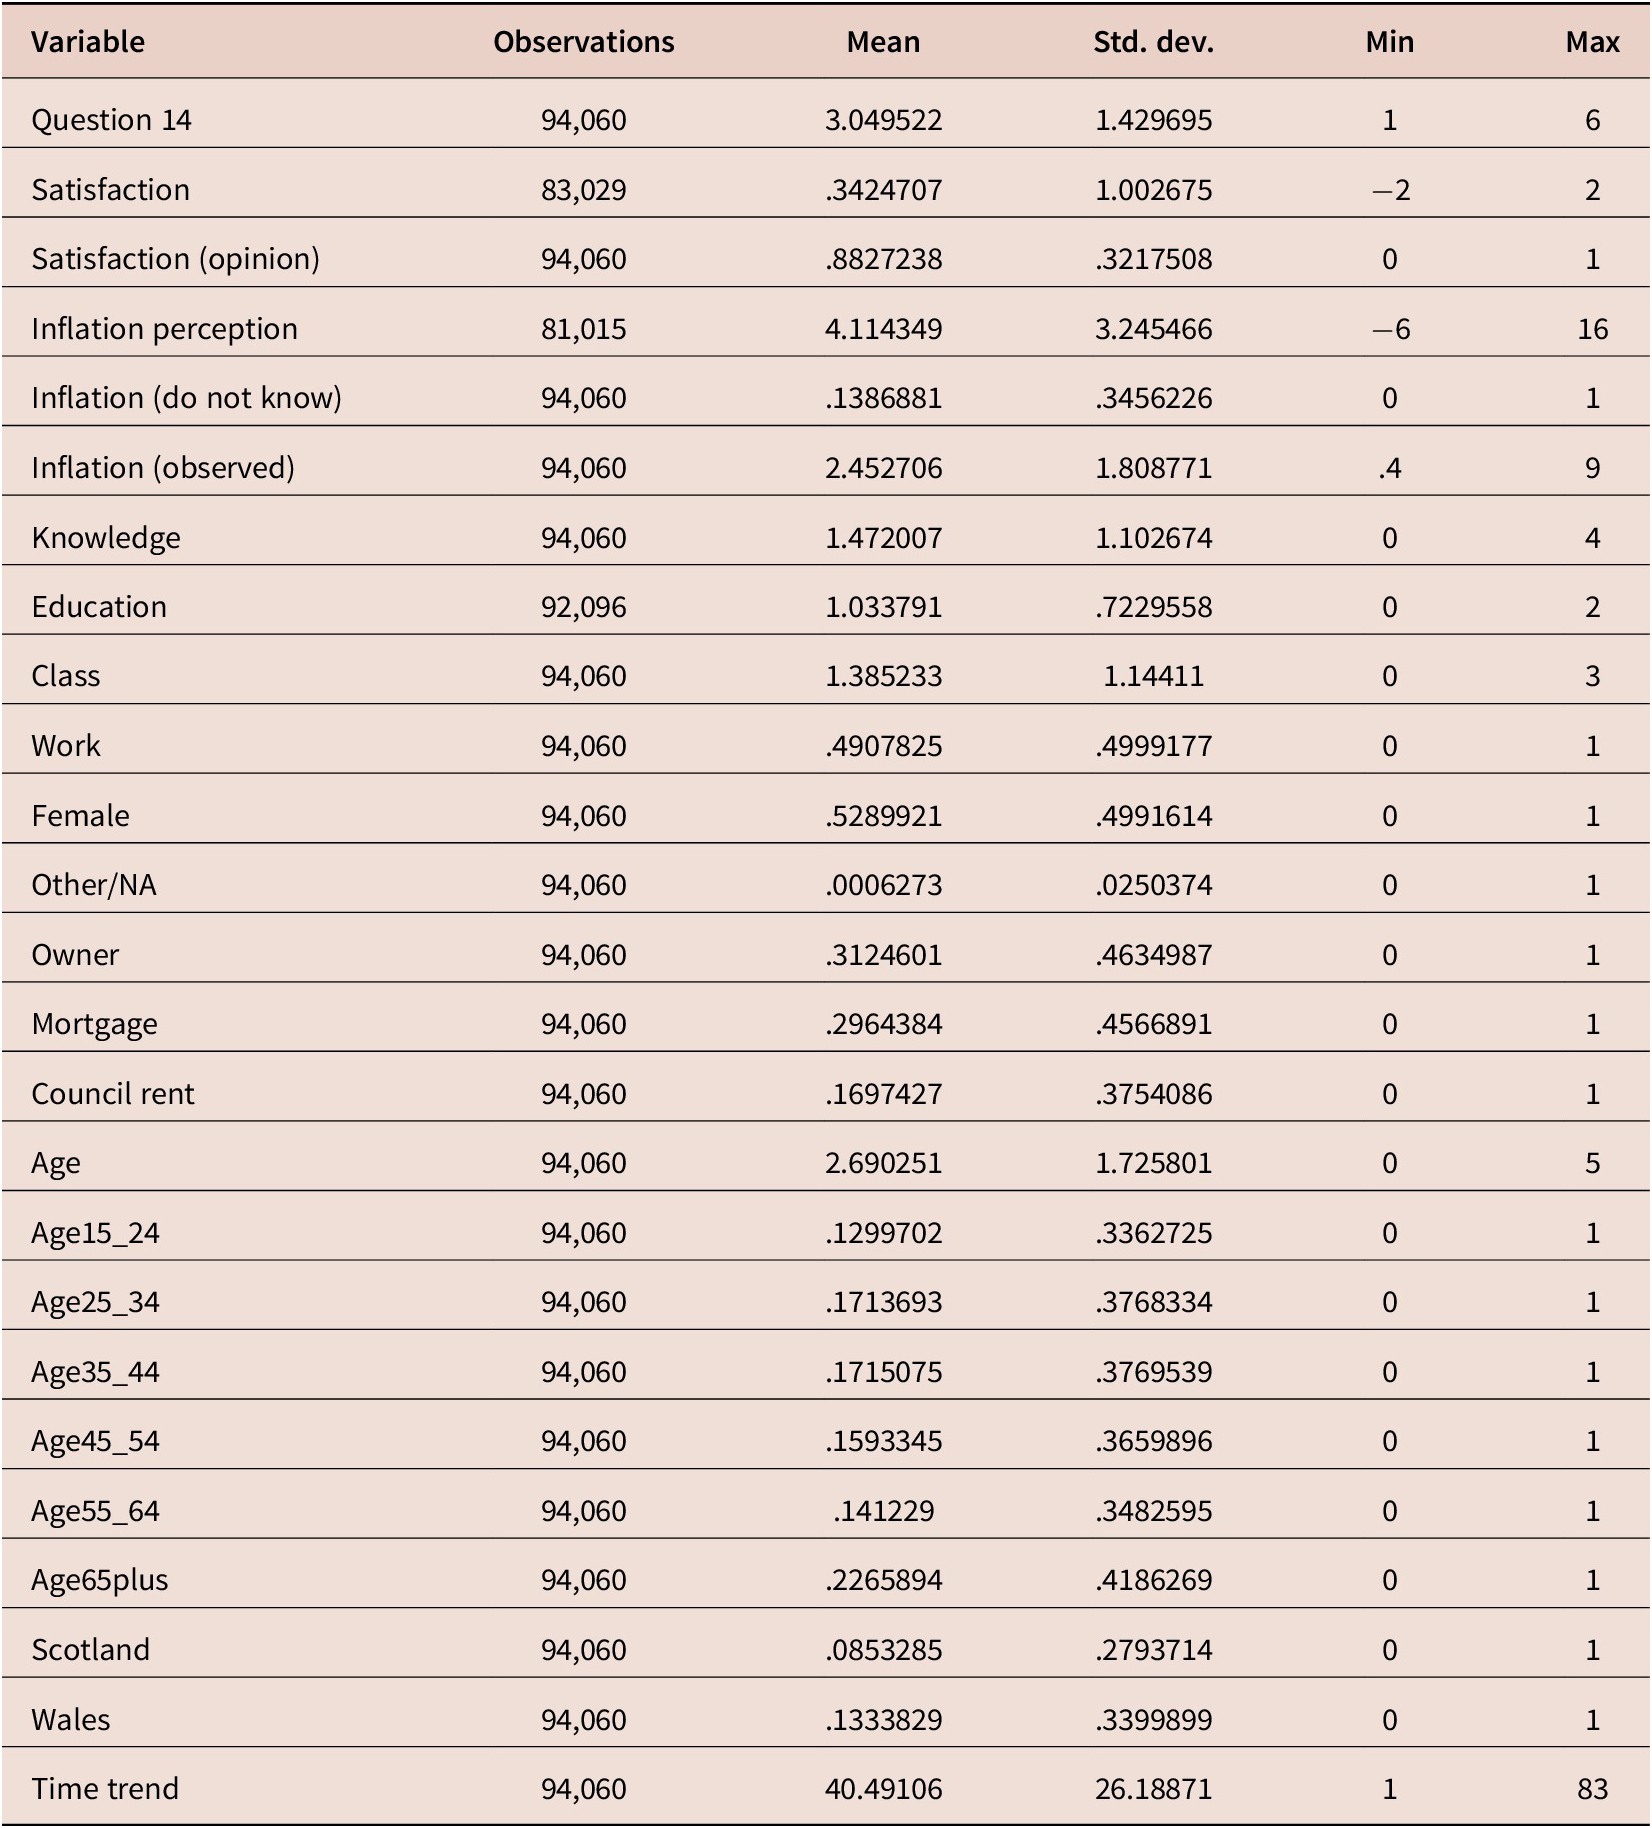
Appendix 3. Descriptive statistics
Descriptive statistics. Full sample
Descriptive statistics. First quarter only
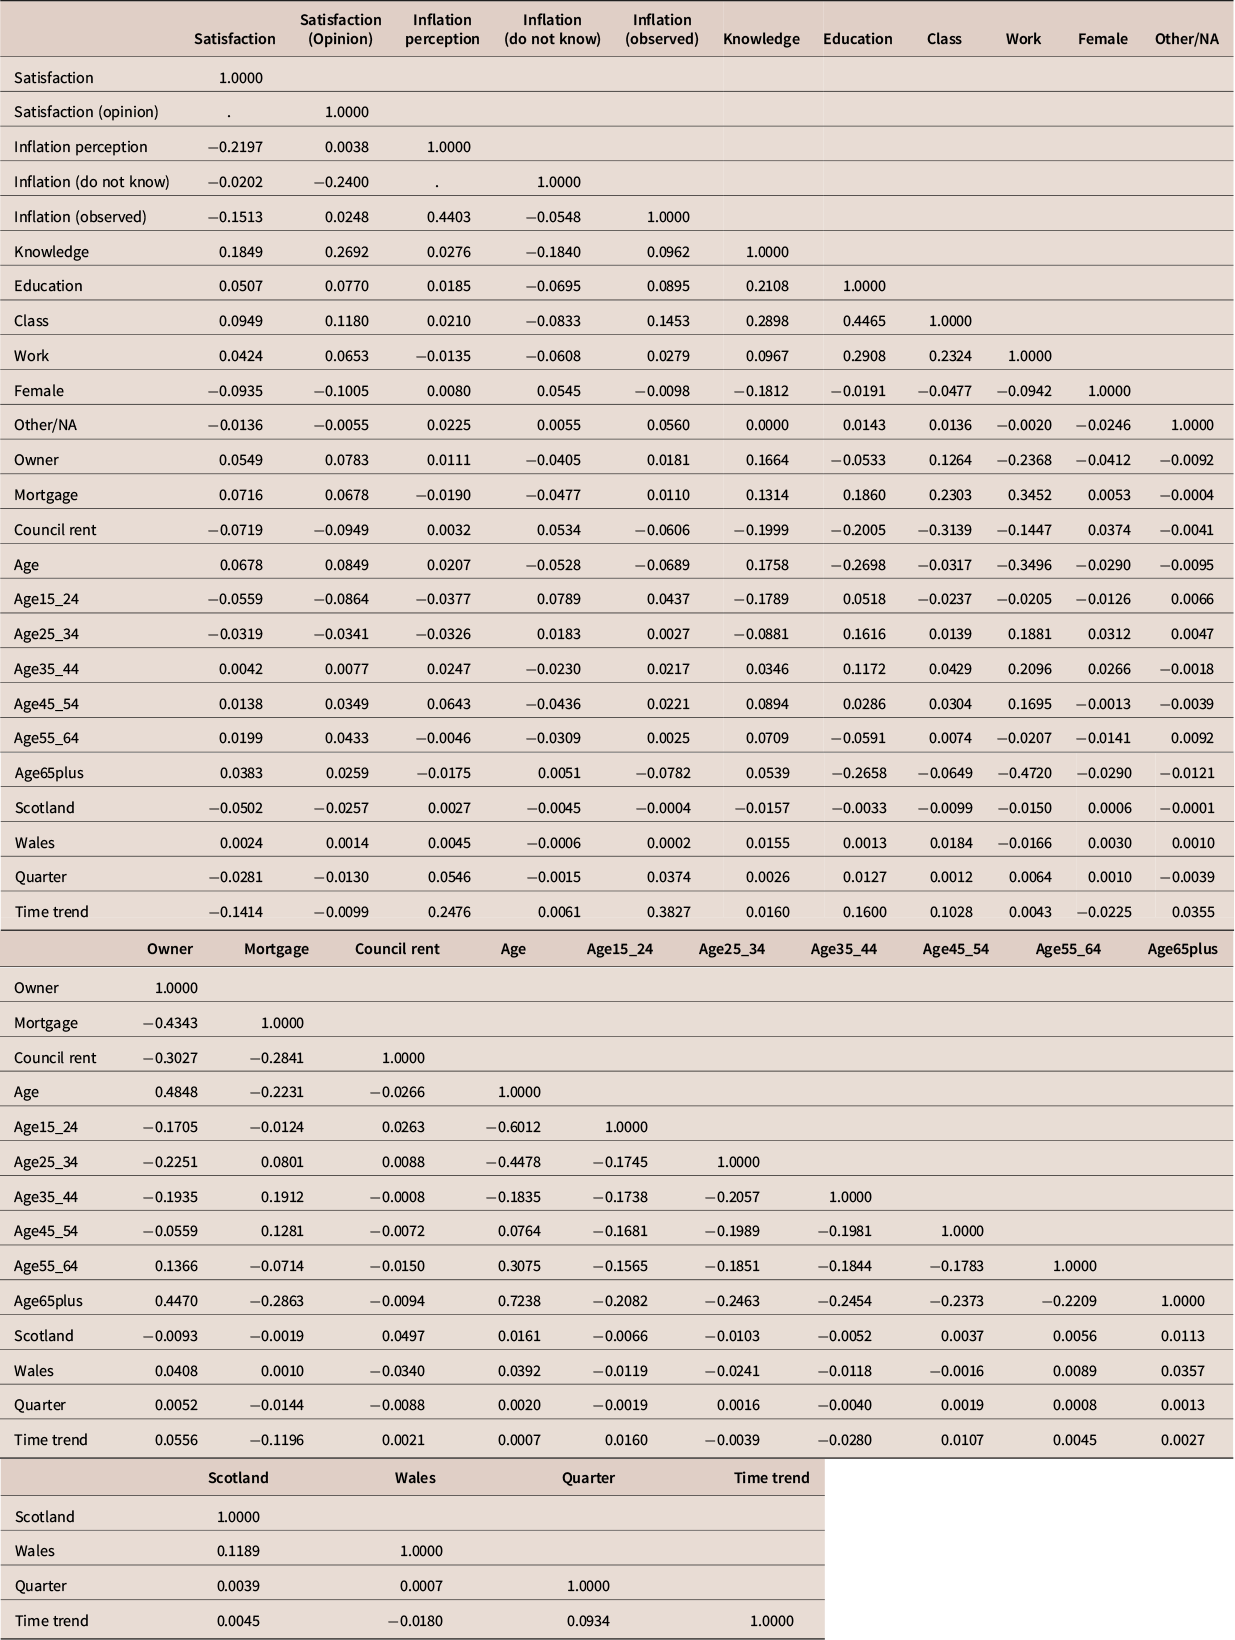
Correlation matrix
Appendix 4. Correlates of Satisfaction, by period
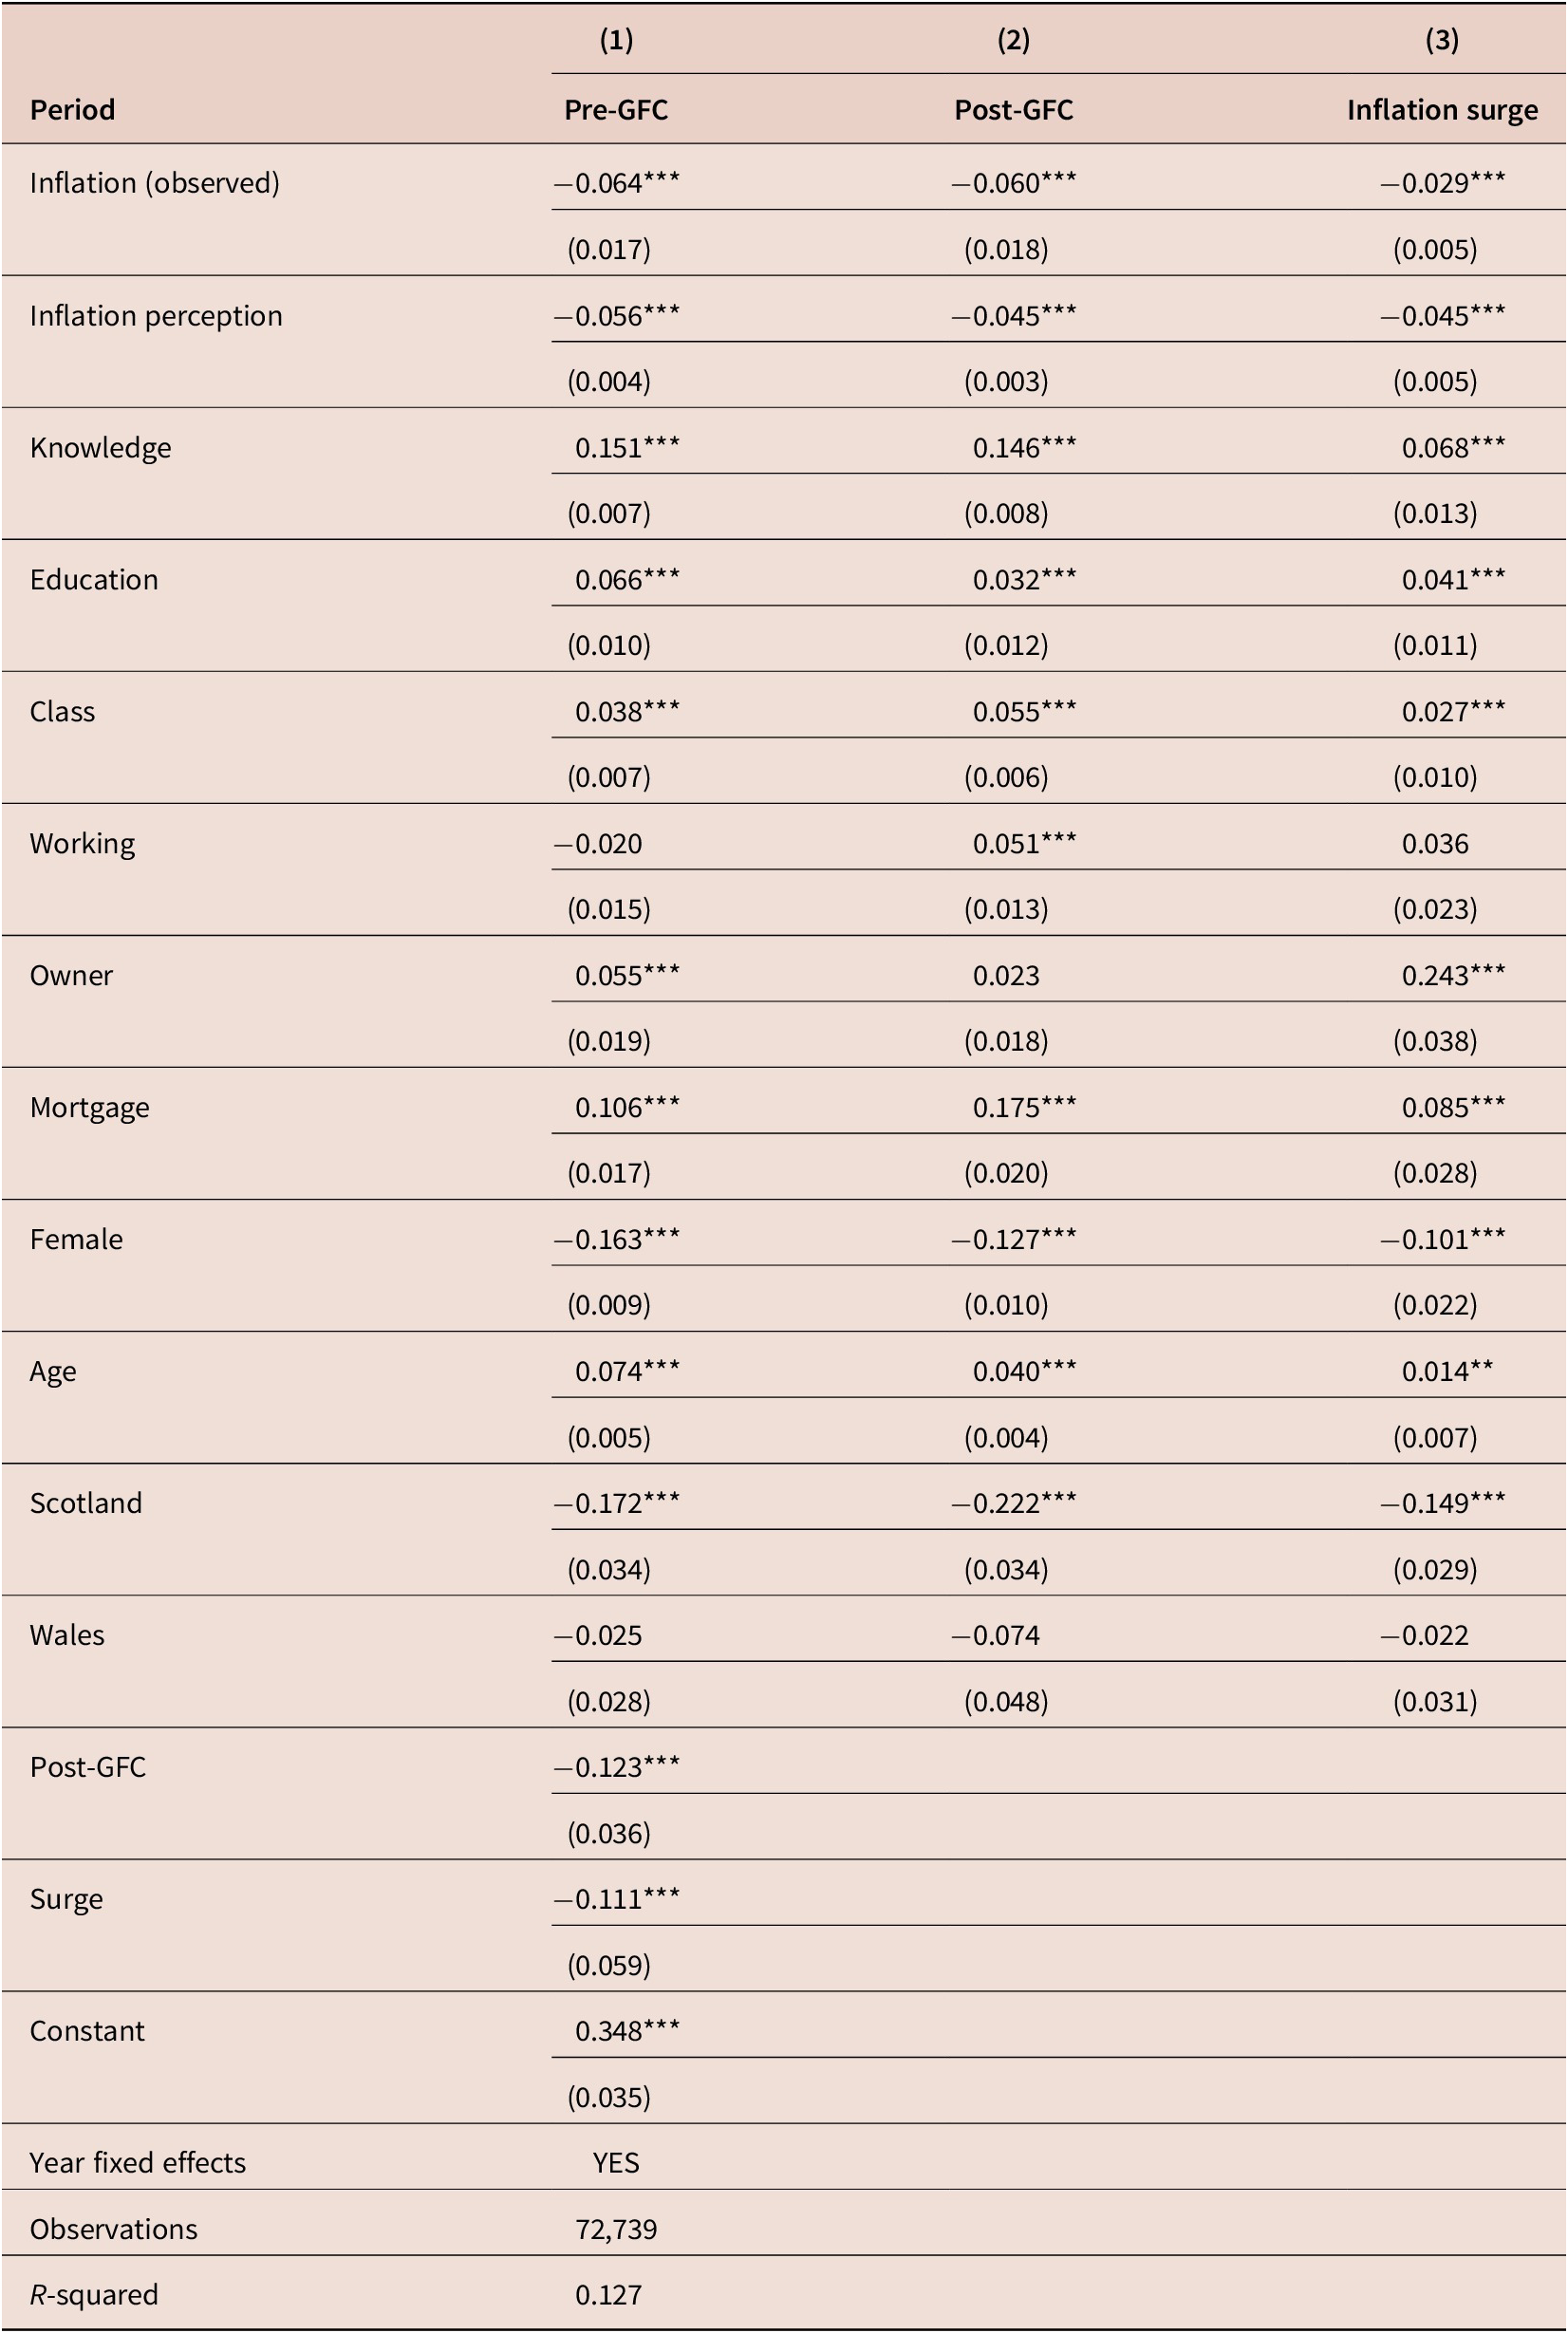
Notes: Columns (2) and (3) report the joint effect (lincom) of the variable coefficient and the interaction with the time period. Standard errors in parentheses *** p < 0.01, ** p < 0.05, * p < 0.1.


 Open access